Embed Size (px)
Citation preview

Cleveland State University (a component unit of the State of Ohio)
Financial Report with Supplemental Information
June 30, 2018
Contents
Independent Auditor’s Report 1-3
Management’s Discussion and Analysis - Unaudited 4-13
Basic Financial Statements
Statement of Net Position 14
Statement of Revenue, Expenses, and Changes in Net Position 15
Statement of Cash Flows 16
Statement of Financial Position (Component Units): The Cleveland State University Foundation, Inc. 17 Euclid Avenue Development Corporation 18
Statement of Activities (Component Units) The Cleveland State University Foundation, Inc. 19 Euclid Avenue Development Corporation 20
21-53Notes to Financial Statements
Required Supplemental Information 54-56

Independent Auditor's Report
To the Board of TrusteesCleveland State University
Report on the Financial Statements
We have audited the accompanying financial statements of Cleveland State University (the "University")and its discretely presented component units, The Cleveland State University Foundation, Inc. and EuclidAvenue Development Corporation, as of and for the years ended June 30, 2018 and 2017 and the relatednotes to the financial statements, which collectively comprise Cleveland State University's basic financialstatements, as listed in the table of contents. These financial statements are reported as a componentunit of the State of Ohio.
Management’s Responsibility for the Financial Statements
Management is responsible for the preparation and fair presentation of these financial statements inaccordance with accounting principles generally accepted in the United States of America; this includesthe design, implementation, and maintenance of internal control relevant to the preparation and fairpresentation of financial statements that are free from material misstatement, whether due to fraud orerror.
Auditor’s Responsibility
Our responsibility is to express an opinion on these financial statements based on our audits. We did notaudit the financial statements of The Cleveland State University Foundation, Inc. (the "Foundation") andEuclid Avenue Development Corporation (the "Corporation"), which represent all of the balances of theassets, net assets, and revenue of the discretely presented component units. Those financial statementswere audited by other auditors, whose report has been furnished to us, and our opinion, insofar as itrelates to the amounts included for the Foundation and Corporation, is based solely on the report of theother auditors. We conducted our audits in accordance with auditing standards generally accepted in theUnited States of America and the standards applicable to financial audits contained in Government AuditingStandards, issued by the Comptroller General of the United States. Those standards require that we planand perform the audit to obtain reasonable assurance about whether the financial statements are freefrom material misstatement.
An audit involves performing procedures to obtain audit evidence about the amounts and disclosures inthe financial statements. The procedures selected depend on the auditor’s judgment, including theassessment of the risks of material misstatement of the financial statements, whether due to fraud orerror. In making those risk assessments, the auditor considers internal control relevant to the entity’spreparation and fair presentation of the financial statements in order to design audit procedures that areappropriate in the circumstances, but not for the purpose of expressing an opinion on the effectivenessof the entity’s internal control. Accordingly, we express no such opinion. An audit also includes evaluatingthe appropriateness of accounting policies used and the reasonableness of significant accountingestimates made by management, as well as evaluating the overall presentation of the financial statements.
We believe that the audit evidence we have obtained is sufficient and appropriate to provide a basis forour audit opinions.
1
To the Board of TrusteesCleveland State University
Opinions
In our opinion, based on our audit and the report of other auditors, the financial statements referred toabove present fairly, in all material respects, the financial position of Cleveland State University and itsdiscretely presented component units as of June 30, 2018 and 2017 and the changes in its financialposition and, where applicable, its cash flows for the years then ended in accordance with accountingprinciples generally accepted in the United States of America.
Emphasis of Matter
As described in Notes 1 and 8 to the basic financial statements, the University adopted the provisions ofGASB 75, Accounting and Financial Reporting for Postemployment Benefits Other than Pensions, as of July 1,2017. Our opinion is not modified with respect to this matter.
Other Matters
Required Supplemental Information
Accounting principles generally accepted in the United States of America require that the management'sdiscussion and analysis, the schedule of the University's proportionate share of the net pension liability,the schedule of the University's contributions, the schedule of the University's proportionate share of thenet OPEB liability, and the schedule of the University's OPEB contributions be presented to supplementthe basic financial statements. Such information, although not a part of the basic financial statements, isrequired by the Governmental Accounting Standards Board, which considers it to be an essential part offinancial reporting for placing the basic financial statements in an appropriate operational, economic, orhistorical context. We have applied certain limited procedures to the required supplemental informationin accordance with auditing standards generally accepted in the United States of America, whichconsisted of inquiries of management about the methods of preparing the information and comparing theinformation for consistency with management's responses to our inquiries, the basic financial statements,and other knowledge we obtained during our audit of the basic financial statements. We do not expressan opinion or provide any assurance on the information because the limited procedures do not provideus with sufficient evidence to express an opinion or provide any assurance.
Other Information
Our audit was conducted for the purpose of forming opinions on the financial statements that collectivelycomprise Cleveland State University's basic financial statements. The schedule of expenditures of federalawards is presented for the purpose of additional analysis as required by Title 2 U.S. Code of FederalRegulations Part 200, Uniform Administrative Requirements, Cost Principles, and Audit Requirements forFederal Awards (the "Uniform Guidance"), and is not a required part of the basic financial statements.
The schedule of expenditures of federal awards is the responsibility of management and was derivedfrom and relates directly to the underlying accounting and other records used to prepare the basicfinancial statements. Such information has been subjected to the auditing procedures applied in the auditof the basic financial statements and certain additional procedures, including comparing and reconcilingsuch information directly to the underlying accounting and other records used to prepare the basicfinancial statements or to the basic financial statements themselves, and other additional procedures inaccordance with auditing standards generally accepted in the United States of America. In our opinion,the schedule of expenditures of federal awards is fairly stated in all material respects in relation to thebasic financial statements as a whole.
2

To the Board of TrusteesCleveland State University
Other Reporting Required by Government Auditing Standards
In accordance with Government Auditing Standards, we have also issued our report dated October 12,2018 on our consideration of Cleveland State University's internal control over financial reporting and onour tests of its compliance with certain provisions of laws, regulations, contracts, grant agreements, andother matters. The purpose of that report is to describe the scope of our testing of internal control overfinancial reporting and compliance and the results of that testing, and not to provide an opinion on theinternal control over financial reporting or on compliance. That report is an integral part of an auditperformed in accordance with Government Auditing Standards in considering Cleveland State University'sinternal control over financial reporting and compliance.
October 12, 2018
3

See Notes to Financial Statements. 4
Management’s Discussion and Analysis - Unaudited
Introduction The following discussion and analysis provides an overview of the financial position and activities of Cleveland State University (the “University”) as of and for the year ended June 30, 2018. This discussion has been prepared by management and should be read in conjunction with the financial statements and the notes thereto, which follow this section. The University was established in 1964 by action of the Ohio General Assembly and is part of the State of Ohio’s (the “State”) system of State-supported and State-assisted institutions of higher education. It is one of the 13 State universities in Ohio. By statute, it is a body politic and corporate and an instrumentality of the State. Located in the city of Cleveland, the University is an urban institution. A majority of the University’s students commute daily from their homes in the Cleveland metropolitan area. Using the Annual Financial Report The University’s financial report includes financial statements prepared in accordance with Governmental Accounting Standards Board (GASB) Statement No. 35, Basic Financial Statements - and Management’s Discussion and Analysis - for Public Colleges and Universities. These principles require that financial statements be presented on a consolidated basis to focus on the financial condition, the changes in financial condition, and the cash flows of the University as a whole. Many other nonfinancial factors also must be considered in assessing the overall health of the University, such as enrollment trends, student retention, strength of the faculty, condition of the buildings, and the safety of the campus. The financial statements prescribed by GASB Statement No. 35 (the Statement of Net Position, the Statement of Revenue, Expenses and Changes in Net Position, and the Statement of Cash Flows) present financial information in a form similar to that used by corporations. They are prepared under the accrual basis of accounting, whereby revenue and assets are recognized when the service is provided and expenses and liabilities are recognized when others provide the service, regardless of when cash is exchanged. Under the provisions of GASB Statement No. 61, Determining Whether Certain Organizations are Component Units, the Cleveland State University Foundation, Inc. (the “Foundation”) and the Euclid Avenue Development Corporation (the “Corporation”) are treated as component units of the University. Accordingly, the Foundation and the Corporation are discretely presented in the University’s financial statements. The Foundation and the Corporation are excluded from the management’s discussion and analysis. Financial statements for the Foundation can be obtained from the Office of the Executive Director at 2121 Euclid Avenue, Union Building Room 501, Cleveland, OH 44115-2214; financial statements for the Corporation can be obtained from the Office of the Senior Vice President for Business Affairs and Finance at 2300 Euclid Avenue, Administration Center Room 210, Cleveland, OH 44115-2214.

See Notes to Financial Statements. 5
Management’s Discussion and Analysis - Unaudited (Continued)
Financial Highlights The University’s financial position remained strong with assets of $691.2 million, deferred outflows of $56.2 million, liabilities of $505.7 million and deferred inflows of $28.1 million at June 30, 2018. Net position, which represents the residual interest in the University’s assets and deferred outflow of resources after liabilities and deferred inflows of resources are deducted, totaled $213.5 million, after the implementation of GASB Statement No. 75 on July 1, 2017 and the implementation of GASB Statement No. 68 on July 1, 2014. Statement of Net Position The statement of net position presents the financial position of the University at the end of the fiscal year and includes all assets and liabilities. The difference between assets and deferred outflows and liabilities and deferred inflows - net position - is one indicator of the current financial condition of the University, while the change in net position is an indicator of whether the overall financial condition has improved or worsened during the year. Assets, deferred outflows, liabilities, and deferred inflows are generally measured using current values. One notable exception is capital assets, which are stated at historical cost less an allowance for depreciation. A summary of the University’s assets, liabilities, and net assets at June 30, 2018, 2017, and 2016 is as follows:
In accordance with the University’s implementation of GASB Statement No. 68 and GASB Statement No. 75, deferred outflow of resources has been recorded. “Deferred outflow of resources” is defined as the consumption of net assets applicable to a future reporting period. The deferred outflows have a positive effect on net position similar to assets. The University’s deferred outflows in 2018 decreased from 2017 by $7.1 million, or 11.2%, primarily due to the implementation of GASB Statement No. 75 and changes in assumptions related to GASB Statement No. 68. The University’s deferred outflows in 2017 increased from 2016 by $23.4 million, or 58.6%, primarily due to changes in assumptions and differences between expected and actual earnings on plan investments. Current assets consist primarily of cash, short-term investments, accounts and notes receivable, prepaid expenses, and inventories. Current liabilities consist primarily of accounts payable, accrued payroll and other liabilities, unearned revenue, and the current portion of long-term debt. Current assets increased in 2018 from 2017 and in 2017 from 2016, primarily due to an increase in short-term investments.
2018 2017 2016
Current assets 179,117,948$ 160,728,479$ 148,012,905$ Noncurrent assets:
Capital assets, net 497,104,489 487,778,055 493,170,085 Other 14,966,306 36,099,931 53,059,119
Deferred outflows 56,156,612 63,269,112 39,897,403
Total assets and deferred outflows 747,345,355 747,875,577 734,139,512
Current liabilities 42,946,226 46,451,288 52,969,359 Noncurrent liabilities 462,731,299 493,648,140 455,777,004
Deferred inflows 28,123,522 826,155 11,391,130
Total liabilities and deferred inflows 533,801,047 540,925,583 520,137,493
Net position 213,544,308$ 206,949,994$ 214,002,019$
See Notes to Financial Statements. 6
Management’s Discussion and Analysis - Unaudited (Continued)
Net capital assets increased in 2018 from 2017 by $9.2 million, or 1.9% and decreased in 2017 from 2016 by $5.4 million, or 1.1%. The increase in 2018 is primarily due to the Washkewicz College of Engineering renovation. The decrease in 2017 is attributable to retirement of assets, including demolishing a building, and depreciation. Other assets decreased in 2018 from 2017 by $21.1, or 58.5%, and in 2017 from 2016 by $17.0 million, or 32.0%, primarily due to the spending of restricted investments (bond proceeds) and a decrease in long-term endowment investments. In conjunction with the University’s implementation of GASB Statement No. 68 and GASB Statement No. 75, deferred inflows of resources have been recorded. “Deferred inflows of resources” is defined as the current acquisition of net assets that is applicable to a future period. The deferred inflows have a negative effect on net position similar to liabilities. The University’s deferred inflows in 2018 increased from 2017 by $27.3 million, or 3,304.1%, primarily due to the implementation of GASB Statement No. 75 and the difference between expected and actual experience and projected and actual earnings on the OPERS and STRS Pension Plans. The deferred inflows in 2017 decreased from 2016 by $10.6 million, or 92.8%, primarily due to the differences between expected and actual experience and projected and actual earnings. Liabilities decreased in 2018 from 2017 by $33.9 million, or 6.3%, primarily due to the decrease in net pension liability in conjunction with GASB 68, and increased in 2017 from 2016 by $31.4 million, or 6.2%, primarily due to the increase in net pension liability in conjunction with GASB Statement No. 68. Capital and Debt Activities One critical factor affecting the quality of the University’s programs is the development and renewal of its capital assets. Capital additions totaled $37.8 million in 2018, $26.1 million in 2017, and $21.2 million in 2016. Capital additions and retirements for 2018, 2017, and 2016 exclude transfers from construction in progress to buildings in the amount of $24.6 million in 2018, $6.4 million in 2017 and $56.6 million in 2016. Capital retirements totaled $1.9 million in 2018, $39.7 million in 2017, and $4.9 million in 2016. Capital retirements in 2017 include disposal of fully depreciated library periodicals and electronic subscriptions. Capital additions include construction of new facilities, repair and renovation of existing facilities, and acquisition of equipment and library books. Capital asset additions are funded, in part, by capital appropriations from the State. These appropriations amounted to $20.9 million in 2018, $7.4 million in 2017, and $0.58 million in 2016. In February 2016, the University issued $32,475,000 of general receipts bonds, Series 2016A. The bonds bear interest rates ranging from 3.0% to 5.0% and mature beginning June 1, 2016 through June 1, 2036. The proceeds of the issuance were used to defease a portion of the Series 2007A bonds and pay issuance costs. The purpose of this transaction was to refund future callable maturities to achieve debt service savings of approximately $3,900,000 over the life of the bonds.
See Notes to Financial Statements. 7
Management’s Discussion and Analysis - Unaudited (Continued)
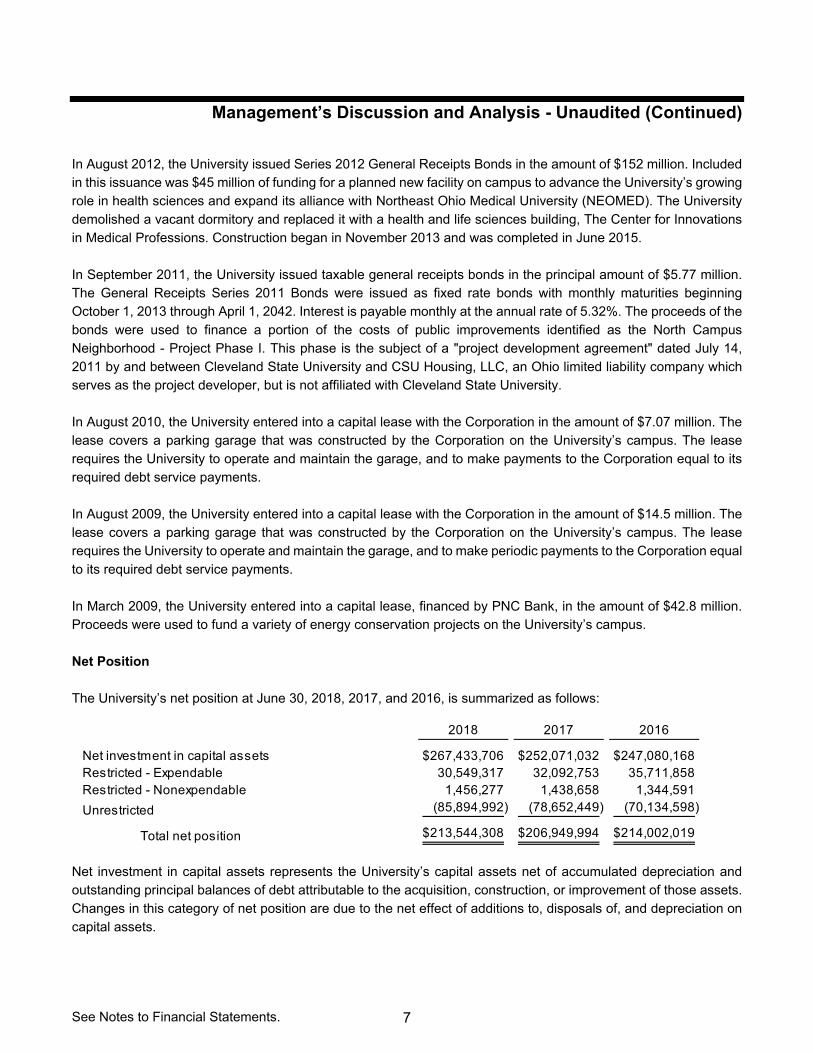
In August 2012, the University issued Series 2012 General Receipts Bonds in the amount of $152 million. Included in this issuance was $45 million of funding for a planned new facility on campus to advance the University’s growing role in health sciences and expand its alliance with Northeast Ohio Medical University (NEOMED). The University demolished a vacant dormitory and replaced it with a health and life sciences building, The Center for Innovations in Medical Professions. Construction began in November 2013 and was completed in June 2015. In September 2011, the University issued taxable general receipts bonds in the principal amount of $5.77 million. The General Receipts Series 2011 Bonds were issued as fixed rate bonds with monthly maturities beginning October 1, 2013 through April 1, 2042. Interest is payable monthly at the annual rate of 5.32%. The proceeds of the bonds were used to finance a portion of the costs of public improvements identified as the North Campus Neighborhood - Project Phase I. This phase is the subject of a "project development agreement" dated July 14, 2011 by and between Cleveland State University and CSU Housing, LLC, an Ohio limited liability company which serves as the project developer, but is not affiliated with Cleveland State University. In August 2010, the University entered into a capital lease with the Corporation in the amount of $7.07 million. The lease covers a parking garage that was constructed by the Corporation on the University’s campus. The lease requires the University to operate and maintain the garage, and to make payments to the Corporation equal to its required debt service payments. In August 2009, the University entered into a capital lease with the Corporation in the amount of $14.5 million. The lease covers a parking garage that was constructed by the Corporation on the University’s campus. The lease requires the University to operate and maintain the garage, and to make periodic payments to the Corporation equal to its required debt service payments. In March 2009, the University entered into a capital lease, financed by PNC Bank, in the amount of $42.8 million. Proceeds were used to fund a variety of energy conservation projects on the University’s campus. Net Position The University’s net position at June 30, 2018, 2017, and 2016, is summarized as follows:
Net investment in capital assets represents the University’s capital assets net of accumulated depreciation and outstanding principal balances of debt attributable to the acquisition, construction, or improvement of those assets. Changes in this category of net position are due to the net effect of additions to, disposals of, and depreciation on capital assets.
2018 2017 2016
Net investment in capital assets 267,433,706$ 252,071,032$ 247,080,168$ Restricted - Expendable 30,549,317 32,092,753 35,711,858 Restricted - Nonexpendable 1,456,277 1,438,658 1,344,591
Unrestricted (85,894,992) (78,652,449) (70,134,598)
Total net position 213,544,308$ 206,949,994$ 214,002,019$

See Notes to Financial Statements. 8
Management’s Discussion and Analysis - Unaudited (Continued)
Restricted expendable net position is subject to externally imposed restrictions governing their use. Changes in this category are customarily due to the timing of revenue and expenses in funds provided by donors and grantors and in 2018, the change is due to use of restricted donations in capital building projects. Restricted nonexpendable net position consists primarily of endowment funds held by the University. Changes in this category are driven primarily by investment performance. Unrestricted net position is not subject to externally imposed stipulations. This category includes funds functioning as endowment (quasi-endowment) of $6.0 million at June 30, 2018, $5.8 million at June 30, 2017, and $5.5 million at June 30, 2016.
For the year ended June 30, 2018, the University had an increase in total net position of $6.6 million or 3.2%. Net investment in capital assets increased by $15.4 million or 6.1% because capital additions exceeded depreciation and deductions. Unrestricted net position decreased by $7.2 million or 9.2% primarily because the favorable change in net pension liability was offset by the OPEB liability related to implementation of GASB Statement No. 75. For the year ended June 30, 2017, the University had a decrease in total net position of $7.1 million or 3.3%. Net investment in capital assets increased by $5.0 million or 2.0% because capital additions exceeded depreciation and deductions. Unrestricted net position decreased by $8.5 million or 12.1% primarily because the positive investment returns were offset by the increase in pension expense related to GASB Statement No. 68.

See Notes to Financial Statements. 9
Management’s Discussion and Analysis - Unaudited (Continued)
Statement of Revenue, Expenses, and Changes in Net Position The statement of revenue, expenses, and changes in net position presents the revenue earned and expenses incurred during the year. Activities are reported as either operating or nonoperating. As a public institution, the University is dependent on State assistance. This dependency contributed toward an operating deficit because the financial reporting model classifies State appropriations as nonoperating revenue. The utilization of capital assets is reflected in the financial statements as depreciation, which amortizes the cost of an asset over its expected useful life. Summarized revenue, expenses, and changes in net assets for the years ended June 30, 2018, June 30, 2017, and June 30, 2016 are as follows:
Total revenue and other changes, net of interest on debt, in fiscal 2018, 2017, and 2016 were $344.4, $339.9, and $317.4 million, respectively. The most significant sources of 2018 operating revenue for the University, as reflected in the statement of revenues, expenses, and changes in net position, were student tuition and fees of $146.3 million, grants and contracts of $18.7 million, and auxiliary services of $25.5 million. Revenue from tuition and fees (net of scholarship allowances) decreased in 2018 from 2017 by $7.9 million, or 5.4% due to no tuition increases, slightly lower student credit hours and an increase in scholarship allowances. Headcount enrollment decreased by 1.72% while full-time equivalent enrollment decreased by 0.75% over the prior year. Revenue from tuition and fees (net of scholarship allowances) increased slightly in 2017 from 2016 by $1.5 million, or 1.0%, due to tuition increases in certain graduate programs. Headcount enrollment decreased by 2.5% while full-time equivalent enrollment decreased by 0.5% over the prior year.
2018 2017 2016
Operating revenue: Net student tuition and fees 146,339,500$ 154,187,752$ 152,650,587$ Grants and contracts 18,743,925 16,113,107 15,894,376 Other 34,361,502 34,178,337 41,003,916
Total operating revenue 199,444,927 204,479,196 209,548,879
Operating expenses:Educational and general 202,853,279 269,515,958 252,176,005 Auxiliary enterprises 30,188,987 40,689,667 36,723,496 Depreciation and amortization 28,782,708 27,587,367 28,832,469
Total operating expenses 261,824,974 337,792,992 317,731,970
Operating loss (62,380,047) (133,313,796) (108,183,091)
Nonoperating revenue, net of interest: State appropriations 75,489,568 74,979,638 74,516,410 Other 39,368,820 43,907,936 23,652,389
Gain (loss) before other changes 52,478,341 (14,426,222) (10,014,292)
Other changes 20,926,089 7,374,197 580,544
Increase (Decrease) in net assets 73,404,430 (7,052,025) (9,433,748)
Net position - Beginning of year 206,949,994 214,002,019 223,435,767 Adjustment for change in accounting principle (66,810,116) - - Net position - Beginning of year (as restated*) 140,139,878 - -
Net position - End of year213,544,308$ 206,949,994$ 214,002,019$
*Restated per implementation of GASB Statement No. 75
See Notes to Financial Statements. 10
Management’s Discussion and Analysis - Unaudited (Continued)
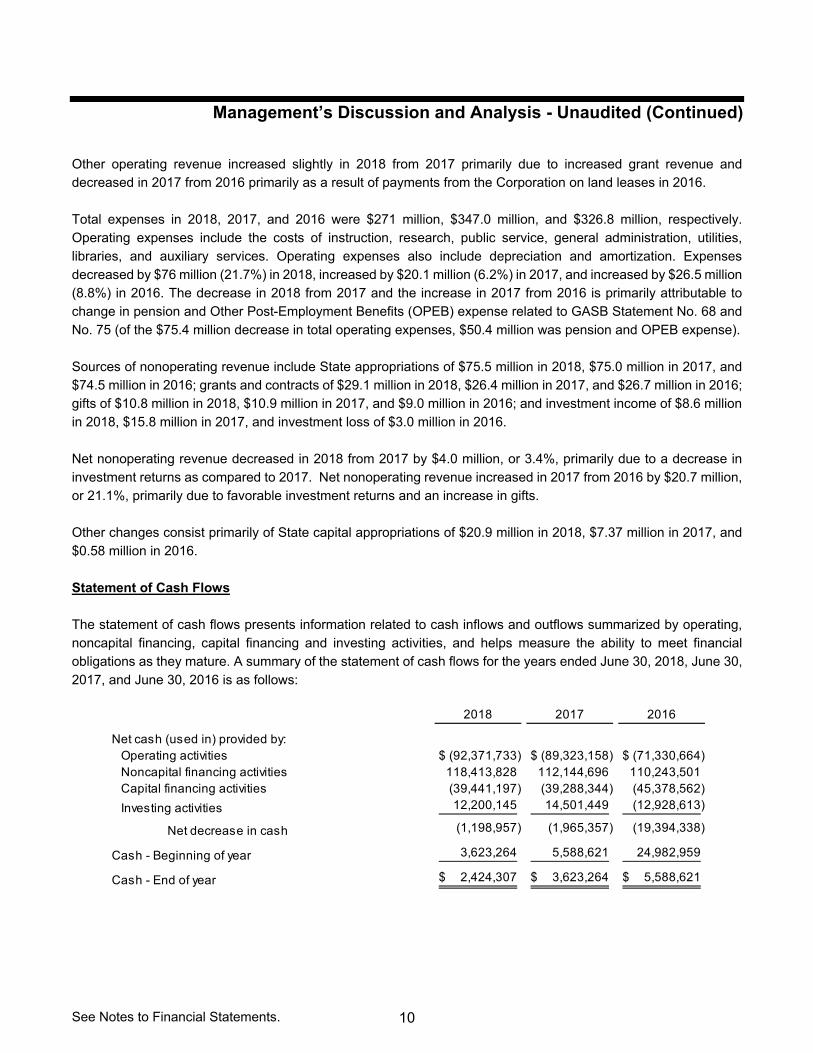
Other operating revenue increased slightly in 2018 from 2017 primarily due to increased grant revenue and decreased in 2017 from 2016 primarily as a result of payments from the Corporation on land leases in 2016. Total expenses in 2018, 2017, and 2016 were $271 million, $347.0 million, and $326.8 million, respectively. Operating expenses include the costs of instruction, research, public service, general administration, utilities, libraries, and auxiliary services. Operating expenses also include depreciation and amortization. Expenses decreased by $76 million (21.7%) in 2018, increased by $20.1 million (6.2%) in 2017, and increased by $26.5 million (8.8%) in 2016. The decrease in 2018 from 2017 and the increase in 2017 from 2016 is primarily attributable to change in pension and Other Post-Employment Benefits (OPEB) expense related to GASB Statement No. 68 and No. 75 (of the $75.4 million decrease in total operating expenses, $50.4 million was pension and OPEB expense). Sources of nonoperating revenue include State appropriations of $75.5 million in 2018, $75.0 million in 2017, and $74.5 million in 2016; grants and contracts of $29.1 million in 2018, $26.4 million in 2017, and $26.7 million in 2016; gifts of $10.8 million in 2018, $10.9 million in 2017, and $9.0 million in 2016; and investment income of $8.6 million in 2018, $15.8 million in 2017, and investment loss of $3.0 million in 2016. Net nonoperating revenue decreased in 2018 from 2017 by $4.0 million, or 3.4%, primarily due to a decrease in investment returns as compared to 2017. Net nonoperating revenue increased in 2017 from 2016 by $20.7 million, or 21.1%, primarily due to favorable investment returns and an increase in gifts. Other changes consist primarily of State capital appropriations of $20.9 million in 2018, $7.37 million in 2017, and $0.58 million in 2016. Statement of Cash Flows The statement of cash flows presents information related to cash inflows and outflows summarized by operating, noncapital financing, capital financing and investing activities, and helps measure the ability to meet financial obligations as they mature. A summary of the statement of cash flows for the years ended June 30, 2018, June 30, 2017, and June 30, 2016 is as follows:
2018 2017 2016
Net cash (used in) provided by:Operating activities (92,371,733)$ (89,323,158)$ (71,330,664)$ Noncapital financing activities 118,413,828 112,144,696 110,243,501 Capital financing activities (39,441,197) (39,288,344) (45,378,562)
Investing activities 12,200,145 14,501,449 (12,928,613)
Net decrease in cash (1,198,957) (1,965,357) (19,394,338)
Cash - Beginning of year 3,623,264 5,588,621 24,982,959
Cash - End of year 2,424,307$ 3,623,264$ 5,588,621$
See Notes to Financial Statements. 11
Management’s Discussion and Analysis - Unaudited (Continued)
Major sources of cash included student tuition and fees of $147.6 million in 2018, $158.1 million in 2017, and $152.9 million in 2016; State appropriations of $75.5 million in 2018, $75.0 million in 2017, and $74.5 million in 2016; grants and contracts (operating and noncapital) of $44.3 million in 2018, $42.7 million in 2017, and $42.0 million in 2016; and auxiliary activities of $24.8 million in 2018, $27.1 million in 2017, and $25.5 million in 2016. The largest payments were for employee compensation and benefits totaling $192.2 million in 2018, $170.4 million in 2017, and $172.3 million in 2016; suppliers of goods and services totaling $98.4 million in 2018, $128.3 million in 2017, and $107.3 million in 2016; and purchases of capital assets totaling $38.1 million, $22.2 million in 2017, and $20.7 million in 2016. The change in cash flows from 2017 to 2018 is primarily due to timing of payments to vendors. The change in cash flows from 2016 to 2017 is primarily due to collection of accounts receivable and timing of payments to vendors. Credit Rating
The University’s bonds are rated “A+” stable by Standard & Poor’s, with the most recent rating published on July 20, 2018. An “A” rating indicates a strong capacity to meet financial commitments, but somewhat susceptible to adverse economic conditions and changes in circumstances. This rating is consistent with the years ended June 30, 2017 and 2016. The highest achievable rating is “AAA.” The University’s capacity to meet its financial obligations is considered strong. The University’s bonds are rated “A1” by Moody’s Investors Service, with the most recent rating published on January 8, 2016. Obligations rated “A” by Moody’s are judged to be upper-medium grade and are subject to low credit risk. The highest achievable rating is “AAA”. Looking Ahead The primary challenges facing Ohio’s four-year universities, including Cleveland State University (CSU), continue to be (1) maintaining the quality of academic instruction, (2) preserving enrollment and assisting students in degree completion, (3) growing revenue, and (4) controlling costs. The State of Ohio has made college efficiency and affordability cornerstones of both the current Governor’s policy initiatives and several pieces of legislation passed by the General Assembly over the previous 24 months. The state will continue to monitor progress on these initiatives through reporting by the state’s universities to the Department of Higher Education’s Efficiency Advisory Committee. As part of this process, each university was required to commit to a five-year efficiency goal for “re-deployable” savings to assist in lowering the cost of a degree. CSU’s five-year goal (fiscal year 2017 - fiscal year 2021) is $11.5 million. CSU is tracking ahead of these goals based on efficiencies for lowering the cost of a degree and cost reductions necessary to balance its operating budget. State universities have now completed five fiscal years operating under the state’s outcome-based funding formula model. This model places more emphasis on outcome-based metrics such as degree completion and course completion in allocating funding to universities as opposed to awarding funding based only on the number of students enrolled. Under the provisions of the State of Ohio’s fiscal year 2019 budget, CSU is expecting an allocation of $76.1 million in State Share of Instruction (SSI) funding, compared to the $75.5 million received in fiscal year 2018. This increase is partially due to improvements in the University performance metrics as outlined in the Ohio Department of Higher Education’s outcome-based funding model. The SSI is the major state funding source for state colleges and universities. CSU

See Notes to Financial Statements. 12
Management’s Discussion and Analysis - Unaudited (Continued)
expects to receive the same level of state funding in fiscal year 2020 as it expects to receive in fiscal year 2019, barring any fiscal challenges impacting the state’s revenue sources. Additionally, state policy on higher education and funding could be impacted as a result of the upcoming election for Governor in November 2018. A new administration will have the opportunity to introduce policy and funding changes in the upcoming state budget cycle for fiscal year 2020 – fiscal year 2021. Revenue from student instructional fee tuition is budgeted at $149.1 million in fiscal year 2019, compared to fiscal year 2018’s result of $146.3 million. For fiscal year 2019, CSU implemented a tuition guarantee program that increases undergraduate tuition by 6% for the first cohort. Under this plan, the University has been granted the authority to (1) establish annual “cohorts” of new undergraduate students; (2) establish tuition rates for each cohort under state guidelines; and (3) maintain each cohorts’ tuition rate for a period of four academic years. The University has continued its plan for qualifying existing undergraduate students to receive a rebate of any increase in tuition by showing progress toward a degree while remaining in academic good standing. The program, known as the Graduation Incentive Plan, commenced in fiscal year 2014 (Fall 2013), but did not require funding by the University until fiscal year 2015 (Fall 2014). Although no new students were admitted to the program after fiscal year 2015 (Fall 2016), we continue to offer it to students who began in fiscal year 2014 and 2015. Preliminary Fall 2018 (fiscal year 2019) credit hour enrollment is slightly below the budget plan, while instructional fee tuition revenue is meeting budget plan. Although there is likely to be the normal Fall-to-Spring semester attrition in enrollment, Spring 2019 tuition revenue is expected to be slightly lower than the Spring 2018 budget plan. As in prior years, the ability of the University to fulfill its mission and execute its strategic plan continues to be dependent upon student enrollment and tuition revenue. Meeting revenue goals will be more challenging in the near future, as the State of Ohio has frozen in-state undergraduate tuition levels for fiscal year 18 and fiscal year 19 at fiscal year 17 levels. The University expects this tuition freeze to remain in effect for fiscal year 2020 and fiscal year 2021. The University plans to mitigate the effect of the continuing in-state undergraduate tuition freeze by developing tuition-pricing strategies for certain graduate programs and the introduction of the tuition guarantee plan for undergraduate students. The University continues to pursue enrollment growth on a regional and international level to supplement continued success in growing freshmen enrollment statewide. At the same time, a major focus on retention that has substantially improved results in both retention and graduation rates, continues. New majors in high-demand healthcare professions are positioned for strong enrollment growth in the next 5 years. The latest Fall to Fall retention rate (Fall 2017 to Fall 2018) is 71.5% up from 69.7% four years ago. Tactics include an automated early warning system, intrusive advising of freshmen, and better employment of residence life and student affairs data to track students’ academic performance. The University is also affected by decisions at the state level regarding capital funding through the biennial capital appropriations bill. Cleveland State University received a total allocation of $22.1 million for the fiscal year 2017 - fiscal year 2018 state capital biennium. $14.6 million of the allocation was dedicated to the Fenn Hall Washkewicz College of Engineering building project and $7.5 million for the development of a School of Film located at CSU. In April 2018, the State of Ohio passed a fiscal year 2019 - fiscal year 2020 capital appropriations bill. The University expects to receive $15.4 million for the fiscal year 2019 – fiscal year 2020 biennium. $7.3 million of the allocation is dedicated to Phase II of the Engaged Learning Laboratories and the balance dedicated toward renovation and modernization of existing buildings.

See Notes to Financial Statements. 13
Management’s Discussion and Analysis - Unaudited (Continued)
In August 2015, the University created an Office of Performance Management and initiated its “Path to 2020” program. In April 2017, the Office of Performance Management became fully operational and reports to the President. The program is the University’s proactive response to the challenging environment being faced by publicly-funded higher education institutions, both in Ohio and nationally. It is also an opportunity for leveraging our strengths and improving our processes to thrive in the ensuing years. It assessed the University’s operations and practices in the areas of strategic enrollment management and revenue, expense management and budgeting, financial aid deployment, academic programming, and campus master planning strategies. By beginning these efforts in 2015, the University was well-positioned to respond appropriately and proactively in July 2016 to the recommendations of the Governor’s Task Force Report on College Affordability and Efficiency. The University also realized approximately $3.5 million in expense savings through this effort and reflected these savings by lowering the University’s fiscal year 2017 operating budget expenditure level. The performance management effort is a continuing initiative that has been integrated into the operations of the University. The University continues to face significant cost pressures in the future. The University has taken measures to address ongoing operating cost challenges, such as attracting and retaining high quality faculty and staff; increased costs of employee benefits; and energy costs. The University continually monitors its student enrollment, other revenue sources, fee structure, and operating expenditures of its units on a monthly basis. While predictions of a downturn in the number of traditional high school graduates applying to universities are beginning to actualize, Cleveland State University’s undergraduate enrollment for the near term is stable, although there are continuing challenges with the graduate environment. The continual monitoring of the University’s operations is meant to provide the administration with early signals and trends should changes in our operating and financial plans become necessary.

See Notes to Financial Statements. 14
Statement of Net Position June 30, 2018 and 2017
2018 2017
AssetsCurrent assets:
Cash and cash equivalents 2,424,307$ 3,623,264$ Investments (Note 2) 146,160,905 129,621,930 Accounts receivable, Net (Note 4) 26,863,160 24,404,474 Notes receivable, Net (Note 4) 1,433,765 1,326,625 Prepaid expenses and inventories 2,235,811 1,752,186
Total current assets 179,117,948 160,728,479
Noncurrent assets:Restricted investments (Note 2) - 1,974,145 Long-term and endowment investments (Note 2) 3,420,465 21,188,752 Notes receivable, Net (Note 4) 11,545,841 12,937,034 Capital assets, Net (Note 6) 497,104,489 487,778,055
Total noncurrent assets 512,070,795 523,877,986
Total assets691,188,743 684,606,465
Deferred OutflowsDeferred outflow - Pension plans (Note 8) 49,903,657 61,877,871 Deferred outflow - OPEB benefits (Note 8) 4,935,260 - Deferred outflow - Bond refunding (Note 7) 1,317,695 1,391,241
Total deferred outflows 56,156,612 63,269,112
LiabilitiesCurrent liabilities:
Accounts payable 5,206,348 6,480,888 Construction accounts payable 780,466 423,296 Accrued liabilities 12,299,041 13,927,995 Accrued interest payable 879,017 999,551 Unearned revenue 8,668,466 9,136,826 Compensated absences - Current portion (Note 7) 1,312,991 855,486 Obligations under capital leases - Current portion (Note 7) 6,191,297 7,333,646 Long-term debt - Current portion (Note 7) 7,608,600 7,293,600
Total current liabilities 42,946,226 46,451,288
Noncurrent liabilities: Accrued liabilities (Note 7) 11,367,311 11,661,732 Compensated absences (Note 7) 8,719,884 9,995,778 Net pension liability (Note 8) 178,351,808 259,576,938 Net OPEB liability (Note 8) 63,336,890 - Obligations under capital leases (Note 7) 29,589,611 33,365,751 Long-term debt (Note 7) 171,365,795 179,047,941
Total noncurrent liabilities 462,731,299 493,648,140
Total liabilities 505,677,525 540,099,428
Deferred InflowsDeferred inflow - Pension plan net amount (Note 8) 22,464,515 826,155 Deferred inflow - OPEB plan net amount (Note 8) 5,659,007 -
Total deferred inflows 28,123,522 826,155
Net PositionNet investment in capital assets 267,433,706 252,071,032 Restricted, expendable 30,549,317 32,092,753 Restricted, nonexpendable 1,456,277 1,438,658 Unrestricted (Deficit) (85,894,992) (78,652,449)
Total net position 213,544,308$ 206,949,994$

See Notes to Financial Statements. 15
Statement of Revenue, Expenses, and Changes in Net Position Years Ended June 30, 2018 and 2017
2018 2017
Revenue
Operating revenue:
Student tuition and fees 176,783,163$ 180,550,768$
Less scholarship allowances 30,443,663 26,363,016
Net student tuition and fees 146,339,500 154,187,752
Federal grants and contracts 7,836,318 7,653,153
State grants and contracts 4,603,097 2,554,565
Local grants and contracts 253,087 565,667
Private grants and contracts 6,051,423 5,339,722
Sales and services 7,073,061 6,651,349
Auxiliary enterprises 25,500,769 26,983,794
Other 1,787,672 543,194
Total operating revenue 199,444,927 204,479,196
Expenses
Operating expenses:
Instruction 86,722,914 115,812,827
Research 7,416,281 10,686,979
Public service 5,373,136 7,559,040
Academic support 22,661,380 31,809,392
Student services 15,187,001 21,320,575
Institutional support 24,774,446 33,737,433
Operation and maintenance of plant 22,920,510 31,379,263
Scholarships and fellowships 17,797,611 17,210,449
Auxiliary enterprises 30,188,987 40,689,667
Depreciation and amortization 28,782,708 27,587,367
Total operating expenses 261,824,974 337,792,992
Operating loss (62,380,047) (133,313,796)
Nonoperating Revenue (Expenses)
State appropriations 75,489,568 74,979,638
Federal grants and contracts 23,257,293 21,206,046
State grants and contracts 5,877,469 5,203,873
Gifts 10,799,332 10,859,670
Investment income 8,586,967 15,805,044
Interest on debt (9,152,241) (9,166,697)
Net nonoperating revenue 114,858,388 118,887,574
Increase (Decrease) before other changes 52,478,341 (14,426,222)
Other Changes
State capital appropriations 20,926,089 7,374,197
Increase (Decrease) in net position 73,404,430 (7,052,025)
Net Position
Net position - Beginning of year 206,949,994 214,002,019
Adjustment for change in accounting principle (Note 1) (66,810,116) -
Net position - Beginning of year as restated 140,139,878 -
Net position - End of year 213,544,308$ 206,949,994$

See Notes to Financial Statements. 16
Statement of Cash Flows Years Ended June 30, 2018 and 2017
2018 2017
Cash Flows from Operating ActivitiesTuition and fees 147,615,869$ 158,135,086$ Grants and contracts 15,157,984 16,323,561 Payments to or on behalf of employees (192,190,385) (170,438,227) Payments to vendors (98,375,106) (128,332,356) Loans issued to students (249,136) (1,791,069) Collection of loans to students 1,927,905 2,444,781 Auxiliary enterprises charges 24,880,403 27,140,523 Other receipts 8,860,733 7,194,543
Net cash used in operating activities (92,371,733) (89,323,158)
Cash Flows from Noncapital Financing ActivitiesState appropriations 75,489,568 74,979,638 Grants and contracts 29,134,762 26,409,919 Gifts 10,799,332 10,859,670 Cash provided by Stafford and PLUS loans 102,902,641 99,902,299 Cash used by Stafford and PLUS loans (100,000,000) (100,000,000) Cash provided by Agency Fund activities (87,525) (185,833) Cash used by Agency Fund activities 175,050 179,003
Net cash provided by noncapital financing activities 118,413,828 112,144,696
Cash Flows from Capital Financing ActivitiesProceeds from capital debt and leases 2,870,560 - Capital appropriations 20,926,089 7,374,197 Purchases of capital assets (38,077,932) (22,222,055) Principal paid on capital debt and leases (15,082,649) (14,151,314) Interest paid on capital debt and leases (10,077,265) (10,289,172)
Net cash used in capital financing activities (39,441,197) (39,288,344)
Cash Flows from Investing ActivitiesProceeds from sales and maturities of investments 34,506,212 188,628,331 Purchase of investments (31,302,755) (190,645,645) Interest on investments 8,996,688 16,518,763
Net cash provided by investing activities 12,200,145 14,501,449
Net decrease in cash (1,198,957) (1,965,357)
Cash and Cash Equivalents - Beginning of Year 3,623,264 5,588,621
Cash and Cash Equivalents - End of Year 2,424,307$ 3,623,264$
Reconciliation of Operating Loss to Cash Used by Operating ActivitiesOperating loss (62,380,047)$ (133,313,796)$ Adjustments:
Depreciation and amortization 28,782,708 27,587,367 Changes in assets and deferred outflow and liabilities and deferred inflow:
Accounts receivable, Net (2,489,896) 4,275,342 Notes receivable, Net 1,678,769 653,712 Inventories (595,949) (80,268) Prepaid expenses 112,377 (230,912) Deferred outflow 7,038,954 (23,445,255) Accounts payable (889,052) (6,855,036) Accrued liabilities (5,760,250) 668,442 Net pension liability (81,225,130) 51,957,555 Net OPEB Liability (3,473,224) - Unearned revenue (468,360) 24,666 Deferred inflow 27,297,367 (10,564,975)
Cash used by operating activities (92,371,733)$ (89,323,158)$

See Notes to Financial Statements. 17
The Cleveland State University Foundation, Inc. Statement of Financial Position
June 30, 2018 and 2017
2018 2017
AssetsCash and cash equivalents 4,171,983$ 3,363,969$
Accounts receivable 276,674 167,742
Contributions receivable, net of allowance for
uncollectible contributions 17,328,931 17,930,681
Other receivable 220,588 -
Cash surrender value of life insurance 229,938 -
Long-term investments 85,894,999 79,501,736
Funds held on behalf of others:
Cleveland State University 3,430,446 3,329,145
Cleveland State University Alumni Association 558,439 524,897
Total Assets 112,111,998 104,818,170
LiabilitiesAccounts payable & accrued expenses 20,502 16,728
Payable to Cleveland State University 3,187,534 2,902,771
Annuities payable 157,764 114,657
Funds held on behalf of others:
Cleveland State University 3,430,446 3,329,145
Cleveland State University Alumni Association 558,439 524,897
Total Liabilities 7,354,685 6,888,198
Net AssetsUnrestricted (896,585) (867,527)
Board designated - Scholarships 588,840 186,714
Total unrestricted (307,745) (680,813)
Temporarily restricted 41,812,439 37,565,029
Permanently restricted 63,252,619 61,045,756
Total Net Assets 104,757,313 97,929,972
Total Liabilities and Net Assets 112,111,998 104,818,170

See Notes to Financial Statements. 18
Euclid Avenue Development Corporation Statement of Financial Position
June 30, 2018 and 2017
2018 2017
AssetsCurrent Assets
Cash and Cash Equivalents 2,343,623$ 1,651,768$
Cash held by the university 114,045 649,772
Total Cash 2,457,668 2,301,540
Student accounts receivable, net 24,579 22,924
Other receivables 284,855 269,717
Investments 14,991,080 13,578,614
Prepaid expenses 34,460 66,568
Total current assets 17,792,642 16,239,363
Property and equipment
Land 128,000 128,000
Building 70,632,179 70,632,179
Building improvements 1,310,947 982,494
Furniture, fixtures, and equipment 3,214,465 3,185,545
75,285,591 74,928,218
Less: accumulated depreciation (19,744,695) (17,649,919)
Property and equipment, net 55,540,896 57,278,299
Other assets:
Restricted investments 4,848,695 4,958,330
Leases receivable, net of current portion 19,605,000 19,605,000
Total other assets 24,453,695 24,563,330
Total assets 97,787,233 98,080,992
LiabilitiesCurrent liabilities
Current portion of bonds payable 1,660,000 1,575,000
Accounts payable 411,540 361,419
Accrued interest 1,758,643 1,791,461
Accrued other 48,537 55,708
Deferred revenue 341,327 269,826
Rent payable to the university - -
Security deposits 204,166 231,967
Total current liabilities 4,424,213 4,285,381
Noncurrent liabilities
Deferred revenue 1,088,629 1,126,165
Bonds payable, net
Bonds payable 82,755,000 84,415,000
Add: bond premium, net 7,707,226 8,083,332
Less: bond issuance costs, net (952,367) (998,010)
Bond payable, net 89,509,859 91,500,322
Total noncurrent liabilities, net of current portion 90,598,488 92,626,487
Total liabilities 95,022,701 96,911,868
Net Assets
Unrestricted 2,764,532 1,169,124
Total net assets 2,764,532 1,169,124
Total liabilities and net assets 97,787,233 98,080,992
See Notes to Financial Statements. 19
The Cleveland State University Foundation Statement of Activities
Years Ended June 30, 2018 and 2017
Temporarily Permanently Total Total
Unrestricted Restricted Restricted 2018 2017
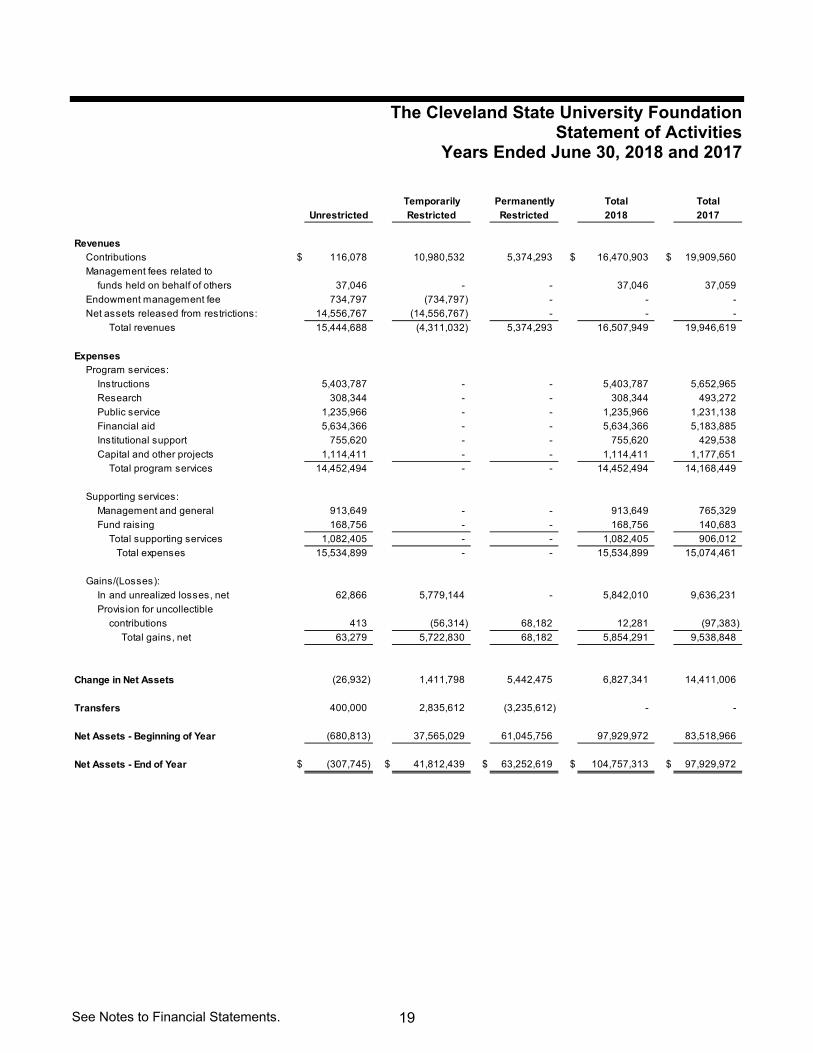
RevenuesContributions $ 116,078 10,980,532 5,374,293 $ 16,470,903 $ 19,909,560
Management fees related to
funds held on behalf of others 37,046 - - 37,046 37,059
Endowment management fee 734,797 (734,797) - - -
Net assets released from restrictions: 14,556,767 (14,556,767) - - -
Total revenues 15,444,688 (4,311,032) 5,374,293 16,507,949 19,946,619
ExpensesProgram services:
Instructions 5,403,787 - - 5,403,787 5,652,965
Research 308,344 - - 308,344 493,272
Public service 1,235,966 - - 1,235,966 1,231,138
Financial aid 5,634,366 - - 5,634,366 5,183,885
Institutional support 755,620 - - 755,620 429,538
Capital and other projects 1,114,411 - - 1,114,411 1,177,651
Total program services 14,452,494 - - 14,452,494 14,168,449
Supporting services:
Management and general 913,649 - - 913,649 765,329
Fund raising 168,756 - - 168,756 140,683
Total supporting services 1,082,405 - - 1,082,405 906,012
Total expenses 15,534,899 - - 15,534,899 15,074,461
Gains/(Losses):
Invand unrealized losses, net 62,866 5,779,144 - 5,842,010 9,636,231
Provision for uncollectible
contributions 413 (56,314) 68,182 12,281 (97,383)
Total gains, net 63,279 5,722,830 68,182 5,854,291 9,538,848
Change in Net Assets (26,932) 1,411,798 5,442,475 6,827,341 14,411,006
Transfers 400,000 2,835,612 (3,235,612) - -
Net Assets - Beginning of Year (680,813) 37,565,029 61,045,756 97,929,972 83,518,966
Net Assets - End of Year $ (307,745) $ 41,812,439 $ 63,252,619 $ 104,757,313 $ 97,929,972

See Notes to Financial Statements. 20
Euclid Avenue Development Corporation Statement of Activities
Years Ended June 30, 2018 and 2017
2018 2017
RevenuesRental Income:
Students $ 7,963,466 $ 8,113,357
University 1,734,741 1,734,736
Other 100,634 98,910
Maintenance fee - University 222,350 241,952
Investment income, net 704,351 1,618,207
Other 696,416 963,561
Total revenues 11,421,958 12,770,723
ExpensesInterest 3,951,141 4,047,403
Depreciation and Amortization 2,094,775 2,173,027
Utilities 719,335 695,115
Contract personnel 1,308,900 1,322,416
Management fees 301,183 296,351
Maintenance 395,441 365,117
General and administrative 281,446 252,224
Other operating 294,638 146,662
Marketing 38,925 36,209
Accounting 22,586 27,912
Reserve allowance 9,675 11,348
Insurance 7,785 7,580
Rent expense 400,720 409,628
Total expenses and losses 9,826,550 9,790,992
Change in Net Assets 1,595,408 2,979,731
Net Assets (Deficit) - Beginning of Year 1,169,124 (1,810,607)
Net Assets - End of Year $ 2,764,532 $ 1,169,124

Notes to Financial Statements
June 30, 2018 and 2017
21
Note 1 – Summary of Significant Accounting Policies
Organization and Basis of Presentation
Cleveland State University (the “University”) was established by the General Assembly of the State of Ohio (the “State”) in 1964 by statutory act under Chapter 3344 of the Ohio Revised Code. As such, the University is a component unit of the State. The University is exempt from federal income taxes under Section 115 of the Internal Revenue Code, except for unrelated business income. In accordance with Governmental Accounting Standards Board (GASB) Statement No. 61, the University’s financial statements are included, as a discretely presented component unit, in the State’s Comprehensive Annual Financial Report. The financial statements have been prepared in accordance with accounting principles generally accepted in the United States of America, as prescribed by GASB Statement No. 35, Basic Financial Statements – and Management’s Discussion and Analysis – for Public Colleges and Universities. GASB Statement No. 35 establishes standards for external financial reporting for public colleges and universities and requires that resources be classified for accounting and reporting purposes into the following net position categories: Net Investment in Capital Assets: Capital assets, net of accumulated depreciation and
outstanding principal balances of debt attributable to the acquisition, construction or improvement of those assets.
Restricted, Expendable: Net position whose use by the University is subject to externally imposed stipulations that can be fulfilled by actions of the University pursuant to those stipulations or that expire by the passage of time. Income generated from these funds may be restricted for student scholarships, loans, instruction, research, and other specific university needs.
Restricted, Nonexpendable: Net position subject to externally imposed stipulations that they be maintained permanently by the University. Income generated from these funds may be restricted for student scholarships, loans, instruction, research, and other specific university needs.
Unrestricted: Net position that is not subject to externally imposed stipulations. Unrestricted net position may be designated for specific purposes by action of management or may otherwise be limited by contractual agreements with outside parties.
The accompanying financial statements have been prepared on the accrual basis. The University reports as a business-type activity, as defined by GASB Statement No. 35. Business-type activities are those that are financed in whole or in part by fees charged to external parties for goods or services.
Notes to Financial Statements
June 30, 2018 and 2017
22
Note 1 – Summary of Significant Accounting Policies (Continued)
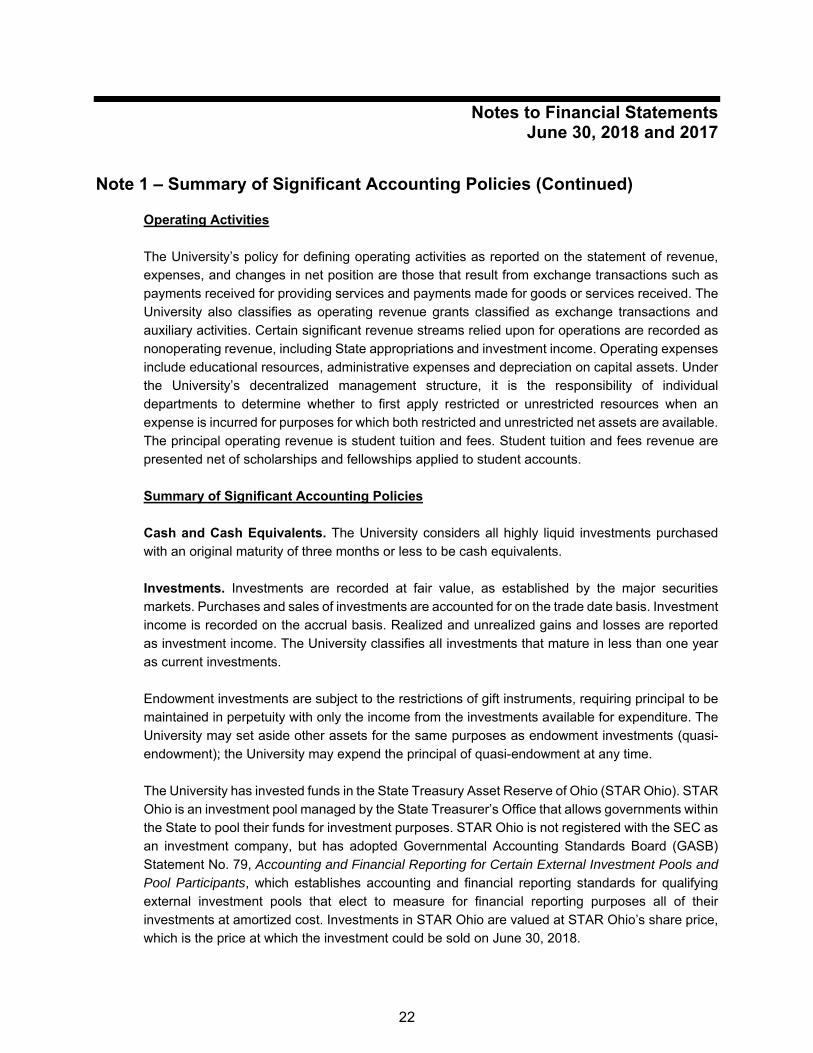
Operating Activities The University’s policy for defining operating activities as reported on the statement of revenue, expenses, and changes in net position are those that result from exchange transactions such as payments received for providing services and payments made for goods or services received. The University also classifies as operating revenue grants classified as exchange transactions and auxiliary activities. Certain significant revenue streams relied upon for operations are recorded as nonoperating revenue, including State appropriations and investment income. Operating expenses include educational resources, administrative expenses and depreciation on capital assets. Under the University’s decentralized management structure, it is the responsibility of individual departments to determine whether to first apply restricted or unrestricted resources when an expense is incurred for purposes for which both restricted and unrestricted net assets are available. The principal operating revenue is student tuition and fees. Student tuition and fees revenue are presented net of scholarships and fellowships applied to student accounts. Summary of Significant Accounting Policies Cash and Cash Equivalents. The University considers all highly liquid investments purchased with an original maturity of three months or less to be cash equivalents. Investments. Investments are recorded at fair value, as established by the major securities markets. Purchases and sales of investments are accounted for on the trade date basis. Investment income is recorded on the accrual basis. Realized and unrealized gains and losses are reported as investment income. The University classifies all investments that mature in less than one year as current investments. Endowment investments are subject to the restrictions of gift instruments, requiring principal to be maintained in perpetuity with only the income from the investments available for expenditure. The University may set aside other assets for the same purposes as endowment investments (quasi-endowment); the University may expend the principal of quasi-endowment at any time. The University has invested funds in the State Treasury Asset Reserve of Ohio (STAR Ohio). STAR Ohio is an investment pool managed by the State Treasurer’s Office that allows governments within the State to pool their funds for investment purposes. STAR Ohio is not registered with the SEC as an investment company, but has adopted Governmental Accounting Standards Board (GASB) Statement No. 79, Accounting and Financial Reporting for Certain External Investment Pools and Pool Participants, which establishes accounting and financial reporting standards for qualifying external investment pools that elect to measure for financial reporting purposes all of their investments at amortized cost. Investments in STAR Ohio are valued at STAR Ohio’s share price, which is the price at which the investment could be sold on June 30, 2018.

Notes to Financial Statements
June 30, 2018 and 2017
23
Note 1 – Summary of Significant Accounting Policies (Continued)
Accounts Receivable Allowance. The allowance for bad debt is determined based on historical average and a reasonableness ratio of accounts receivable to bad debt. The objective is to increase the collectability of current receivables to assist the University's objectives regarding enrollment and retention. As such, the University enforces policies that prohibit registration with an unpaid balance over $1,000 and limit registration for those students with a current unpaid balance between $200 - $1,000. The federal regulations regarding returns of funding under the Federal student aid programs of Title IV of the Higher Education Amendments of 1992 have continued to have an impact on outstanding accounts receivable. Inventories. Inventories are reported at cost. Cost is determined on the average cost basis. Capital Assets. Capital assets are stated at historical cost or at an appraised value at date of donation, if acquired by gift. It is the University’s policy to capitalize equipment costing $5,000 or more and buildings and improvements costing $100,000 or more. Depreciation of capital assets is provided on a straight-line basis over the estimated useful lives (five to forty years) of the respective assets and is not allocated to the functional expenditure categories. Amortization of the capitalized cost of assets held under capital leases is generally computed using the straight-line method over the estimated useful lives of the underlying assets or the term of the lease, whichever is shorter. The University capitalizes but does not depreciate works of art or historical treasures that are held for exhibition, education, research, and public service. Compensated Absences. Classified employees earn vacation at rates specified under State law. Full-time administrators and twelve-month faculty earn vacation at a rate of 22 days per year. The maximum amount of vacation that an employee can carry over from one fiscal year to the next is 30 days. All University employees are entitled to a sick leave credit equal to 10 hours for each month of service (earned on a pro rata basis for less than full-time employees). This sick leave will either be absorbed by time off due to illness or injury or, within certain limitations, be paid to the employee upon retirement. The amount paid to an employee, with 10 or more years of service upon retirement, is limited to one-quarter of the accumulated sick leave up to a maximum of 240 hours. The University has an accrued liability for all accumulated vacation hours, plus an estimate of the amount of sick leave that will be paid upon retirement. Salary-related fringe benefits have also been accrued. Unearned Revenue. Unearned revenue consists primarily of amounts received in advance of an event, such as student tuition and fees, and advance ticket sales related to the next fiscal year. Summer term tuition and fees and corresponding expenses relating to the portion of the term that is within the current fiscal year are recognized as tuition revenue and operating expense. The portion of sessions falling into the next fiscal year are recorded as unearned revenue and prepaid expense in the statement of net position and will be recognized in the following fiscal year.

Notes to Financial Statements
June 30, 2018 and 2017
24
Note 1 – Summary of Significant Accounting Policies (Continued)
Perkins Loan Program. Funds provided by the United States government under the Federal Perkins Loan program are loaned to qualified students and re-loaned after collection. These funds are ultimately refundable to the government and, therefore, are recorded as a liability in the accompanying statement of net position. Classification of Revenue. Revenue is classified as either operating or nonoperating. Operating revenue includes revenues from activities that have characteristics similar to exchange transactions. These include student tuition and fees (net of scholarship discounts and allowances), sales and services of auxiliary enterprises, and certain federal, state, local and private grants, and contracts. The presumption is that there is a fair exchange of value between all parties to the transaction. Non-operating revenue includes revenue from activities that have the characteristics of nonexchange transactions, such as state appropriations, and certain federal, state, local, and private gifts, and grants. The implication is that such revenues are derived from more passive efforts related to the acquisition of the revenue, rather than the earning of it. Auxiliary Enterprises. Auxiliary enterprise revenue primarily represents revenue generated by parking, Wolstein Center, food service, bookstore, recreation center, and intercollegiate athletics.
Scholarship Allowances and Student Aid. Financial aid to students is reported in the statement of revenue, expenses, and changes in net position under the alternative method as prescribed by the National Association of College and University Business Officers (NACUBO). Certain aid such as loans, funds provided to students as awarded by third parties, and Federal Direct Lending is accounted for as a third-party payment (credited to the student’s account as if the student made the payment). All other aid is reflected in the financial statements as operating expenses, or scholarship allowances, which reduce revenue. The amount reported as operating expense represents the portion of aid that was provided to the student in the form of cash. Scholarship allowances represent the portion of aid provided to the student in the form of reduced tuition. Under the alternative method followed by the University, scholarship allowances are computed by allocating the cash payments to students, excluding payments for services, to the ratio of aid not considered to be third-party aid to total aid. Component Units. The Cleveland State University Foundation, Inc. (the “Foundation”) and the Euclid Avenue Development Corporation (the “Corporation”) are private nonprofit organizations that report under FASB standards, Financial Reporting for Not-for-Profit Organizations. As such, certain revenue recognition criteria and presentation features are different from GASB revenue recognition criteria and presentation features. No modifications have been made to the Foundation’s or the Corporation’s financial information included in the University’s financial report for these differences.

Notes to Financial Statements
June 30, 2018 and 2017
25
Note 1 – Summary of Significant Accounting Policies (Continued)
Use of Estimates. The preparation of financial statements in conformity with accounting principles generally accepted in the United States of America requires management to make estimates and assumptions that affect the amounts reported in the financial statements and accompanying notes. Actual results may differ from those estimates. Bond Issuance Costs. Bond issuance costs are expensed as incurred. Pensions. For purposes of measuring the net pension liability, deferred outflows of resources and deferred inflows of resources related to pensions, and pension expense, information about the fiduciary net position of the (Ohio Public Employees Retirement System/State Teachers Retirement System of Ohio) Pension Plan (STRS/OPERS) and additions to/deductions from STRS’/OPERS’ fiduciary net position have been determined on the same basis as they are reported by STRS/OPERS. STRS/OPERS uses the economic resources measurement focus and the full accrual basis of accounting. Contribution revenue is recorded as contributions are due, pursuant to legal requirements. Benefit payments (including refunds of employee contributions) are recognized as expense when due and payable in accordance with the benefit terms. Investments are reported at fair value. Other Postemployment Benefit Costs. For purposes of measuring the net other postemployment benefit (OPEB) liability, deferred outflows of resources and deferred inflows of resources related to OPEB, and OPEB expense, information about the fiduciary net position of the (Ohio Public Employees Retirement System/State Teachers Retirement System of Ohio) Pension Plan (STRS/OPERS) and additions to/deductions from STRS’/OPERS’ fiduciary net position have been determined on the same basis as they are reported by STRS/OPERS. STRS/OPERS uses the economic resources measurement focus and the full accrual basis of accounting. For this purpose, STRS/OPERS recognizes benefit payments when due and payable in accordance with the benefit terms. Investments are reported at fair value.
Deferred Outflows of Resources. In addition to assets, the statement of net position reports a separate section for deferred outflows of resources. This separate financial statement element, deferred outflows of resources, represents a consumption of net position that applies to a future periods and so will not be recognized as an outflow of resources (expense/ expenditure) until then. The University reports deferred outflows of resources for certain pension-related and OPEB-related amounts, such as change in expected and actual experience, changes in assumptions, and certain contributions made to the plan subsequent to the measurement date. More detailed information can be found in Note 8.
Deferred Inflows of Resources. In addition to liabilities, the statement of net position reports a separate section for deferred inflows of resources. This separate financial statement element, deferred inflows of resources, represents an acquisition of net position that applies to a future periods and so will not be recognized as an inflow of resources (revenue) until that time. The University reports deferred inflows of resources for certain pension-related and OPEB-related

Notes to Financial Statements
June 30, 2018 and 2017
26
Note 1 – Summary of Significant Accounting Policies (Continued)
amounts, such as the difference between projected and actual earnings of the plan’s investments. More detailed information can be found in Note 8.
Adoption of New Accounting Pronouncement. The GASB issued GASB Statement No. 75, Accounting and Financial Reporting for Postemployment Benefits Other than Pensions, which requires governments providing other postemployment benefit (OPEB) plans to recognize their unfunded OPEB obligation as a liability for the first time, and to more comprehensively and comparably measure the annual costs of OPEB benefits. The statement also enhances accountability and transparency through revised note disclosures and required supplementary information (RSI). In accordance with the statements, the University has reported a change in accounting principle adjustment to unrestricted net position of $66,810,116, which is the net of the net OPEB liability and related deferred outflows of resources as of July 1, 2017. June 30, 2017 amounts have not been restated to reflect the impact of GASB No. 75 because the information is not available to calculate the impact on OPEB expense for the fiscal year ended June 30, 2017.
Upcoming Accounting Pronouncements In November 2016, the GASB issued Statement No. 83, Certain Asset Retirement Obligations, which establishes criteria for determining the timing and pattern of recognition of a liability and a corresponding deferred outflow of resources for asset retirement obligations. The University is currently evaluating the impact of this standard. The provisions of this statement are effective for the University’s financial statements for the year ending June 30, 2019. In June 2017, the Governmental Accounting Standards Board issued GASB Statement No. 87, Leases, which increases the usefulness of governments' financial statements by requiring recognition of certain lease assets and liabilities for leases that previously were classified as operating leases and recognized as inflows of resources or outflows of resources based on the payment provisions of the contract. This statement establishes a single model for lease accounting based on the foundational principle that leases are financings of the right to use an underlying asset. Under this statement, a lessee is required to recognize a lease liability and an intangible right-to-use lease asset, and a lessor is required to recognize a lease receivable and a deferred inflow of resources. Based on the operating leases in effect today, the new lease standard is not expected to have a significant effect on the University’s financial statements. The provisions of this statement are effective for the University’s financial statements for the year ending June 30, 2021.

Notes to Financial Statements
June 30, 2018 and 2017
27
Note 2 – Deposits and Investments
Deposits Custodial credit risk is the risk that in the event of the failure of a depository financial institution, the University will not be able to recover deposits or will not be able to recover collateral securities that are in the possession of an outside party. Protection of university cash and deposits is provided by the Federal Deposit Insurance Corporation as well as qualified securities pledged by the institution holding the assets. Under State law, financial institutions must collateralize all public deposits. The value of the pooled collateral must equal at least 102 percent of public funds deposited. Collateral is held by trustees including the Federal Reserve Bank and designated third-party trustees of the financial institution. At June 30, 2018, the cash and cash equivalents balance of $2,424,307 is after the University recorded an overdraft consisting of items in transit of $2,875,649 in payroll and accounts payable. The bank balance at June 30, 2018 was $2,410,547, of which $628,117 was covered by federal depository insurance, and $1,782,430 was covered by collateral held by the trust department of a bank other than the pledging bank in the name of the pledging bank. At June 30, 2017, the cash and cash equivalents balance of $3,623,264 is after the University recorded an overdraft consisting of items in transit of $3,755,797 in accounts payable. The bank balance at June 30, 2017 was $3,294,139, of which $1,072,735 was covered by federal depository insurance, and $2,221,404 was covered by collateral held by the trust department of a bank other than the pledging bank in the name of the pledging bank. Investments In accordance with the board of trustees’ resolution, the types of investments that may be purchased by the University include United States Treasury securities, federal government agency securities, certificates of deposit, bank repurchase agreements, commercial paper, bonds and other obligations of the State of Ohio or any of its political subdivisions, the State Treasurer’s Asset Reserve (STAR Ohio), bankers’ acceptances, money market funds, common stocks, and corporate bonds. The endowment investments are managed by the Foundation, which can also invest in real estate and alternative investments.
STAR Ohio is an investment pool managed by the Ohio State Treasurer’s office that allows governments within the State to pool their funds for investment purposes. STAR Ohio is not registered with the Securities and Exchange Commission as an investment company, but does operate in a manner consistent with Rule 2A7 of the Investment Company Act of 1940. The investment is valued at STAR Ohio’s share price on June 30, 2018 and 2017. Restricted investments consist of unspent debt proceeds.

Notes to Financial Statements
June 30, 2018 and 2017
28
Note 2 – Deposits and Investments (Continued)
As of June 30, 2018, the University had the following types of investments and maturities:
As of June 30, 2017, the University had the following types of investments and maturities:
Some of the U.S. agency securities are callable at various dates. The University believes that no securities will be called. Interest Rate Risk. Interest rate risk is the risk that changes in interest rates will adversely affect the fair value of an investment. Investments with interest rates that are fixed for longer periods are likely to be subject to more variability in their fair values as a result of future changes in interest rates. Credit Risk. Credit risk is the risk that an issuer or other counterparty to an investment will not fulfill its obligations. While the University’s bond mutual fund investment itself is not rated, the credit quality of the fund’s holdings is AA or better, as rated by Standard & Poor’s and Moody’s.
Investment Type Market Value Less Than 1 1-5
Commercial paper 26,503,823$ 26,503,823$ -$ U.S. obligation mutual fund 76,607,341 76,607,341 - Certificates of deposit 539,897 539,897 - STAR Ohio 10,865,424 - - Bond mutual funds 16,668,370 - 16,668,370
Stock mutual funds 18,396,515 - -
Total 149,581,370$ 103,651,061$ 16,668,370$
Investment Maturities (in Years)
Investment Type Market Value Less Than 1 1-5
Commercial paper 11,792,813$ 11,792,813$ -$ U.S. obligation mutual fund 72,357,000 72,357,000 - Certificates of deposit 536,231 536,231 - STAR Ohio 29,939,375 - - Bond mutual funds 19,550,629 - 19,550,629
Stock mutual funds 18,608,779 - -
Total 152,784,827$ 84,686,044$ 19,550,629$
Investment Maturities (in Years)
Notes to Financial Statements
June 30, 2018 and 2017
29
Note 2 – Deposits and Investments (Continued)
Custodial Credit Risk. Custodial credit risk is the risk that, in the event of the failure of a counterparty to a transaction, the University will not be able to recover the value of investment securities that are in the possession of an outside party. The University does not have a policy for custodial credit risk. At June 30, 2018 and 2017, none of the investment securities were uninsured and unregistered, with securities held by the counterparty or by its trust department or agent but not in the University's name.
Concentration of Credit Risk. Concentration of credit risk is the risk of loss attributed to the magnitude of investment in a single issuer. As of June 30, 2018 and 2017, not more than 5% of the University’s total investments were invested in any one issuer except those which are obligations of, or fully guaranteed as to both principal and interest by, the U.S. Government or its agencies. Foreign Currency Risk. Foreign currency risk is the risk that changes in exchange rates will adversely affect the fair value of an investment. At June 30, 2018 and 2017, investments include approximately $19.6 million and $21.3 million, respectively, managed by international equity managers that are subject to foreign currency risk. Although the University’s investment policy does not specifically address foreign currency risk, it does limit foreign investments to no more than 20% of the portfolio.
Note 3 – Fair Value Measurements
The University categorizes its fair value measurements within the fair value hierarchy established by generally accepted accounting principles. The hierarchy is based on the valuation inputs used to measure the fair value of the asset. Level 1 inputs are quoted prices in active markets for identical assets; Level 2 inputs are significant other observable inputs; Level 3 inputs are significant unobservable inputs. Investments that are measured at fair value using the net asset value per share (or its equivalent) as a practical expedient are not classified in the fair value hierarchy below. In instances where inputs used to measure fair value fall into different levels in the above fair value hierarchy, fair value measurements in their entirety are categorized based on the lowest level input that is significant to the valuation. The University’s assessment of the significance of particular inputs to these fair value measurements requires judgment and considers factors specific to each asset or liability.
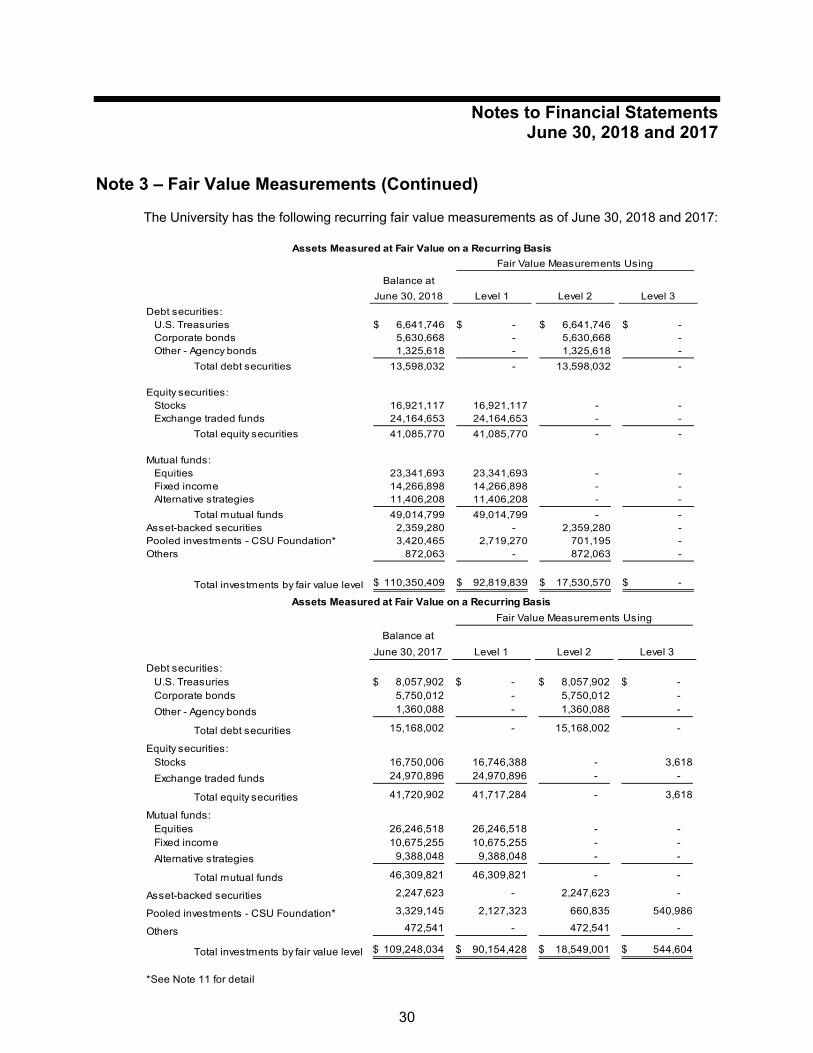
Notes to Financial Statements
June 30, 2018 and 2017
30
Note 3 – Fair Value Measurements (Continued)
The University has the following recurring fair value measurements as of June 30, 2018 and 2017:
Balance at
June 30, 2018 Level 1 Level 2 Level 3
Debt securities:U.S. Treasuries 6,641,746$ -$ 6,641,746$ -$ Corporate bonds 5,630,668 - 5,630,668 - Other - Agency bonds 1,325,618 - 1,325,618 -
Total debt securities 13,598,032 - 13,598,032 -
Equity securities:Stocks 16,921,117 16,921,117 - - Exchange traded funds 24,164,653 24,164,653 - -
Total equity securities 41,085,770 41,085,770 - -
Mutual funds:Equities 23,341,693 23,341,693 - - Fixed income 14,266,898 14,266,898 - - Alternative strategies 11,406,208 11,406,208 - -
Total mutual funds 49,014,799 49,014,799 - - Asset-backed securities 2,359,280 - 2,359,280 - Pooled investments - CSU Foundation* 3,420,465 2,719,270 701,195 - Others 872,063 - 872,063 -
Total investments by fair value level 110,350,409$ 92,819,839$ 17,530,570$ -$
Fair Value Measurements Using
Assets Measured at Fair Value on a Recurring Basis
Balance at
June 30, 2017 Level 1 Level 2 Level 3
Debt securities:U.S. Treasuries 8,057,902$ -$ 8,057,902$ -$ Corporate bonds 5,750,012 - 5,750,012 -
Other - Agency bonds 1,360,088 - 1,360,088 -
Total debt securities 15,168,002 - 15,168,002 -
Equity securities:Stocks 16,750,006 16,746,388 - 3,618
Exchange traded funds 24,970,896 24,970,896 - -
Total equity securities 41,720,902 41,717,284 - 3,618
Mutual funds:Equities 26,246,518 26,246,518 - - Fixed income 10,675,255 10,675,255 - -
Alternative strategies 9,388,048 9,388,048 - -
Total mutual funds 46,309,821 46,309,821 - -
Asset-backed securities 2,247,623 - 2,247,623 -
Pooled investments - CSU Foundation* 3,329,145 2,127,323 660,835 540,986
Others 472,541 - 472,541 -
Total investments by fair value level 109,248,034$ 90,154,428$ 18,549,001$ 544,604$
*See Note 11 for detail
Fair Value Measurements Using
Assets Measured at Fair Value on a Recurring Basis

Notes to Financial Statements
June 30, 2018 and 2017
31
Note 3 – Fair Value Measurements (Continued)
Debt and equity securities and mutual funds classified in Level 1 are valued using prices quoted in active markets for those securities. The fair value of corporate bonds, agency bonds and asset-backed securities at June 30, 2018 and 2017 was determined primarily based on Level 2 inputs. The University estimates the fair value of these investments using other inputs such as interest rates and yield curves that are observable at commonly quoted intervals. Level 3 inputs are unobservable inputs, including inputs that are available in situations where there is little, if any, market activity for the related asset. The University estimates the fair value of Level 3 investments using the University’s own estimates using pricing models, discounted cash flow methodologies, or similar techniques taking into account the characteristics of the asset. Short-term investments and investments on the statement of net position at June 30, 2018 and 2017 include investments in STAR Ohio of $10,865,424 and $29,939,375, respectively. The investments in STAR Ohio are measured at amortized cost; therefore, they are not included in the tables above. There are no limitations or restrictions on any STAR Ohio participant withdrawals due to redemption notice periods, liquidity fees, or redemption gates. However, notice must be given to STAR Ohio 24 hours in advance of all deposits and withdrawals exceeding $25 million. STAR Ohio reserves the right to limit the transaction to $50 million, requiring the excess amount to be transacted the following business day(s), but only to the $50 million limit. All accounts of the STAR Ohio investors will be combined for these purposes.
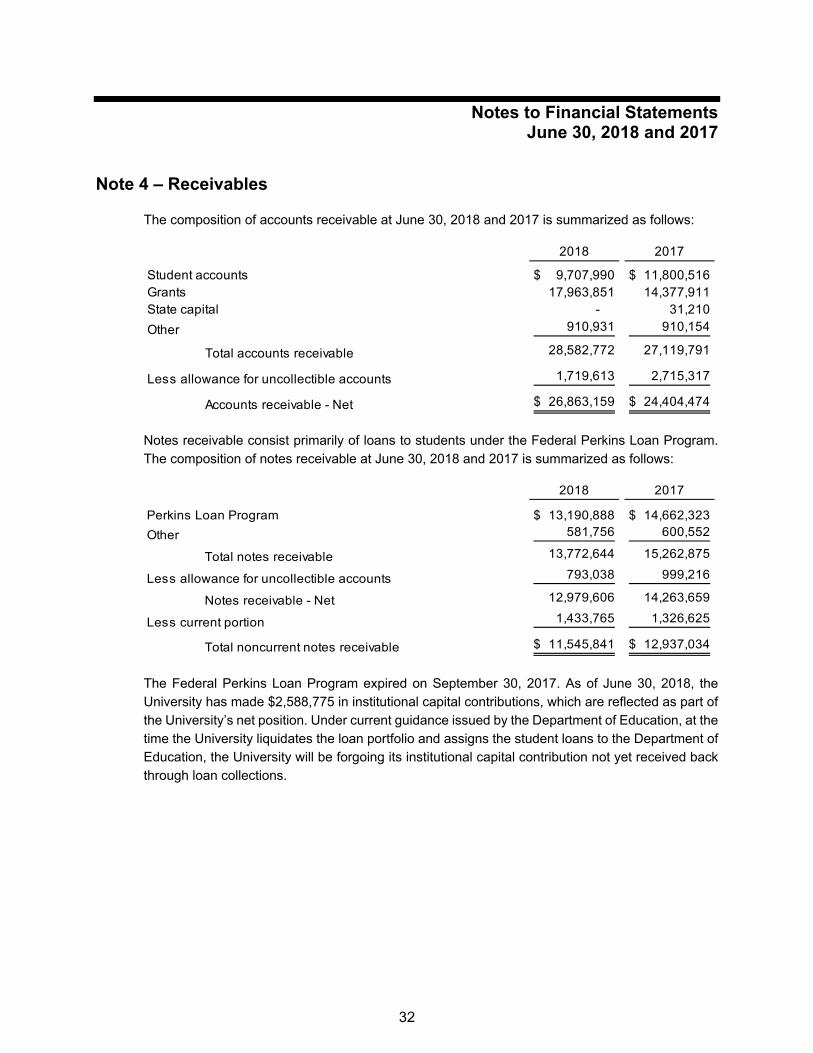
Notes to Financial Statements
June 30, 2018 and 2017
32
Note 4 – Receivables
The composition of accounts receivable at June 30, 2018 and 2017 is summarized as follows:
Notes receivable consist primarily of loans to students under the Federal Perkins Loan Program. The composition of notes receivable at June 30, 2018 and 2017 is summarized as follows:
The Federal Perkins Loan Program expired on September 30, 2017. As of June 30, 2018, the University has made $2,588,775 in institutional capital contributions, which are reflected as part of the University’s net position. Under current guidance issued by the Department of Education, at the time the University liquidates the loan portfolio and assigns the student loans to the Department of Education, the University will be forgoing its institutional capital contribution not yet received back through loan collections.
2018 2017
Student accounts 9,707,990$ 11,800,516$ Grants 17,963,851 14,377,911 State capital - 31,210
Other 910,931 910,154
Total accounts receivable 28,582,772 27,119,791
Less allowance for uncollectible accounts 1,719,613 2,715,317
Accounts receivable - Net 26,863,159$ 24,404,474$
2018 2017
Perkins Loan Program 13,190,888$ 14,662,323$
Other 581,756 600,552
Total notes receivable 13,772,644 15,262,875
Less allowance for uncollectible accounts 793,038 999,216
Notes receivable - Net 12,979,606 14,263,659
Less current portion 1,433,765 1,326,625
Total noncurrent notes receivable 11,545,841$ 12,937,034$
Notes to Financial Statements
June 30, 2018 and 2017
33
Note 5 – State Support
The University is a State-assisted institution of higher education, which receives a student-based subsidy from the State. This subsidy is determined annually, based upon a formula devised by The Ohio Department of Higher Education. In addition, the State provides the funding and constructs major plant facilities on the University’s campus. The funding is obtained from the issuance of revenue bonds by the Ohio Public Facilities Commission (OPFC), which in turn causes the construction and subsequent lease of the facility, by The Ohio Department of Higher Education. Upon completion, The Ohio Department of Higher Education turns over control of the facility to the University. Neither the obligation for the revenue bonds issued by OPFC nor the annual debt service charges for principal and interest on the bonds are reflected in the University’s financial statements. The OPFC revenue bonds are currently being funded through appropriations to The Ohio Department of Higher Education by the General Assembly. The facilities are not pledged as collateral for the revenue bonds. Instead, the bonds are supported by a pledge of monies in the Higher Education Bond Service Fund established in the custody of the Treasurer of State. If sufficient monies are not available from this fund, a pledge exists to assess a special student fee uniformly applicable to students in State-assisted institutions of higher education throughout the State.
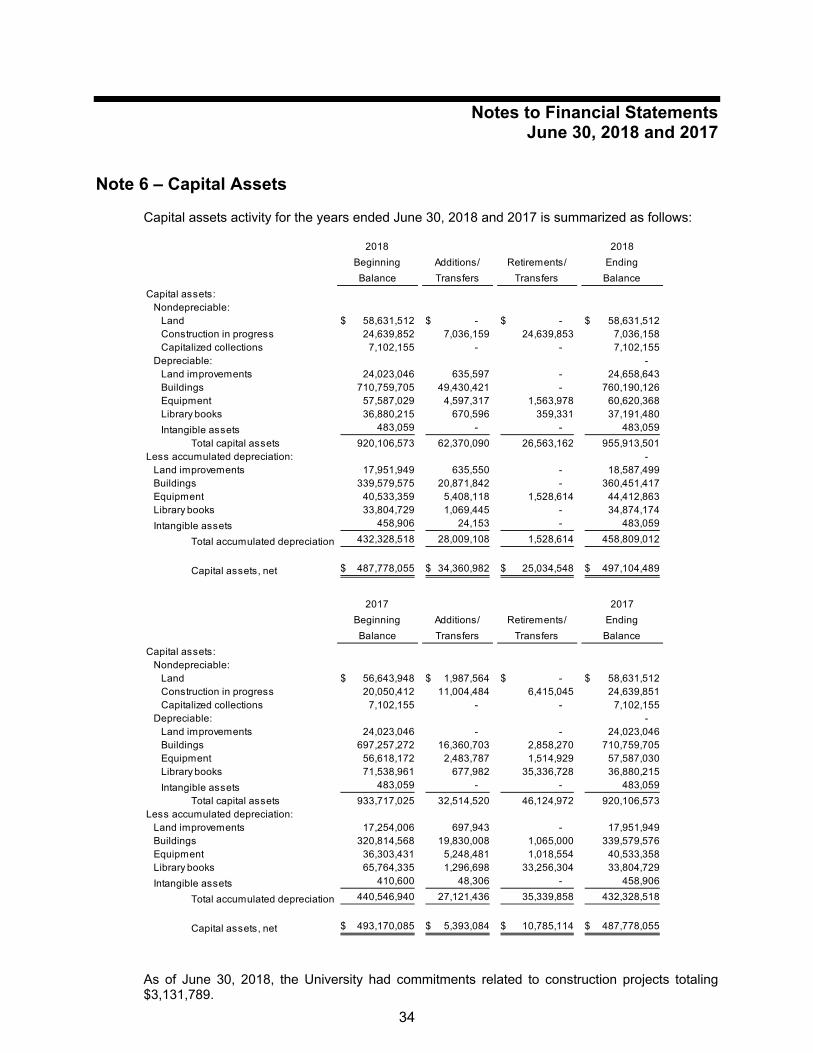
Notes to Financial Statements
June 30, 2018 and 2017
34
Note 6 – Capital Assets
Capital assets activity for the years ended June 30, 2018 and 2017 is summarized as follows:
As of June 30, 2018, the University had commitments related to construction projects totaling $3,131,789.
2018
Beginning
Balance
Additions/
Transfers
Retirements/
Transfers
2018
Ending
Balance
Capital assets:Nondepreciable:
Land 58,631,512$ -$ -$ 58,631,512$ Construction in progress 24,639,852 7,036,159 24,639,853 7,036,158 Capitalized collections 7,102,155 - - 7,102,155
Depreciable: - Land improvements 24,023,046 635,597 - 24,658,643 Buildings 710,759,705 49,430,421 - 760,190,126 Equipment 57,587,029 4,597,317 1,563,978 60,620,368 Library books 36,880,215 670,596 359,331 37,191,480
Intangible assets 483,059 - - 483,059
Total capital assets 920,106,573 62,370,090 26,563,162 955,913,501 Less accumulated depreciation: -
Land improvements 17,951,949 635,550 - 18,587,499 Buildings 339,579,575 20,871,842 - 360,451,417 Equipment 40,533,359 5,408,118 1,528,614 44,412,863 Library books 33,804,729 1,069,445 - 34,874,174
Intangible assets 458,906 24,153 - 483,059
Total accumulated depreciation 432,328,518 28,009,108 1,528,614 458,809,012
Capital assets, net 487,778,055$ 34,360,982$ 25,034,548$ 497,104,489$
2017
Beginning
Balance
Additions/
Transfers
Retirements/
Transfers
2017
Ending
Balance
Capital assets:Nondepreciable:
Land 56,643,948$ 1,987,564$ -$ 58,631,512$ Construction in progress 20,050,412 11,004,484 6,415,045 24,639,851 Capitalized collections 7,102,155 - - 7,102,155
Depreciable: - Land improvements 24,023,046 - - 24,023,046 Buildings 697,257,272 16,360,703 2,858,270 710,759,705 Equipment 56,618,172 2,483,787 1,514,929 57,587,030 Library books 71,538,961 677,982 35,336,728 36,880,215
Intangible assets 483,059 - - 483,059
Total capital assets 933,717,025 32,514,520 46,124,972 920,106,573 Less accumulated depreciation:
Land improvements 17,254,006 697,943 - 17,951,949 Buildings 320,814,568 19,830,008 1,065,000 339,579,576 Equipment 36,303,431 5,248,481 1,018,554 40,533,358 Library books 65,764,335 1,296,698 33,256,304 33,804,729
Intangible assets 410,600 48,306 - 458,906
Total accumulated depreciation 440,546,940 27,121,436 35,339,858 432,328,518
Capital assets, net 493,170,085$ 5,393,084$ 10,785,114$ 487,778,055$

Notes to Financial Statements
June 30, 2018 and 2017
35
Note 7 – Noncurrent Liabilities Excluding Net Pension Liability
Noncurrent liabilities, excluding net pension liability, consist of the following as of June 30, 2018 and June 30, 2017:
In February 2016, the University issued $32,475,000 of general receipts bonds, Series 2016A. The bonds bear interest rates ranging from 3.0% to 5.0% and mature beginning June 1, 2016 through June 1, 2036. The proceeds of the issuance were used to defease a portion of the Series 2007A bonds and pay issuance costs. The purpose of this transaction was to refund future callable maturities to achieve debt service savings of approximately $3,900,000 over the life of the bonds. As a result of the refunding, $1,493,588 has been recorded as a loss on refunding within the deferred outflows section on the statement of net position and will be amortized into income from 2016 through 2036. Amortization expense for both 2018 and 2017 was $73,546.
Due Dates
Interest
Rate-%
2018 Beginning
Balance Additions Reductions
2018
Ending Balance Current
2011 bonds payable 2013-42 5.32 5,325,000$ -$ 120,000$ 5,205,000$ 120,000$ 2012 bonds payable 2013-37 5.00 132,125,000 - 5,275,000 126,850,000 5,550,000
2012 bond premium 12,396,000 - 619,800 11,776,200 619,800 2016A bonds payable 2017-2036 3.00-5.00 32,195,000 - 1,125,000 31,070,000 1,165,000 2016A bond premium 2,909,300 - 153,800 2,755,500 153,800
Capital leases 2010-41 2.33-5.08 40,699,397 2,870,560 7,789,049 35,780,908 6,191,297
Total debt 225,649,697 2,870,560 15,082,649 213,437,608 13,799,897
Perkins student loans 10,673,284 - 410,265 10,263,019 - Deposits 988,448 3,418,455 3,302,611 1,104,292 - Compensated absences 10,851,264 - 818,389 10,032,875 1,312,991
248,162,693 6,289,015$ 19,613,914$ 234,837,794 15,112,888$
Less current portion long-term liabilities (15,482,732) (15,112,888)
Long-term liabilities 232,679,961$ 219,724,906$
Due Dates
Interest
Rate-%
2017 Beginning
Balance Additions Reductions
2017 Ending
Balance Current
2007A bonds payable 2017 4.00-5.75 1,095,000$ -$ 1,095,000$ -$ -$ 2011 bonds payable 2013-42 5.32 5,445,000 - 120,000 5,325,000 120,000 2012 bonds payable 2013-37 5.00 137,200,000 - 5,075,000 132,125,000 5,275,000 2012 bond premium 13,015,710 - 619,710 12,396,000 619,800 2016A bonds payable 2017-2036 3.00-5.00 32,195,000 - - 32,195,000 1,125,000
2016A bond premium 3,063,100 - 153,800 2,909,300 153,800
Capital leases 2010-41 2.33-5.08 47,787,201 - 7,087,804 40,699,397 7,333,646
Total debt 239,801,011 - 14,151,314 225,649,697 14,627,246 Perkins student loans 10,487,391 185,893 - 10,673,284 - Deposits 980,770 2,912,909 2,905,231 988,448 -
Compensated absences 10,290,013 561,251 - 10,851,264 855,486
261,559,185 3,660,053$ 17,056,545$ 248,162,693 15,482,732$
Less current portion long-term liabilities (14,866,351) (15,482,732)
Long-term liabilities 246,692,834$ 232,679,961$

Notes to Financial Statements
June 30, 2018 and 2017
36
Note 7 – Noncurrent Liabilities Excluding Net Pension Liability (Continued)
On August 21, 2012, the University issued general receipts bonds in the principal amount of $152,835,000. The General Receipts Series 2012 Bonds were issued as fixed rate bonds with monthly maturities beginning June 1, 2013 through June 1, 2037. Interest is payable monthly at the rate of 5.0%. The proceeds of the bonds were used to (1) pay costs of constructing a new building on the University’s campus, rehabilitation of existing buildings, campus-wide upgrades of electrical, mechanical and security systems and improvements to campus walkways; (2) refund portions of the Outstanding Series 2003A Bonds, Series 2004 Bonds and Series 2008 Bonds; and (3) pay costs relating to the issuance of the Series 2012 Bonds. In September 2011, the University issued taxable general receipts bonds in the principal amount of $5,775,000. The General Receipts Series 2011 Bonds were issued as fixed rate bonds with monthly maturities beginning October 1, 2013 through April 1, 2042. Interest is payable monthly at the rate of 5.32%. The proceeds of the bonds were used to finance a portion of the costs of public improvements identified as the North Campus Neighborhood – Project Phase I. This phase is the subject of a "project development agreement" dated July 14, 2011 by and between Cleveland State University and CSU Housing, LLC, an Ohio limited liability company which serves as the project developer. Interest expense on indebtedness for the years ended June 30, 2018 and 2017 was $9,152,241 and $9,166,697, respectively. On construction-related debt, for the years ended June 30, 2018 and 2017, interest cost was capitalized in the amount of $26,355 (net of $4,535 interest income) and $535,106 (net of $8,339 interest income), respectively. The University leases various pieces of equipment and parking garages, which have been recorded under various capital leases in amounts representing the present value of future minimum lease payments. Capital lease principal payments for two parking garage leases begin in August 2040. Capital lease obligations are collateralized by equipment with a gross cost of $81,634,928 and $81,157,503 and gross accumulated depreciation of $78,114,973 and $78,137,085 at June 30, 2018 and 2017, respectively. The capital leases have varying maturity dates through 2045.
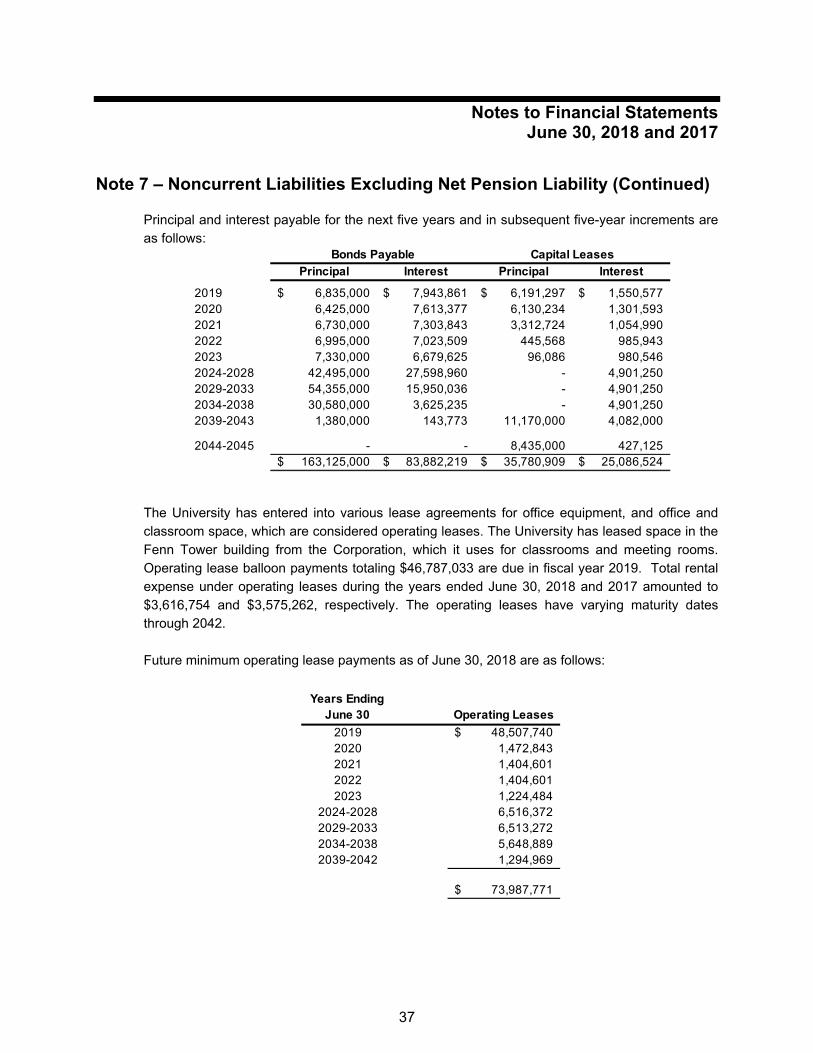
Notes to Financial Statements
June 30, 2018 and 2017
37
Note 7 – Noncurrent Liabilities Excluding Net Pension Liability (Continued)
Principal and interest payable for the next five years and in subsequent five-year increments are as follows:
The University has entered into various lease agreements for office equipment, and office and classroom space, which are considered operating leases. The University has leased space in the Fenn Tower building from the Corporation, which it uses for classrooms and meeting rooms. Operating lease balloon payments totaling $46,787,033 are due in fiscal year 2019. Total rental expense under operating leases during the years ended June 30, 2018 and 2017 amounted to $3,616,754 and $3,575,262, respectively. The operating leases have varying maturity dates through 2042. Future minimum operating lease payments as of June 30, 2018 are as follows:
Principal Interest Principal Interest
2019 6,835,000$ 7,943,861$ 6,191,297$ 1,550,577$ 2020 6,425,000 7,613,377 6,130,234 1,301,593 2021 6,730,000 7,303,843 3,312,724 1,054,990 2022 6,995,000 7,023,509 445,568 985,943 2023 7,330,000 6,679,625 96,086 980,546 2024-2028 42,495,000 27,598,960 - 4,901,250 2029-2033 54,355,000 15,950,036 - 4,901,250 2034-2038 30,580,000 3,625,235 - 4,901,250 2039-2043 1,380,000 143,773 11,170,000 4,082,000
2044-2045 - - 8,435,000 427,125 163,125,000$ 83,882,219$ 35,780,909$ 25,086,524$
Bonds Payable Capital Leases
Years Ending June 30 Operating Leases
2019 48,507,740$ 2020 1,472,843 2021 1,404,601 2022 1,404,601 2023 1,224,484
2024-2028 6,516,372 2029-2033 6,513,272 2034-2038 5,648,889 2039-2042 1,294,969
73,987,771$

Notes to Financial Statements
June 30, 2018 and 2017
38
Note 8 – Employment Benefit Plans
Retirement Plans Substantially all nonstudent University employees are covered by one of three retirement plans. The university faculty are covered by the State Teachers Retirement System of Ohio (STRS). Nonfaculty employees are covered by the Ohio Public Employees Retirement System (OPERS). Employees may opt out of STRS and OPERS and participate in the Alternative Retirement Plan (ARP). STRS and OPERS both offer three separate retirement plans: the defined benefit plan, the defined contribution plan, and a combined plan. STRS and OPERS each provide retirement, survivor, and disability benefits to plan members and their beneficiaries. The plans also each provide post-employment healthcare benefits (including Medicare B premiums) to retirees and beneficiaries who elect to receive those benefits. Defined Benefit Plans The University participates in the State Teachers Retirement System (STRS) and the Ohio Public Employees Retirement System (OPERS), statewide, cost-sharing, multiple-employer defined benefit public employee retirement systems governed by the Ohio Revised Code (ORC) that covers substantially all employees of the University. Each system has multiple retirement plan options available to its members, ranging from three in STRS and three in OPERS. Each system provides retirement, survivor, and disability benefits to plan members and their beneficiaries. The systems also each provide post-employment healthcare benefits (including Medicare B premiums) to retirees and beneficiaries who elect to receive those benefits. Each retirement system issues a publicly available financial report that includes financial statements and required supplementary information for the pension and post-employment healthcare plans. The reports may be obtained by contacting: State Teachers Retirement System of Ohio Ohio Public Employees Retirement System 275 E. Broad Street 277 East Town Street Columbus, OH 43215 Columbus, OH 43215 (888) 227-7877 (800) 222-7377 www.strsoh.org www.opers.org Contributions. State retirement law requires contributions by covered employees and their employers, and Chapter 3307 of the ORC limits the maximum rate of contributions. The retirement boards of the systems individually set contribution rates within the allowable limits. The adequacy of employer contribution rates is determined annually by actuarial valuation using the entry age normal cost method. Under these provisions, each University’s contribution is expected to finance the costs of benefits earned by employees during the year, with an additional amount to finance a portion of the unfunded accrued liability.
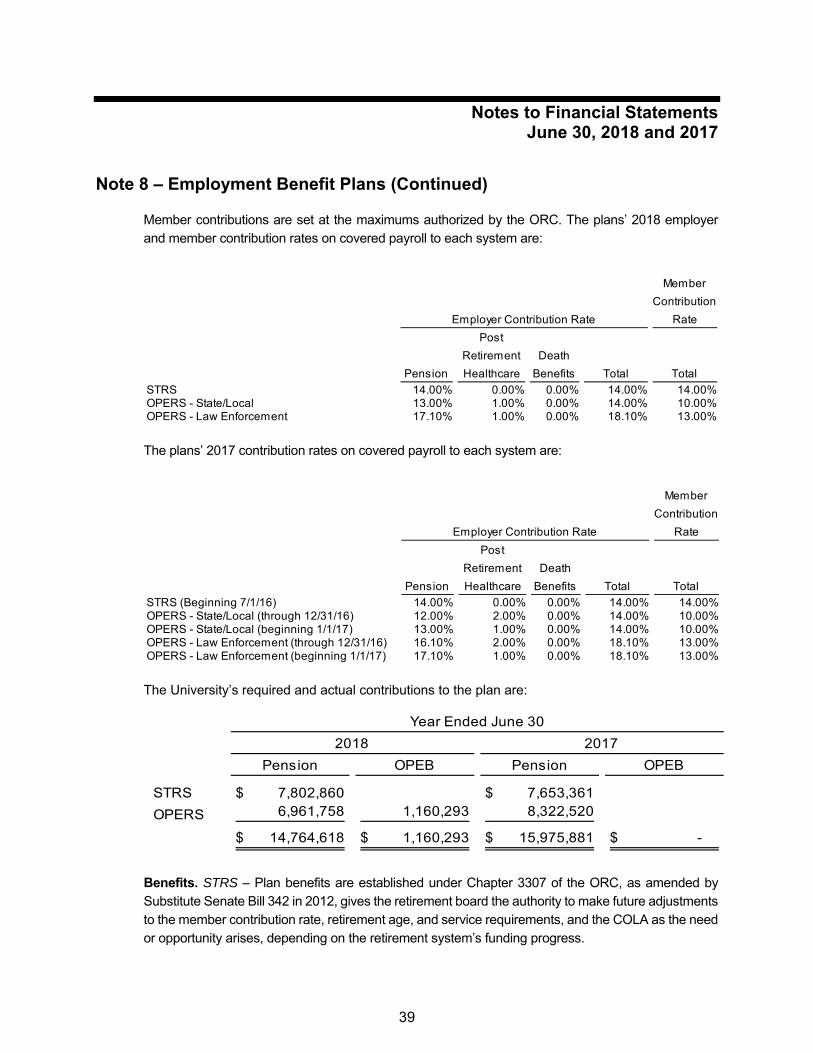
Notes to Financial Statements
June 30, 2018 and 2017
39
Note 8 – Employment Benefit Plans (Continued)
Member contributions are set at the maximums authorized by the ORC. The plans’ 2018 employer and member contribution rates on covered payroll to each system are:
The plans’ 2017 contribution rates on covered payroll to each system are:
The University’s required and actual contributions to the plan are:
Benefits. STRS – Plan benefits are established under Chapter 3307 of the ORC, as amended by Substitute Senate Bill 342 in 2012, gives the retirement board the authority to make future adjustments to the member contribution rate, retirement age, and service requirements, and the COLA as the need or opportunity arises, depending on the retirement system’s funding progress.
Member
Contribution
Rate
Pension
Post
Retirement
Healthcare
Death
Benefits Total Total
STRS 14.00% 0.00% 0.00% 14.00% 14.00%OPERS - State/Local 13.00% 1.00% 0.00% 14.00% 10.00%OPERS - Law Enforcement 17.10% 1.00% 0.00% 18.10% 13.00%
Employer Contribution Rate
Member
Contribution
Rate
Pension
Post
Retirement
Healthcare
Death
Benefits Total Total
STRS (Beginning 7/1/16) 14.00% 0.00% 0.00% 14.00% 14.00%OPERS - State/Local (through 12/31/16) 12.00% 2.00% 0.00% 14.00% 10.00%OPERS - State/Local (beginning 1/1/17) 13.00% 1.00% 0.00% 14.00% 10.00%OPERS - Law Enforcement (through 12/31/16) 16.10% 2.00% 0.00% 18.10% 13.00%OPERS - Law Enforcement (beginning 1/1/17) 17.10% 1.00% 0.00% 18.10% 13.00%
Employer Contribution Rate
Pension OPEB Pension OPEB
STRS 7,802,860$ 7,653,361$
OPERS 6,961,758 1,160,293 8,322,520
14,764,618$ 1,160,293$ 15,975,881$ -$
2018
Year Ended June 30
2017

Notes to Financial Statements
June 30, 2018 and 2017
40
Note 8 – Employment Benefit Plans (Continued)
Any member may retire who has (1) five years of service credit and attained age 60; (2) 25 years of service credit and attained age 55; or (3) 30 years of service credit regardless of age. Beginning August 1, 2015, eligibility requirements for an unreduced benefit will change. The maximum annual retirement allowance, payable for life, considers years of credited service, final average salary (3-5 years) and multiplying by a factor ranging from 2.2 percent to 2.6 percent with 0.1 percent incremental increases for years greater than 30-31, depending on retirement age. A defined benefit plan or combined plan member with five or more years of credited service who is determined to be disabled (illness or injury preventing individual’s ability to perform regular job duties for at least 12 months) may receive a disability benefit. Additionally, eligible survivors of members who die before service retirement may qualify for monthly benefits. New members on or after July 1, 2013 must have at least 10 years of qualifying service credit to apply for disability benefits. A death benefit of $1,000 is payable to the beneficiary of each deceased retired member who participated in the plan. Death benefit coverage up to $2,000 can be purchased by participants in all three of the plans. Various other benefits are available to members’ beneficiaries. STRS Ohio provides access to healthcare coverage to retirees who participated in the Defined Benefit or Combined Plans, and their dependents. Coverage under the current program includes hospitalization, physicians’ fees, prescription drugs, and partial reimbursement of monthly Medicare Part B premiums. Pursuant to the ORC, the State Teachers Retirement Board (the “Board”) has discretionary authority over how much, if any, of the healthcare costs will be absorbed by STRS Ohio. All benefit recipients pay a portion of the healthcare cost in the form of a monthly premium. OPERS – Plan benefits are established under Chapter 145 of the ORC, as amended by Substitute Senate Bill 343 in 2012. The requirements to retire depends on years of service (15 to 30 years) and from attaining the age of 48 to 62, depending on when the employee became a member. Members retiring before age 65 with less than 30 years service credit receive a percentage reduction in benefit. Member retirement benefits are calculated on a formula that considers years of service (15-30 years), age (48-62 years) and final average salary, using a factor ranging from 1.0 percent to 2.5 percent. A plan member who becomes disabled before age 60 or at any age, depending on when the member entered the plan, and has completed 60 contributing months is eligible for a disability benefit. A death benefit of $500 - $2,500 is determined by the number of years of service credit of the retiree. Benefits may transfer to a beneficiary upon death with 1.5 years of service credits with the plan obtained within the last 2.5 years, except for law enforcement and public safety personnel who are eligible immediately upon employment. Benefit terms provide for annual cost-of-living adjustments to each employee’s retirement allowance subsequent to the employee’s retirement date. The annual adjustment, if applicable, is 3 percent.

Notes to Financial Statements
June 30, 2018 and 2017
41
Note 8 – Employment Benefit Plans (Continued)
In addition to the pension benefits described above, Ohio Law provides that the University fund postretirement healthcare benefits to retirees and their dependents through employer contributions. The portion of employer contributions, for all employers, allocated to health care was 2.0 percent during calendar years 2017 and 2016. Net Pension Liability, Deferrals, and Pension Expense. At June 30, 2018 and 2017, the University reported a liability for its proportionate share of the net pension liability of STRS and OPERS. For the year ended June 30, 2018, the net pension liability was measured as of July 1, 2017 for the STRS plan and December 31, 2017 for the OPERS plan. For the year ended June 30, 2017, the net pension liability was measured as of July 1, 2016 for the STRS plan and December 31, 2016 for the OPERS plan. The total pension liability used to calculate the net pension liability was determined by an actuarial valuation as of those dates. The University’s proportion of the net pension liability was based on a projection of its long-term share of contributions to the pension plan relative to the projected contributions of all participating reporting units, actuarially determined.
For the years ended June 30, 2018 and 2017, the University recognized pension income of $32,847,940 and expense of $33,923,206, respectively. At June 30, 2018 and 2017, the University reported deferred outflows of resources and deferred inflows of resources related to pensions from the following sources:
MeasurementPlan Date 2018 2017 2018 2017
STRS 7/1 117,377,358$ 166,860,603$ 0.4941% 0.4985%OPERS 12/31 60,974,450$ 92,716,335$ 0.3936% 0.4095%
Net Pension Liability Proportionate Share

Notes to Financial Statements
June 30, 2018 and 2017
42
Note 8 – Employment Benefit Plans (Continued)
Amounts reported as deferred outflows of resources and deferred inflows of resources related to pensions will be recognized in pension expense as follows:
In addition, the contributions subsequent to the measurement date will be included as a reduction of the net pension liability in the next year (2019).
June 30, 2018
Deferred
Outflows of
Resources
Deferred
Inflows of
Resources
Differences between expected and actual experience 4,635,780$ (2,385,551)$ Changes of assumptions 33,118,207 - Net difference between projected and actual earnings on
pension plan investments - (17,252,783) Changes in proportion and differences between University
contributions and proprotionate share of contributions 289,995 (2,826,181) University contributions subsequent to the measurement date 11,859,675 -
Total49,903,657$ (22,464,515)$
June 30, 2017
Deferred
Outflows of
Resources
Deferred
Inflows of
Resources
Differences between expected and actual experience 6,885,341$ (689,542)$ Changes of assumptions 14,822,356 - Net difference between projected and actual earnings on
pension plan investments 27,774,594 - Changes in proportion and differences between University
contributions and proprotionate share of contributions 575,922 (136,613)
University contributions subsequent to the measurement date 11,819,658 -
Total61,877,871$ (826,155)$
Years Ending
June 30 Amount
2019 9,883,265$ 2020 8,158,298 2021 1,309,420 2022 (3,715,819) 2023 (19,209)
Thereafter (36,487)
Total 15,579,468$
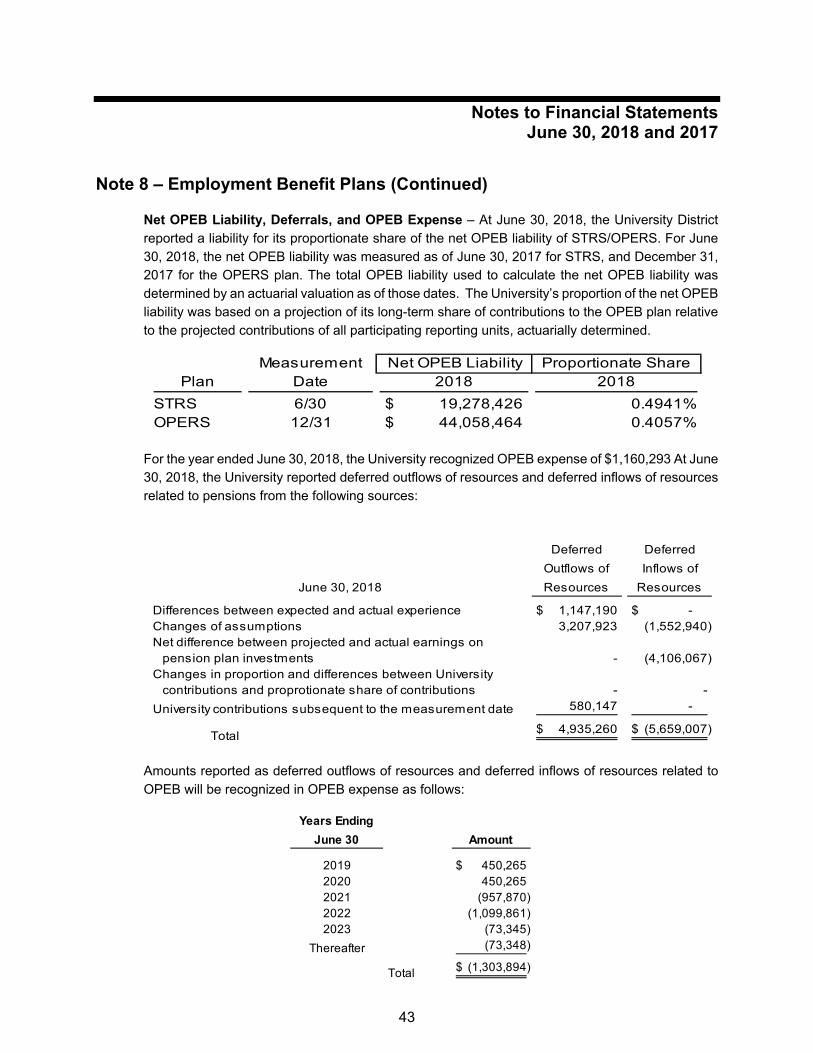
Notes to Financial Statements
June 30, 2018 and 2017
43
Note 8 – Employment Benefit Plans (Continued)
Net OPEB Liability, Deferrals, and OPEB Expense – At June 30, 2018, the University District reported a liability for its proportionate share of the net OPEB liability of STRS/OPERS. For June 30, 2018, the net OPEB liability was measured as of June 30, 2017 for STRS, and December 31, 2017 for the OPERS plan. The total OPEB liability used to calculate the net OPEB liability was determined by an actuarial valuation as of those dates. The University’s proportion of the net OPEB liability was based on a projection of its long-term share of contributions to the OPEB plan relative to the projected contributions of all participating reporting units, actuarially determined.
For the year ended June 30, 2018, the University recognized OPEB expense of $1,160,293 At June 30, 2018, the University reported deferred outflows of resources and deferred inflows of resources related to pensions from the following sources:
Amounts reported as deferred outflows of resources and deferred inflows of resources related to OPEB will be recognized in OPEB expense as follows:
Measurement Net OPEB Liability Proportionate SharePlan Date 2018 2018
STRS 6/30 19,278,426$ 0.4941%OPERS 12/31 44,058,464$ 0.4057%
June 30, 2018
Deferred
Outflows of
Resources
Deferred
Inflows of
Resources
Differences between expected and actual experience 1,147,190$ -$ Changes of assumptions 3,207,923 (1,552,940) Net difference between projected and actual earnings on
pension plan investments - (4,106,067) Changes in proportion and differences between University
contributions and proprotionate share of contributions - -
University contributions subsequent to the measurement date 580,147 -
Total4,935,260$ (5,659,007)$
Years Ending
June 30 Amount
2019 450,265$ 2020 450,265 2021 (957,870) 2022 (1,099,861) 2023 (73,345)
Thereafter (73,348)
Total (1,303,894)$

Notes to Financial Statements
June 30, 2018 and 2017
44
Note 8 – Employment Benefit Plans (Continued)
Actuarial Assumptions. The total pension liability and OPEB liability is based on the results of an actuarial valuation determined using the following actuarial assumptions for 2017, applied to all periods included in the measurement on June 30, 2018:
The following are actuarial assumptions for 2016, applied to all periods included in the measurement on June 30, 2017:
Discount Rate. The discount rates used to measure the total pension liabilities at June 30, 2018 were 7.45 percent and 7.50 percent for STRS and OPERS, respectively. The discount rate used to measure the total pension liabilities at June 30, 2017 were 7.75 percent and 7.50 percent for STRS and OPERS, respectively. The projection of cash flows used to determine the discount rate assumed that employee contributions will be made at the current contribution rate and that employer contributions will be made at contractually required rates for all plans. Based on those assumptions, each pension plan’s fiduciary net position was projected to be available to make all projected future benefit payments for current active and inactive employees. Therefore, the long-term expected rate of return on pension plan investments was applied to all periods of projected benefit payments to determine the total pension liability.
STRS as of June 30, 2017 OPERS as of December 31, 2017
Valuation date-Pension July 1, 2017 December 31, 2017Valuation date-OPEB June 30, 2017 December 31, 2016Actuarial cost method Entry age normal Individual entry ageCosts of living None 3.0 percentSalary increases, including inflation 2.50 percent - 12.50 percent 3.25 percent - 10.75 percentInflation 2.75 percent 3.25 percent Investment rate of return-Pension 7.45 percent, net of pension plan
investment expense7.50 percent, net of pension planinvestment expense
Investment rate of return-OPEB 4.51 percent, net of investment expense, including inflation
6.50 percent, net of planinvestment expense
Health care cost trend rates 6.00 percent to 11.00 percent initial 7.50 percent initial4.50 percent ultimate 3.25 percent ultimate in 2028
Experience study date Period of 5 years ended June 30, 2016 Period of 5 years ended December 31, 2015Morality basis RP-2014 Annuitant Mortality Table with
50% of rates through age 69, 70% of rates between 70 and 79, 90% of rates between ages 80 and 84, and 100% of rates thereafter, projected forward generationally using mortality improvement scale MP-2016 RP-2014 Healthy Annuitant Mortality Table
STRS as of June 30, 2016 OPERS as of December 31, 2016
Valuation date July 1, 2016 December 31, 2016Actuarial cost method Entry age normal Individual entry ageCosts of living 2.0 percent 3.0 percentSalary increases, including inflation 2.75 percent - 12.25 percent 3.25 percent - 10.75 percentInflation 2.75 percent 3.25 percent Investment rate of return 7.75 percent, net of pension plan
investment expense7.50 percent, net of pension planinvestment expense
Experience study date Period of 5 years ended July 1, 2012 Period of 5 years ended December 31, 2015Morality basis RP-2000 Combined Mortality Table
(Projection 2022-Scale AA) RP-2014 Healthy Annuitant Mortality Table
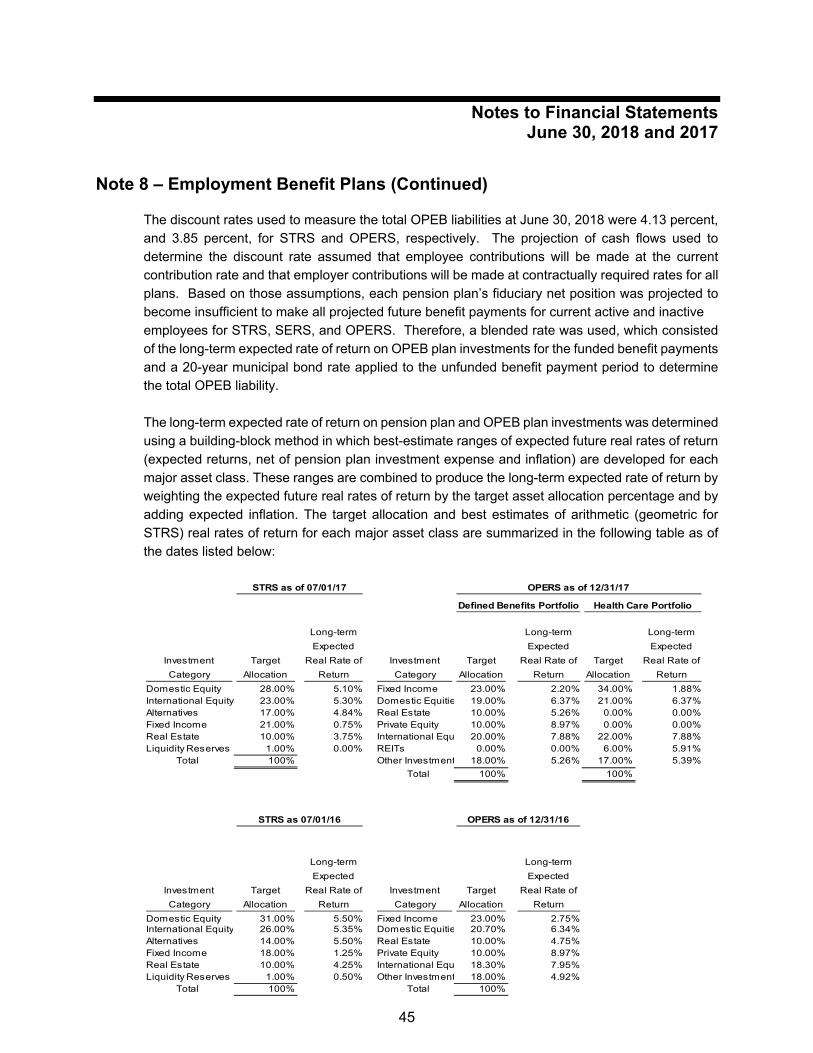
Notes to Financial Statements
June 30, 2018 and 2017
45
Note 8 – Employment Benefit Plans (Continued)
The discount rates used to measure the total OPEB liabilities at June 30, 2018 were 4.13 percent, and 3.85 percent, for STRS and OPERS, respectively. The projection of cash flows used to determine the discount rate assumed that employee contributions will be made at the current contribution rate and that employer contributions will be made at contractually required rates for all plans. Based on those assumptions, each pension plan’s fiduciary net position was projected to become insufficient to make all projected future benefit payments for current active and inactive employees for STRS, SERS, and OPERS. Therefore, a blended rate was used, which consisted of the long-term expected rate of return on OPEB plan investments for the funded benefit payments and a 20-year municipal bond rate applied to the unfunded benefit payment period to determine the total OPEB liability. The long-term expected rate of return on pension plan and OPEB plan investments was determined using a building-block method in which best-estimate ranges of expected future real rates of return (expected returns, net of pension plan investment expense and inflation) are developed for each major asset class. These ranges are combined to produce the long-term expected rate of return by weighting the expected future real rates of return by the target asset allocation percentage and by adding expected inflation. The target allocation and best estimates of arithmetic (geometric for STRS) real rates of return for each major asset class are summarized in the following table as of the dates listed below:
Investment
Category
Target
Allocation
Long-term
Expected
Real Rate of
Return
Investment
Category
Target
Allocation
Long-term
Expected
Real Rate of
Return
Target
Allocation
Long-term
Expected
Real Rate of
Return
Domestic Equity 28.00% 5.10% Fixed Income 23.00% 2.20% 34.00% 1.88%International Equity 23.00% 5.30% Domestic Equitie 19.00% 6.37% 21.00% 6.37%Alternatives 17.00% 4.84% Real Estate 10.00% 5.26% 0.00% 0.00%Fixed Income 21.00% 0.75% Private Equity 10.00% 8.97% 0.00% 0.00%Real Estate 10.00% 3.75% International Equ 20.00% 7.88% 22.00% 7.88%Liquidity Reserves 1.00% 0.00% REITs 0.00% 0.00% 6.00% 5.91%
Total 100% Other Investment 18.00% 5.26% 17.00% 5.39%
Total 100% 100%
Investment
Category
Target
Allocation
Long-term
Expected
Real Rate of
Return
Investment
Category
Target
Allocation
Long-term
Expected
Real Rate of
Return
Domestic Equity 31.00% 5.50% Fixed Income 23.00% 2.75%International Equity 26.00% 5.35% Domestic Equitie 20.70% 6.34%Alternatives 14.00% 5.50% Real Estate 10.00% 4.75%Fixed Income 18.00% 1.25% Private Equity 10.00% 8.97%Real Estate 10.00% 4.25% International Equ 18.30% 7.95%Liquidity Reserves 1.00% 0.50% Other Investment 18.00% 4.92%
Total 100% Total 100%
STRS as of 07/01/17
STRS as 07/01/16
OPERS as of 12/31/17
Defined Benefits Portfolio Health Care Portfolio
OPERS as of 12/31/16
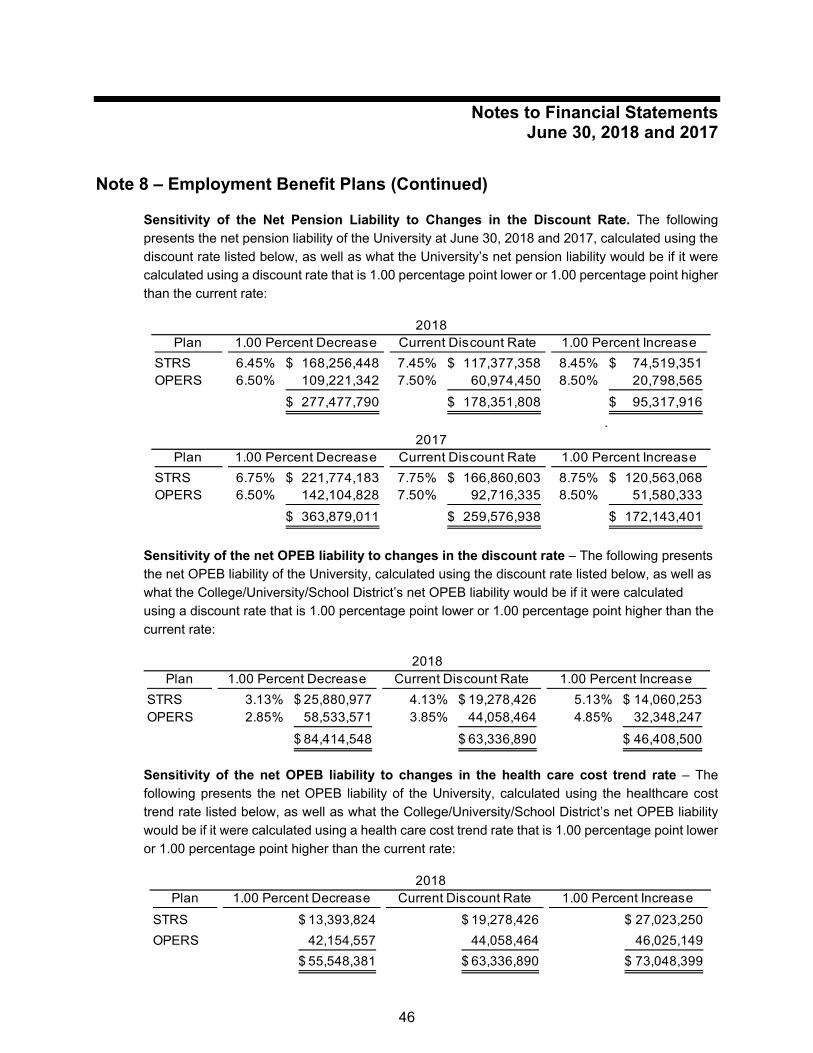
Notes to Financial Statements
June 30, 2018 and 2017
46
Note 8 – Employment Benefit Plans (Continued)
Sensitivity of the Net Pension Liability to Changes in the Discount Rate. The following presents the net pension liability of the University at June 30, 2018 and 2017, calculated using the discount rate listed below, as well as what the University’s net pension liability would be if it were calculated using a discount rate that is 1.00 percentage point lower or 1.00 percentage point higher than the current rate:
Sensitivity of the net OPEB liability to changes in the discount rate – The following presents the net OPEB liability of the University, calculated using the discount rate listed below, as well as what the College/University/School District’s net OPEB liability would be if it were calculated using a discount rate that is 1.00 percentage point lower or 1.00 percentage point higher than the current rate:
Sensitivity of the net OPEB liability to changes in the health care cost trend rate – The following presents the net OPEB liability of the University, calculated using the healthcare cost trend rate listed below, as well as what the College/University/School District’s net OPEB liability would be if it were calculated using a health care cost trend rate that is 1.00 percentage point lower or 1.00 percentage point higher than the current rate:
Plan
STRS 6.45% 168,256,448$ 7.45% 117,377,358$ 8.45% 74,519,351$ OPERS 6.50% 109,221,342 7.50% 60,974,450 8.50% 20,798,565
277,477,790$ 178,351,808$ 95,317,916$
.
Plan
STRS 6.75% 221,774,183$ 7.75% 166,860,603$ 8.75% 120,563,068$ OPERS 6.50% 142,104,828 7.50% 92,716,335 8.50% 51,580,333
363,879,011$ 259,576,938$ 172,143,401$
2018
20171.00 Percent Decrease Current Discount Rate 1.00 Percent Increase
1.00 Percent Decrease Current Discount Rate 1.00 Percent Increase
Plan
STRS 3.13% 25,880,977$ 4.13% 19,278,426$ 5.13% 14,060,253$ OPERS 2.85% 58,533,571 3.85% 44,058,464 4.85% 32,348,247
84,414,548$ 63,336,890$ 46,408,500$
20181.00 Percent Decrease Current Discount Rate 1.00 Percent Increase
Plan
STRS 13,393,824$ 19,278,426$ 27,023,250$
OPERS 42,154,557 44,058,464 46,025,149
55,548,381$ 63,336,890$ 73,048,399$
1.00 Percent Decrease Current Discount Rate 1.00 Percent Increase2018

Notes to Financial Statements
June 30, 2018 and 2017
47
Note 8 – Employment Benefit Plans (Continued)
Assumption Changes. During the current measurement period, the STRS Board adopted certain assumption changes which impacted the annual actuarial valuations prepared as of June 30, 2017. The most significant change is a reduction in the discount rate from 7.75 percent to 7.45 percent. Pension Plan Fiduciary Net Position. Detailed information about the pension plan’s fiduciary net position is available in the separately issued STRS/OPERS financial report. Payable to the Pension Plan. At June 30, 2018, the University reported a payable of $2,034,690 for the outstanding amount of contributions to the pension plans required for the year ended June 30, 2018. Defined Contribution Plan The University also offers eligible employees an alternative retirement program (ARP). The ARP is a defined contribution pension plan, under IRS Section 401(a), and established by Ohio Amended Substitute House Bill 586 (ORC 3305.02) on March 31, 1998, for public institutions of higher education. Full-time employees are eligible to choose a provider, in lieu of STRS or OPERS, from the list of providers currently approved by the Ohio Department of Insurance and who hold agreements with the University. Employee and employer contributions equal to those required by STRS and OPERS are required for the ARP, less any amounts required to be remitted to the state retirement system in which the employee would otherwise have been enrolled. Eligible employees have 120 days from their date of hire to make an irrevocable election to participate in the ARP. Under this plan, employees who would have otherwise been required to be in STRS or OPERS, and who elect to participate in the ARP, must contribute the employee’s share of retirement contributions to one of the private providers approved by the Ohio Department of Insurance. The legislation mandates that the employer must contribute an amount to the state retirement system to which the employee would have otherwise belonged, based on an independent actuarial study commissioned by the Ohio Retirement Study Council and submitted to the Ohio Board of Regents.
The University is required to contribute to STRS 4.50% of earned compensation for those employees participating in the ARP. The University’s contributions for the years ended June 30, 2018 and 2017 were $728,899 and $736,488, respectively, which equal 4.5% of earned compensation. STRS also offers a defined contribution plan in addition to its long-established defined benefit plan. All employee contributions and employer contributions at a rate of 10.5% are placed in an investment account directed by the employee. Disability benefits are limited to the employee’s account balance. Employees electing the defined contribution plan receive no postretirement healthcare benefits.

Notes to Financial Statements
June 30, 2018 and 2017
48
Note 8 – Employee Benefit Plans (Continued)
OPERS also offers a defined contribution plan, the Member-Directed Plan (MD). The MD plan does not provide disability benefits, annual cost-of-living adjustments, postretirement healthcare benefits or death benefits to plan members and beneficiaries. Benefits are entirely dependent on the sum of contributions and investment returns earned by each participant’s choice of investment options.
Note 9 – Risk Management
The University is exposed to various risks of loss related to torts; theft of, damage to, and destruction of assets; errors and omissions; injuries to employees; and natural disasters. On July 1, 1993, the University joined with 11 other State-assisted universities in Ohio to form an insurance-purchasing pool for the acquisition of commercial property and casualty insurance. The University pays annual premiums to the pool for its property and casualty insurance coverage based on its percentage of the total insurable value to the pool. Future contributions will be adjusted based upon each university’s loss history. Each university has a base deductible of $100,000. The next $250,000 of any one claim is the responsibility of the pool, which has a total annual aggregate deductible limit of $700,000. The commercial property insurer is liable for the amount of any claim in excess of $350,000, or $100,000 in the event the pool has reached its annual limit. There were no significant reductions in coverage from the prior year.
The University maintains a self-insured medical plan for its employees. The University’s risk exposure is limited to claims incurred. There is a $250,000 specific stop loss for any given individual. The changes in the total liability for actual and estimated medical claims for the years ended June 30, 2017 and 2016 are summarized below:
Medical claims are based upon estimates of the claims liabilities. Estimates are based upon past experience, medical inflation trends, and current claims outstanding, including year-end lag analysis. Differences between the estimated claims payable and actual claims paid are reported as an operating expense in the statement of revenue, expenses, and changes in net position. The University participates in a State pool of agencies and universities that pays workers’ compensation premiums into the State Insurance Fund on a pay-as-you-go basis (the Plan), which pays workers’ compensation benefits to beneficiaries who have been injured on the job. Losses from asserted and unasserted claims for the participating state agencies and universities in the Plan are accrued by the Ohio Bureau of Workers’ Compensation (the “Bureau”) based on estimates
2018 2017 2016
Liability - Beginning of year 3,487,608$ 3,208,620$ 2,398,878$ Claims incurred 16,580,970 15,804,991 14,259,729 Claims paid (16,580,425) (17,858,558) (13,487,190)
IBNR - (Decrease) Increase in estimated claims (1,359,555) 1,894,471 37,203
Liability - End of year2,128,598$ 3,049,524$ 3,208,620$

Notes to Financial Statements
June 30, 2018 and 2017
49
Note 9 – Risk Management (Continued)
that incorporate past experience, as well as other considerations including the nature of each claim or incident and relevant trend factors. Participants in the Plan annually fund the workers’ compensation liability based on rates set by the Bureau to collect cash needed in subsequent fiscal years to pay the workers’ compensation claims of participating State agencies and universities. Settled claims resulting from these risks have not exceeded insurance coverage in any of the past three fiscal years. During the normal course of its operations, the University has become a defendant in various legal actions. It is not possible to estimate the outcome of these legal actions; however, in the opinion of legal counsel and the University administration, the disposition of these pending cases will not have a material adverse effect on the financial condition or operations of the University. Settled claims resulting from these risks have not exceeded insurance coverage in any of the past three fiscal years.
Note 10 – Grant Contingencies
The University receives significant financial assistance from numerous federal, state, and local agencies in the form of grants. The disbursement of funds received under these programs generally requires compliance with terms and conditions specified in the grant agreements and are subject to audit by the grantor agencies. Any disallowed claims resulting from such audits could become a liability of the University. However, in the opinion of the University administration, any such disallowed claims will not have a significant effect on any of the financial statements of the University at June 30, 2018.
Note 11 – Component Units
The Foundation and the Corporation are legally separate not-for-profit entities organized for the purpose of providing support to the University. Both the Foundation and the Corporation are exempt from federal income taxes under Section 501(c)(3) of the Internal Revenue Code. The Foundation acts primarily as a fundraising organization to supplement the resources that are available to the University in support of its programs. The board of the Foundation is self-perpetuating and consists of business leaders and friends of the University. Although the University does not control the timing or amount of receipts from the Foundation, the majority of resources, or income thereon, that the Foundation holds and invests are restricted to the activities of the University by donors. Because these restricted resources held by the Foundation can only be used by, or for the benefit of, the University, the Foundation is considered a component unit of the University and is discretely presented in the University’s financial statements. Complete financial statements for the Foundation can be obtained from the Office of the Executive Director at 1836 Euclid Avenue, Union Building Room 501, Cleveland, OH 44115-2214.

Notes to Financial Statements
June 30, 2018 and 2017
50
Note 11 – Component Units (Continued)
During the years ended June 30, 2018 and 2017, the Foundation paid $14,452,494 and $14,168,449, respectively, to the University. At June 30, 2018 and 2017, the University had receivables from the Foundation totaling $3,187,534 and $2,902,771, respectively. As authorized by the board of trustees, beginning in fiscal year 1998, the University placed Endowment and Quasi-Endowment funds on deposit with the Foundation for investment. At June 30, 2018 and 2017, the amount on deposit with the Foundation totaled $3,420,465 and $3,329,145, respectively. The Foundation had the following types of investments as of June 30:
Cost Carrying Value
Cash and cash equivalents 92,782$ 92,782$ Stocks - Domestic 492,523 783,846 Mutual funds - International 12,996,380 16,068,960 Mutual funds - Domestic 32,030,760 39,831,519 Balance fund 5,380,138 5,488,253 Fixed income securities 16,587,032 16,020,471
Alternative investments 10,025,000 11,598,053
Investments carried at fair value 77,604,615$ 89,883,884$
Cost Carrying Value
Cash and cash equivalents 116,400$ 116,400$ Stocks - Domestic 432,695 566,388 Mutual funds - International 12,759,195 14,829,308 Mutual funds - Domestic 22,819,869 32,564,261 Balance fund 5,141,031 5,209,372 Fixed income securities 16,669,081 16,522,847
Alternative investments 11,275,000 13,547,202
Investments carried at fair value 69,213,271$ 83,355,778$
2018
2017

Notes to Financial Statements
June 30, 2018 and 2017
51
Note 11 – Component Units (Continued)
Financial assets measured at fair value on a recurring basis consisted of the following as of June 30:
The temporarily and permanently restricted net assets of the Foundation are balances whose use by the Foundation has been limited by the donors to a specific time period or purpose. Temporarily restricted net assets are available, and permanently restricted net assets are held in perpetuity, for the following purposes as of June 30:
2018Level 1 Level 2 Level 3 Total
Common stocks 783,846$ -$ -$ 783,846$ Mutual funds - International 16,068,960 - - 16,068,960 Mutual funds - Domestic 39,831,519 - - 39,831,519 Balanced fund 5,488,253 - - 5,488,253 Fixed income - 16,020,471 - 16,020,471
Alternative investments - - - -
62,172,578$ 16,020,471$ -$ 78,193,049
Investments valued at NAV 11,598,053
Total 89,791,102$
2017Level 1 Level 2 Level 3 Total
Common stocks 566,388$ -$ -$ 566,388$ Mutual funds - International 14,829,308 - - 14,829,308 Mutual funds - Domestic 32,564,261 - - 32,564,261 Balanced fund 5,209,372 - - 5,209,372 Fixed income - 16,522,847 - 16,522,847
Alternative investments 23,947 - 13,523,255 13,547,202
Total 53,193,276$ 16,522,847$ 13,523,255$ 83,239,378$
Temporarily
Restricted
Permanently
Restricted
Instruction and academic support 8,725,930$ 15,030,845$ Research 666,495 886,776 Public service 5,187,166 153,909 Financial aid 21,311,709 45,050,227 Institutional support 544,897 1,151,100 Restricted for time 5,212,364 -
Capital and other projects 163,878 979,762
Total 41,812,439$ 63,252,619$
Temporarily
Restricted
Permanently
Restricted
Instruction and academic support 5,804,161$ 13,048,404$ Research 1,087,245 381,931 Public service 5,114,375 152,834 Financial aid 21,327,985 45,333,326 Institutional support 1,239,972 1,151,100 Capital and other projects 2,991,291 978,161
Total 37,565,029$ 61,045,756$
2018
2017
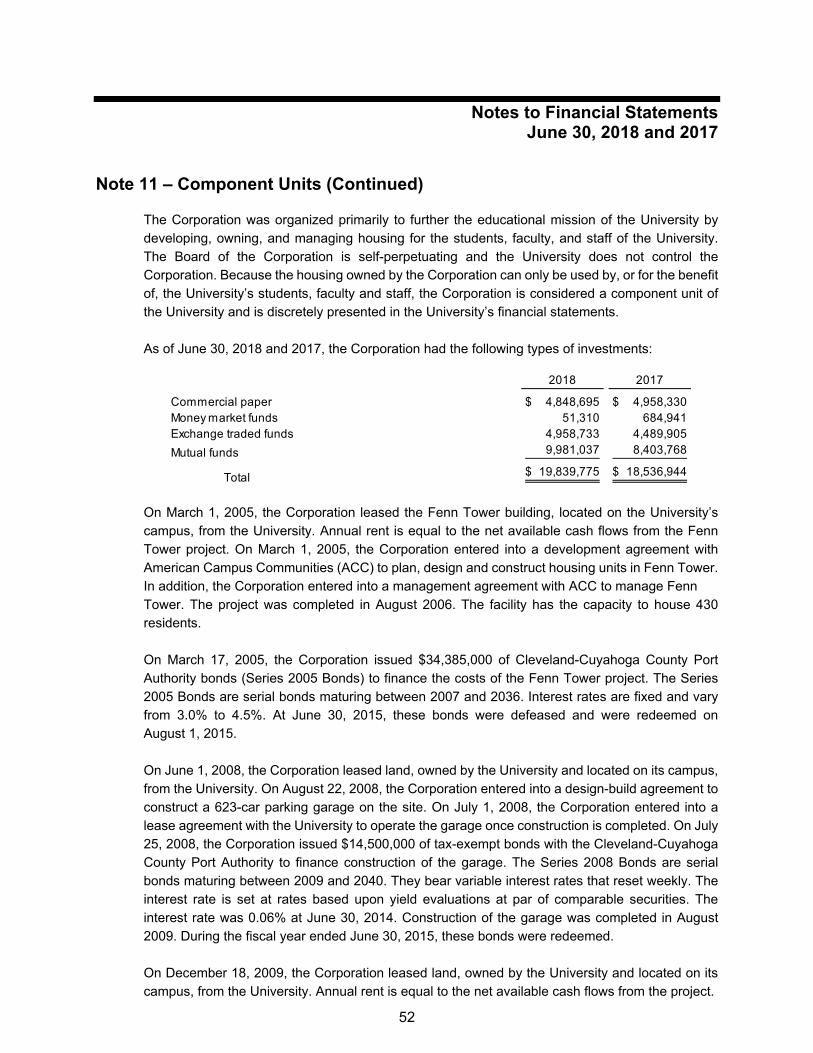
Notes to Financial Statements
June 30, 2018 and 2017
52
Note 11 – Component Units (Continued)
The Corporation was organized primarily to further the educational mission of the University by developing, owning, and managing housing for the students, faculty, and staff of the University. The Board of the Corporation is self-perpetuating and the University does not control the Corporation. Because the housing owned by the Corporation can only be used by, or for the benefit of, the University’s students, faculty and staff, the Corporation is considered a component unit of the University and is discretely presented in the University’s financial statements. As of June 30, 2018 and 2017, the Corporation had the following types of investments:
On March 1, 2005, the Corporation leased the Fenn Tower building, located on the University’s campus, from the University. Annual rent is equal to the net available cash flows from the Fenn Tower project. On March 1, 2005, the Corporation entered into a development agreement with American Campus Communities (ACC) to plan, design and construct housing units in Fenn Tower. In addition, the Corporation entered into a management agreement with ACC to manage Fenn Tower. The project was completed in August 2006. The facility has the capacity to house 430 residents. On March 17, 2005, the Corporation issued $34,385,000 of Cleveland-Cuyahoga County Port Authority bonds (Series 2005 Bonds) to finance the costs of the Fenn Tower project. The Series 2005 Bonds are serial bonds maturing between 2007 and 2036. Interest rates are fixed and vary from 3.0% to 4.5%. At June 30, 2015, these bonds were defeased and were redeemed on August 1, 2015. On June 1, 2008, the Corporation leased land, owned by the University and located on its campus, from the University. On August 22, 2008, the Corporation entered into a design-build agreement to construct a 623-car parking garage on the site. On July 1, 2008, the Corporation entered into a lease agreement with the University to operate the garage once construction is completed. On July 25, 2008, the Corporation issued $14,500,000 of tax-exempt bonds with the Cleveland-Cuyahoga County Port Authority to finance construction of the garage. The Series 2008 Bonds are serial bonds maturing between 2009 and 2040. They bear variable interest rates that reset weekly. The interest rate is set at rates based upon yield evaluations at par of comparable securities. The interest rate was 0.06% at June 30, 2014. Construction of the garage was completed in August 2009. During the fiscal year ended June 30, 2015, these bonds were redeemed. On December 18, 2009, the Corporation leased land, owned by the University and located on its campus, from the University. Annual rent is equal to the net available cash flows from the project.
2018 2017
Commercial paper 4,848,695$ 4,958,330$ Money market funds 51,310 684,941 Exchange traded funds 4,958,733 4,489,905
Mutual funds 9,981,037 8,403,768
Total 19,839,775$ 18,536,944$

Notes to Financial Statements
June 30, 2018 and 2017
53
Note 11 – Component Units (Continued)
On August 24, 2009, the Corporation entered into a development agreement with ACC to plan, design and construct 600 beds of student housing and a 300-car parking garage on this land. In addition, the Corporation entered into a management agreement with ACC to manage the student housing. On December 18, 2009, the Corporation issued $59,005,000 of County of Cuyahoga, Ohio bonds (Series 2009 bonds) to finance the project. The 2009 bonds are serial bonds maturing between 2011 and 2042. They bear variable interest rates that are reset weekly. The interest rate is set at rates based upon yield evaluations at par of comparable securities. The interest rate was 0.06% at June 30, 2014. Both phases of the project were complete as of August 2011. During fiscal year ended June 30, 2015, these bonds were redeemed. On December 9, 2014, the Corporation issued $88,945,000 of Cleveland-Cuyahoga County Port Authority Development Revenue Bonds (2014 bonds). A portion of the 2014 bonds matured August 1, 2015 with a fixed rate of interest of 1%. The remaining 2014 bonds mature at various dates from August 1, 2016 through August 1, 2044 with a fixed rate of interest of 5%. At the time of refunding, the Corporation chose to utilize funds held by the trustee to pay a portion of the outstanding principal on all existing bonds. During the years ended June 30, 2018 and 2017, the Corporation paid rent on the land leases in the amount of $400,000 and $400,000, respectively, to the University. Principal and interest payable for the next five years and in subsequent five-year increments are as follows:
Complete financial statements for the Corporation can be obtained from the Office of the Senior Vice President for Business Affairs and Finance at 2121 Euclid Avenue, Administration Center Room 210, Cleveland, OH 44115-2214.
Principal Interest
2019 1,660,000$ 4,179,250$ 2020 1,745,000 4,094,125 2021 1,830,000 4,004,750 2022 1,925,000 3,910,875 2023 2,025,000 3,812,125 2024-2028 11,790,000 17,392,750 2029-2033 15,145,000 14,042,375 2034-2038 19,445,000 9,740,125 2039-2043 20,415,000 4,550,125
2044-2045 8,435,000 427,125
84,415,000$ 66,153,625$
54
Required Supplemental Information
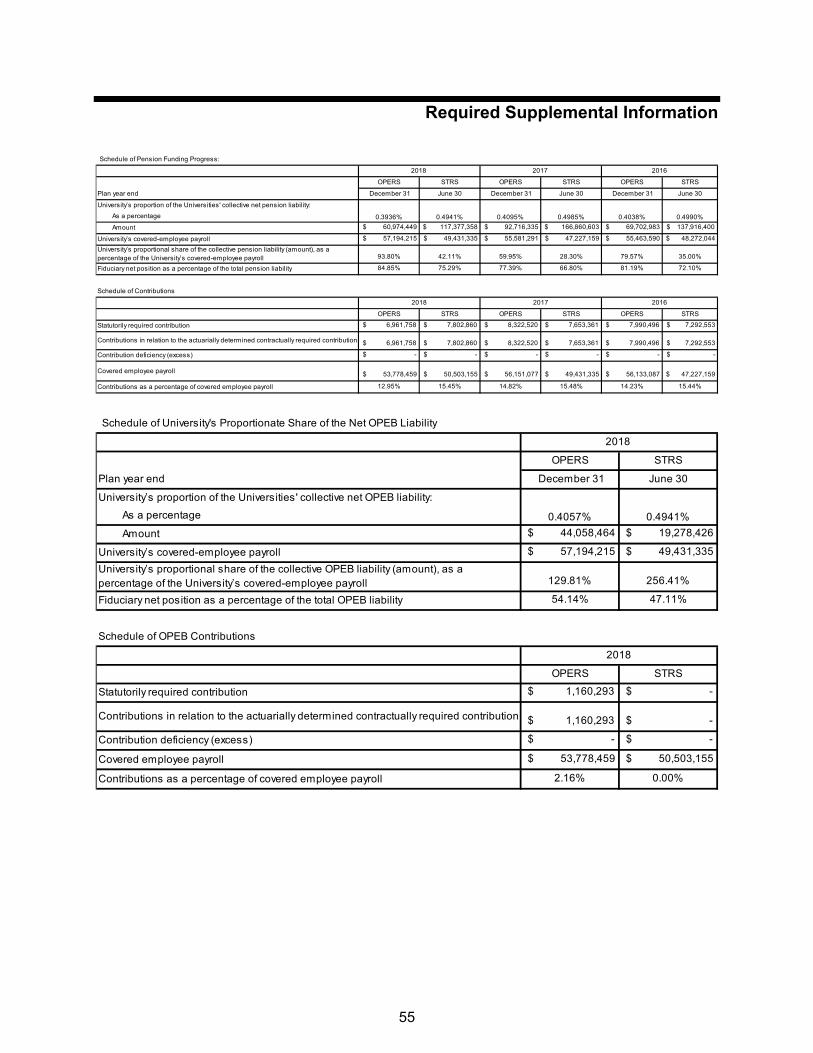
Required Supplemental Information
55
Schedule of Pension Funding Progress:
OPERS STRS OPERS STRS OPERS STRS
Plan year end December 31 June 30 December 31 June 30 December 31 June 30
University’s proportion of the Universities' collective net pension liability:
As a percentage
Amount $ 60,974,449 $ 117,377,358 $ 92,716,335 $ 166,860,603 $ 69,702,983 $ 137,916,400
University’s covered-employee payroll $ 57,194,215 $ 49,431,335 $ 55,581,291 $ 47,227,159 $ 55,463,590 $ 48,272,044
University’s proportional share of the collective pension liability (amount), as a percentage of the University’s covered-employee payroll 93.80% 42.11% 59.95% 28.30% 79.57% 35.00%
Fiduciary net position as a percentage of the total pension liability 84.85% 75.29% 77.39% 66.80% 81.19% 72.10%
Schedule of Contributions
OPERS STRS OPERS STRS OPERS STRS
Statutorily required contribution $ 6,961,758 $ 7,802,860 $ 8,322,520 $ 7,653,361 $ 7,990,496 $ 7,292,553
Contributions in relation to the actuarially determined contractually required contribution $ 6,961,758 $ 7,802,860 $ 8,322,520 $ 7,653,361 $ 7,990,496 $ 7,292,553
Contribution deficiency (excess) $ - $ - $ - $ - $ - $ -
Covered employee payroll $ 53,778,459 $ 50,503,155 $ 56,151,077 $ 49,431,335 $ 56,133,087 $ 47,227,159
Contributions as a percentage of covered employee payroll 12.95% 15.45% 14.82% 15.48% 14.23% 15.44%
2017
0.4095% 0.4985%
2017
2016
0.4038% 0.4990%
2016
2018
2018
0.3936% 0.4941%
Schedule of University's Proportionate Share of the Net OPEB Liability
OPERS STRS
Plan year end December 31 June 30
University’s proportion of the Universities' collective net OPEB liability:
As a percentage
Amount $ 44,058,464 $ 19,278,426
University’s covered-employee payroll $ 57,194,215 $ 49,431,335
University’s proportional share of the collective OPEB liability (amount), as a percentage of the University’s covered-employee payroll 129.81% 256.41%
Fiduciary net position as a percentage of the total OPEB liability 54.14% 47.11%
Schedule of OPEB Contributions
OPERS STRS
Statutorily required contribution $ 1,160,293 $ -
Contributions in relation to the actuarially determined contractually required contribution $ 1,160,293 $ -
Contribution deficiency (excess) $ - $ -
Covered employee payroll $ 53,778,459 $ 50,503,155
Contributions as a percentage of covered employee payroll 2.16% 0.00%
2018
2018
0.4057% 0.4941%

Required Supplemental Information
56
Notes to Required Supplemental Information June 30, 2018 and 2017
Changes in Benefit Terms. There were no changes in benefit terms affecting the STRS Ohio and OPERS plans for the plan years ended June 30, 2016 and December 31, 2016, respectively. Changes in Assumptions. During the plan year ended June 30, 2017, there were changes to several assumptions for STRS. The cost-of-living adjustment dropped from 2.00 percent to 0.00 percent. The wage inflation dropped from 2.75 percent to 2.50 percent. The investment rate of return decreased from 7.75 percent to 7.45 percent. The mortality tables used changed from RP-2000 to RP-2014. During the plan year ended December 31, 2016, there were changes to several assumptions for OPERS. The wage inflation dropped from 3.75 percent to 3.25 percent. The projected salary increase range changed from 4.25-10.05 percent to 3.25-10.75 percent. The mortality tables used changed from RP-2000 to RP-2014. Changes Between Measurement Date and Report Date. In March 2017, the STRS Ohio board adopted certain assumption changes which will impact their annual actuarial valuation prepared as of June 30, 2017. The most significant change is a reduction in the discount rate from 7.75 percent to 7.45 percent. In April 2017, the STRS Ohio board voted to suspend cost of living adjustments granted on or after July 1, 2017. Although the exact amount of these changes is not known, the overall impact to the University's net pension liability is expected to be significant.


![INDONESIA POSTCODE [E-L] - prangko.nl · jln.gunung payung.....garut 44115 jln.gunung putri, kel.ciwalen.....garut 44115](https://img.dokumen.tips/doc/110x75/5dd0842dd6be591ccb615e2b/indonesia-postcode-e-l-jlngunung-payunggarut-44115-jlngunung-putri-kelciwalengarut.jpg)


![Whirlpool Awe 2214 [ET]](https://img.dokumen.tips/doc/110x75/552aed114a795932118b45d7/whirlpool-awe-2214-et.jpg)

