Embed Size (px)
Citation preview

Welcome
Since deregulation in 1994, the British dairy industry has gone
through a period of rapid structural change. The number of dairy
farmers continues to fall and the ownership of processing facilities is
consolidating.
We want this industry to be strong, able to compete on world markets
and to face a new era brought about by CAP reform and trade
liberalisation.
�We must use de-coupling as a catalyst to drivea culture change in the way that dairy farmersthink about their businesses and the way that theindustry views itself. The initiative by the FoodChain Centre will help that process bydemonstrating the potential benefits that can bederived when dairy farmers, processors andretailers work together.�
TTiimm BBeennnneetttt,, PPrreessiiddeenntt,, NNFFUUCutting Costs - AddingValue in Dairy
June2005
Food Chain Centre at IGD Grange Lane Letchmore Heath Watford Herts WD25 8GD
Tel: 01923 857141 Fax: 01923 852531 Email: [email protected] www.foodchaincentre.com 2
�In the past, our industry has been criticised fortaking a fragmented approach to the challengesit faces. That has changed with the creation ofDairy UK. Dairy UK fully supports this initiativeand has been providing help and advice to theFood Chain Centre from the outset.�
JJiimm BBeegggg,, CChhiieeff EExxeeccuuttiivvee,, DDaaiirryy UUKK
�Government has made it quite clear that theindustry has to resolve its own problems. Theywill not nanny the farming community any longer.Thus there is a real need to foster a new spirit ofco-operation amongst dairy farmers and a newattitude to work with the dairy processors andsupermarkets�.
TTiimm BBrriiggssttoocckkee,, CChhaaiirrmmaann,, RRAABBDDFF
To compete better, the industry will need to be adept at introducing
new products and branding and niche marketing will have their parts
to play.
Food Chain Centre at IGD Grange Lane Letchmore Heath Watford Herts WD25 8GD
Tel: 01923 857141 Fax: 01923 852531 Email: [email protected] www.foodchaincentre.com 3
This Folder focuses on cost-competitiveness. It contains a mix of
material on business improvement and raising profitability
throughout the dairy chain.
The secret is to ‘think lean’ and eliminate waste in the supply chain.
Lean Thinking is a simple philosophy which states that supply chains
should dedicate themselves to satisfying consumers in the most
efficient way possible.
Lean Thinking is not an instant cure and requires hard work and
dedication. It is not revolutionary and is mainly common sense. But
is consistently delivers results.
The Food Chain Centre and the Red Meat Industry Forum (RMIF)
have proved the benefits in red meat where there is a potential for
cost savings of up to 10%.
From the initial chains that we have examined the potential for
significant cost savings in the dairy supply chain through greater
teamwork is already apparent. As a general rule, the more steps in
the chain, the more scope there is for savings.
Initial opportunities for cost-saving improvement that we have seen
include:
! Better feed management can reduce milk production costs forsome farmers;
! Order amplification for some products shows 10 times greatervariability than end consumer demand;
! Less than 4% of activity in some dairy chains is spent on valueadding operations (the rest is spent on non value adding time likesitting in a truck);
! Industry wide analysis has shown that food distribution lorriesspend only 28% of their time on the road and 20% of vehicle milesare empty;
! Retailers lose about 1.5% of their revenue through ‘shrinkage’ thatis theft and damage.

Food Chain Centre at IGD Grange Lane Letchmore Heath Watford Herts WD25 8GD
Tel: 01923 857141 Fax: 01923 852531 Email: [email protected] www.foodchaincentre.com 4
Assuming that these figures prove to be typical, we want to see the
British industry make big inroads into unnecessary cost and put it to
better use improving competitiveness and profitability.
Inside this Folder you will find an explanation of ‘Lean Thinking’, a
list of cost-saving opportunities, ‘best practice’ guidelines and case
studies that show how the theory works in practice.
Over the next 2 years we will build up the evidence by adding further
case studies to the Folder.

Acknowledgement
�In the past there have been clear inequalitieswithin the dairy supply chain which need to beresolved if the industry is to be sustainable andcompetitive in more liberalised marekts. Thismakes the whole of the supply chain mappingwork essential.�
KKeevviinn BBeellllaammyy,, CChhiieeff EExxeeccuuttiivvee,, MMDDCC
We thank the MDC for their assistance in funding this Folder.
Cutting Costs - AddingValue in Dairy
June2005

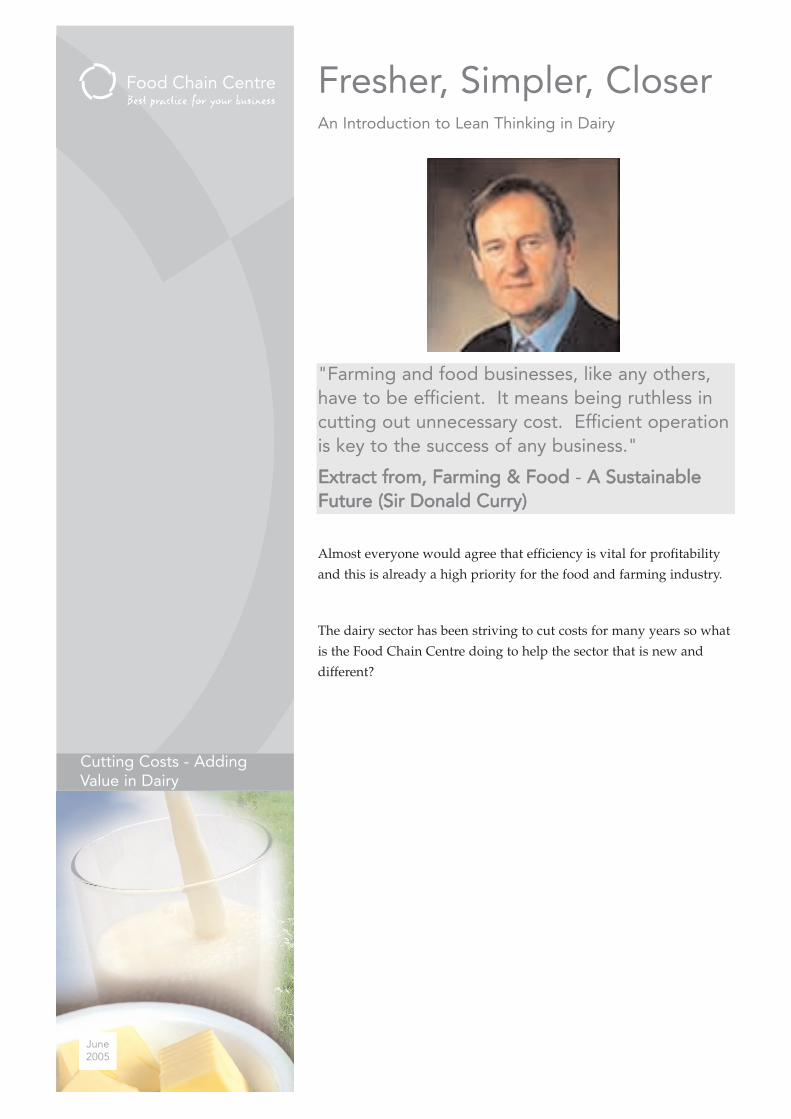
"Farming and food businesses, like any others,have to be efficient. It means being ruthless incutting out unnecessary cost. Efficient operationis key to the success of any business."
EExxttrraacctt ffrroomm,, FFaarrmmiinngg && FFoooodd - AA SSuussttaaiinnaabblleeFFuuttuurree ((SSiirr DDoonnaalldd CCuurrrryy))
Fresher, Simpler, CloserAn Introduction to Lean Thinking in Dairy
Almost everyone would agree that efficiency is vital for profitability
and this is already a high priority for the food and farming industry.
The dairy sector has been striving to cut costs for many years so what
is the Food Chain Centre doing to help the sector that is new and
different?
Cutting Costs - AddingValue in Dairy
June2005

Food Chain Centre at IGD Grange Lane Letchmore Heath Watford Herts WD25 8GD
Tel: 01923 857141 Fax: 01923 852531 Email: [email protected] www.foodchaincentre.com 2
"Lean thinking has been applied in manydifferent industries, helping to lower costs andimprove profits. The three words, 'fresher,simpler, closer', capture the idea of lean thinkingin the food chain."
PPrrooffeessssoorr DDaann JJoonneess,, FFoouunnddiinngg DDiirreeccttoorr ooff tthheeLLeeaann EEnntteerrpprriissee RReesseeaarrcchh CCeennttrree aanndd DDiirreeccttoorr oofftthhee LLeeaann EEnntteerrpprriissee AAccaaddeemmyy
Lean Thinking
Our approach is to test out the ideas and practice behind 'lean
thinking'.
Lean thinking provides a way to do more and more with less and less
- less human effort, less equipment, less time, and less space - while
coming closer and closer to providing consumers with exactly what
they want. In other words, we are focusing on stripping out the
waste from supply chains and focusing on the value.
The approach has been around for some time and is based on
practices first developed in the Japanese motor industry. However,
some of these ideas were borrowed and adapted from food retailing
and so the cycle of ideas continues to turn.
Lean thinking has become widespread in UK manufacturing and
according to a survey by McKinsey it is what sets apart the best
performing manufacturers.
Food Chain Centre at IGD Grange Lane Letchmore Heath Watford Herts WD25 8GD
Tel: 01923 857141 Fax: 01923 852531 Email: [email protected] www.foodchaincentre.com 3
Many companies that have embraced lean thinking have delivered
some dramatic improvements over a three year period including the
following:
! 90% reduction in defects
! 90% reduction in response time to customer orders
! 75% reduction in inventory
! 50% reduction in space
! 50% reduction in variable costs
Most recently the approach has been piloted among companies in the
red meat sector with similar results. That work has shown it is
possible to save at least 10% of the retail value through reductions in
cost and improvements in quality and service.
The Lean Enterprise Research Centre at Cardiff Business School is
world renowned in the application of lean thinking and their work
demonstrates that businesses can definitely use lean thinking to
improve profitability.
But lean thinking is not a quick fix or a "miracle cure". Instead, it
promotes continuous improvement in which businesses constantly
strive for better performance. As with any major initiative, it can only
work with the full support of senior management.
Application to the Dairy sector
Lean thinking may benefit manufacturing and has also been
successfully applied to other sectors including construction,
healthcare and raw materials. But can it help the dairy industry?
The dairy industry provides a wide range of consumer products.
Food Chain Centre at IGD Grange Lane Letchmore Heath Watford Herts WD25 8GD
Tel: 01923 857141 Fax: 01923 852531 Email: [email protected] www.foodchaincentre.com 4
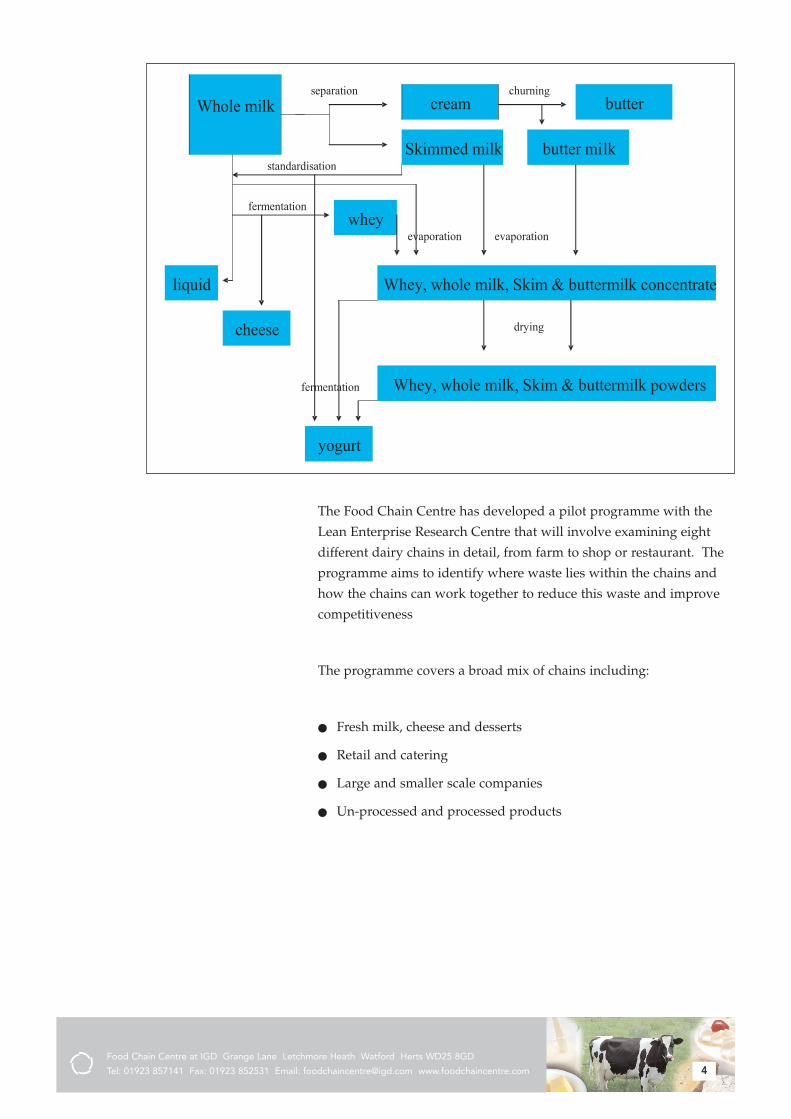
Whole milk
separation cream
Skimmed milk standardisation
churning butter
butter milk
Whey, whole milk, Skim & buttermilk concentrate
whey evaporationevaporation
fermentation
Whey, whole milk, Skim & buttermilk powders
drying
liquid
yogurt
cheese
fermentation
The Food Chain Centre has developed a pilot programme with the
Lean Enterprise Research Centre that will involve examining eight
different dairy chains in detail, from farm to shop or restaurant. The
programme aims to identify where waste lies within the chains and
how the chains can work together to reduce this waste and improve
competitiveness
The programme covers a broad mix of chains including:
! Fresh milk, cheese and desserts
! Retail and catering
! Large and smaller scale companies
! Un-processed and processed products
Food Chain Centre at IGD Grange Lane Letchmore Heath Watford Herts WD25 8GD
Tel: 01923 857141 Fax: 01923 852531 Email: [email protected] www.foodchaincentre.com 5
The dairy sector has some unique features that challenge the lean
approach. These include:
! The natural seasonal variation in milk production which results in
supply and demand imbalance.
! Some products which require a lengthy maturation cycle
! Considerable consolidation in the sector.
! A history of confrontation between different parts of the chain.
! The environmental factor - in that farming also maintains the
countryside and thereby serves a second industry, the tourist or
leisure sector.
But lean thinking is highly adaptable and we are optimistic that our
pilot projects will prove of value to dairy businesses right along the
chain.
Lean Projects
The Cardiff team are not typical consultants and they are not experts
in the dairy sector. But they are expert facilitators; they guide teams
drawn from businesses and help them see the chain in a new light.
Each project starts from a recognisable product that consumers
purchase, for example, fresh milk or cheese. Generally, more than one
business is involved in getting the product to market. We put a team
together drawn from each business and with support from a Cardiff
facilitator draw a 'process map' of the current state of affairs, making
sure to capture what is actually happening ('warts and all') and not
what is supposed to happen.
The chart captures two flows: orders travelling back from consumers
and the product travelling forwards from the raw materials, i.e. from
the farm.
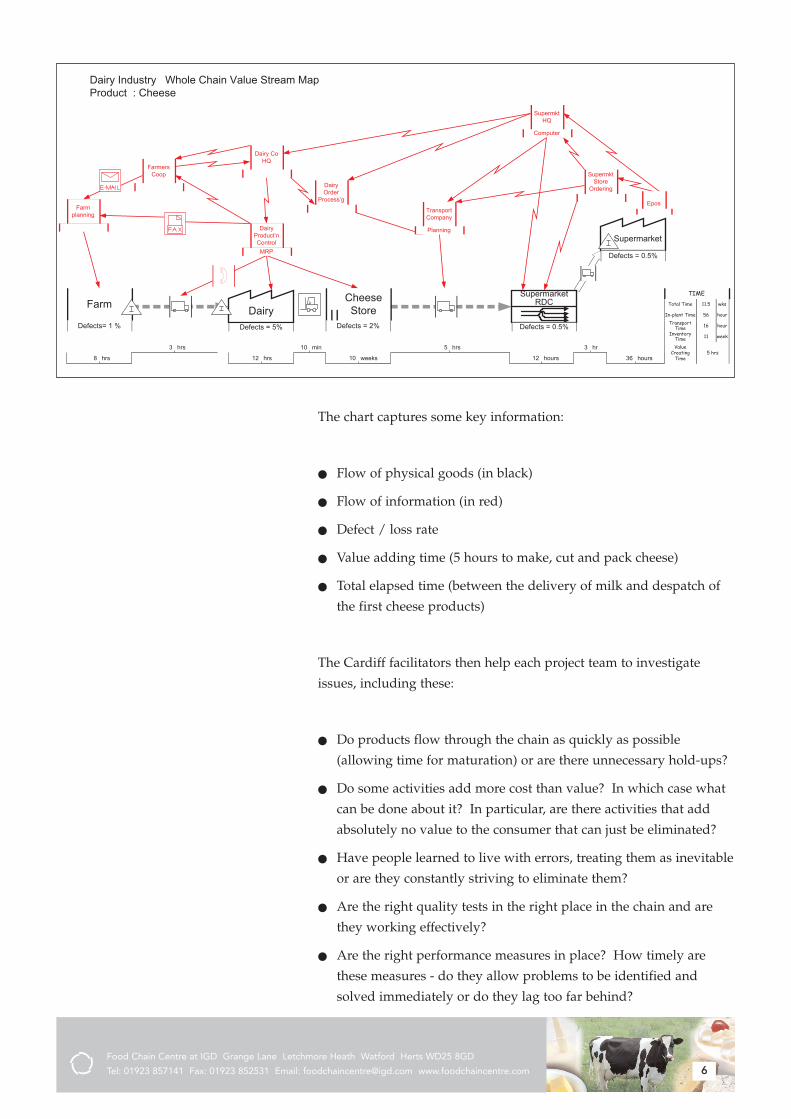
These charts can be very detailed and complicated. Here is a
simplified example, for a cheese processing plant also showing its
links with suppliers and customers.
Food Chain Centre at IGD Grange Lane Letchmore Heath Watford Herts WD25 8GD
Tel: 01923 857141 Fax: 01923 852531 Email: [email protected] www.foodchaincentre.com 6
Supermarket
CheeseStore
SupermarketRDC
DairyFarm
SupermktStore
Ordering
Computer
SupermktHQ
Planning
TransportCompany
MRP
DairyProduct�nControl
Dairy CoHQ
DairyOrder
Process�g
FarmersCoop
Farmplanning
Epos
3 hrs
8 hrs 12 hrs
10 min
10 weeks
5 hrs
12 hours
3 hr
36 hours
Dairy Industry Whole Chain Value Stream MapProduct : Cheese
TIMETotal Time wks11.5
In-plant Time hour56
InventoryTime week11
ValueCreating
Time5 hrs
TransportTime hour16Defects= 1 % Defects = 5% Defects = 2% Defects = 0.5%
Defects = 0.5%
The chart captures some key information:
! Flow of physical goods (in black)
! Flow of information (in red)
! Defect / loss rate
! Value adding time (5 hours to make, cut and pack cheese)
! Total elapsed time (between the delivery of milk and despatch of
the first cheese products)
The Cardiff facilitators then help each project team to investigate
issues, including these:
! Do products flow through the chain as quickly as possible
(allowing time for maturation) or are there unnecessary hold-ups?
! Do some activities add more cost than value? In which case what
can be done about it? In particular, are there activities that add
absolutely no value to the consumer that can just be eliminated?
! Have people learned to live with errors, treating them as inevitable
or are they constantly striving to eliminate them?
! Are the right quality tests in the right place in the chain and are
they working effectively?
! Are the right performance measures in place? How timely are
these measures - do they allow problems to be identified and
solved immediately or do they lag too far behind?
Food Chain Centre at IGD Grange Lane Letchmore Heath Watford Herts WD25 8GD
Tel: 01923 857141 Fax: 01923 852531 Email: [email protected] www.foodchaincentre.com 7
! When problems are identified, are they traced back to their source
and dealt with or do the same faults keep re-occurring?
! Is the right information shared along the chain? Is it accurate and
passed on quickly? How good are the sales forecasts? Do they
help suppliers plan their operations efficiently in advance?
! Are there any ordering and stock holding policies that impose
heavy costs on suppliers? For example, is a smooth pattern of
customer demand converted into a very lumpy pattern of orders?
The team then draws a second flowchart of how they would like the
chain to be in future, a more efficient chain without so much waste or
'leaking of money'. Finally, they draw up an action plan of how to
work in partnership to get there.
Improvement Opportunities
A huge variety of actions can arise from these projects but here are
some common examples drawn from previous work:
! Re-designing the layout of part of a factory or farm.
! Creating a team of engineers and operators to focus on reducing
faults at a particularly troublesome machine or process.
! Extra training to help staff become more versatile.
! Forums for customers and suppliers to work jointly on
improvement projects.
! Agreeing to exchange information that is currently treated as
secret.
! Collecting new performance measures and sharing these more
widely.
! Making better use of information technology.
! Working in partnership, to improve the accuracy of forecasts.
It is impossible to reach perfection in a single bound and so the follow
up to any project with Cardiff is a 'Continuous Improvement Plan'
aiming to revisit the issues and keep improving supply chain
performance.

Food Chain Centre at IGD Grange Lane Letchmore Heath Watford Herts WD25 8GD
Tel: 01923 857141 Fax: 01923 852531 Email: [email protected] www.foodchaincentre.com 8
Our Principles
The approach we are adopting to apply lean thinking in the dairy
sector is underpinned by a number of principles.
1. Think of the dairy process from milk production to consumer
purchase as a Value Chain
Most people are familiar with the term "Food Chain" - the series of
steps from 'farm to fork'. But the Food Chain is also sometimes
described as a Value Chain and this term is used to focus on the
financial equation.
As a product moves along the chain, it incurs cost but also rises in
value. If more value is added than cost, then the product is profitable
to supply. It follows that sustainable profits are achieved both by
maximising value and minimising cost.
All of the stages are inter-dependent (from calving to rearing through
milking to processing, transport, storage and retailing) and our
approach is to examine the whole chain as an opportunity for
improvement and not just the separate parts.
Management effort is traditionally focused down to a single
department or perhaps to a whole business that may produce many
different products. By taking a different view, that of a complete
chain for a particular product, many new improvement opportunities
may arise.
2. Put Consumers First
Value is determined by the consumer. Shoppers are the ones who
make the final decision on value when they select products from the
shelves.
Our second principle therefore is to put consumer needs to the
forefront of our thinking. We need to know what consumers see as
value, to understand what activities in the chain contribute in
delivering this value.
Food Chain Centre at IGD Grange Lane Letchmore Heath Watford Herts WD25 8GD
Tel: 01923 857141 Fax: 01923 852531 Email: [email protected] www.foodchaincentre.com 9
Value can be determined by putting yourself in the position of the
consumer and asking whether you would pay less for the product or
be less satisfied with it if a given step were left out?
Consumers see value in various product attributes. Each consumer
has a personal view of value. For example, some people will pay
more for extra-matured or organic cheese. This creates different
market segments.
3. Work in Partnership
All businesses can benefit if they co-operate in the joint management
of the value chain.
Many improvements can only be made if managers take a fresh look
at the whole chain, work in partnership across traditional boundaries
and commit to sharing the benefits.
Sharing of benefits is vital so that everyone wins (including
consumers), creating enthusiasm for the next round of improvements.
Trust is vital to this process. It can only be built gradually but can be
betrayed and destroyed in an instant.
4. Systematically Identify and Reduce Every Form of Waste
Lean thinking helps to track down the many ways that money is
currently wasted in the chain and points the way towards solutions.
A separate section in this pack itemises a long list of wastes in dairy
chains.
We define waste as any activity that adds costs without value. The
lean approach zooms in on wasteful activities and considers how to
reduce or eliminate the waste, preferably without any major
expenditure.
This is a continuous task, prioritising improvements and working
towards the hypothetical ideal of a completely efficient chain without
any form of waste.
Food Chain Centre at IGD Grange Lane Letchmore Heath Watford Herts WD25 8GD
Tel: 01923 857141 Fax: 01923 852531 Email: [email protected] www.foodchaincentre.com 10
Conclusion
There is nothing revolutionary or fiendishly clever about lean
thinking. It's really just the application of common sense. So why
can it be so powerful in practice? Because most people have to focus
on the day to day operations and rarely have the chance to take a step
back, re-assess the whole chain, apply some simple analysis, ask some
probing questions and consider 'is there a better way to run all of
this?'
When people follow this approach it is encouraging just how much
scope they normally find for improvement, even in the best run
businesses.
"We don't believe in saving cost by cuttingcorners, reducing quality, damaging theenvironment or exploiting any members of thechain. There are better ways to find savingsthrough the reduction of waste."
JJoonn WWoooollvveenn,, FFoooodd CChhaaiinn CCeennttrree DDiirreeccttoorr
So finally, a reminder as to why we call this approach 'Fresher,
Simpler, Closer'.
! Fresher because an efficient chain is fast-moving so that products
reach the shelf in peak condition.
! Simpler because an efficient chain is streamlined without any
unnecessary activities.
! Closer because an efficient chain in many cases reduces the
distance product is transported.
A fresher, simpler, closer dairy chain provides a better service for
consumers and can deliver higher profits for everyone concerned.
Where to Find Savingsin the Dairy Chain
Even the most streamlined dairy chains involve a large number of
activities in order to convert fresh milk into a range of dairy products
delivered to consumers. With such complexity involved, inevitably
the chain is not 100% efficient.
Inefficiency or waste is part of any supply chain. For example, about
a quarter of the UK's water supply is lost through leakage somewhere
in the system. For dairy, the leakage is financial and drains the
sector's profitability.
We use the term 'waste' in its broadest sense. We define it as the
excess use of any resource beyond that strictly necessary to create and
deliver products demanded by consumers. It applies to excess
materials, machines, land and labour.
Total wastage in dairy supply chains is extremely difficult to measure
because it stems from many different issues and spreads throughout
the diverse industry.
However, in our work on red meat we have found waste through the
chain equivalent to at least 10% of selling price.
Given that 'every problem also represents an opportunity', we view
this as encouraging. It demonstrates the scope to reduce costs and
raise profits if we can find new ways to eliminate waste, in particular
by working better together.
By combining observations drawn from Cardiff Business School's
initial projects, with the comments of various industry experts, we
have compiled an initial list of the 'top ten' supply chain
improvement opportunities for dairy.
Cutting Costs - AddingValue in Dairy
June2005
Food Chain Centre at IGD Grange Lane Letchmore Heath Watford Herts WD25 8GD
Tel: 01923 857141 Fax: 01923 852531 Email: [email protected] www.foodchaincentre.com 2
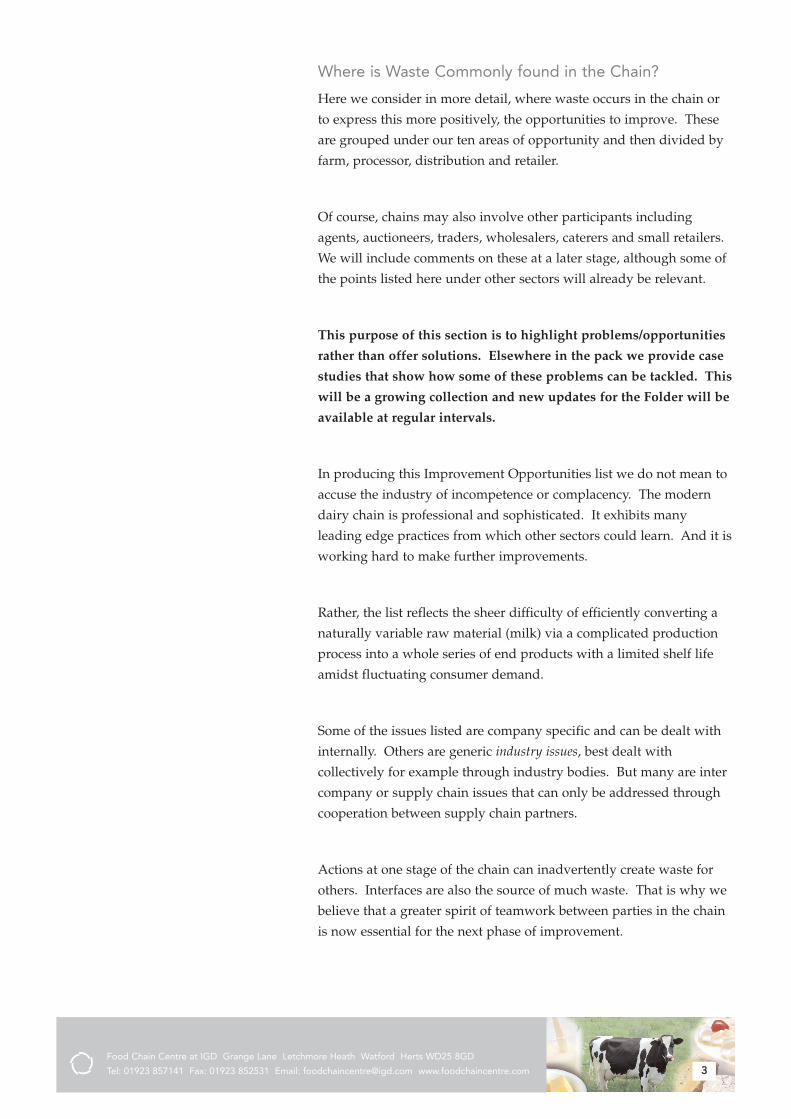
Ten Improvement Opportunities for Dairy
1. Balance product supply to end usage rates
2. Improve product quality
3. Streamline administration
4. Better management of forecasts
5. Reduce handling and movement
6. Improve layout of facilities
7. Optimise the use of equipment and inputs
8. Reduce the number of physical faults
9. Improve staff productivity
10.Reduce product wastage
These opportunities apply to the range of products produced by the
dairy chain as a whole.
Of course these issues are not new to the industry. Many solutions
have been tried and applied and many improvements have already
been made.
Nonetheless, significant waste still exists and new solutions are
needed to maintain progress. We contend that 'lean thinking' can
bring new momentum to these issues through the following
principles:
! Treat dairy as a Value Chain
! Take a 'consumer first' attitude at all points in the chain
! Work in partnership, sharing information and pooling expertise
! Systematically identify and eliminate the root causes of waste
! Establish 'whole chain' KPI's to monitor performance
The top ten list is in a rough priority order for the dairy industry and
chain as a whole, although this is only an estimate and certainly
varies from business to business.
Food Chain Centre at IGD Grange Lane Letchmore Heath Watford Herts WD25 8GD
Tel: 01923 857141 Fax: 01923 852531 Email: [email protected] www.foodchaincentre.com 3
Where is Waste Commonly found in the Chain?
Here we consider in more detail, where waste occurs in the chain or
to express this more positively, the opportunities to improve. These
are grouped under our ten areas of opportunity and then divided by
farm, processor, distribution and retailer.
Of course, chains may also involve other participants including
agents, auctioneers, traders, wholesalers, caterers and small retailers.
We will include comments on these at a later stage, although some of
the points listed here under other sectors will already be relevant.
This purpose of this section is to highlight problems/opportunities
rather than offer solutions. Elsewhere in the pack we provide case
studies that show how some of these problems can be tackled. This
will be a growing collection and new updates for the Folder will be
available at regular intervals.
In producing this Improvement Opportunities list we do not mean to
accuse the industry of incompetence or complacency. The modern
dairy chain is professional and sophisticated. It exhibits many
leading edge practices from which other sectors could learn. And it is
working hard to make further improvements.
Rather, the list reflects the sheer difficulty of efficiently converting a
naturally variable raw material (milk) via a complicated production
process into a whole series of end products with a limited shelf life
amidst fluctuating consumer demand.
Some of the issues listed are company specific and can be dealt with
internally. Others are generic industry issues, best dealt with
collectively for example through industry bodies. But many are inter
company or supply chain issues that can only be addressed through
cooperation between supply chain partners.
Actions at one stage of the chain can inadvertently create waste for
others. Interfaces are also the source of much waste. That is why we
believe that a greater spirit of teamwork between parties in the chain
is now essential for the next phase of improvement.

Food Chain Centre at IGD Grange Lane Letchmore Heath Watford Herts WD25 8GD
Tel: 01923 857141 Fax: 01923 852531 Email: [email protected] www.foodchaincentre.com 4
In producing this section, we have estimated the extent of waste
where possible but this is not easy. It varies greatly from business to
business. Some of the problems are not accurately measured. In
some cases, for some businesses, they may not occur at all.
You will probably be familiar with most of these issues and how they
affect your own sector. However, you may be less familiar with their
impact on others in the chain and we hope that this brief analysis
gives you a broader understanding.
Food Chain Centre at IGD Grange Lane Letchmore Heath Watford Herts WD25 8GD
Tel: 01923 857141 Fax: 01923 852531 Email: [email protected] www.foodchaincentre.com 5
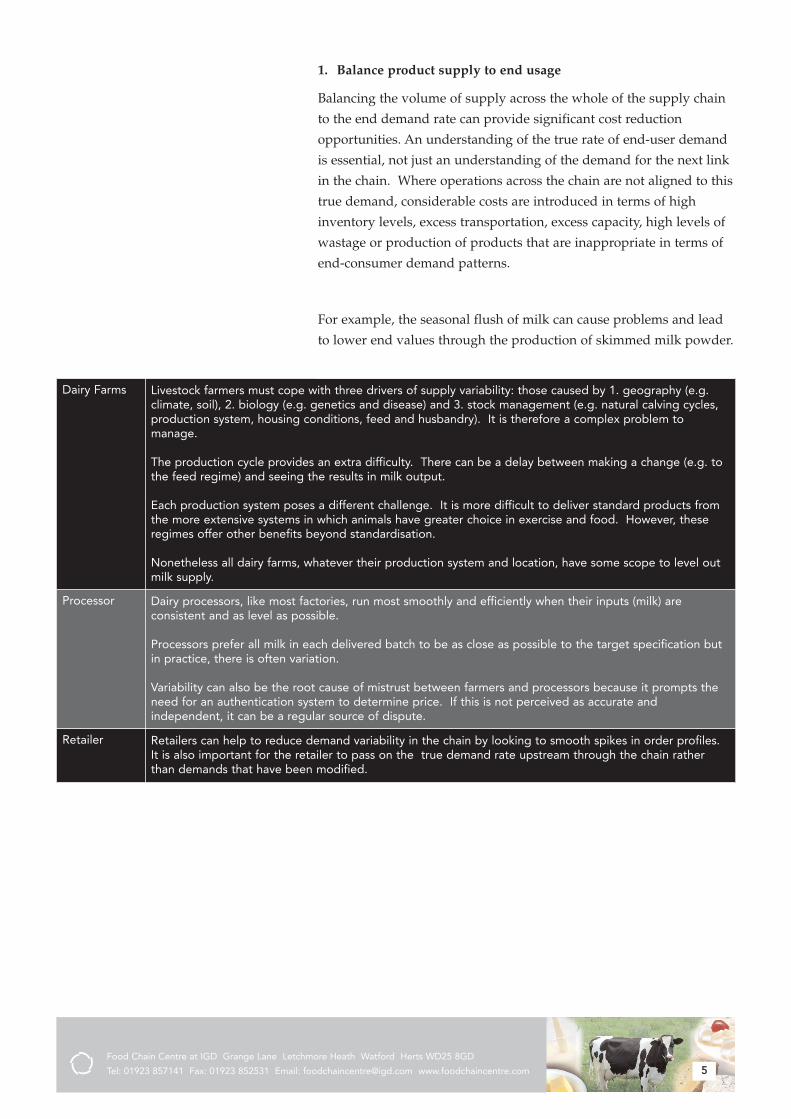
Dairy Farms Livestock farmers must cope with three drivers of supply variability: those caused by 1. geography (e.g.climate, soil), 2. biology (e.g. genetics and disease) and 3. stock management (e.g. natural calving cycles,production system, housing conditions, feed and husbandry). It is therefore a complex problem tomanage.
The production cycle provides an extra difficulty. There can be a delay between making a change (e.g. tothe feed regime) and seeing the results in milk output.
Each production system poses a different challenge. It is more difficult to deliver standard products fromthe more extensive systems in which animals have greater choice in exercise and food. However, theseregimes offer other benefits beyond standardisation.
Nonetheless all dairy farms, whatever their production system and location, have some scope to level outmilk supply.
Processor Dairy processors, like most factories, run most smoothly and efficiently when their inputs (milk) areconsistent and as level as possible.
Processors prefer all milk in each delivered batch to be as close as possible to the target specification butin practice, there is often variation.
Variability can also be the root cause of mistrust between farmers and processors because it prompts theneed for an authentication system to determine price. If this is not perceived as accurate andindependent, it can be a regular source of dispute.
Retailer Retailers can help to reduce demand variability in the chain by looking to smooth spikes in order profiles.It is also important for the retailer to pass on the true demand rate upstream through the chain ratherthan demands that have been modified.
1. Balance product supply to end usage
Balancing the volume of supply across the whole of the supply chain
to the end demand rate can provide significant cost reduction
opportunities. An understanding of the true rate of end-user demand
is essential, not just an understanding of the demand for the next link
in the chain. Where operations across the chain are not aligned to this
true demand, considerable costs are introduced in terms of high
inventory levels, excess transportation, excess capacity, high levels of
wastage or production of products that are inappropriate in terms of
end-consumer demand patterns.
For example, the seasonal flush of milk can cause problems and lead
to lower end values through the production of skimmed milk powder.
Food Chain Centre at IGD Grange Lane Letchmore Heath Watford Herts WD25 8GD
Tel: 01923 857141 Fax: 01923 852531 Email: [email protected] www.foodchaincentre.com 6
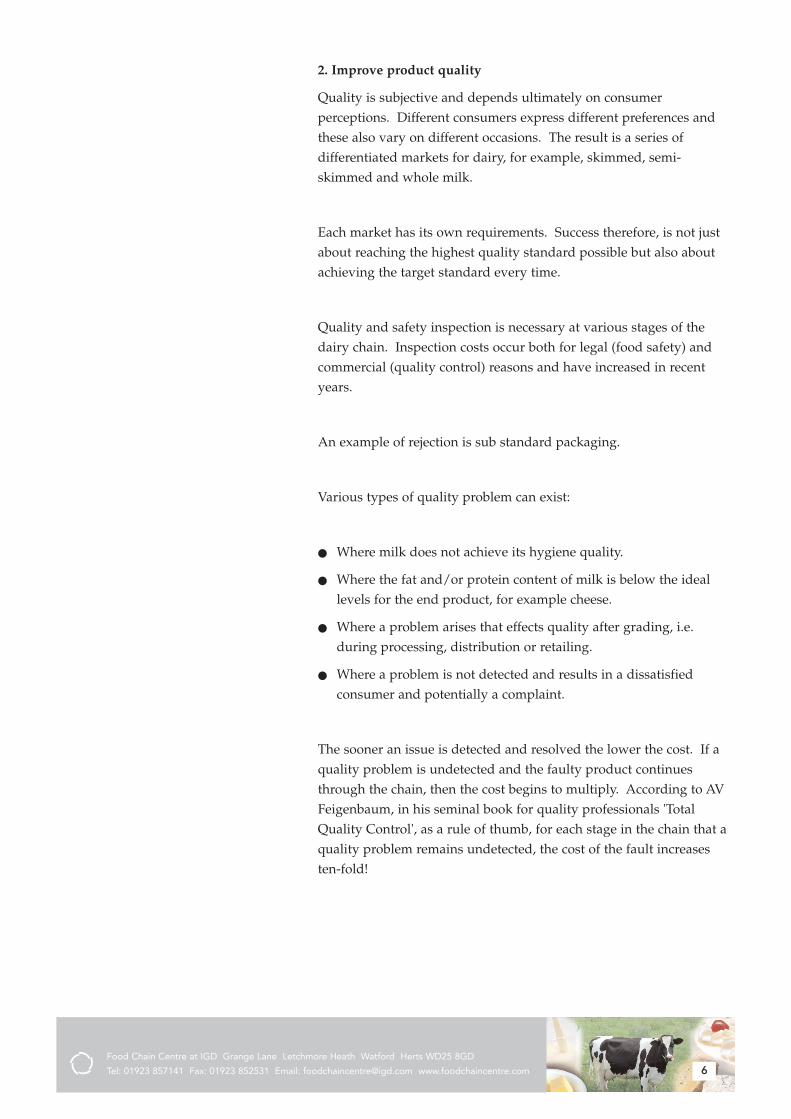
2. Improve product quality
Quality is subjective and depends ultimately on consumerperceptions. Different consumers express different preferences andthese also vary on different occasions. The result is a series ofdifferentiated markets for dairy, for example, skimmed, semi-skimmed and whole milk.
Each market has its own requirements. Success therefore, is not justabout reaching the highest quality standard possible but also aboutachieving the target standard every time.
Quality and safety inspection is necessary at various stages of thedairy chain. Inspection costs occur both for legal (food safety) andcommercial (quality control) reasons and have increased in recentyears.
An example of rejection is sub standard packaging.
Various types of quality problem can exist:
! Where milk does not achieve its hygiene quality.
! Where the fat and/or protein content of milk is below the ideallevels for the end product, for example cheese.
! Where a problem arises that effects quality after grading, i.e.during processing, distribution or retailing.
! Where a problem is not detected and results in a dissatisfiedconsumer and potentially a complaint.
The sooner an issue is detected and resolved the lower the cost. If aquality problem is undetected and the faulty product continuesthrough the chain, then the cost begins to multiply. According to AVFeigenbaum, in his seminal book for quality professionals 'TotalQuality Control', as a rule of thumb, for each stage in the chain that aquality problem remains undetected, the cost of the fault increasesten-fold!
Food Chain Centre at IGD Grange Lane Letchmore Heath Watford Herts WD25 8GD
Tel: 01923 857141 Fax: 01923 852531 Email: [email protected] www.foodchaincentre.com 7
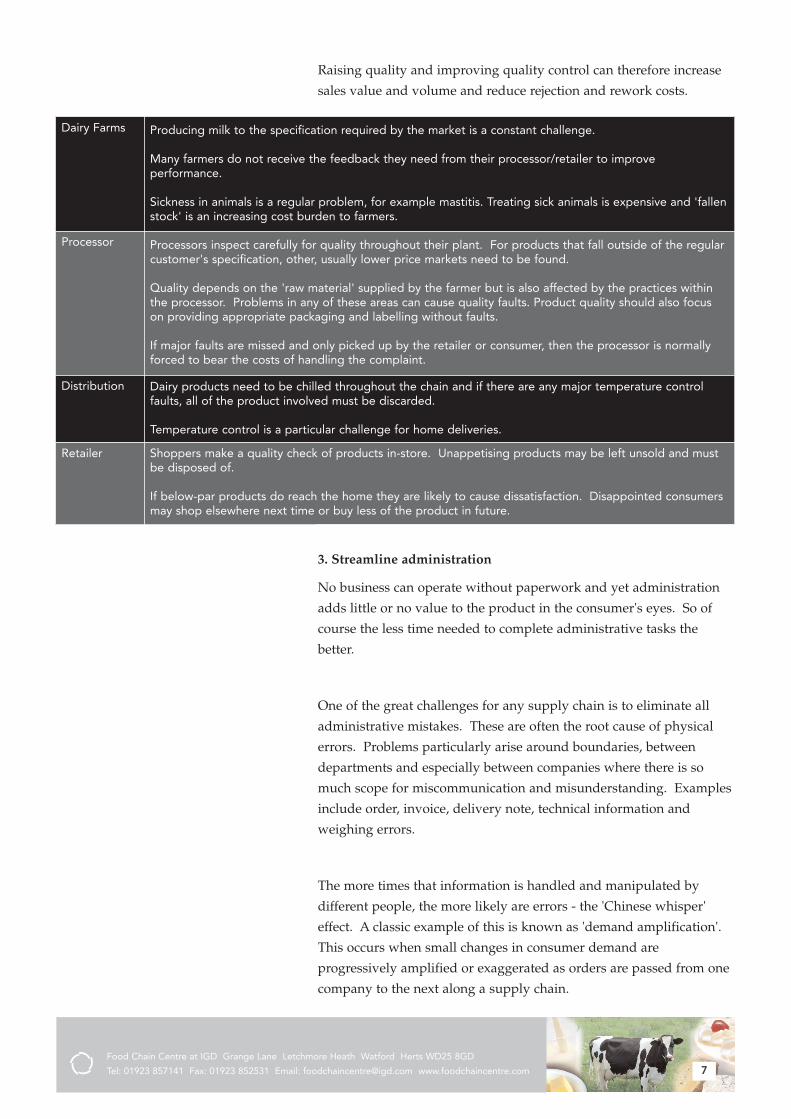
Dairy Farms Producing milk to the specification required by the market is a constant challenge.
Many farmers do not receive the feedback they need from their processor/retailer to improveperformance.
Sickness in animals is a regular problem, for example mastitis. Treating sick animals is expensive and 'fallenstock' is an increasing cost burden to farmers.
Processor Processors inspect carefully for quality throughout their plant. For products that fall outside of the regularcustomer's specification, other, usually lower price markets need to be found.
Quality depends on the 'raw material' supplied by the farmer but is also affected by the practices withinthe processor. Problems in any of these areas can cause quality faults. Product quality should also focuson providing appropriate packaging and labelling without faults.
If major faults are missed and only picked up by the retailer or consumer, then the processor is normallyforced to bear the costs of handling the complaint.
Distribution Dairy products need to be chilled throughout the chain and if there are any major temperature controlfaults, all of the product involved must be discarded.
Temperature control is a particular challenge for home deliveries.
Retailer Shoppers make a quality check of products in-store. Unappetising products may be left unsold and mustbe disposed of.
If below-par products do reach the home they are likely to cause dissatisfaction. Disappointed consumersmay shop elsewhere next time or buy less of the product in future.
3. Streamline administration
No business can operate without paperwork and yet administration
adds little or no value to the product in the consumer's eyes. So of
course the less time needed to complete administrative tasks the
better.
One of the great challenges for any supply chain is to eliminate all
administrative mistakes. These are often the root cause of physical
errors. Problems particularly arise around boundaries, between
departments and especially between companies where there is so
much scope for miscommunication and misunderstanding. Examples
include order, invoice, delivery note, technical information and
weighing errors.
The more times that information is handled and manipulated by
different people, the more likely are errors - the 'Chinese whisper'
effect. A classic example of this is known as 'demand amplification'.
This occurs when small changes in consumer demand are
progressively amplified or exaggerated as orders are passed from one
company to the next along a supply chain.
Raising quality and improving quality control can therefore increase
sales value and volume and reduce rejection and rework costs.
Food Chain Centre at IGD Grange Lane Letchmore Heath Watford Herts WD25 8GD
Tel: 01923 857141 Fax: 01923 852531 Email: [email protected] www.foodchaincentre.com 8
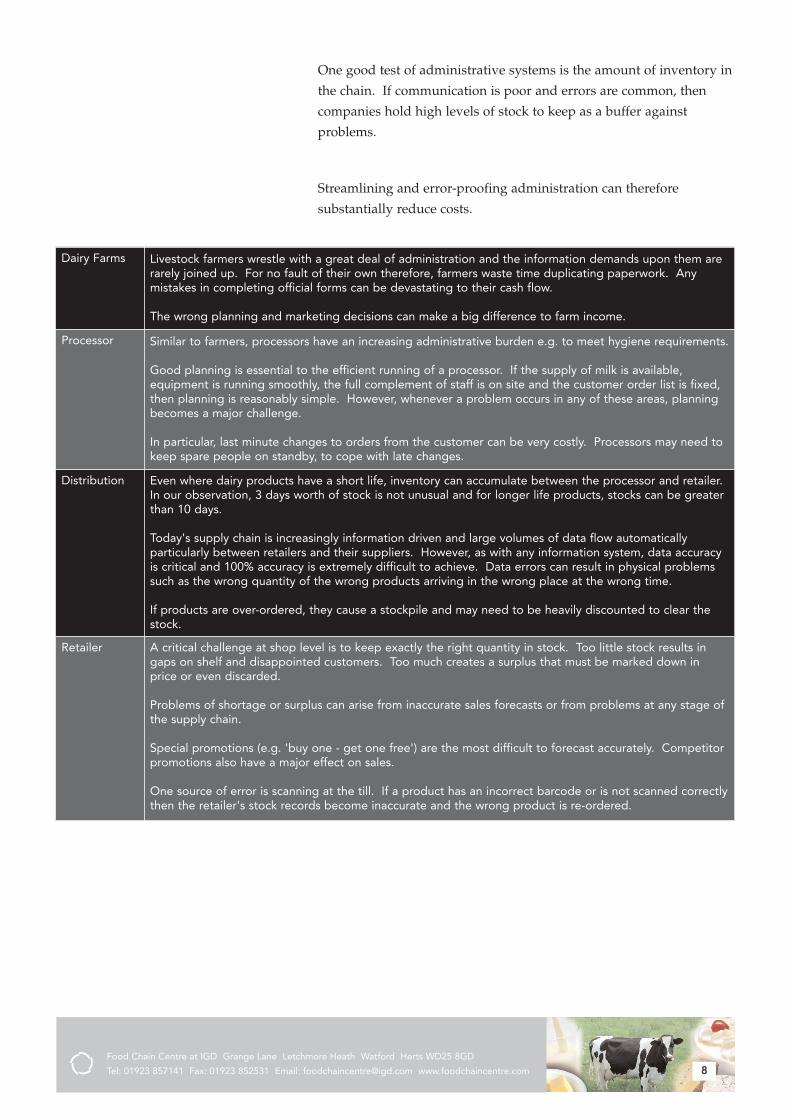
One good test of administrative systems is the amount of inventory in
the chain. If communication is poor and errors are common, then
companies hold high levels of stock to keep as a buffer against
problems.
Streamlining and error-proofing administration can therefore
substantially reduce costs.
Dairy Farms Livestock farmers wrestle with a great deal of administration and the information demands upon them arerarely joined up. For no fault of their own therefore, farmers waste time duplicating paperwork. Anymistakes in completing official forms can be devastating to their cash flow.
The wrong planning and marketing decisions can make a big difference to farm income.
Processor Similar to farmers, processors have an increasing administrative burden e.g. to meet hygiene requirements.
Good planning is essential to the efficient running of a processor. If the supply of milk is available,equipment is running smoothly, the full complement of staff is on site and the customer order list is fixed,then planning is reasonably simple. However, whenever a problem occurs in any of these areas, planningbecomes a major challenge.
In particular, last minute changes to orders from the customer can be very costly. Processors may need tokeep spare people on standby, to cope with late changes.
Distribution Even where dairy products have a short life, inventory can accumulate between the processor and retailer.In our observation, 3 days worth of stock is not unusual and for longer life products, stocks can be greaterthan 10 days.
Today's supply chain is increasingly information driven and large volumes of data flow automaticallyparticularly between retailers and their suppliers. However, as with any information system, data accuracyis critical and 100% accuracy is extremely difficult to achieve. Data errors can result in physical problemssuch as the wrong quantity of the wrong products arriving in the wrong place at the wrong time.
If products are over-ordered, they cause a stockpile and may need to be heavily discounted to clear thestock.
Retailer A critical challenge at shop level is to keep exactly the right quantity in stock. Too little stock results ingaps on shelf and disappointed customers. Too much creates a surplus that must be marked down inprice or even discarded.
Problems of shortage or surplus can arise from inaccurate sales forecasts or from problems at any stage ofthe supply chain.
Special promotions (e.g. 'buy one - get one free') are the most difficult to forecast accurately. Competitorpromotions also have a major effect on sales.
One source of error is scanning at the till. If a product has an incorrect barcode or is not scanned correctlythen the retailer's stock records become inaccurate and the wrong product is re-ordered.
Food Chain Centre at IGD Grange Lane Letchmore Heath Watford Herts WD25 8GD
Tel: 01923 857141 Fax: 01923 852531 Email: [email protected] www.foodchaincentre.com 9
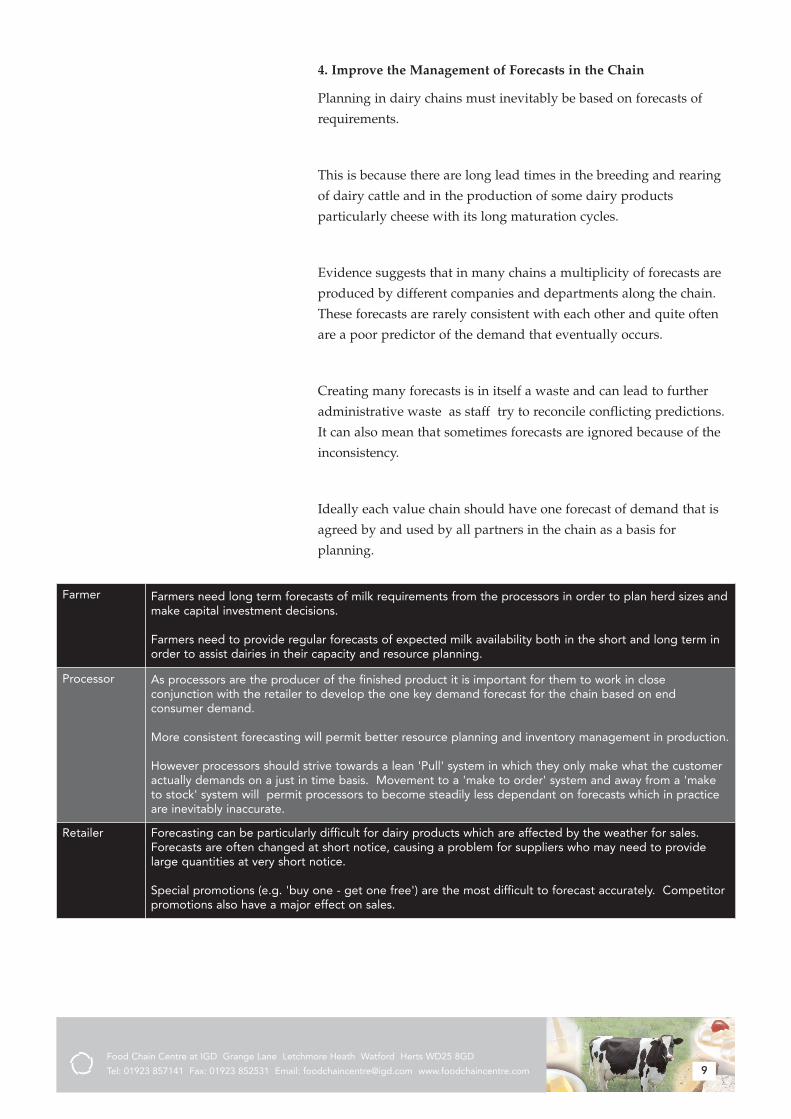
4. Improve the Management of Forecasts in the Chain
Planning in dairy chains must inevitably be based on forecasts of
requirements.
This is because there are long lead times in the breeding and rearing
of dairy cattle and in the production of some dairy products
particularly cheese with its long maturation cycles.
Evidence suggests that in many chains a multiplicity of forecasts are
produced by different companies and departments along the chain.
These forecasts are rarely consistent with each other and quite often
are a poor predictor of the demand that eventually occurs.
Creating many forecasts is in itself a waste and can lead to further
administrative waste as staff try to reconcile conflicting predictions.
It can also mean that sometimes forecasts are ignored because of the
inconsistency.
Ideally each value chain should have one forecast of demand that is
agreed by and used by all partners in the chain as a basis for
planning.
Farmer Farmers need long term forecasts of milk requirements from the processors in order to plan herd sizes andmake capital investment decisions.
Farmers need to provide regular forecasts of expected milk availability both in the short and long term inorder to assist dairies in their capacity and resource planning.
Processor As processors are the producer of the finished product it is important for them to work in closeconjunction with the retailer to develop the one key demand forecast for the chain based on endconsumer demand.
More consistent forecasting will permit better resource planning and inventory management in production.
However processors should strive towards a lean 'Pull' system in which they only make what the customeractually demands on a just in time basis. Movement to a 'make to order' system and away from a 'maketo stock' system will permit processors to become steadily less dependant on forecasts which in practiceare inevitably inaccurate.
Retailer Forecasting can be particularly difficult for dairy products which are affected by the weather for sales.Forecasts are often changed at short notice, causing a problem for suppliers who may need to providelarge quantities at very short notice.
Special promotions (e.g. 'buy one - get one free') are the most difficult to forecast accurately. Competitorpromotions also have a major effect on sales.
Food Chain Centre at IGD Grange Lane Letchmore Heath Watford Herts WD25 8GD
Tel: 01923 857141 Fax: 01923 852531 Email: [email protected] www.foodchaincentre.com 10
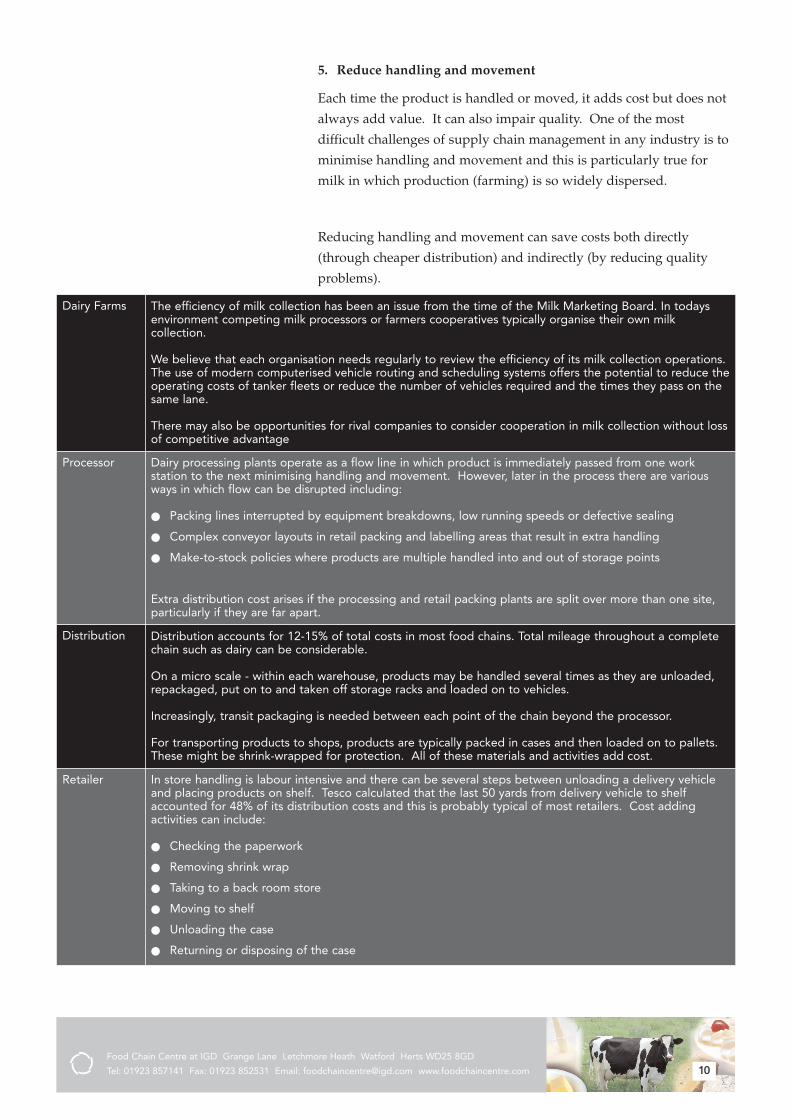
5. Reduce handling and movement
Each time the product is handled or moved, it adds cost but does not
always add value. It can also impair quality. One of the most
difficult challenges of supply chain management in any industry is to
minimise handling and movement and this is particularly true for
milk in which production (farming) is so widely dispersed.
Reducing handling and movement can save costs both directly
(through cheaper distribution) and indirectly (by reducing quality
problems).
Dairy Farms The efficiency of milk collection has been an issue from the time of the Milk Marketing Board. In todaysenvironment competing milk processors or farmers cooperatives typically organise their own milkcollection.
We believe that each organisation needs regularly to review the efficiency of its milk collection operations.The use of modern computerised vehicle routing and scheduling systems offers the potential to reduce theoperating costs of tanker fleets or reduce the number of vehicles required and the times they pass on thesame lane.
There may also be opportunities for rival companies to consider cooperation in milk collection without lossof competitive advantage
Processor Dairy processing plants operate as a flow line in which product is immediately passed from one workstation to the next minimising handling and movement. However, later in the process there are variousways in which flow can be disrupted including:
! Packing lines interrupted by equipment breakdowns, low running speeds or defective sealing
! Complex conveyor layouts in retail packing and labelling areas that result in extra handling
! Make-to-stock policies where products are multiple handled into and out of storage points
Extra distribution cost arises if the processing and retail packing plants are split over more than one site,particularly if they are far apart.
Distribution Distribution accounts for 12-15% of total costs in most food chains. Total mileage throughout a completechain such as dairy can be considerable.
On a micro scale - within each warehouse, products may be handled several times as they are unloaded,repackaged, put on to and taken off storage racks and loaded on to vehicles.
Increasingly, transit packaging is needed between each point of the chain beyond the processor.
For transporting products to shops, products are typically packed in cases and then loaded on to pallets.These might be shrink-wrapped for protection. All of these materials and activities add cost.
Retailer In store handling is labour intensive and there can be several steps between unloading a delivery vehicleand placing products on shelf. Tesco calculated that the last 50 yards from delivery vehicle to shelfaccounted for 48% of its distribution costs and this is probably typical of most retailers. Cost addingactivities can include:
! Checking the paperwork
! Removing shrink wrap
! Taking to a back room store
! Moving to shelf
! Unloading the case
! Returning or disposing of the case
Food Chain Centre at IGD Grange Lane Letchmore Heath Watford Herts WD25 8GD
Tel: 01923 857141 Fax: 01923 852531 Email: [email protected] www.foodchaincentre.com 11
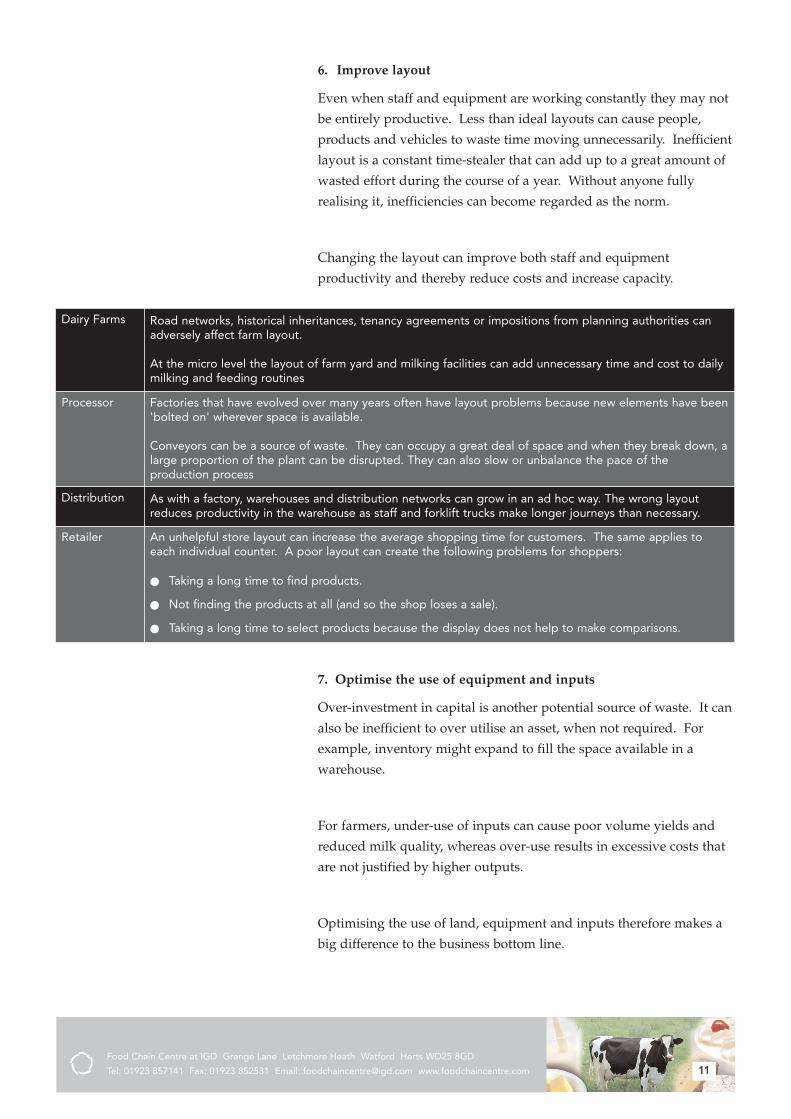
6. Improve layout
Even when staff and equipment are working constantly they may not
be entirely productive. Less than ideal layouts can cause people,
products and vehicles to waste time moving unnecessarily. Inefficient
layout is a constant time-stealer that can add up to a great amount of
wasted effort during the course of a year. Without anyone fully
realising it, inefficiencies can become regarded as the norm.
Changing the layout can improve both staff and equipment
productivity and thereby reduce costs and increase capacity.
Dairy Farms Road networks, historical inheritances, tenancy agreements or impositions from planning authorities canadversely affect farm layout.
At the micro level the layout of farm yard and milking facilities can add unnecessary time and cost to dailymilking and feeding routines
Processor Factories that have evolved over many years often have layout problems because new elements have been'bolted on' wherever space is available.
Conveyors can be a source of waste. They can occupy a great deal of space and when they break down, alarge proportion of the plant can be disrupted. They can also slow or unbalance the pace of theproduction process
Distribution As with a factory, warehouses and distribution networks can grow in an ad hoc way. The wrong layoutreduces productivity in the warehouse as staff and forklift trucks make longer journeys than necessary.
Retailer An unhelpful store layout can increase the average shopping time for customers. The same applies toeach individual counter. A poor layout can create the following problems for shoppers:
! Taking a long time to find products.
! Not finding the products at all (and so the shop loses a sale).
! Taking a long time to select products because the display does not help to make comparisons.
7. Optimise the use of equipment and inputs
Over-investment in capital is another potential source of waste. It can
also be inefficient to over utilise an asset, when not required. For
example, inventory might expand to fill the space available in a
warehouse.
For farmers, under-use of inputs can cause poor volume yields and
reduced milk quality, whereas over-use results in excessive costs that
are not justified by higher outputs.
Optimising the use of land, equipment and inputs therefore makes a
big difference to the business bottom line.
Food Chain Centre at IGD Grange Lane Letchmore Heath Watford Herts WD25 8GD
Tel: 01923 857141 Fax: 01923 852531 Email: [email protected] www.foodchaincentre.com 12
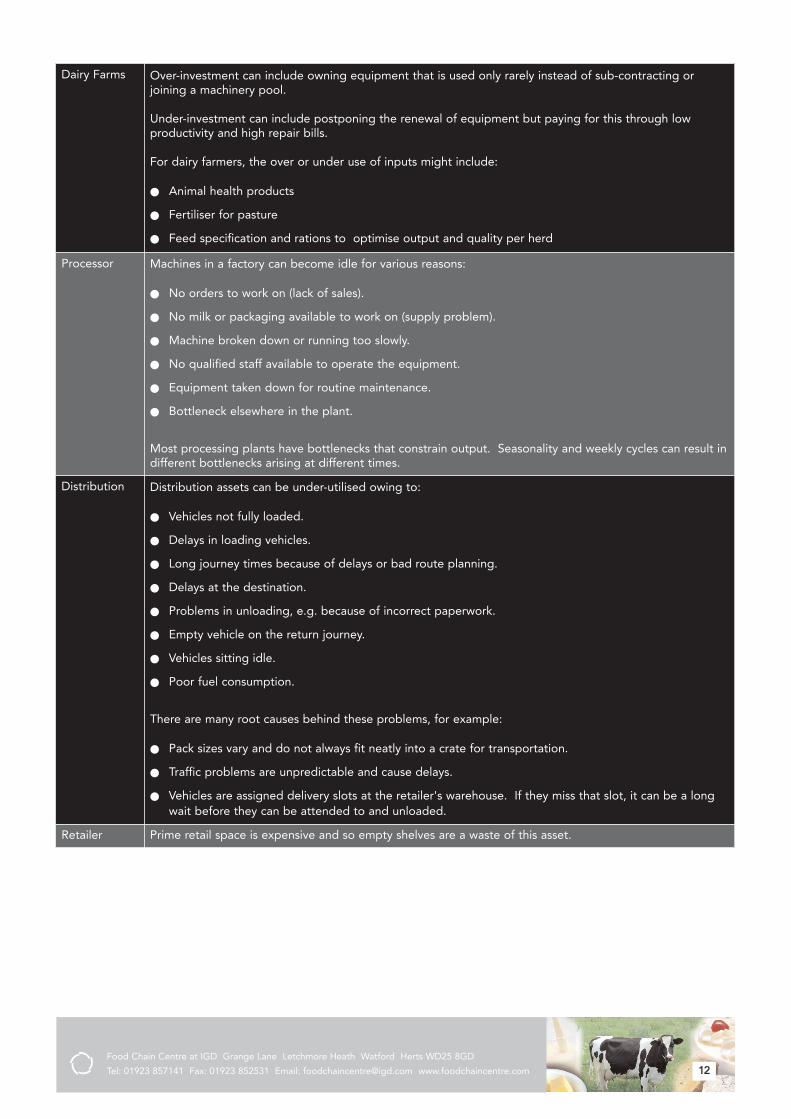
Dairy Farms Over-investment can include owning equipment that is used only rarely instead of sub-contracting orjoining a machinery pool.
Under-investment can include postponing the renewal of equipment but paying for this through lowproductivity and high repair bills.
For dairy farmers, the over or under use of inputs might include:
! Animal health products
! Fertiliser for pasture
! Feed specification and rations to optimise output and quality per herd
Processor Machines in a factory can become idle for various reasons:
! No orders to work on (lack of sales).
! No milk or packaging available to work on (supply problem).
! Machine broken down or running too slowly.
! No qualified staff available to operate the equipment.
! Equipment taken down for routine maintenance.
! Bottleneck elsewhere in the plant.
Most processing plants have bottlenecks that constrain output. Seasonality and weekly cycles can result indifferent bottlenecks arising at different times.
Distribution Distribution assets can be under-utilised owing to:
! Vehicles not fully loaded.
! Delays in loading vehicles.
! Long journey times because of delays or bad route planning.
! Delays at the destination.
! Problems in unloading, e.g. because of incorrect paperwork.
! Empty vehicle on the return journey.
! Vehicles sitting idle.
! Poor fuel consumption.
There are many root causes behind these problems, for example:
! Pack sizes vary and do not always fit neatly into a crate for transportation.
! Traffic problems are unpredictable and cause delays.
! Vehicles are assigned delivery slots at the retailer's warehouse. If they miss that slot, it can be a longwait before they can be attended to and unloaded.
Retailer Prime retail space is expensive and so empty shelves are a waste of this asset.
Food Chain Centre at IGD Grange Lane Letchmore Heath Watford Herts WD25 8GD
Tel: 01923 857141 Fax: 01923 852531 Email: [email protected] www.foodchaincentre.com 13
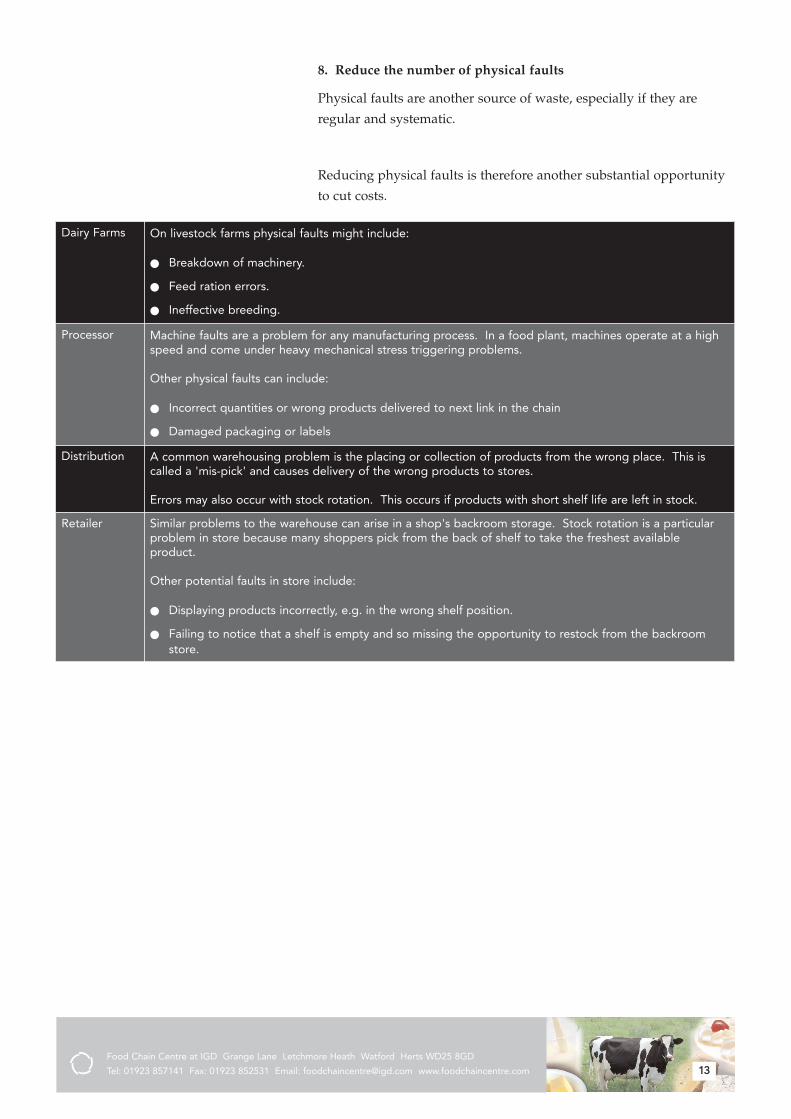
8. Reduce the number of physical faults
Physical faults are another source of waste, especially if they are
regular and systematic.
Reducing physical faults is therefore another substantial opportunity
to cut costs.
Dairy Farms On livestock farms physical faults might include:
! Breakdown of machinery.
! Feed ration errors.
! Ineffective breeding.
Processor Machine faults are a problem for any manufacturing process. In a food plant, machines operate at a highspeed and come under heavy mechanical stress triggering problems.
Other physical faults can include:
! Incorrect quantities or wrong products delivered to next link in the chain
! Damaged packaging or labels
Distribution A common warehousing problem is the placing or collection of products from the wrong place. This iscalled a 'mis-pick' and causes delivery of the wrong products to stores.
Errors may also occur with stock rotation. This occurs if products with short shelf life are left in stock.
Retailer Similar problems to the warehouse can arise in a shop's backroom storage. Stock rotation is a particularproblem in store because many shoppers pick from the back of shelf to take the freshest availableproduct.
Other potential faults in store include:
! Displaying products incorrectly, e.g. in the wrong shelf position.
! Failing to notice that a shelf is empty and so missing the opportunity to restock from the backroomstore.
Food Chain Centre at IGD Grange Lane Letchmore Heath Watford Herts WD25 8GD
Tel: 01923 857141 Fax: 01923 852531 Email: [email protected] www.foodchaincentre.com 14
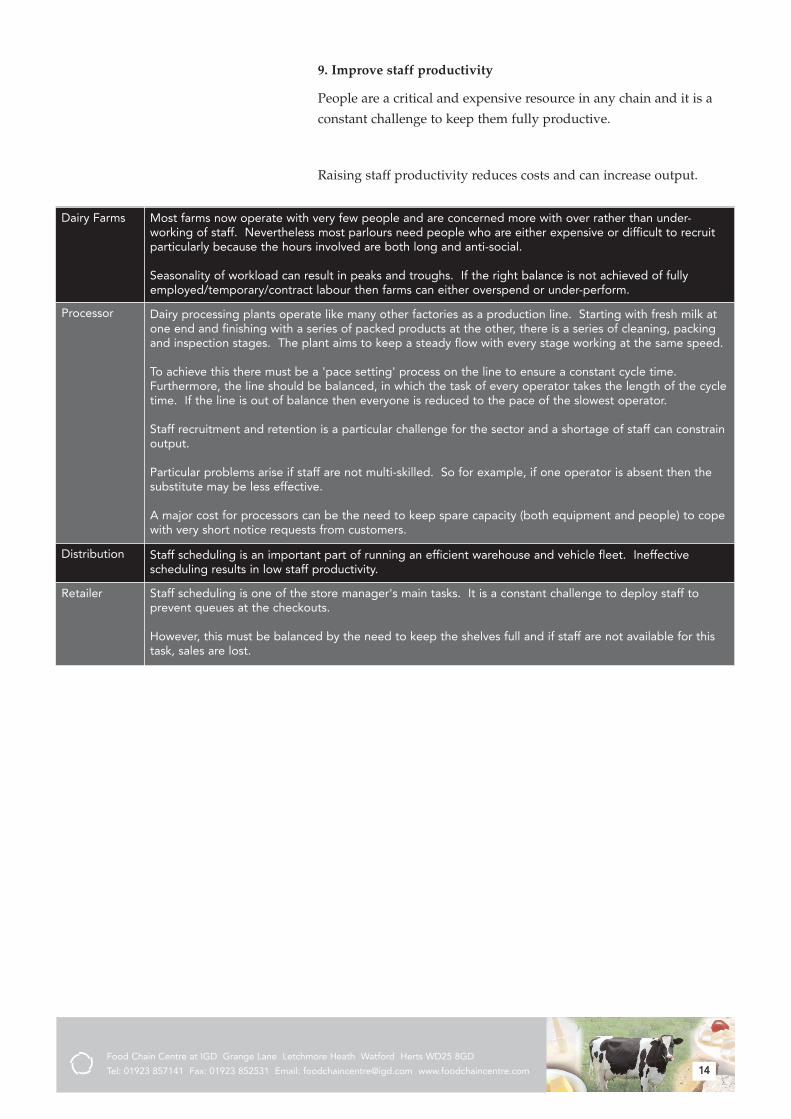
Dairy Farms Most farms now operate with very few people and are concerned more with over rather than under-working of staff. Nevertheless most parlours need people who are either expensive or difficult to recruitparticularly because the hours involved are both long and anti-social.
Seasonality of workload can result in peaks and troughs. If the right balance is not achieved of fullyemployed/temporary/contract labour then farms can either overspend or under-perform.
Processor Dairy processing plants operate like many other factories as a production line. Starting with fresh milk atone end and finishing with a series of packed products at the other, there is a series of cleaning, packingand inspection stages. The plant aims to keep a steady flow with every stage working at the same speed.
To achieve this there must be a 'pace setting' process on the line to ensure a constant cycle time.Furthermore, the line should be balanced, in which the task of every operator takes the length of the cycletime. If the line is out of balance then everyone is reduced to the pace of the slowest operator.
Staff recruitment and retention is a particular challenge for the sector and a shortage of staff can constrainoutput.
Particular problems arise if staff are not multi-skilled. So for example, if one operator is absent then thesubstitute may be less effective.
A major cost for processors can be the need to keep spare capacity (both equipment and people) to copewith very short notice requests from customers.
Distribution Staff scheduling is an important part of running an efficient warehouse and vehicle fleet. Ineffectivescheduling results in low staff productivity.
Retailer Staff scheduling is one of the store manager's main tasks. It is a constant challenge to deploy staff toprevent queues at the checkouts.
However, this must be balanced by the need to keep the shelves full and if staff are not available for thistask, sales are lost.
9. Improve staff productivity
People are a critical and expensive resource in any chain and it is a
constant challenge to keep them fully productive.
Raising staff productivity reduces costs and can increase output.
Food Chain Centre at IGD Grange Lane Letchmore Heath Watford Herts WD25 8GD
Tel: 01923 857141 Fax: 01923 852531 Email: [email protected] www.foodchaincentre.com 15
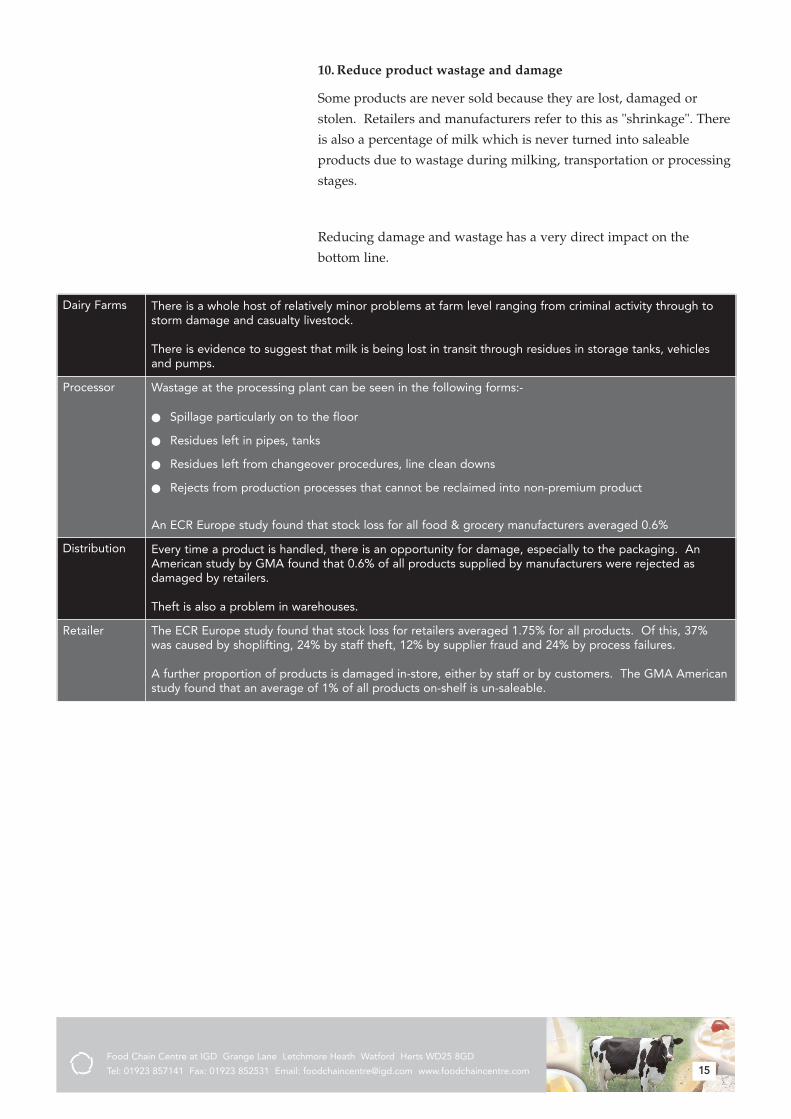
10. Reduce product wastage and damage
Some products are never sold because they are lost, damaged or
stolen. Retailers and manufacturers refer to this as "shrinkage". There
is also a percentage of milk which is never turned into saleable
products due to wastage during milking, transportation or processing
stages.
Reducing damage and wastage has a very direct impact on the
bottom line.
Dairy Farms There is a whole host of relatively minor problems at farm level ranging from criminal activity through tostorm damage and casualty livestock.
There is evidence to suggest that milk is being lost in transit through residues in storage tanks, vehiclesand pumps.
Processor Wastage at the processing plant can be seen in the following forms:-
! Spillage particularly on to the floor
! Residues left in pipes, tanks
! Residues left from changeover procedures, line clean downs
! Rejects from production processes that cannot be reclaimed into non-premium product
An ECR Europe study found that stock loss for all food & grocery manufacturers averaged 0.6%
Distribution Every time a product is handled, there is an opportunity for damage, especially to the packaging. AnAmerican study by GMA found that 0.6% of all products supplied by manufacturers were rejected asdamaged by retailers.
Theft is also a problem in warehouses.
Retailer The ECR Europe study found that stock loss for retailers averaged 1.75% for all products. Of this, 37%was caused by shoplifting, 24% by staff theft, 12% by supplier fraud and 24% by process failures.
A further proportion of products is damaged in-store, either by staff or by customers. The GMA Americanstudy found that an average of 1% of all products on-shelf is un-saleable.

Food Chain Centre at IGD Grange Lane Letchmore Heath Watford Herts WD25 8GD
Tel: 01923 857141 Fax: 01923 852531 Email: [email protected] www.foodchaincentre.com 16
Improvement Checklist
On the next page we offer you two pro-formas to help your business
to assess opportunities across the ten improvement areas. We suggest
it be used as follows:
1. In the Waste Checklist, identify major costs to your business
stemming from each of the ten issues. You may need to collect
some new measurements to do this accurately.
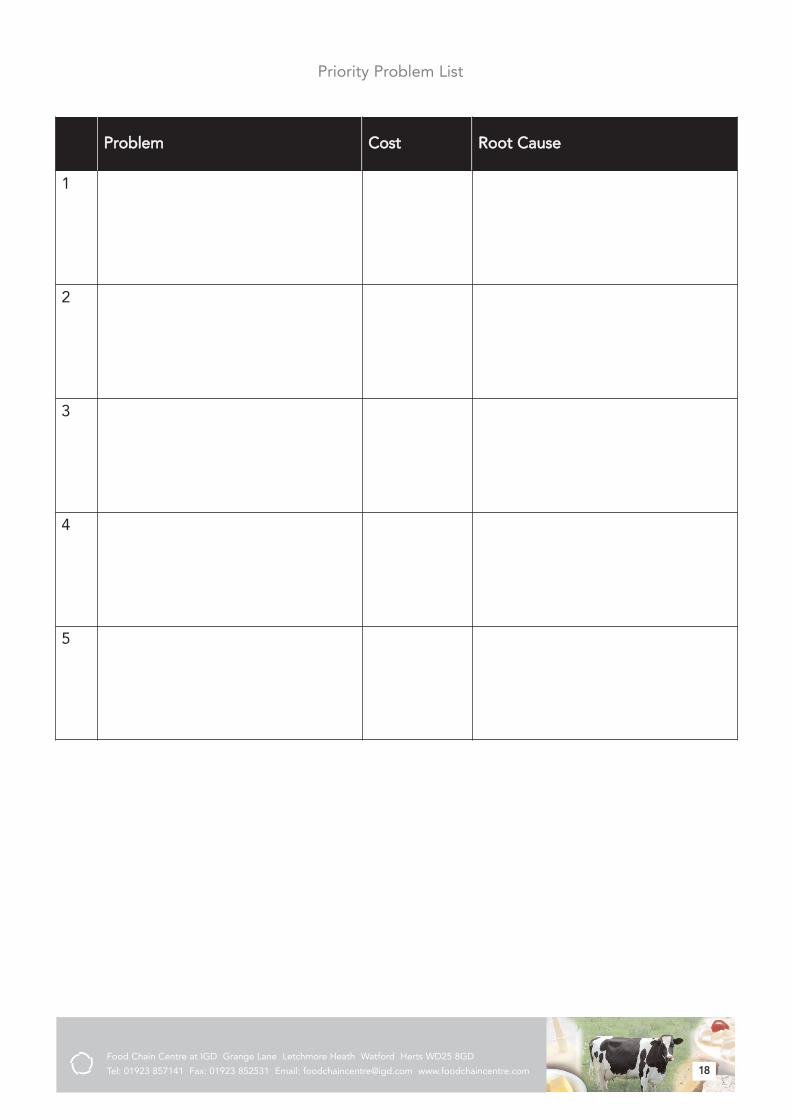
2. Prioritise by selecting your five most expensive problems.
Transfer these to the Priority Problem List.
3. For each of the priority problems, identify the root cause. Make
sure you trace the problem back to its true root, perhaps by using
the 'several whys' technique. This is where you repeatedly ask
why a problem occurs, to remove each 'layer of the onion' until
you reach the heart of the matter. In many cases you will find that
the root cause lies outside of your own business.
4. You will be left with a list of top priority issues that should
become the focus of your improvement strategy.
You can tackle this exercise at varying levels of detail, from a quick
and simple assessment to a very thorough survey.
The exercise is just the first stage of improvement - identifying your
priority problems. Of course you will then need to move on and
develop solutions.
Elsewhere in the pack we provide guidelines and case studies to
suggest possible solutions. This will be a growing collection as we
develop our ideas, test our recommendations and identify further
examples of best practice.
Food Chain Centre at IGD Grange Lane Letchmore Heath Watford Herts WD25 8GD
Tel: 01923 857141 Fax: 01923 852531 Email: [email protected] www.foodchaincentre.com 17
Waste Checklist
Waste in Your Business
Balance product supplywith end user demand
Product Quality
Administration
Improve forecastmanagement
Handling and Movement
Layout
Land, Equipment andInputs
Physical Faults
Staff
Wastage and Damage
Food Chain Centre at IGD Grange Lane Letchmore Heath Watford Herts WD25 8GD
Tel: 01923 857141 Fax: 01923 852531 Email: [email protected] www.foodchaincentre.com 18
Priority Problem List
Problem Cost Root Cause
1
2
3
4
5
"If you don't measure the process you cannotimprove it"
MMaassaaaakkii IImmaaii,, PPrreessiiddeenntt,, KKaaiizzeenn IInnssttiittuuttee
Are You Measuring Up?
Choosing what to measure is one of the most important decisions that
any business takes. Getting the right measures in place is an essential
part of driving improvement and increasing profits. Equally, sharing
performance measurements is vital to promote improvement
throughout a chain.
In this section we provide some general principles of measurement,
recommend new measures for the dairy industry and explain why
measuring in partnership is critical to success.
Principles of Performance Measurement
Business performance measurement has become a well studied
subject by academics as they seek to understand which practices work
and which ones do not. Some general principles about measurement
have emerged and we discuss these here.
If you are certain that you already understand them, then jump to the
next section on measures for dairy.
Most of the principles are fairly obvious and yet challenging to
implement. Many organisations have problems in this regard and it
takes strict discipline to get it regularly right.
Best Practice in Performance Measurement
1. Make sure your measures fit your business objectives
2. Choose a Vital Few measures
3. Make the data as current as possible
4. Use Exception Reporting
5. Make the measures visible
6. Act quickly on what the measures say
Cutting Costs - AddingValue in Dairy
June2005
Food Chain Centre at IGD Grange Lane Letchmore Heath Watford Herts WD25 8GD
Tel: 01923 857141 Fax: 01923 852531 Email: [email protected] www.foodchaincentre.com 2
1. Make sure your measures fit your business objectives
"Examples abound of organisations that haveintroduced performance measures that quitesimply drive entirely the wrong behaviours."
NNeeeellyy,, AAddaammss aanndd KKeennnneerrlleeyy,, TThhee PPeerrffoorrmmaanncceePPrriissmm
Each major objective of the business should have a measure attached
to it. But according to measurement experts, many people fall in to
the trap of measuring what's easy to collect rather than what's most
important.
"A major cause of companies getting intotrouble is the tendency to accept simplisticnotions in evaluating performance � the generaltendency is to evaluate manufacturing primarilyon the basis of cost and efficiency. There aremany more criteria to judge performance. "
WW.. SSkkiinnnneerr,, TThhee DDeecclliinnee,, FFaallll aanndd RReenneewwaall ooffMMaannuuffaaccttuurriinngg
One variation of this trap is to focus on financial results to the
exclusion of all other aspects. Finances are critically important of
course, but they only measure historical results and show the impact
of decisions that were made some time ago.
All parts of the chain should adopt a 'balanced scorecard' type of
approach considering their customers, operations and people as the
main driving forces behind business performance. Businesses should
collect forward-looking measures based on these perspectives.

Food Chain Centre at IGD Grange Lane Letchmore Heath Watford Herts WD25 8GD
Tel: 01923 857141 Fax: 01923 852531 Email: [email protected] www.foodchaincentre.com 3
2. Choose a Vital Few measures
"We had so many damn numbers in so manydamn folders, that no one was looking at them.But no one would admit it. Everyone just bluffedtheir way through meetings, pretending to befamiliar with every detail."
RRiiccaarrddoo SSeemmlleerr,, CCEEOO ooff SSeemmccoo
With performance measures, there's a tendency to keep adding more
until you create an avalanche of figures. Critical information is then
swamped by irrelevant data.
Some measures take a great deal of resource to produce but are never
applied to any useful purpose and only exist because 'they've always
been collected'. So it is a good idea to have an occasional cull of
outdated measures.
However, in business, there are many things that genuinely deserve
to be measured. So it is also important to prioritise, raising a 'Vital
Few' measures to prominence above the others. These are the
measures on which the future of the company critically depends.
One candidate as a vital measure for any business is safety both for
the product and for staff. Studies show that a good safety record is
usually an indicator of a successful business. Dairy has high
standards in product safety due to stringent HACCP (Hazard
Analysis Critical Control Point) procedures. Operator safety is a
separate challenge and is not just about serious accidents. It is also
important to measure near misses and minor accidents.
3. Make the data as current as possible
Information is degradable. Every delay between recording data and
presenting it as a performance measure reduces its value. It puts a
longer distance between any problem and the possibility of remedial
action.
Ideally, measures should be in 'real time', i.e. recording events as they
happen.
Food Chain Centre at IGD Grange Lane Letchmore Heath Watford Herts WD25 8GD
Tel: 01923 857141 Fax: 01923 852531 Email: [email protected] www.foodchaincentre.com 4
4. Use Exception Reporting
The main principle of Exception Reporting is to set minimum and
maximum acceptable limits for each measure. When performance
falls outside of those limits, it should activate a 'red flag', in other
words trigger management attention.
The vital few measures are usually monitored in detail. Exception
reports are particularly valuable for the less vital measures that can
become critical if there is a major problem. They ensure that
problems are raised to attention whilst preventing managers getting
bogged down in detail.
5. Make the measures visible
Sometimes, important measures are buried away in the desk of a
senior manager or kept only in 'cyberspace' on a computer system.
But the more people that see a measure and the more often they see it,
the more likely they are to act upon it.
If a measure is displayed prominently and employees see it regularly,
it reinforces the measure's importance. Again, the vital few measures
should always stand out from the rest.
Although different people prefer to see figures presented in different
ways, most people respond best to graphics, such as charts. Simple
techniques, such as colouring a graph in red when the numbers are
falling, help to clarify what is actually happening to the measure.
6. Act quickly on what the measures say
This is the most obvious rule of all and yet one of the most difficult to
apply. Whenever there's a red flag, signalling an unacceptable
performance, it should generate an immediate response.
You may wish to test your own business against each of these
principles. Measurement systems are difficult to get exactly right, so
it is likely you will find some weaknesses if you probe deeply
enough.
Food Chain Centre at IGD Grange Lane Letchmore Heath Watford Herts WD25 8GD
Tel: 01923 857141 Fax: 01923 852531 Email: [email protected] www.foodchaincentre.com 5
Measures for the Dairy Chain
The choice of 'vital few measures' depends on circumstances but if we
apply lean thinking to the dairy chain then some strong candidates
emerge.
We believe that the following areas are or should be major priorities
for the dairy chain. If so, then they each should be measured.
! Consumer Satisfaction
! On Shelf Availability
! Milk and Product Quality
! Demand Amplification
! Equipment Effectiveness
Earlier we mentioned safety and this is another priority measure.
These are our general recommendations for the dairy industry.
However, each business should determine its own set of vital few
measures to help control and improve quality, cost and service.
Below we look at each of our recommendations in turn.
1. Consumer Satisfaction
Consumers want excellent products at reasonable prices. Every time
they make a purchase in store, they cast an 'economic vote'. If they
are satisfied, they buy more.
So the 'acid test' measure of consumer satisfaction is sales and
particularly repeat sales.
Everyone in the chain has a shared interest in satisfying consumers
and generating sales. It is a vital measure that is widely recognised,
shared and acted upon.
Food Chain Centre at IGD Grange Lane Letchmore Heath Watford Herts WD25 8GD
Tel: 01923 857141 Fax: 01923 852531 Email: [email protected] www.foodchaincentre.com 6
The opposite side of the coin is dissatisfaction. Retailers normally
measure this by the number of complaints, e.g. as a percentage of
total sales. When the number exceeds a particular limit, this triggers
an exception report and they then share the issue with suppliers.
Ideally, the root cause of the problem is then investigated and
rectified.
However, most dissatisfied customers do not complain and formal
complaints are only the tip of the iceberg. Detailed consumer
research is needed to gain a more in-depth picture.
Satisfaction is a moving target and what satisfies consumers today,
may not do so tomorrow. Again, various consumer research
techniques can be used to forecast consumer needs in the future.
2. On Shelf Availability
When products are unavailable in store the result is a loss of sales,
which hurts everyone in the chain. Even worse, some consumers will
substitute for another product instead and this could change their
long-term consumption pattern.
Recent research by IGD on the average out of stock rate for all
products in supermarkets showed that on shelf availability for dairy
products fell into the range 95% - 97%. In other words dairy products
are not available to shoppers for a proportion of shopping trips.
Faced with non-availability, according to IGD research in the UK, 37%
of shoppers go elsewhere to another store, 35% substitute and buy a
different product, whilst 28% of shoppers delay or forfeit the
purchase.
To improve this area, the first priority is an accurate estimate of
availability on shelf.
Availability % = Number of Hours Product is Available on Shelf per Week x 100
Total Store Opening Hours in Week

Food Chain Centre at IGD Grange Lane Letchmore Heath Watford Herts WD25 8GD
Tel: 01923 857141 Fax: 01923 852531 Email: [email protected] www.foodchaincentre.com 7
Unfortunately, this could only be recorded completely accurately by
maintaining a constant watch on every shelf. At some future stage,
electronic tags may make this possible but for the time being, a
method of estimation is needed.
There are two alternative approaches. The first is a 'mystery shopper'
survey, in which researchers armed with a shopping list, record the
products that they cannot find in store. Surveys are taken regularly to
establish the % of occasions on which each product was unavailable.
They should be taken at varying times of day and week to achieve a
representative mix.
The second approach is to study the checkout sales (EPoS) data. If a
popular product remains unsold over a longish period, it suggests it
was unavailable. Statistical analysis can therefore be used to estimate
availability. This method can be applied every day at every store but
is only accurate for fast selling products.
So the first stage is measuring the scale of the problem. The next is to
understand the root causes which could be anywhere in the chain.
On an occasional basis, researchers can follow an audit trail for
sample products. Working backwards from an empty shelf they can
explore the reasons, beginning in-store and if necessary, following the
trail back to the distribution centre and supplier.
However, it is impractical to do this constantly and so control points
are needed to measure service at each link in the chain.
Normally a supplier and customer (e.g. retailer) each develop their
own measure of service and commonly these differ substantially.
Generally, customers apply a stricter definition of on-time delivery
and suppliers sometimes kid themselves that they have satisfied
customers when they don't.
The toughest standard for measuring service is Quality On Time In
Full or QOTIF.
QOTIF% = Number of perfect deliveries (on schedule, complete, no quality faults) x 100
Total number of deliveries

Food Chain Centre at IGD Grange Lane Letchmore Heath Watford Herts WD25 8GD
Tel: 01923 857141 Fax: 01923 852531 Email: [email protected] www.foodchaincentre.com 8
A regular monitor of service through the chain reveals the weak
points. Again, exceptional service problems should be traced to their
root cause, e.g. a forecasting, quality control or handling problem.
This should be used to focus improvement activity.
One method of improving service and availability is to hold more
stock but this ties up cash in working capital and can result in unsold
products that pass their 'sell-by' date.
So measures of availability should be balanced with stockholding and
waste from discarded products plus price marking down for short life
reasons.
Waste % = (Units Disposed + Units Reduced) x 100
Total Units Sold
(Units Reduced = No. units discounted x discount %)
Availability/Waste Ratio = Availability %
Waste %
The ideal is 100% availability and 0% disposals/markdowns but this
requires perfection in forecasting and supply.
3. Milk and Product Quality
A general way of measuring the success rate in meeting specification
is Right First Time. This is simply:
Right First Time = Quantity of non-defective premium units
Total quantity of units supplied
Food Chain Centre at IGD Grange Lane Letchmore Heath Watford Herts WD25 8GD
Tel: 01923 857141 Fax: 01923 852531 Email: [email protected] www.foodchaincentre.com 9
The alternative is to measure Not Right First Time.
Not Right First Time = Quantity of defective units
Total quantity of units supplied
In the case of milk quality, a target specification is normally set by the
processor.
The two key elements of milk quality are fat and protein levels the
requirements for which vary for different end products; a further
element is cleanliness.
The target specification can be defined as a composite of three
elements.
The quality of milk is normally measured at the point of collection for
each individual farm. The results against each element can be
combined to give a % conformance to the overall target specification.
This figure would track the success rate in achieving both the farmer's
target specification (which may sometimes be below the processor's
ideal) and the processor's target specification per milk collection and
ideally per animal.
To understand the overall input quality of milk, the processor can
produce an aggregated measure for the total input batch by week to
assess the overall achievement to the target specification. This
aggregated weekly measure can show whether suppliers were
improving their performance through time.
However, this measure should be just the starting point. The success
rate can be increased by tracking milk quality against breeding stock,
feed regime and other farming variables. This approach has been
used by many livestock producers to improve consistency and
financial returns. It requires good feedback of information, record
keeping and traceability. Improving the success rate is also most
likely when it is strongly incentivised through a significant price
differential.

Food Chain Centre at IGD Grange Lane Letchmore Heath Watford Herts WD25 8GD
Tel: 01923 857141 Fax: 01923 852531 Email: [email protected] www.foodchaincentre.com 10
In the case of product quality, a 'defect unit' is any part of a
production batch which has to be reworked, has not met its target
grade or wasted. This measure should be used as an end to end
measure of the right first time capability of the processing plant.
4. Demand Amplification
Demand amplification occurs when small changes in consumer
demand are progressively amplified or exaggerated as orders are
passed from one company to the next along a supply chain. There is
evidence that this effect is present in dairy chains and is a cause of
uncertainty, cost and waste.
Dairy sales fluctuate for seasonal and other reasons but orders,
shipments and stock tend to vary to a much greater extent. This can
be explained by:
! Inaccurate forecasts of demand
! Delays in transferring information or not sharing it at all
! Adding extra to a forecast or order to 'be on the safe side'
! The need to fill lorries for efficient distribution
! Production rules in processing that specify minimum batch sizes
irrespective of demand
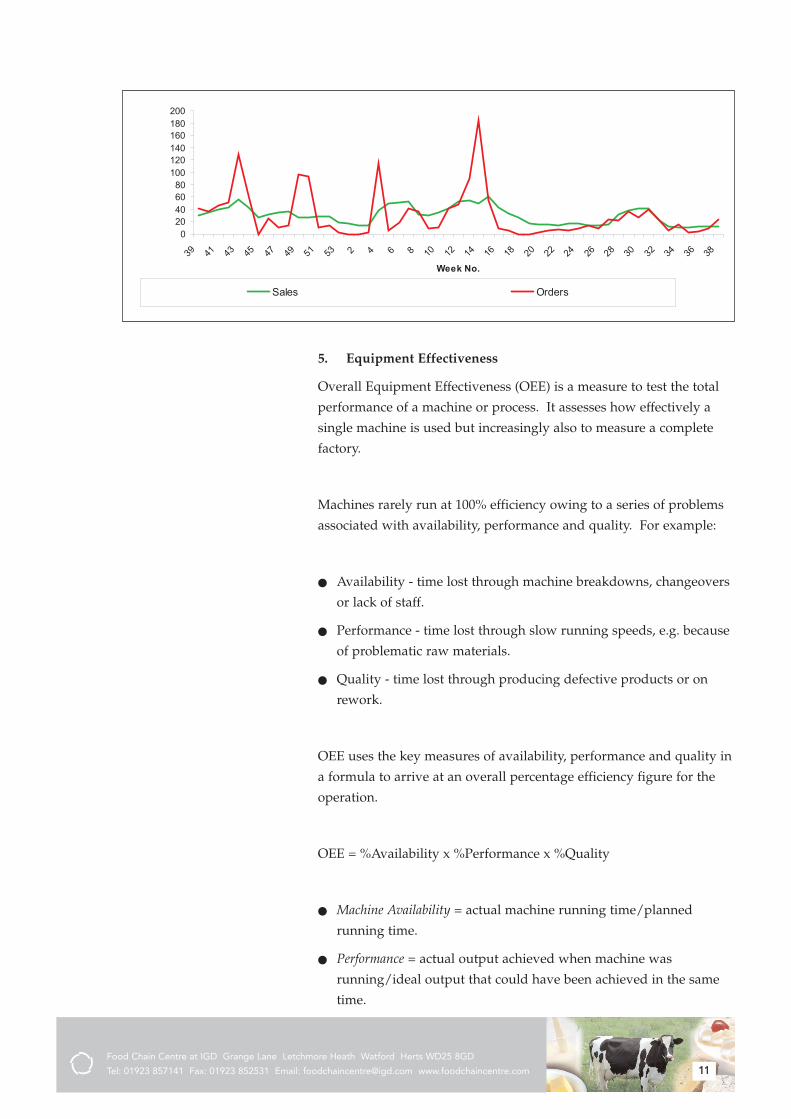
Demand Amplification can be monitored by plotting retail sales and
orders to suppliers on the same chart. This gives an immediate visual
impression.
Demand amplification can be a major cause of waste in a supply
chain and often results in excessive inventories, inefficient production
scheduling, difficulties in resource planning and 'fire-fighting' as
managers attempt to cope with wide swings in demand. Cooperation
between value chain partners in managing demand creates a real
opportunity to eradicate many of these problems and thereby reduce
waste and cost for all companies in the chain.
Food Chain Centre at IGD Grange Lane Letchmore Heath Watford Herts WD25 8GD
Tel: 01923 857141 Fax: 01923 852531 Email: [email protected] www.foodchaincentre.com 11
020406080
100120140160180200
39 41 43 45 47 49 51 53 2 4 6 8 10 12 14 16 18 20 22 24 26 28 30 32 34 36 38
Week No.
Sales Orders
5. Equipment Effectiveness
Overall Equipment Effectiveness (OEE) is a measure to test the total
performance of a machine or process. It assesses how effectively a
single machine is used but increasingly also to measure a complete
factory.
Machines rarely run at 100% efficiency owing to a series of problems
associated with availability, performance and quality. For example:
! Availability - time lost through machine breakdowns, changeovers
or lack of staff.
! Performance - time lost through slow running speeds, e.g. because
of problematic raw materials.
! Quality - time lost through producing defective products or on
rework.
OEE uses the key measures of availability, performance and quality in
a formula to arrive at an overall percentage efficiency figure for the
operation.
OEE = %Availability x %Performance x %Quality
! Machine Availability = actual machine running time/planned
running time.
! Performance = actual output achieved when machine was
running/ideal output that could have been achieved in the same
time.
Food Chain Centre at IGD Grange Lane Letchmore Heath Watford Herts WD25 8GD
Tel: 01923 857141 Fax: 01923 852531 Email: [email protected] www.foodchaincentre.com 12
! Quality = number of perfect items / total items made.
OEE is used widely in manufacturing but in our experience less so in
processing plants. We believe it can readily be applied to the dairy
sector and provide an excellent overarching measure for machine
performance.
More recently a similar measure entitled Overall Vehicle Effectiveness
has been developed for the haulage sector.
OVE = %Route Efficiency x %Time Efficiency x %Vehicle Utilisation x
%Quality
! Route Efficiency = minimum/actual route cost.
! Time Efficiency = shortest possible/actual delivery time.
! Vehicle Utilisation = actual/full vehicle load.
! Quality = good products (with no faults) delivered/total products
delivered.
Measuring in Partnership
Most of the measures that we have recommended require data
collected from various parts of the chain. No single player in the
chain could see all of these measures unless they traded information
with others.
To generate long term improvement, rather than daily fire-fighting of
problems, it is essential to link the effect of problems back to their
cause.
In many cases, measures taken at one part of the chain reveal issues
that lie in a different part. For example, the cause of a shopper
complaint about eating quality might be a problem in the animal feed.
Or the reason why a cheese processing plant has a higher than usual
inventory could be a series of inaccurate demand forecasts from the
retailer.
Food Chain Centre at IGD Grange Lane Letchmore Heath Watford Herts WD25 8GD
Tel: 01923 857141 Fax: 01923 852531 Email: [email protected] www.foodchaincentre.com 13
So the main benefits of lean thinking, of collecting the vital few
performance measures, of establishing and confronting the causes of
waste and driving substantial savings can only be achieved by
partnership. And this requires a true collaborative spirit based on
trust, information and benefit sharing.
The partnership in measurement concept is a hugely powerful
element of Lean Thinking. This one idea of jointly developing and
sharing measures for the whole chain can trigger a huge number of
profitable improvements.
So in summary, we recommend that you:
! Define, collect and share measures across the whole chain.
! Prioritise a vital few whole chain measures.
! Set minimum and maximum limits for each measure.
! Continually monitor.
! Act immediately when a value goes outside the limits and trace
the problem back to its root cause.
! At the point of root cause, introduce actions to stop the problems
recurring.

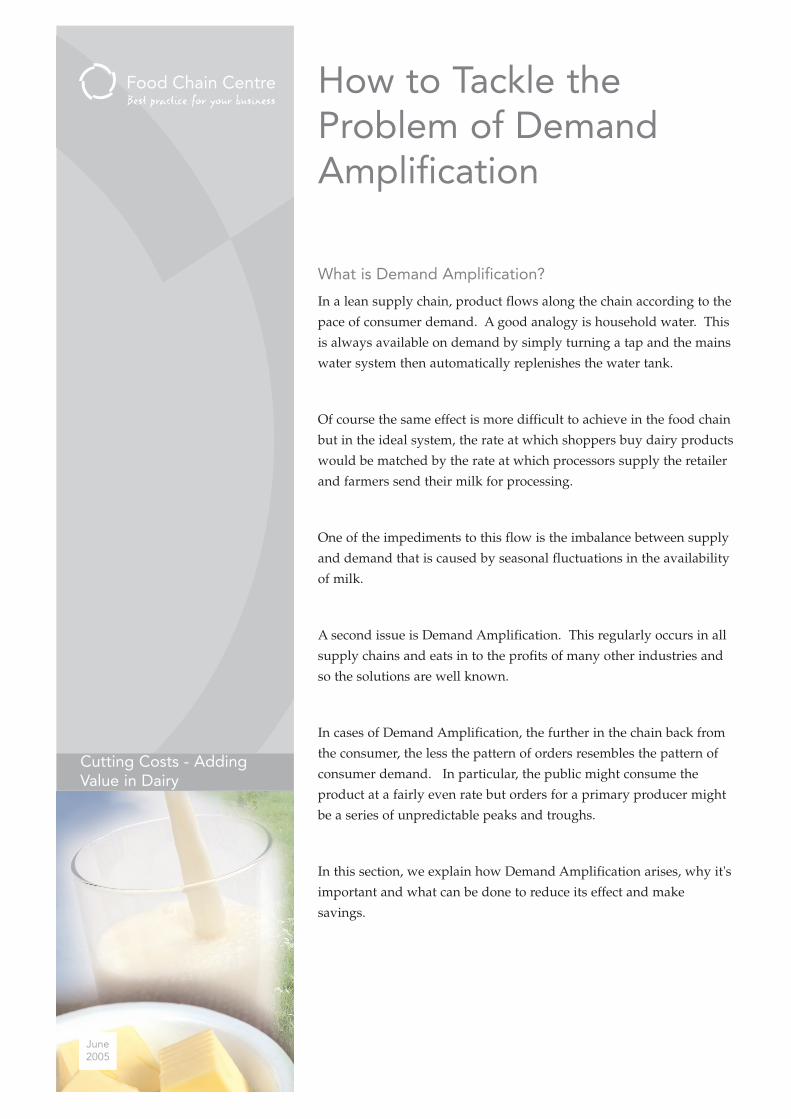
How to Tackle theProblem of DemandAmplification
What is Demand Amplification?
In a lean supply chain, product flows along the chain according to the
pace of consumer demand. A good analogy is household water. This
is always available on demand by simply turning a tap and the mains
water system then automatically replenishes the water tank.
Of course the same effect is more difficult to achieve in the food chain
but in the ideal system, the rate at which shoppers buy dairy products
would be matched by the rate at which processors supply the retailer
and farmers send their milk for processing.
One of the impediments to this flow is the imbalance between supply
and demand that is caused by seasonal fluctuations in the availability
of milk.
A second issue is Demand Amplification. This regularly occurs in all
supply chains and eats in to the profits of many other industries and
so the solutions are well known.
In cases of Demand Amplification, the further in the chain back from
the consumer, the less the pattern of orders resembles the pattern of
consumer demand. In particular, the public might consume the
product at a fairly even rate but orders for a primary producer might
be a series of unpredictable peaks and troughs.
In this section, we explain how Demand Amplification arises, why it's
important and what can be done to reduce its effect and make
savings.
Cutting Costs - AddingValue in Dairy
June2005
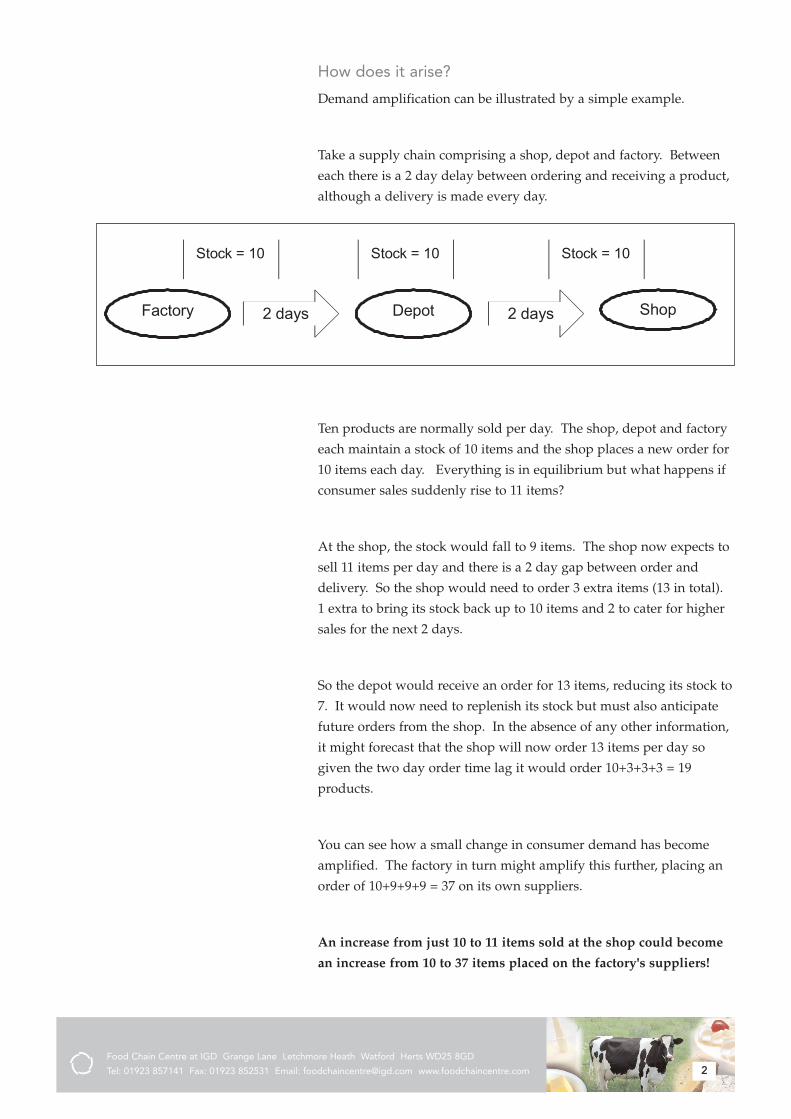
Food Chain Centre at IGD Grange Lane Letchmore Heath Watford Herts WD25 8GD
Tel: 01923 857141 Fax: 01923 852531 Email: [email protected] www.foodchaincentre.com 2
How does it arise?
Demand amplification can be illustrated by a simple example.
Take a supply chain comprising a shop, depot and factory. Between
each there is a 2 day delay between ordering and receiving a product,
although a delivery is made every day.
Factory 2 days Depot 2 days Shop
Stock = 10 Stock = 10 Stock = 10
Ten products are normally sold per day. The shop, depot and factory
each maintain a stock of 10 items and the shop places a new order for
10 items each day. Everything is in equilibrium but what happens if
consumer sales suddenly rise to 11 items?
At the shop, the stock would fall to 9 items. The shop now expects to
sell 11 items per day and there is a 2 day gap between order and
delivery. So the shop would need to order 3 extra items (13 in total).
1 extra to bring its stock back up to 10 items and 2 to cater for higher
sales for the next 2 days.
So the depot would receive an order for 13 items, reducing its stock to
7. It would now need to replenish its stock but must also anticipate
future orders from the shop. In the absence of any other information,
it might forecast that the shop will now order 13 items per day so
given the two day order time lag it would order 10+3+3+3 = 19
products.
You can see how a small change in consumer demand has become
amplified. The factory in turn might amplify this further, placing an
order of 10+9+9+9 = 37 on its own suppliers.
An increase from just 10 to 11 items sold at the shop could become
an increase from 10 to 37 items placed on the factory's suppliers!
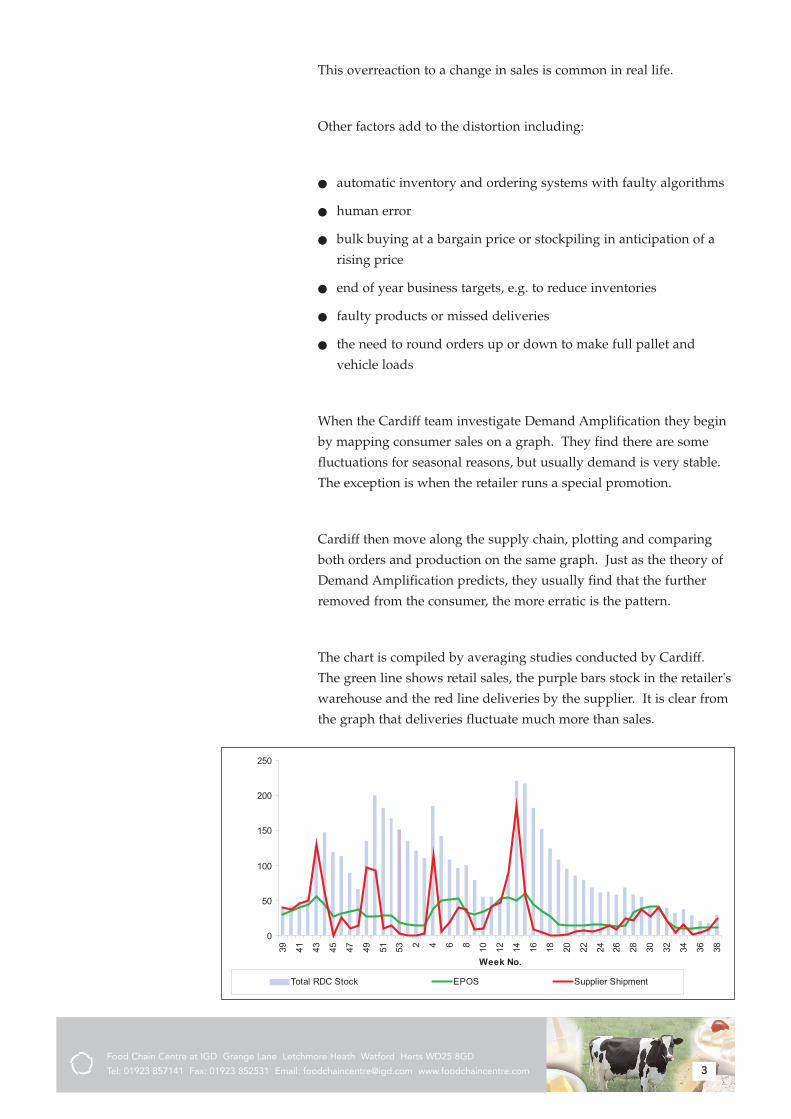
Food Chain Centre at IGD Grange Lane Letchmore Heath Watford Herts WD25 8GD
Tel: 01923 857141 Fax: 01923 852531 Email: [email protected] www.foodchaincentre.com 3
This overreaction to a change in sales is common in real life.
Other factors add to the distortion including:
! automatic inventory and ordering systems with faulty algorithms
! human error
! bulk buying at a bargain price or stockpiling in anticipation of a
rising price
! end of year business targets, e.g. to reduce inventories
! faulty products or missed deliveries
! the need to round orders up or down to make full pallet and
vehicle loads
When the Cardiff team investigate Demand Amplification they begin
by mapping consumer sales on a graph. They find there are some
fluctuations for seasonal reasons, but usually demand is very stable.
The exception is when the retailer runs a special promotion.
Cardiff then move along the supply chain, plotting and comparing
both orders and production on the same graph. Just as the theory of
Demand Amplification predicts, they usually find that the further
removed from the consumer, the more erratic is the pattern.
The chart is compiled by averaging studies conducted by Cardiff.
The green line shows retail sales, the purple bars stock in the retailer's
warehouse and the red line deliveries by the supplier. It is clear from
the graph that deliveries fluctuate much more than sales.
0
50
100
150
200
250
39 41 43 45 47 49 51 53 2 4 6 8 10 12 14 16 18 20 22 24 26 28 30 32 34 36 38
Week No.
Total RDC Stock EPOS Supplier Shipment
Food Chain Centre at IGD Grange Lane Letchmore Heath Watford Herts WD25 8GD
Tel: 01923 857141 Fax: 01923 852531 Email: [email protected] www.foodchaincentre.com 4
Why is Demand Amplification Important?
Demand amplification adds cost to the chain in several ways:
! During the (artificial) peaks it requires more overtime.
! During the troughs, resources and people may lie idle.
! Any over production arising from an excess of milk production
may have to be turned into skimmed milk powder for storage or
sold in other ways that are not as lucrative for the farmer.
! Extra inventory is held to protect against the variability in
demand.
! More administration is needed to manage the problems.
! There is more likelihood of gaps on shelf or price mark-downs for
short life reasons than in a smoothly flowing system.
How to Reduce Demand Amplification
1. Speed the Chain
In our example to illustrate Demand Amplification we included a
two-day lead-time between placing an order and receiving the
products. It was this delay that prompted much of the amplification.
Suppose instead there was just a one-day lag at each stage. In the
same example of a rise in sales from 10 items to 11:
! the order from shop to depot would have been 12 (instead of 13)
! from depot to factory 14 (instead of 19)
! from factory to its suppliers 18 (instead of 37)
So speeding the chain and compressing order response times are key
to resolving Demand Amplification. Remember the aim is to create a
flow, rather than a stutter of products.
Speeding the chain is a central objective of lean thinking. There are
various ways to achieve this but the underlying principle is to
identify and eliminate non-value-adding activities and delays.
Food Chain Centre at IGD Grange Lane Letchmore Heath Watford Herts WD25 8GD
Tel: 01923 857141 Fax: 01923 852531 Email: [email protected] www.foodchaincentre.com 5
2. Share Information
Again referring back to our original example, the amplification arose
largely because companies misinterpreted their customers' actions.
The store made an adjustment to its stock position but the depot
interpreted this as a potential ongoing demand for 13 items. The
same problem arose between the depot and the factory, magnifying
the over-reaction.
Sharing information between the participants, including the latest
sales and current stock positions would have avoided the
misunderstanding. The factory would have seen that consumer sales
had increased only slightly and recognised that the depot and store
were also rebuilding stocks with their latest orders. They could have
forecast that orders would soon settle back to a regular pattern of 11
items and thereby avoided over-reaction.
Developments in technology, such as radio frequency tags and high
speed internet access now make it easier to keep an accurate and up
to date record of stock in the system.
So sharing key information and discussing the reasons behind any
unusual orders is the second key to eliminating Order Amplification.
3. Reduce the Number of Stock Points
In our example chain, every stage maintained an inventory of 10
items. When the rate of sales changed, each player readjusted its
stock by placing an extra-large order. This masked the true rate of
consumer demand and created a wave of amplification.
When companies adjust their stock levels it often sends misleading
signals and this can partly be solved by better communication (as in
point 2). The next stage is to get to the root of the problem and
reduce the number of stock holding points.
Inventory is held for various reasons, but one key purpose is to keep
a safety stock to cope with a sudden surge in demand or disruption in
supply. The more reliable is the chain and the better companies are
able to forecast sales, the less is the need to hold safety stock.
Food Chain Centre at IGD Grange Lane Letchmore Heath Watford Herts WD25 8GD
Tel: 01923 857141 Fax: 01923 852531 Email: [email protected] www.foodchaincentre.com 6
When companies in the chain have little trust in each other and share
little information, everyone maintains a high safety stock. But if the
chain is managed as one complete system, with trust and visibility,
then not only can the amount of stock be reduced but also the number
of stocking points.
4. Improve Sales Forecasting
Referring again to the example, if the increase in consumer demand
had been anticipated, then a larger order could have been made in
advance without any need to adjust stock levels. So accurate sales
forecasting is another protection against Demand Amplification.
Our evidence suggests there is plenty of scope to improve the
accuracy of sales forecasts for dairy products.
Retailers know best about their own customers, suppliers know best
about their own products. So forecasts can usually be improved by
pooling the expertise of retailer and supplier.
5. Improve Reliability
Although our example didn't illustrate this point, human and systems
errors can also distort orders, send confusing signals and create
amplification.
Eliminating errors requires good control procedures, for example:
! Consistent order cut-off times, and no late amendments.
! Computer systems that flag up suspicious data entries to be
checked and validated.
! Minimal intervention with computer generated orders.
! Monitoring and enforcing vehicle delivery slots.
! Developing and implementing Standard Operating Procedures for
handling stock.
Food Chain Centre at IGD Grange Lane Letchmore Heath Watford Herts WD25 8GD
Tel: 01923 857141 Fax: 01923 852531 Email: [email protected] www.foodchaincentre.com 7
6. Measure and Monitor
A basic principle of improvement is that 'only what gets measured,
gets improved'. If Demand Amplification is a problem, then it should
be measured and monitored.
If the gap between retail sales and supplier orders falls outside of a
target range, it should trigger an exception report. This should alert
managers and prompt an investigation. If a problem is found, it
should lead to a corrective action.
It is through simple disciplines like this that problems are brought
under control.
7. Manage Demand
Although forecasting sales is important, companies need not be
completely passive about demand. Sales can be influenced by
various techniques such as advertising, merchandising and
promotions and these can be used to even out demand or link it more
closely to peaks in supply.
For example, ice cream has successfully been promoted as an all year
round product.


�We have always had goodrelations with our producers inDairy Crest Direct but thisproject has thrown up the ideaof developing a more formalsupplier association of thetype that is common in theautomotive industry.
We will work closely with the farmers to jointlyfocus on improving product quality to meet ourmilk specification and to share best practicesamongst the group. A real bonus has been thatSomerfield have offered to play a part in theAssociation which will be a great help in linkingdevelopments in milk production to thecustomer's requirements.�
AArrtthhuurr RReeeevveess,, MMiillkk PPuurrcchhaassiinngg DDiirreeccttoorr,, DDaaiirryyCCrreesstt
Strengthening Relationsin the Dairy Chain A Case Study with Somerfield - Dairy Crest -
Dairy Crest Direct Farmers Group
The dairy industry has often hit the headlines for the wrong reasons.
Too frequently the story has been one of confrontation. Despite the
recent history of antagonism however, many people have been
working to build better relationships.
The Food Chain Centre became involved with one such initiative. We
worked with a complete dairy chain consisting of Somerfield, Dairy
Crest and their farmer organisation, Dairy Crest Direct. Together,
they have been striving to improve their mutual understanding and
to capture the benefits from collaboration.
We at FCC helped in this by applying a technique known as Value
Chain Analysis. This approach has delivered quick benefits for all
participants but even more importantly has led to substantial changes
in the way these businesses will work together in future.
Cutting Costs - AddingValue in Dairy
CaseStudy
June2005
Food Chain Centre at IGD Grange Lane Letchmore Heath Watford Herts WD25 8GD
Tel: 01923 857141 Fax: 01923 852531 Email: [email protected] www.foodchaincentre.com 2
The benefits from this project have included the:
! Establishment of a Supplier Association between farmers and the
cheese plant to improve both efficiency and quality.
! Development of a single sales forecast for the whole chain
managed by Dairy Crest and shared with Somerfield and Dairy
Crest Direct.
! Initiation of a joint packaging project - to review case size, format,
presentation and labelling.
! Introduction of new efficiencies at the cheese packaging plant to
improve product handling and reduce stock.
A less tangible, but important extra benefit, is that the farmers
involved now have a deeper awareness of what happens to their milk
after it leaves the farm. Equally, the retailers have a more complete
appreciation of milk production. Better understanding, we believe, is
a building block for greater trust in the chain.
�We set off on this project expecting it toidentify improvement opportunities. It has, andwe will work to implement these - not just withSomerfield, but with all our customers.
However it has done more than that. It hasgiven our direct milk producers a chance to seethe complexities of an entire supply chain andthat lots happens to their milk after it has beencollected. It has also let one of our customerssee the amount of work that goes into producingproducts for their stores.
Hopefully the project itself and the publication ofthis report will make a contribution to improvingtrust in the dairy industry.�
AArrtthhuurr RReeeevveess

Food Chain Centre at IGD Grange Lane Letchmore Heath Watford Herts WD25 8GD
Tel: 01923 857141 Fax: 01923 852531 Email: [email protected] www.foodchaincentre.com 3
Identifying a Value Chain
All dairy supply chains are complex, with multiple sources of milk
supply, multiple points of manufacture, multiple product and
multiple channels of distribution. In fact it is often better to think of a
supply network rather than a supply chain.
Attempting to analyse all of the potential routes through the supply
network would be unmanageable. Our approach instead is to cut a
slice through and follow a typical product through the chain. This
reveals a number of issues that are usually common for the whole
network.
In the case of this project, a Somerfield own-label, mature cheddar
product was the focus given that this is a high selling product. The
diagram shows the parts of the businesses that were involved.
DavidstowCreamery
HaverfordwestCreamery
HartingtonCreamery
AspitriaCreamery
CheeseMaturation Store
Nuneaton
NuneatonNDC
MaelorPacking Plant
FromePacking Plant
Farmersx1400
Dairy CrestDairies
Dairy CrestCheese
Warehouses
Dairy CrestPackingPlants
Dairy CrestNational
DistributionCentre
SomerfieldRegional
DistributionCentres
SomerfieldStoresx 500
RepresentativeStore
SherburnRDC
Lea GreenRDC
HuntworthRDC
TewkesburyRDC
CardinalRDC
PitreavieRDC
2 Representativefarms
Selecting the Target ProductDairy Crest produce c1000 sku�s50 SKU�s supplied to Somerfield.A Top selling Mature Cheddar
was selected as focus for analysis
Somerfield - Dairy Crest Cheese Supply Chain Network
The work itself was conducted by senior executives from the three
businesses involved supported by facilitators from Cardiff Business
School.
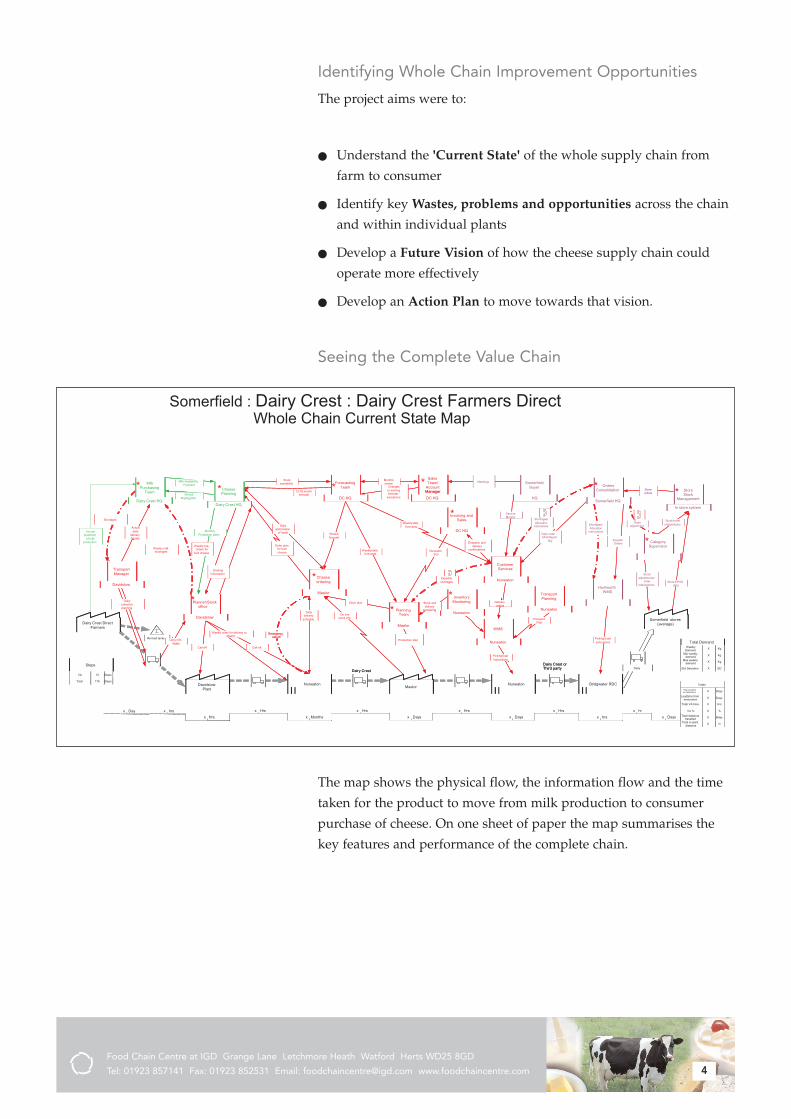
Food Chain Centre at IGD Grange Lane Letchmore Heath Watford Herts WD25 8GD
Tel: 01923 857141 Fax: 01923 852531 Email: [email protected] www.foodchaincentre.com 4
Identifying Whole Chain Improvement Opportunities
The project aims were to:
! Understand the 'Current State' of the whole supply chain from
farm to consumer
! Identify key Wastes, problems and opportunities across the chain
and within individual plants
! Develop a Future Vision of how the cheese supply chain could
operate more effectively
! Develop an Action Plan to move towards that vision.
Seeing the Complete Value Chain
Dairy Crest DirectFarmers
Re-load tanks
DavidstowPlant
NuneatonMaelor
Nuneaton Bridgwater RDC
Somerfield stores(average)
In store system
StoreStock
Management
Store EPOSdata
Somerfield HQ
OrdersConsolidation
Nuneaton
CustomerServices
Daily order -SKU/Depot/
Qty
Deliveryorders
DC HQ
SalesTeam/
Account
Dairy Crest DirectFarmers
Re-load tanks
DavidstowPlant
NuneatonMaelor
Nuneaton Bridgwater RDC
Somerfield stores(average)
In store system
StoreStock
Management
Store EPOSdata
Somerfield HQ
OrdersConsolidation
Nuneaton
CustomerServices
Daily order -SKU/Depot/
Qty
Deliveryorders
DC HQ
SalesTeam/
AccountManager
Dairy Crest HQ
CheesePlanning
MonthlyProduction plans
Davidstow
Planner/Stockoffice
Dairy Crest HQ
MilkPurchasing
Team
Davidstow
TransportManager
Actualdaily
deliveryfigures
Dailycollectionplanning
Weekly order for delivery toMaelor
Call-off
Dairy Crest
Dairy Crest orThird party Daily
Shortages/Allocation
instructions
Weekly pre-orders for
bulk cheese
AnnualBuying plan
Milk AvailabilityForecast
Annualprediction
of milkproduction
Shortages/Allocation
instructions
Daily milkintake
Call-off
Weekly milkshortages
Shortages
Maelor
PlanningTeam
Production plan
DC HQ
Invoicing andSales
NuneatonFGI
Expediteshortages
Changesto existingforecast -
exceptions HQ
SomerfieldBuyer
Meetings
Maelor
Cheeseordering
Stock plan
On linestock info
Order planfor bulkcheese
Dailydelivery
schedule
Manager
Dairy Crest HQ
CheesePlanning
MonthlyProduction plans
Davidstow
Planner/Stockoffice
Dairy Crest HQ
MilkPurchasing
Team
Davidstow
TransportManager
Actualdaily
deliveryfigures
Dailycollectionplanning
Weekly order for delivery toMaelor
Call-off
Dairy Crest
Dairy Crest orThird party Daily
Shortages/Allocation
instructions
Weekly pre-orders for
bulk cheese
AnnualBuying plan
Milk AvailabilityForecast
Annualprediction
of milkproduction
Shortages/Allocation
instructions
Daily milkintake
Call-off
Weekly milkshortages
Shortages
Maelor
PlanningTeam
Production plan
DC HQ
Invoicing andSales
NuneatonFGI
Expediteshortages
Changesto existingforecast -
exceptions HQ
SomerfieldBuyer
Meetings
Maelor
Cheeseordering
Stock plan
On linestock info
Order planfor bulkcheese
Dailydelivery
schedule
Emergencycall-off
Dailyoptimisation
of loads
ServiceMonitor
Despatch anddelivery
confirmations
Nuneaton
TransportPlanning
TransportPlan
Nuneaton
InventoryMonitoringStock and
deliverymonitoring
Nuneaton
WMS
Picking/loadinstructions
HuntworthWMS
CategorySupervisor
Stockadjustments/
orderinterventions
Orderadjustment
Stock/orderinterventions
SupplierOrders
x Days
x Hrs
x Months
x Hrs
x Days
x Hrs
x Days
x Hrs
x hrs
x hr
x Days
WeeklyDemand KgX
Max weeklydemand KgX
Min weeklydemand KgX
Steps
Total Steps176
VA Steps13
Totals
Total Leadtime(ex. Maturation) DaysX
Leadtime frommaturation DaysX
Total VA time HrsX
Total distancetravelled MilesX
Total in-plantdistance mX
Total Demand
Std Deviation SDX
x Day VA % %X
**
*
**
*
*
*
*
*
*
Gradinginformation
DC HQ
ForecastingTeam
Stockavailability *
Monthlyreview
12-18 monthforecast
Weekly/dailyforecasts
Weeklyforecast
Weekly/dailyforecasts
Storeorders
Picking/Loadinstructions
x Hrsx hrs
Somerfield : Dairy Crest : Dairy Crest Farmers Direct Whole Chain Current State Map
The map shows the physical flow, the information flow and the time
taken for the product to move from milk production to consumer
purchase of cheese. On one sheet of paper the map summarises the
key features and performance of the complete chain.
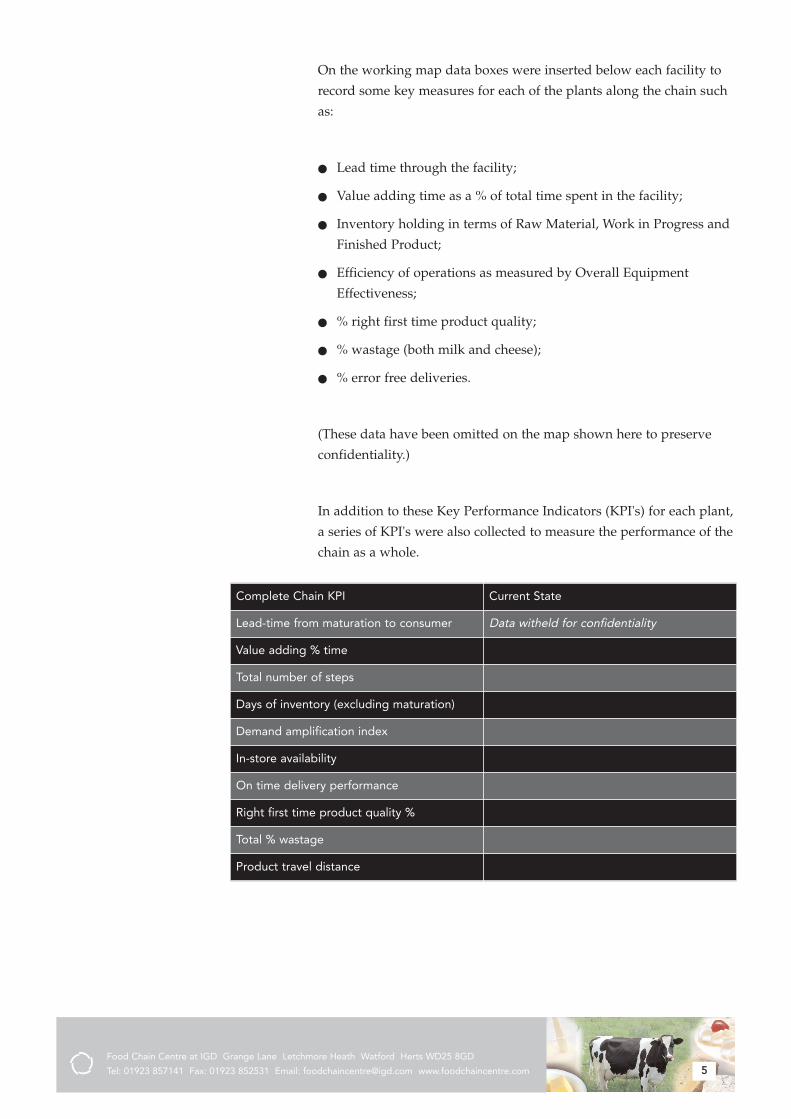
Food Chain Centre at IGD Grange Lane Letchmore Heath Watford Herts WD25 8GD
Tel: 01923 857141 Fax: 01923 852531 Email: [email protected] www.foodchaincentre.com 5
On the working map data boxes were inserted below each facility to
record some key measures for each of the plants along the chain such
as:
! Lead time through the facility;
! Value adding time as a % of total time spent in the facility;
! Inventory holding in terms of Raw Material, Work in Progress and
Finished Product;
! Efficiency of operations as measured by Overall Equipment
Effectiveness;
! % right first time product quality;
! % wastage (both milk and cheese);
! % error free deliveries.
(These data have been omitted on the map shown here to preserve
confidentiality.)
In addition to these Key Performance Indicators (KPI's) for each plant,
a series of KPI's were also collected to measure the performance of the
chain as a whole.
Complete Chain KPI Current State
Lead-time from maturation to consumer Data witheld for confidentiality
Value adding % time
Total number of steps
Days of inventory (excluding maturation)
Demand amplification index
In-store availability
On time delivery performance
Right first time product quality %
Total % wastage
Product travel distance
Food Chain Centre at IGD Grange Lane Letchmore Heath Watford Herts WD25 8GD
Tel: 01923 857141 Fax: 01923 852531 Email: [email protected] www.foodchaincentre.com 6
�The development of the Value Chain KPI's isthe first time we have had a set of measures thatallows us to summarise the efficiency of acomplete supply chain from farm through to theconsumer point of purchase.�
GGeerraalldd SSuuttttoonn,, HHeeaadd ooff SSuuppppllyy CChhaaiinn,, SSoommeerrffiieellddSSttoorreess LLttdd
Problems and Opportunities
As with any project of this nature, problems were uncovered with the
existing chain. Or to state this more positively, opportunities for
improvement were revealed. The following gives a flavour of what
was found.
! Supply chain forecasting
Maturation requirements inevitably mean long lead times in cheese
production and so good sales forecasting is vital. The mapping
revealed that many different people within the chain were making
forecasts and these were often inconsistent. This is a common
problem that the Cardiff Business School facilitators had seen in many
supply chains and in many industries.
The team agreed it would be better to compile a common forecast by
sharing information from the retailer about sales trends, the processor
about stock levels & production capacity and the farmers in terms of
milk availability.
Dairy Crest was already in the process of updating its forecasting
systems and has now re-specified it to work in this new collaborative
way.
! Information flow and demand amplification
The team found that there was already plenty of information
exchanged in this chain, largely by computer. They drew up an
'information flow map' which was quite complex. One of the issues
revealed was the number of manual corrections made to the
automated data. This was a big time-stealer and suggested that more
work was needed to correct data errors at source.
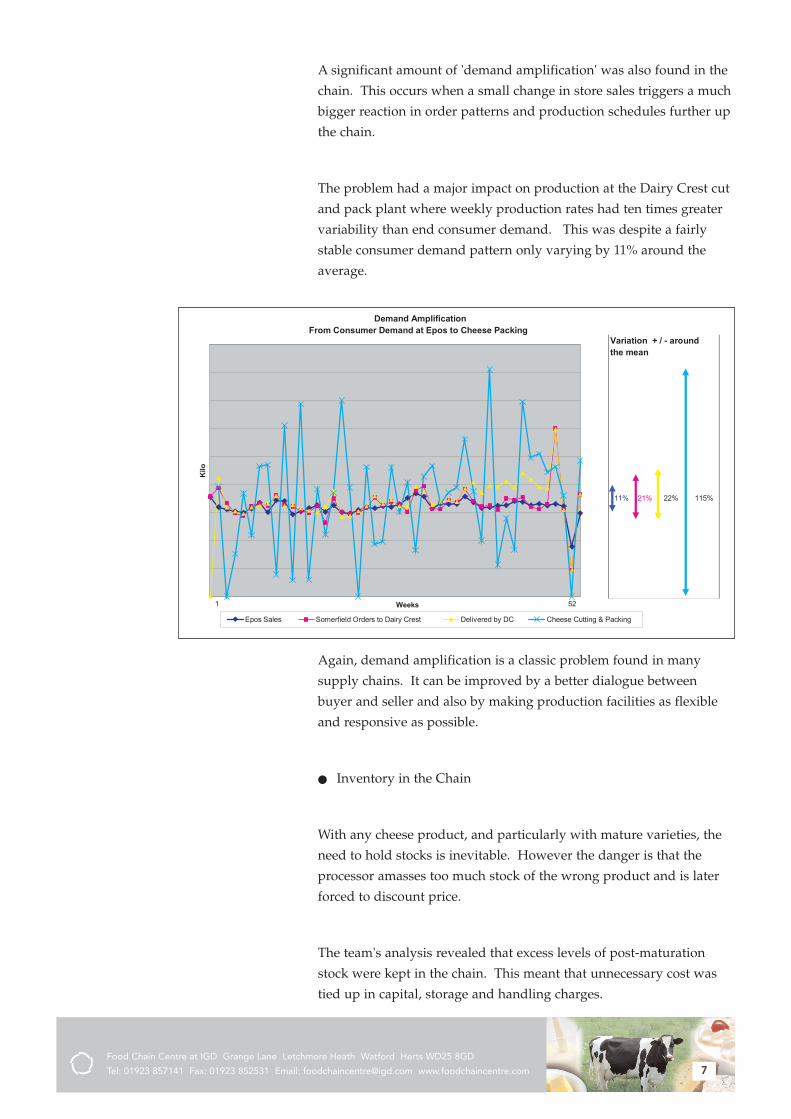
Food Chain Centre at IGD Grange Lane Letchmore Heath Watford Herts WD25 8GD
Tel: 01923 857141 Fax: 01923 852531 Email: [email protected] www.foodchaincentre.com 7
A significant amount of 'demand amplification' was also found in the
chain. This occurs when a small change in store sales triggers a much
bigger reaction in order patterns and production schedules further up
the chain.
The problem had a major impact on production at the Dairy Crest cut
and pack plant where weekly production rates had ten times greater
variability than end consumer demand. This was despite a fairly
stable consumer demand pattern only varying by 11% around the
average.
Demand Amplification
From Consumer Demand at Epos to Cheese Packing
Weeks
Kilo
Epos Sales Somerfield Orders to Dairy Crest Delivered by DC Cheese Cutting & Packing
Variation + / - around the mean
11% 21% 22% 115%
1 52
Again, demand amplification is a classic problem found in many
supply chains. It can be improved by a better dialogue between
buyer and seller and also by making production facilities as flexible
and responsive as possible.
! Inventory in the Chain
With any cheese product, and particularly with mature varieties, the
need to hold stocks is inevitable. However the danger is that the
processor amasses too much stock of the wrong product and is later
forced to discount price.
The team's analysis revealed that excess levels of post-maturation
stock were kept in the chain. This meant that unnecessary cost was
tied up in capital, storage and handling charges.

Food Chain Centre at IGD Grange Lane Letchmore Heath Watford Herts WD25 8GD
Tel: 01923 857141 Fax: 01923 852531 Email: [email protected] www.foodchaincentre.com 8
By jointly reviewing policies for ordering, inventory holding and
production, opportunities to reduce stock holding were identified for
both Dairy Crest and Somerfield.
! Product handling and transport
Various opportunities were identified to reduce product handling and
movement within plants by reviewing plant layout and materials
handling techniques. Each movement adds cost and increases the
likelihood of damage, so the smaller the number of movements the
better.
Possibilities were also identified to improve the efficiency of milk
collection and inter-plant transport movements of semi-finished and
finished products.
Developing a Vision for the Future
The team held a one-day workshop to develop a shared view of their
ideal chain of the future and to produce an action plan.
The 'lean thinking' philosophy of Cardiff Business School stresses the
importance of everyone in the chain focusing on consumer value.
This ensures that any recommendations contribute towards a better
service to consumers whether through efficiency, reliability or quality.
The team agreed a series of improvement objectives and categorised
these according to their impact on Quality, Cost (efficiency) and
Delivery (reliability).
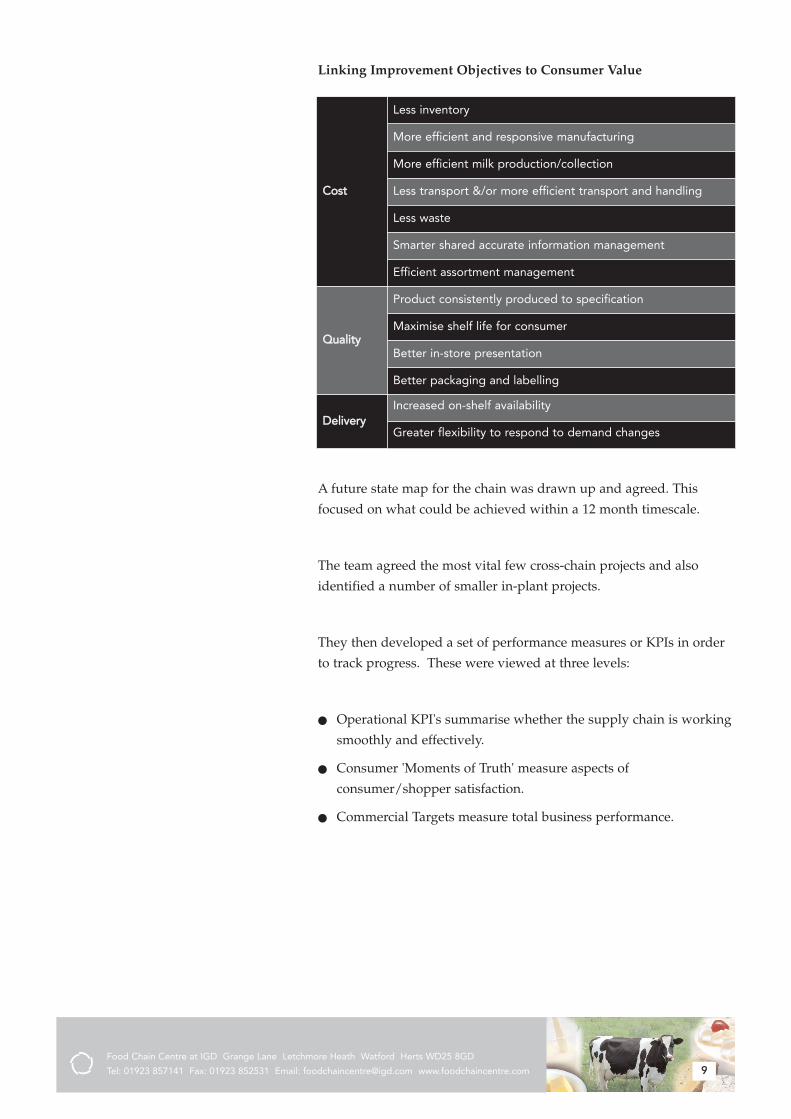
Food Chain Centre at IGD Grange Lane Letchmore Heath Watford Herts WD25 8GD
Tel: 01923 857141 Fax: 01923 852531 Email: [email protected] www.foodchaincentre.com 9
Linking Improvement Objectives to Consumer Value
Cost
Less inventory
More efficient and responsive manufacturing
More efficient milk production/collection
Less transport &/or more efficient transport and handling
Less waste
Smarter shared accurate information management
Efficient assortment management
Quality
Product consistently produced to specification
Maximise shelf life for consumer
Better in-store presentation
Better packaging and labelling
DeliveryIncreased on-shelf availability
Greater flexibility to respond to demand changes
A future state map for the chain was drawn up and agreed. This
focused on what could be achieved within a 12 month timescale.
The team agreed the most vital few cross-chain projects and also
identified a number of smaller in-plant projects.
They then developed a set of performance measures or KPIs in order
to track progress. These were viewed at three levels:
! Operational KPI's summarise whether the supply chain is working
smoothly and effectively.
! Consumer 'Moments of Truth' measure aspects of
consumer/shopper satisfaction.
! Commercial Targets measure total business performance.
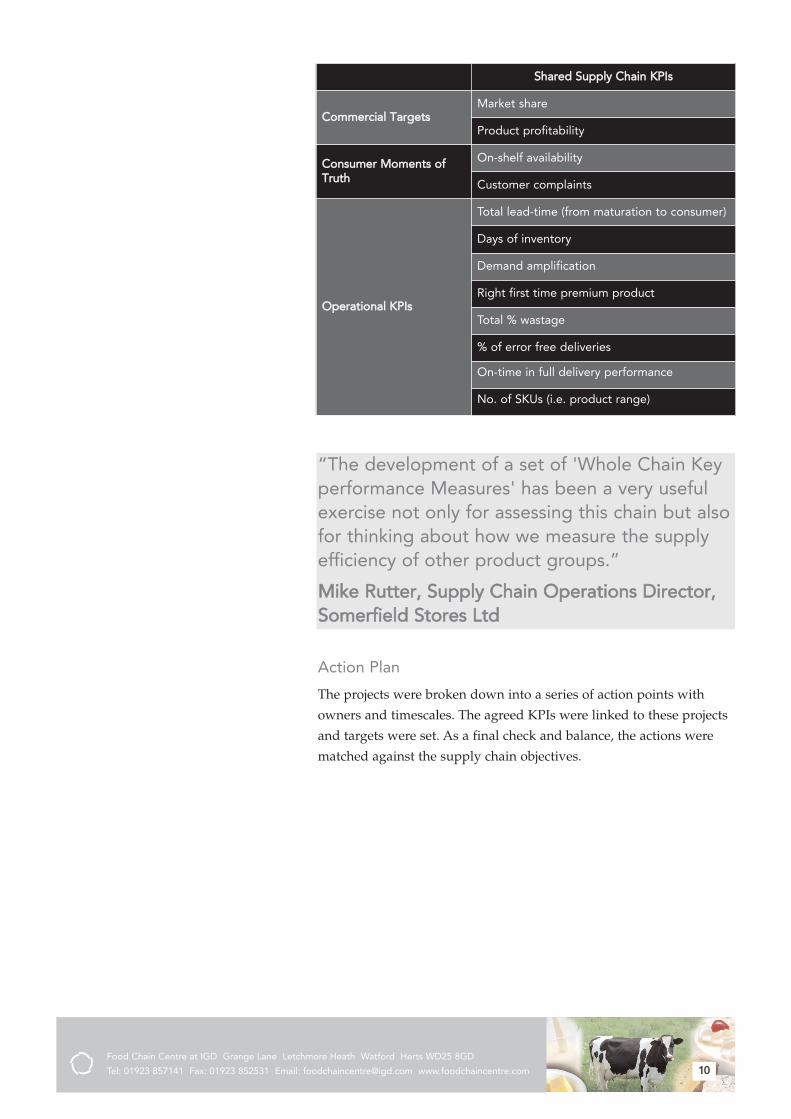
Food Chain Centre at IGD Grange Lane Letchmore Heath Watford Herts WD25 8GD
Tel: 01923 857141 Fax: 01923 852531 Email: [email protected] www.foodchaincentre.com 10
Shared Supply Chain KPIs
Commercial TargetsMarket share
Product profitability
Consumer Moments ofTruth
On-shelf availability
Customer complaints
Operational KPIs
Total lead-time (from maturation to consumer)
Days of inventory
Demand amplification
Right first time premium product
Total % wastage
% of error free deliveries
On-time in full delivery performance
No. of SKUs (i.e. product range)
�The development of a set of 'Whole Chain Keyperformance Measures' has been a very usefulexercise not only for assessing this chain but alsofor thinking about how we measure the supplyefficiency of other product groups.�
MMiikkee RRuutttteerr,, SSuuppppllyy CChhaaiinn OOppeerraattiioonnss DDiirreeccttoorr,,SSoommeerrffiieelldd SSttoorreess LLttdd
Action Plan
The projects were broken down into a series of action points with
owners and timescales. The agreed KPIs were linked to these projects
and targets were set. As a final check and balance, the actions were
matched against the supply chain objectives.

Food Chain Centre at IGD Grange Lane Letchmore Heath Watford Herts WD25 8GD
Tel: 01923 857141 Fax: 01923 852531 Email: [email protected] www.foodchaincentre.com 11
Improvement InitiativeJoint packaging
project
One forecast forwhole chain and
demandsmoothing
DavidstowSupplier
Association
Daily levelproduction
system
KPI Measures
Days of inventory
Demandamplification
Demandamplification. Days of inventory.On-shelfavailability
Milk Quality tospecificationRight first timepremium productDelivery toforecastLevelled supply
Lead-time to endconsumerDays of inventoryScheduleadherance
Cos
tO
bje
ctiv
es
Less Inventory Y Y
More responsive cost effectivemanufacturing
Y
More efficient milk production/collection
Y
Less transport &/or MoreEfficient Transport/ handling
Y
Reduce the cost of productwaste
Y
Smarter shared accurateinformation management
Y
Efficient assortment management Y
Qua
lity
Ob
ject
ives
Product consistently produced tospecification
Y
Maximise shelf life for consumer Y Y
Better in-sstore presentation Y
Better packaging and labelling Y
Del
iver
yO
jbec
tive
s
On-sshelf availabilityY
Flexibility and speed to respondto demand changes Y
Y = the Improvement Initiative contributes to the objective
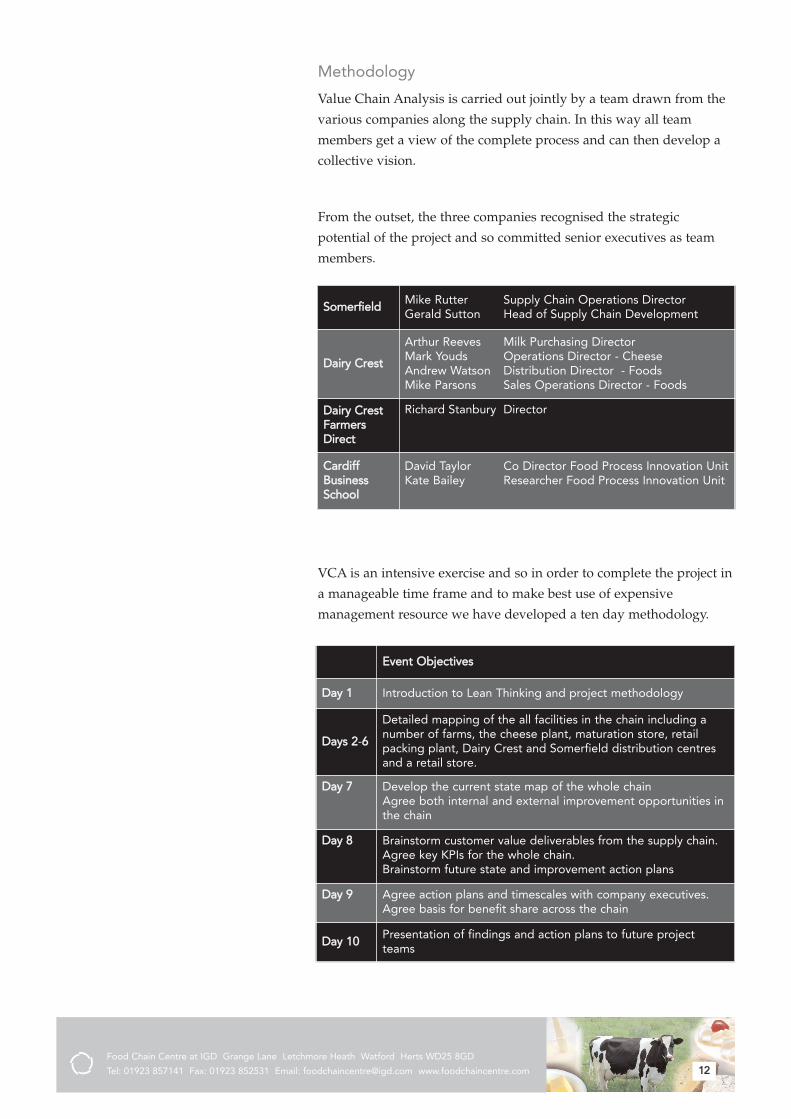
Food Chain Centre at IGD Grange Lane Letchmore Heath Watford Herts WD25 8GD
Tel: 01923 857141 Fax: 01923 852531 Email: [email protected] www.foodchaincentre.com 12
Methodology
Value Chain Analysis is carried out jointly by a team drawn from the
various companies along the supply chain. In this way all team
members get a view of the complete process and can then develop a
collective vision.
From the outset, the three companies recognised the strategic
potential of the project and so committed senior executives as team
members.
SomerfieldMike Rutter Supply Chain Operations DirectorGerald Sutton Head of Supply Chain Development
Dairy Crest
Arthur Reeves Milk Purchasing DirectorMark Youds Operations Director - CheeseAndrew Watson Distribution Director - FoodsMike Parsons Sales Operations Director - Foods
Dairy CrestFarmersDirect
Richard Stanbury Director
CardiffBusinessSchool
David Taylor Co Director Food Process Innovation UnitKate Bailey Researcher Food Process Innovation Unit
VCA is an intensive exercise and so in order to complete the project in
a manageable time frame and to make best use of expensive
management resource we have developed a ten day methodology.
Event Objectives
Day 1 Introduction to Lean Thinking and project methodology
Days 2-66
Detailed mapping of the all facilities in the chain including anumber of farms, the cheese plant, maturation store, retailpacking plant, Dairy Crest and Somerfield distribution centresand a retail store.
Day 7 Develop the current state map of the whole chain Agree both internal and external improvement opportunities inthe chain
Day 8 Brainstorm customer value deliverables from the supply chain.Agree key KPIs for the whole chain. Brainstorm future state and improvement action plans
Day 9 Agree action plans and timescales with company executives.Agree basis for benefit share across the chain
Day 10Presentation of findings and action plans to future projectteams
Food Chain Centre at IGD Grange Lane Letchmore Heath Watford Herts WD25 8GD
Tel: 01923 857141 Fax: 01923 852531 Email: [email protected] www.foodchaincentre.com 13
Lean Thinking
The first day of the project takes the form of a training session to
introduce the team to 'Lean Thinking' which provides the theoretical
basis behind value chain analysis.
Lean concepts were developed by Toyota the Japanese automotive
manufacturer although in recent years many of the lean approaches
have been applied to great effect in other industries.
Two key concepts are:
! a focus on exactly what provides value to consumers
! eliminating non-value adding activities (or in other words waste)
in the chain
�The team spent some time discussing what isvalue in cheese products from the point of viewof the end consumer. As a farmer this was thefirst time I have been involved in such adiscussion with both the dairy and the retailer. Itwas particularly useful to think what contributionthe farmer at the top end of the chain can maketo providing customer value and how thefarmer's contribution can be communicated tothe consumer.�
RRiicchhaarrdd SSttaannbbuurryy,, DDiirreeccttoorr,, DDaaiirryy CCrreesstt FFaarrmmeerrssDDiirreecctt
There are five guiding principles of Lean Thinking:
! Define value in terms of the end customer and identify the steps to
deliver this through the supply chain.
! Identify and eliminate any wasteful activities that do not directly
add value to the customer.
! Make those remaining activities flow as smoothly as possible.
! Use the customer demand rate to pull products through the value
chain.
! Pursue perfection by constantly striving to eliminate waste and
increase overall value to the end customer.
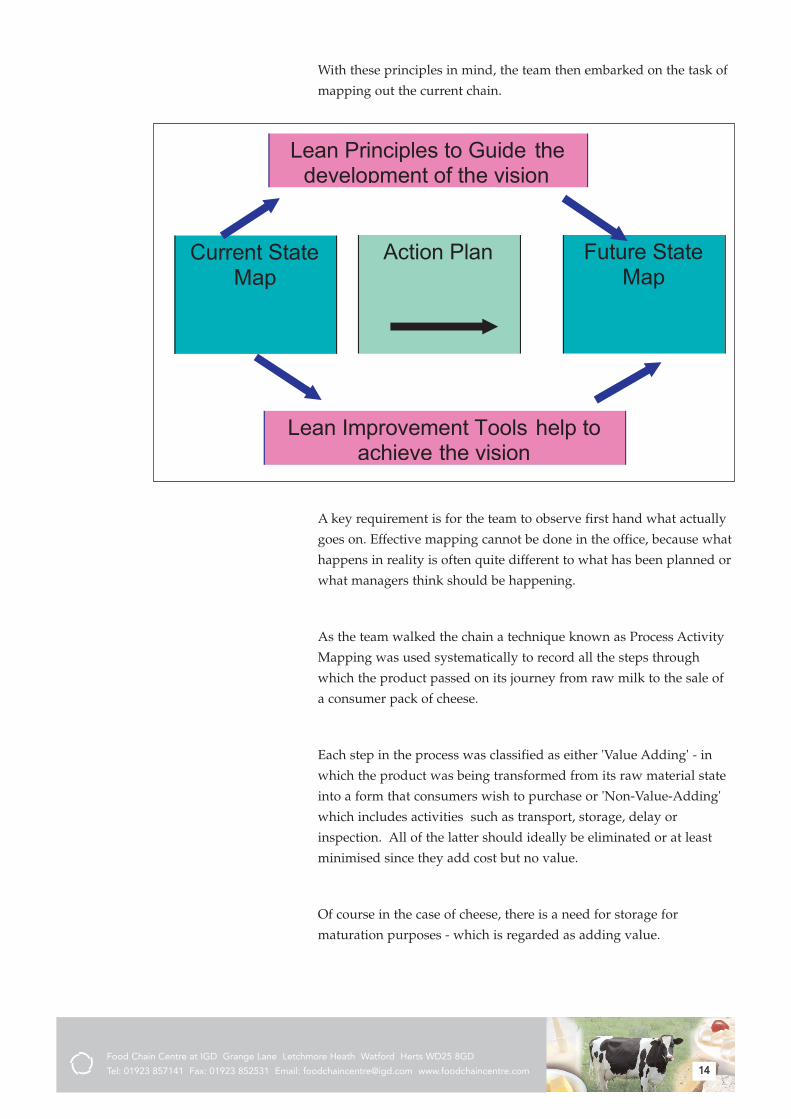
Food Chain Centre at IGD Grange Lane Letchmore Heath Watford Herts WD25 8GD
Tel: 01923 857141 Fax: 01923 852531 Email: [email protected] www.foodchaincentre.com 14
With these principles in mind, the team then embarked on the task of
mapping out the current chain.
Current State Map
Future State Map
Lean Improvement Tools help to achieve the vision
Action Plan
Lean Principles to Guide the development of the vision
A key requirement is for the team to observe first hand what actually
goes on. Effective mapping cannot be done in the office, because what
happens in reality is often quite different to what has been planned or
what managers think should be happening.
As the team walked the chain a technique known as Process Activity
Mapping was used systematically to record all the steps through
which the product passed on its journey from raw milk to the sale of
a consumer pack of cheese.
Each step in the process was classified as either 'Value Adding' - in
which the product was being transformed from its raw material state
into a form that consumers wish to purchase or 'Non-Value-Adding'
which includes activities such as transport, storage, delay or
inspection. All of the latter should ideally be eliminated or at least
minimised since they add cost but no value.
Of course in the case of cheese, there is a need for storage for
maturation purposes - which is regarded as adding value.
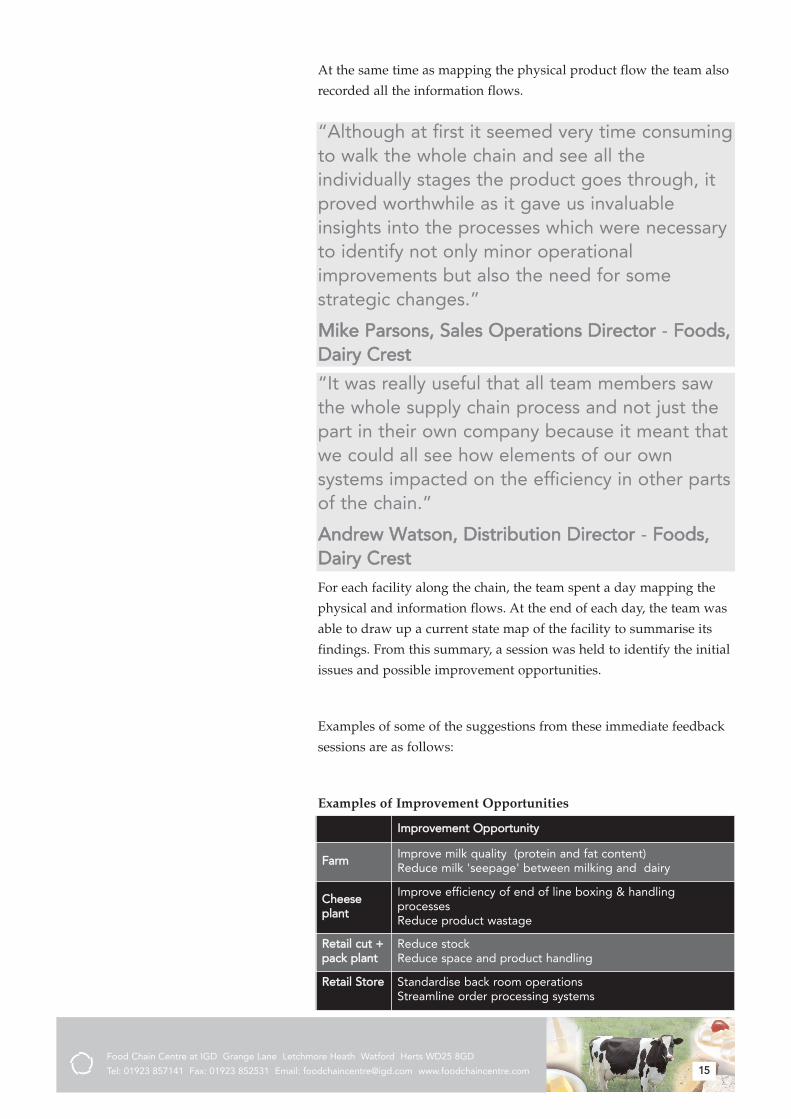
Food Chain Centre at IGD Grange Lane Letchmore Heath Watford Herts WD25 8GD
Tel: 01923 857141 Fax: 01923 852531 Email: [email protected] www.foodchaincentre.com 15
At the same time as mapping the physical product flow the team also
recorded all the information flows.
�Although at first it seemed very time consumingto walk the whole chain and see all theindividually stages the product goes through, itproved worthwhile as it gave us invaluableinsights into the processes which were necessaryto identify not only minor operationalimprovements but also the need for somestrategic changes.�
MMiikkee PPaarrssoonnss,, SSaalleess OOppeerraattiioonnss DDiirreeccttoorr - FFooooddss,,DDaaiirryy CCrreesstt
�It was really useful that all team members sawthe whole supply chain process and not just thepart in their own company because it meant thatwe could all see how elements of our ownsystems impacted on the efficiency in other partsof the chain.�
AAnnddrreeww WWaattssoonn,, DDiissttrriibbuuttiioonn DDiirreeccttoorr - FFooooddss,,DDaaiirryy CCrreesstt
For each facility along the chain, the team spent a day mapping the
physical and information flows. At the end of each day, the team was
able to draw up a current state map of the facility to summarise its
findings. From this summary, a session was held to identify the initial
issues and possible improvement opportunities.
Examples of some of the suggestions from these immediate feedback
sessions are as follows:
Examples of Improvement Opportunities
Improvement Opportunity
FarmImprove milk quality (protein and fat content) Reduce milk 'seepage' between milking and dairy
Cheeseplant
Improve efficiency of end of line boxing & handlingprocesses Reduce product wastage
Retail cut +pack plant
Reduce stock Reduce space and product handling
Retail Store Standardise back room operationsStreamline order processing systems
Food Chain Centre at IGD Grange Lane Letchmore Heath Watford Herts WD25 8GD
Tel: 01923 857141 Fax: 01923 852531 Email: [email protected] www.foodchaincentre.com 16
Conclusions
�This project has neatly demonstrated theobvious benefits of end to end thinking whenlooking at value chains. It uncovered the clearand less clear opportunities available and has leftall parties with a realistic challenge of reallymaking a difference.�
GGeerraalldd SSuuttttoonn
�The project uncovered a number ofopportunities to improve efficiencies, and takeoverlap out of the chain. The challenge is to nowconvert potential savings into actual savings.Some low cost ideas need acting on quickly,while others may be incorporated into futurestrategic planning.
The project highlighted the complexity of thesupply chain, I believe this would be an eyeopener for any milk producer; it also revealed amanagement technique capable of benefitingmany businesses.�
RRiicchhaarrdd SSttaannbbuurryy
Food Chain Centre at IGD Grange Lane Letchmore Heath Watford Herts WD25 8GD
Tel: 01923 857141 Fax: 01923 852531 Email: [email protected] www.foodchaincentre.com 17
�Taking part in the Cheese Value Chain work hasbeen a truly 'eye opening' experience. Thefindings clearly highlight a number of excellentopportunities for all parties to drive additionalvalue into all parts of the chain. The realchallenge is how we translate those findings rightacross our supply chain and capture theconsiderable scaleable benefits.�
MMiikkee RRuutttteerr
�The Board of Dairy Crest Direct recognised thatthis project would give an opportunity forfarmers to gain a much greater understanding ofthe whole supply chain, and give the potential tobring real benefits back to members in the longterm through working more closely with ourcustomers.�
RRiicchhaarrdd SSttaannbbuurryy
�At first we were unsure as to whether focusingon one product and one route through thesupply chain would be truly representative, butwe realise that many of the issues andopportunities identified by the analysis arecommon to many of our other value streams notonly in other cheese products but also in otherdairy products.�
GGeerraalldd SSuuttttoonn
Food Chain Centre at IGD Grange Lane Letchmore Heath Watford Herts WD25 8GD
Tel: 01923 857141 Fax: 01923 852531 Email: [email protected] www.foodchaincentre.com 18
�Clearly it is in everyone's interest to have asefficient and effective a supply chain as possible.I thought the study would identify opportunitiesfor improvement. There was also anotheropportunity - to improve relationships in thedairy industry.
When we started this project there had been afocus on a lack of trust within the dairy supplychain. Dairy Crest wants to prove that this is notthe case.
Engaging in this project was one of a number ofthings we have done and continue to do toregain trust.�
AArrtthhuurr RReeeevveess
The Food Chain Centre acknowledges the help of David Taylor and
Kate Bailey from Cardiff Business School in preparing this case study.
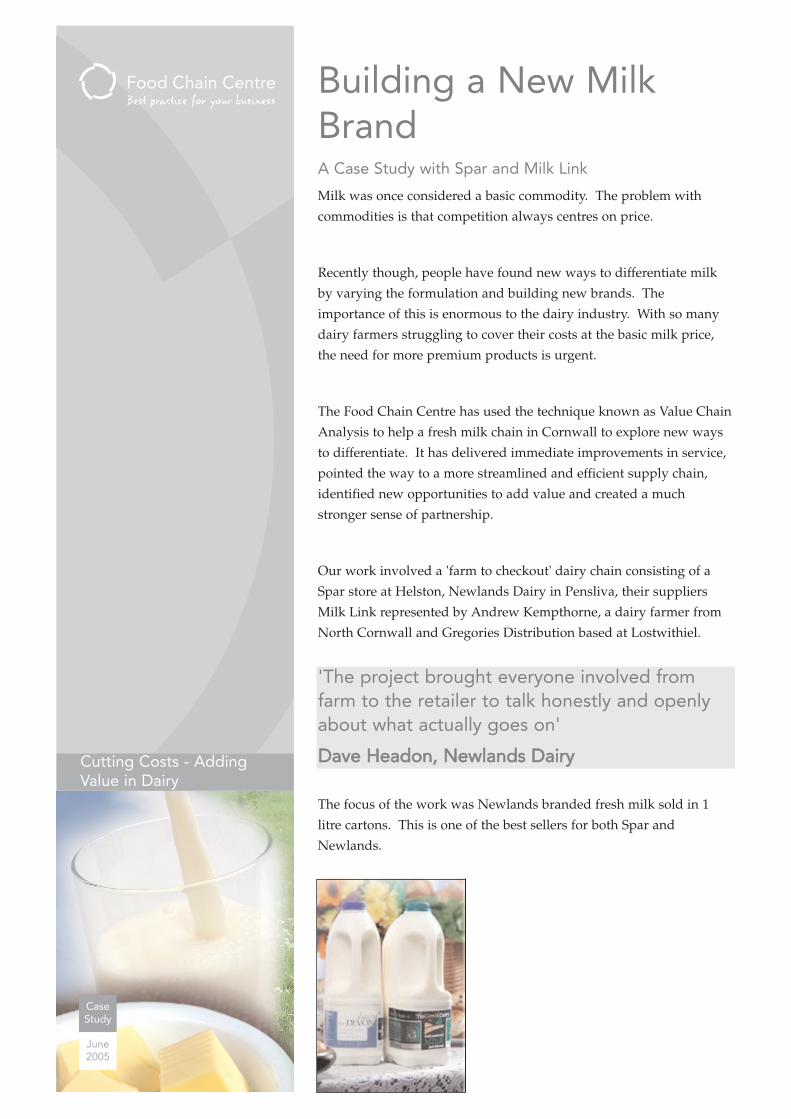
Building a New MilkBrandA Case Study with Spar and Milk Link
Milk was once considered a basic commodity. The problem with
commodities is that competition always centres on price.
Recently though, people have found new ways to differentiate milk
by varying the formulation and building new brands. The
importance of this is enormous to the dairy industry. With so many
dairy farmers struggling to cover their costs at the basic milk price,
the need for more premium products is urgent.
The Food Chain Centre has used the technique known as Value Chain
Analysis to help a fresh milk chain in Cornwall to explore new ways
to differentiate. It has delivered immediate improvements in service,
pointed the way to a more streamlined and efficient supply chain,
identified new opportunities to add value and created a much
stronger sense of partnership.
Our work involved a 'farm to checkout' dairy chain consisting of a
Spar store at Helston, Newlands Dairy in Pensliva, their suppliers
Milk Link represented by Andrew Kempthorne, a dairy farmer from
North Cornwall and Gregories Distribution based at Lostwithiel.
'The project brought everyone involved fromfarm to the retailer to talk honestly and openlyabout what actually goes on'
DDaavvee HHeeaaddoonn,, NNeewwllaannddss DDaaiirryy
The focus of the work was Newlands branded fresh milk sold in 1
litre cartons. This is one of the best sellers for both Spar and
Newlands.
Cutting Costs - AddingValue in Dairy
CaseStudy
June2005
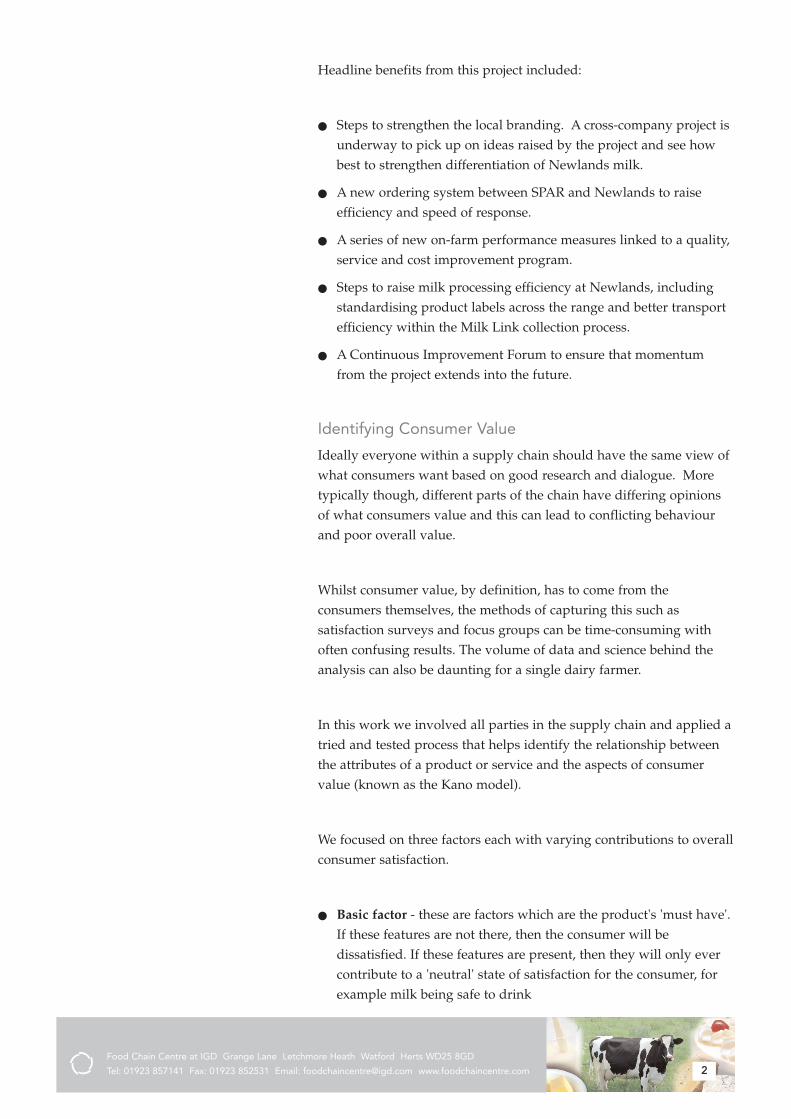
Food Chain Centre at IGD Grange Lane Letchmore Heath Watford Herts WD25 8GD
Tel: 01923 857141 Fax: 01923 852531 Email: [email protected] www.foodchaincentre.com 2
Headline benefits from this project included:
! Steps to strengthen the local branding. A cross-company project isunderway to pick up on ideas raised by the project and see howbest to strengthen differentiation of Newlands milk.
! A new ordering system between SPAR and Newlands to raiseefficiency and speed of response.
! A series of new on-farm performance measures linked to a quality,service and cost improvement program.
! Steps to raise milk processing efficiency at Newlands, includingstandardising product labels across the range and better transportefficiency within the Milk Link collection process.
! A Continuous Improvement Forum to ensure that momentumfrom the project extends into the future.
Identifying Consumer Value
Ideally everyone within a supply chain should have the same view ofwhat consumers want based on good research and dialogue. Moretypically though, different parts of the chain have differing opinionsof what consumers value and this can lead to conflicting behaviourand poor overall value.
Whilst consumer value, by definition, has to come from theconsumers themselves, the methods of capturing this such assatisfaction surveys and focus groups can be time-consuming withoften confusing results. The volume of data and science behind theanalysis can also be daunting for a single dairy farmer.
In this work we involved all parties in the supply chain and applied atried and tested process that helps identify the relationship betweenthe attributes of a product or service and the aspects of consumervalue (known as the Kano model).
We focused on three factors each with varying contributions to overallconsumer satisfaction.
! Basic factor - these are factors which are the product's 'must have'.If these features are not there, then the consumer will bedissatisfied. If these features are present, then they will only evercontribute to a 'neutral' state of satisfaction for the consumer, forexample milk being safe to drink
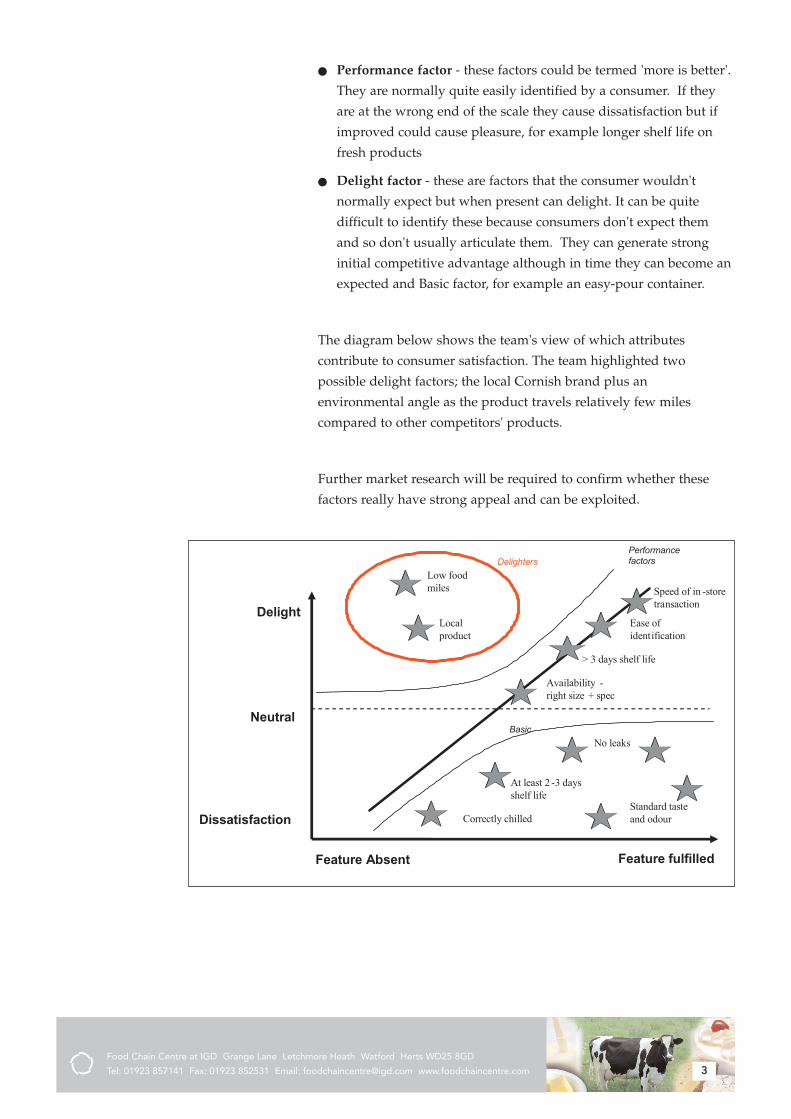
Food Chain Centre at IGD Grange Lane Letchmore Heath Watford Herts WD25 8GD
Tel: 01923 857141 Fax: 01923 852531 Email: [email protected] www.foodchaincentre.com 3
! Performance factor - these factors could be termed 'more is better'.
They are normally quite easily identified by a consumer. If they
are at the wrong end of the scale they cause dissatisfaction but if
improved could cause pleasure, for example longer shelf life on
fresh products
! Delight factor - these are factors that the consumer wouldn't
normally expect but when present can delight. It can be quite
difficult to identify these because consumers don't expect them
and so don't usually articulate them. They can generate strong
initial competitive advantage although in time they can become an
expected and Basic factor, for example an easy-pour container.
The diagram below shows the team's view of which attributes
contribute to consumer satisfaction. The team highlighted two
possible delight factors; the local Cornish brand plus an
environmental angle as the product travels relatively few miles
compared to other competitors' products.
Further market research will be required to confirm whether these
factors really have strong appeal and can be exploited.
Standard taste and odour
No leaks
At least 2 -3 days shelf life
Speed of in -store transaction
Availability -right size + spec
> 3 days shelf life
Ease of identification
Low food miles
Local product
Neutral
Delight
Dissatisfaction
Feature Absent Feature fulfilled
Delighters
Basic
Performance factors
Correctly chilled
Food Chain Centre at IGD Grange Lane Letchmore Heath Watford Herts WD25 8GD
Tel: 01923 857141 Fax: 01923 852531 Email: [email protected] www.foodchaincentre.com 4
�Local products boost business and nourish thecommunity. I'm very proud to be selling a locallyproduced product and it is important that wecapitalise more on this local aspect.�
CChhrriiss SShhaarrrriinnttoonn,, SSPPAARR HHeellssttoonn
�All of us within the farming community need tobecome more market orientated. This was agood exercise to get to know what will makeconsumers want to buy our products.�
AAnnddrreeww KKeemmpptthhoorrnnee,, DDaaiirryy FFaarrmmeerr
Creating a Common Purpose
Creating a common purpose along the supply chain is important to
delivering consumer value. Our team developed a set of objectives
which defined what the supply chain has to excel at in order to
provide value.
SUPPLY CHAIN OBJECTIVES
! Correct quality (product and packaging) every time with no
variation
! Shortest lead time
! Cost effective production
! Cost effective transport
! Cost effective farming
! React quickly to changes in demand - flexible production and
transport
! Effective ordering systems across the whole chain
! Good store housekeeping
To allow the team to monitor how well the whole chain is performing
against these objectives, the team developed a set of common, shared
key performance indicators.
They felt that the ultimate commercial goal for this chain is to grow
market share. They also felt that to achieve this, they needed to track
two key measures of consumer satisfaction: on-shelf availability and
customer complaints.

Food Chain Centre at IGD Grange Lane Letchmore Heath Watford Herts WD25 8GD
Tel: 01923 857141 Fax: 01923 852531 Email: [email protected] www.foodchaincentre.com 5
For convenience store chains, the most frequent basket item
purchased is fresh milk and therefore achieving close to 100% on-shelf
availability for fresh milk could be a substantial competitive
advantage in the current market. The team wanted to take on the
challenge to see how they could achieve nigh on 100% on-shelf
availability against the current performance of 97%.
Commercial Measures Market Share
Customer 'Moments of Truth'On-shelf availability
Customer Complaints (ppm)
Operational Measures
Supply Chain Lead-time
Right first time quality
On-time in full delivery performance
Overall Equipment Efficiency
Average ppl farm costs
Farm Quality Indicator
Transport Efficiency
In-store housekeeping score
Milk return/reclaim %
Mapping the Supply Chain
To identify where waste and improvement opportunities existed in
the supply chain, the team followed a set methodology which
involved walking the chain and systematically mapping the physical
flows and information flows for the semi-skimmed milk product.
Issues and possible opportunities were captured at every stage of the
process.
From the mapping, the team were able to develop a current state map
of their supply chain which can be seen below.
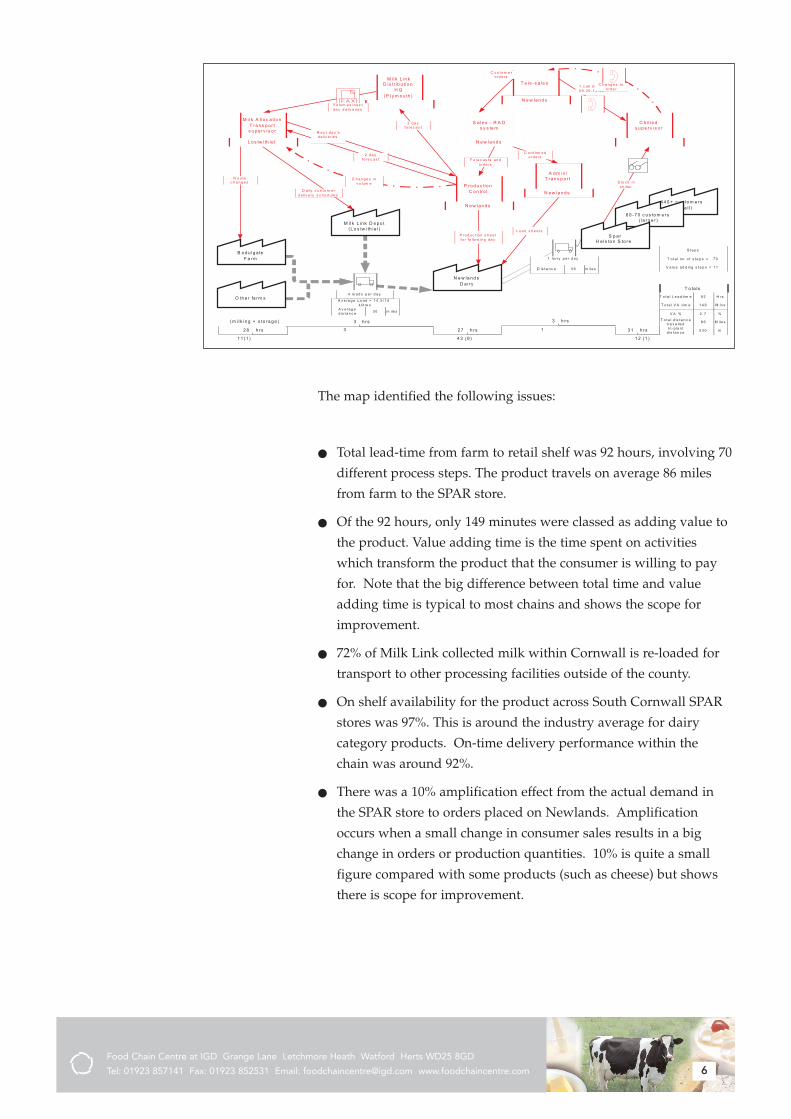
Food Chain Centre at IGD Grange Lane Letchmore Heath Watford Herts WD25 8GD
Tel: 01923 857141 Fax: 01923 852531 Email: [email protected] www.foodchaincentre.com 6
4 4 0 + c u s to m e rs(s m a l l )
6 0 - 7 0 c u s to m e rs( l a rg e r )
B o d u lg a teF a rm
O th e r fa rm s
N e w la n d sD a i r y
S p a rH e ls to n S to re
M i l k L in k D e p o t(L o s tw i th ie l )
4 lo a d s p e r d a y
A v e ra g e L o a d = 1 4 .5 /1 5k lit re s
1 lo rry p e r d a y
C h i l l e ds u p e rv i s o r
N e w la n d s
T e le -s a le s
N e w la n d s
P ro d u c tio nC o n tro l
M i l k L i n kD is tr ib u ti o n
H Q(P ly m o u th )
L o s tw i th ie l
M i l k A l lo c a ti o nT ra n s p o r ts u p e rv i s o r
R o u tec h a n g e s
D a ily c u s to m e rd e liv e ry s c h e d u le s
C h a n g e s inv o lu m e
2 d a yfo re c a s t
V o lu m e s / n e x td a y d e liv e rie s
1 c a ll d a ily -0 9 . 3 0 -1 0 .0 0
S to c k inc h ille r
C o n f irm e do rd e rs
P ro d u c t io n s h e e tfo r f o llo w in g d a y
2 d a yfo re c a s t
N e w la n d s
A d m in /T ra n s p o r t
L o a d s h e e t s
F o re c a s ts a n do rd e rs
C h a n g e s too rd e r
N e x t d a y �sd e liv e r ie s
N e w la n d s
S a le s - R A Ds y s te m
C u s t o m e ro rd e rs
2 8 h rs
3 h rs
2 7 h rs
3 h rs
3 1 h rs
1 1 (1 )
3
D is t a n c e m ile s5 6
4 3 (9 )
1
1 2 (1 )
T o ta ls
T o ta l L e a d t im e H rs9 2
(m i l k in g + s to ra g e )
T o t a l V A t im e M in s1 4 9A v e ra g ed is t a n c e m ile s3 0
V A % %2 . 7
S te p s
T o t a l n o o f s te p s = 7 0
V a lu e a d d in g s te p s = 1 1
T o t a l d is ta n c et ra v e lle d M ile s8 6
I n -p la n td is t a n c e m5 3 0
The map identified the following issues:
! Total lead-time from farm to retail shelf was 92 hours, involving 70
different process steps. The product travels on average 86 miles
from farm to the SPAR store.
! Of the 92 hours, only 149 minutes were classed as adding value to
the product. Value adding time is the time spent on activities
which transform the product that the consumer is willing to pay
for. Note that the big difference between total time and value
adding time is typical to most chains and shows the scope for
improvement.
! 72% of Milk Link collected milk within Cornwall is re-loaded for
transport to other processing facilities outside of the county.
! On shelf availability for the product across South Cornwall SPAR
stores was 97%. This is around the industry average for dairy
category products. On-time delivery performance within the
chain was around 92%.
! There was a 10% amplification effect from the actual demand in
the SPAR store to orders placed on Newlands. Amplification
occurs when a small change in consumer sales results in a big
change in orders or production quantities. 10% is quite a small
figure compared with some products (such as cheese) but shows
there is scope for improvement.
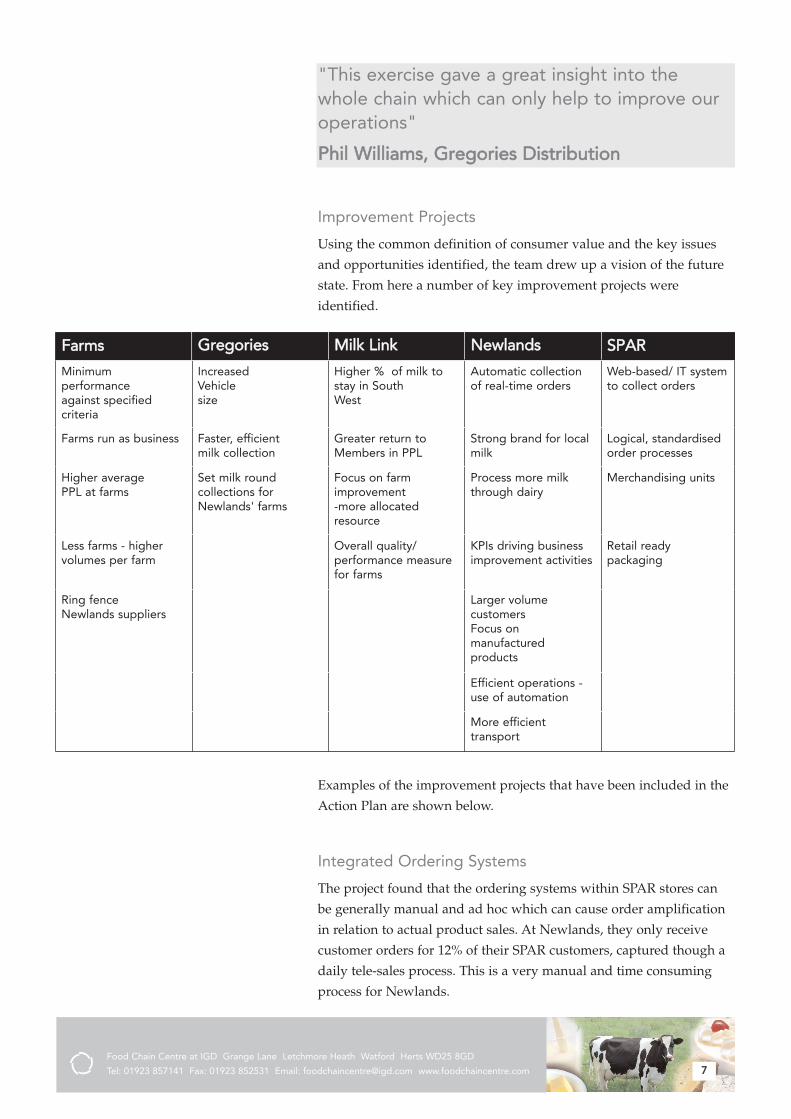
Food Chain Centre at IGD Grange Lane Letchmore Heath Watford Herts WD25 8GD
Tel: 01923 857141 Fax: 01923 852531 Email: [email protected] www.foodchaincentre.com 7
"This exercise gave a great insight into thewhole chain which can only help to improve ouroperations"
PPhhiill WWiilllliiaammss,, GGrreeggoorriieess DDiissttrriibbuuttiioonn
Improvement Projects
Using the common definition of consumer value and the key issues
and opportunities identified, the team drew up a vision of the future
state. From here a number of key improvement projects were
identified.
Farms Gregories Milk Link Newlands SPAR
Minimum performanceagainst specifiedcriteria
IncreasedVehiclesize
Higher % of milk tostay in South West
Automatic collectionof real-time orders
Web-based/ IT systemto collect orders
Farms run as business Faster, efficientmilk collection
Greater return toMembers in PPL
Strong brand for localmilk
Logical, standardisedorder processes
Higher average PPL at farms
Set milk roundcollections forNewlands' farms
Focus on farmimprovement-more allocatedresource
Process more milk through dairy
Merchandising units
Less farms - highervolumes per farm
Overall quality/performance measurefor farms
KPIs driving businessimprovement activities
Retail readypackaging
Ring fence Newlands suppliers
Larger volumecustomersFocus onmanufacturedproducts
Efficient operations -use of automation
More efficienttransport
Examples of the improvement projects that have been included in the
Action Plan are shown below.
Integrated Ordering Systems
The project found that the ordering systems within SPAR stores can
be generally manual and ad hoc which can cause order amplification
in relation to actual product sales. At Newlands, they only receive
customer orders for 12% of their SPAR customers, captured though a
daily tele-sales process. This is a very manual and time consuming
process for Newlands.
Food Chain Centre at IGD Grange Lane Letchmore Heath Watford Herts WD25 8GD
Tel: 01923 857141 Fax: 01923 852531 Email: [email protected] www.foodchaincentre.com 8
For the remaining SPAR customers, milk is produced to forecast and a
daily van-sales service is operated. While this is a very flexible
approach to customer service, the team identified the process can lead
to over production and transport of excess milk. So there was no
guarantee that the milk sold is a true reflection of actual customer
demand.
To address this, the team have targeted the development of a simple
integrated cross-company ordering process both internally within
SPAR stores and linked to Newlands. The project will be initially
trialled across a small number of SPAR stores, with the
implementation of a standardised simple, logical ordering process to
ensure that orders generated are linked to actual end consumer
demand with minimal amplification.
The project will also investigate the implementation of an IT/web
based system to allow the SPAR stores to communicate daily their
actual sales and orders to Newlands, which could then be used to
directly drive production and transport operations.
Farm Improvement Programmes
The project identified an opportunity to help drive an increase in the
average overall farm performance against the key criteria set by Milk
Link of fat, protein, cleanliness, seasonal profile and flexibility.
Although these criteria are already used monthly to determine
payments, the team found that there is no regular month by month
analysis of farm performance against these criteria.
To address this, the team proposed a set of key farm performance
measures and a composite 'farm quality indicator' in conjunction with
the farmers, to help highlight where improvement opportunities lie.
In addition to these measures, the team proposed extra resource
allocated to on-farm improvement by Milk Link.
Continuous Improvement Forum
The project team committed to forming a supply chain continuous
improvement forum, both to oversee the projects already described
but also continually to identify and drive future projects that will take
the supply chain on to the next level of performance. This forum is
also an excellent way to continue to foster collaboration across the
chain.
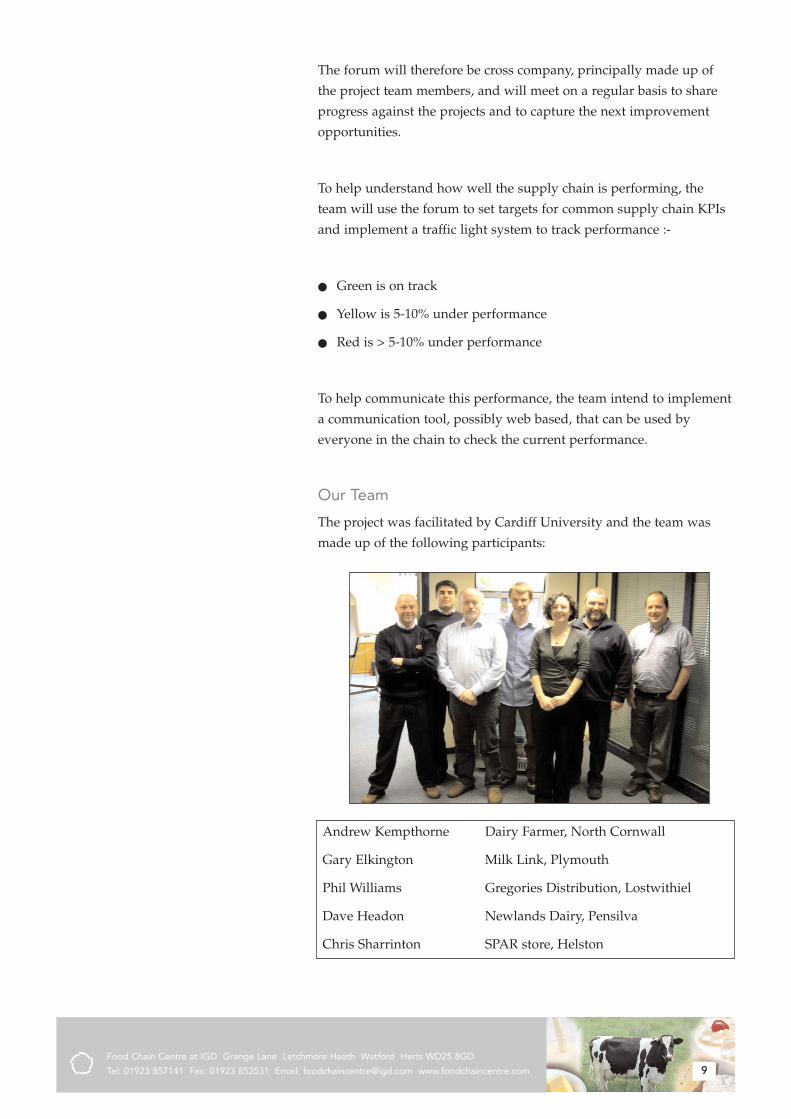
Food Chain Centre at IGD Grange Lane Letchmore Heath Watford Herts WD25 8GD
Tel: 01923 857141 Fax: 01923 852531 Email: [email protected] www.foodchaincentre.com 9
The forum will therefore be cross company, principally made up of
the project team members, and will meet on a regular basis to share
progress against the projects and to capture the next improvement
opportunities.
To help understand how well the supply chain is performing, the
team will use the forum to set targets for common supply chain KPIs
and implement a traffic light system to track performance :-
! Green is on track
! Yellow is 5-10% under performance
! Red is > 5-10% under performance
To help communicate this performance, the team intend to implement
a communication tool, possibly web based, that can be used by
everyone in the chain to check the current performance.
Our Team
The project was facilitated by Cardiff University and the team was
made up of the following participants:
Andrew Kempthorne Dairy Farmer, North Cornwall
Gary Elkington Milk Link, Plymouth
Phil Williams Gregories Distribution, Lostwithiel
Dave Headon Newlands Dairy, Pensilva
Chris Sharrinton SPAR store, Helston
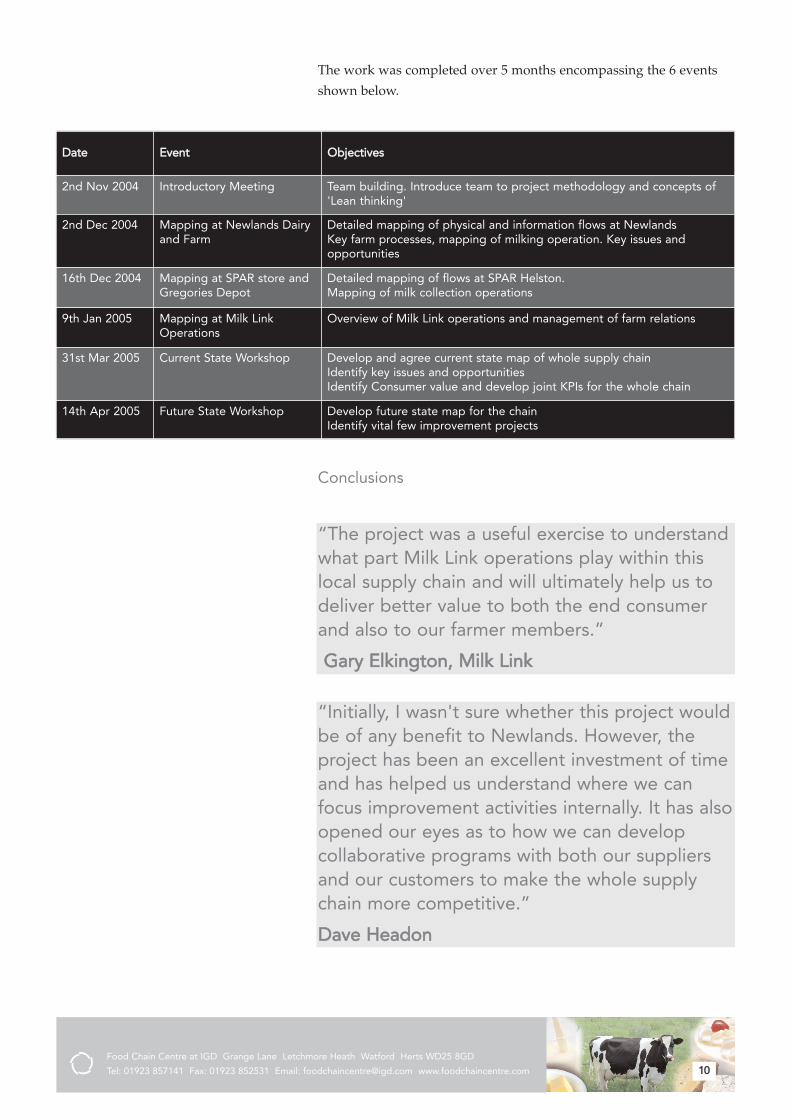
Food Chain Centre at IGD Grange Lane Letchmore Heath Watford Herts WD25 8GD
Tel: 01923 857141 Fax: 01923 852531 Email: [email protected] www.foodchaincentre.com 10
The work was completed over 5 months encompassing the 6 events
shown below.
Date Event Objectives
2nd Nov 2004 Introductory Meeting Team building. Introduce team to project methodology and concepts of'Lean thinking'
2nd Dec 2004 Mapping at Newlands Dairyand Farm
Detailed mapping of physical and information flows at NewlandsKey farm processes, mapping of milking operation. Key issues andopportunities
16th Dec 2004 Mapping at SPAR store andGregories Depot
Detailed mapping of flows at SPAR Helston. Mapping of milk collection operations
9th Jan 2005 Mapping at Milk LinkOperations
Overview of Milk Link operations and management of farm relations
31st Mar 2005 Current State Workshop Develop and agree current state map of whole supply chainIdentify key issues and opportunitiesIdentify Consumer value and develop joint KPIs for the whole chain
14th Apr 2005 Future State Workshop Develop future state map for the chainIdentify vital few improvement projects
Conclusions
�The project was a useful exercise to understandwhat part Milk Link operations play within thislocal supply chain and will ultimately help us todeliver better value to both the end consumerand also to our farmer members.�
GGaarryy EEllkkiinnggttoonn,, MMiillkk LLiinnkk
�Initially, I wasn't sure whether this project wouldbe of any benefit to Newlands. However, theproject has been an excellent investment of timeand has helped us understand where we canfocus improvement activities internally. It has alsoopened our eyes as to how we can developcollaborative programs with both our suppliersand our customers to make the whole supplychain more competitive.�
DDaavvee HHeeaaddoonn
Food Chain Centre at IGD Grange Lane Letchmore Heath Watford Herts WD25 8GD
Tel: 01923 857141 Fax: 01923 852531 Email: [email protected] www.foodchaincentre.com 11
�Before this project, I hadn't appreciated whatneeds to happen in order to get the milk to theconsumer. This was an excellent opportunity togain a better insight into what happens and how,as a farmer, I can manage my business tocontribute to this.�
AAnnddrreeww KKeemmpptthhoorrnnee
The Food Chain Centre acknowledges the help of Kate Bailey and
Keivan Zokei from Cardiff Business School in preparing this case
study.