Embed Size (px)
Citation preview
XX IMEKO World Congress
Metrology for Green Growth
9-14 September 2012, Busan, Republic of Korea
A COMPARISON OF TWO WEATHER DATA ACQUISITION METHODS
FOR THE CALIBRATION OF THE PTB GEODETIC BASELINE
J. Jokela
1, F. Pollinger
2, N. R. Doloca
2, K. Meiners-Hagen
2
1 Finnish Geodetic Institute, Geodeetinrinne 2, FI-02430 Masala, Finland,
2 Physikalisch-Technische Bundesanstalt, Bundesallee 100, D-38116 Braunschweig, Germany,
E-mail: [email protected], [email protected]
Abstract: The Physikalisch-Technische
Bundesanstalt has recently refurbished its geodetic
baseline in Braunschweig, Germany, and the
baseline is now supplied with an inclusive set of
environmental sensors for weather observations.
The Finnish Geodetic Institute calibrated the
baseline in June 2011. In the calibration, the
observers also used conventional instruments,
common in surveying work, to obtain weather data.
By comparing the two weather data sets and the
results computed when using them, it is possible to
demonstrate the good capability of conventional
instruments, when properly used. The results of the
comparison, which are applicable in electronic
distance measurements for conventional surveying,
are presented in this paper.
Keywords: geodetic baseline, long range
distance measurements, environmental sensors,
weather observations.
1. INTRODUCTION
Observing the influence of air in the
propagation of a measurement beam is an essential
measure in electronic distance measurements
(EDM). The displayed distances are corrected using
the first velocity correction, which is computed by
using the simultaneously recorded air temperature,
pressure and humidity observations, knowledge of
the carbon dioxide content and the recommended
computation formulas; some instrument-dependent
constants are also needed. For a general description
of EDM, the textbook by Rüeger [1] provides a
thorough introduction.
The ambient circumstances may be easy to
determine in laboratory conditions, but the geodetic
measurements are performed in more challenging
field conditions. No sensor systems are available
then; the weather observations have to be measured
using a very limited number of single instruments:
thermometers, barometers and hygrometers.
Determining the first velocity correction is a
major source of uncertainty for EDM; not only the
instruments but especially the changing conditions
cause uncertainty. The new Physikalisch-
Technische Bundesanstalt (PTB) facilities bring
laboratory-level conditions to the open air for first
time, making it possible to compare weather data
obtained using surveyors’ conventional instruments
or using an environmental sensor system.
The PTB’s recently refurbished geodetic
baseline in Braunschweig, Germany consists of
eight observation pillars in line at 0, 50, 100, 150,
250, 350, 500 and 600 metres [2]. The height
difference between the end pillars is 1.52 m. The
baseline design makes it possible to measure every
distance from 50 m to 600 m, at 50 m intervals. The
baseline is now supplied with an inclusive set of
calibrated environmental sensors: 60 Pt-100
temperature sensors at 10 m intervals, six Testo
humidity sensors and two Setra 470 pressure
gauges. The environment is farmland on one side
and woodland on the other side, and the baseline is
fenced for laser safety (Fig. 1).
The Finnish Geodetic Institute (FGI) calibrated
the baseline in June 2011. The origin of the
traceable scale is the FGI’s Nummela Standard
Baseline (Fig. 2); the scale was transferred from
this national measurement standard using a high-
precision EDM instrument, the Kern Mekometer
ME5000, as a transfer standard. The Mekometer
equipment is the property of the Department of
Surveying at Aalto University. The scale of the
864-m Nummela Standard Baseline is based on
interference measurements performed in 2007 with
the Väisälä interference comparator and on the
quartz gauge system that is used with it [3].
The FGI calibrated the transfer standard at the
Nummela Standard Baseline before and after
performing the measurements at the PTB baseline.
The observers obtained the weather data with
conventional instruments using two psychrometers
and two aneroid barometers; the instruments are
commonly used in EDM for baseline calibrations or
for more practical applications (Fig. 3). In
Braunschweig, the second set of weather data was
extracted from the recordings of the environmental
sensor system.
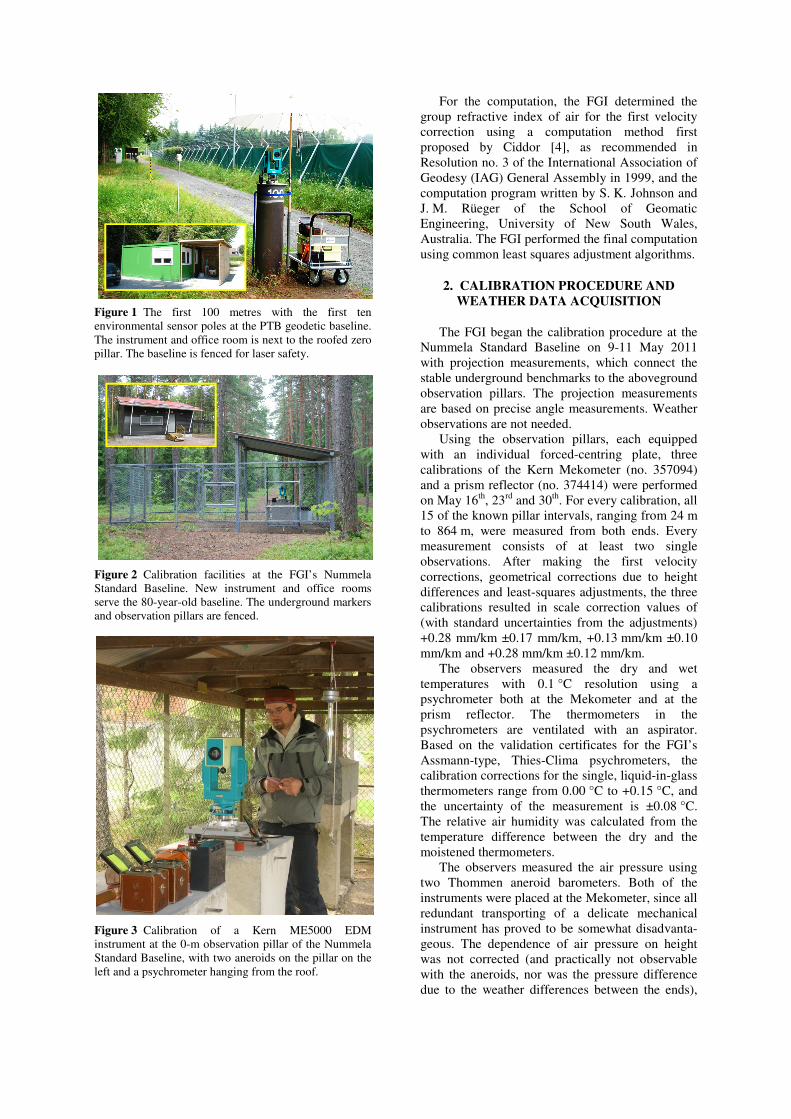
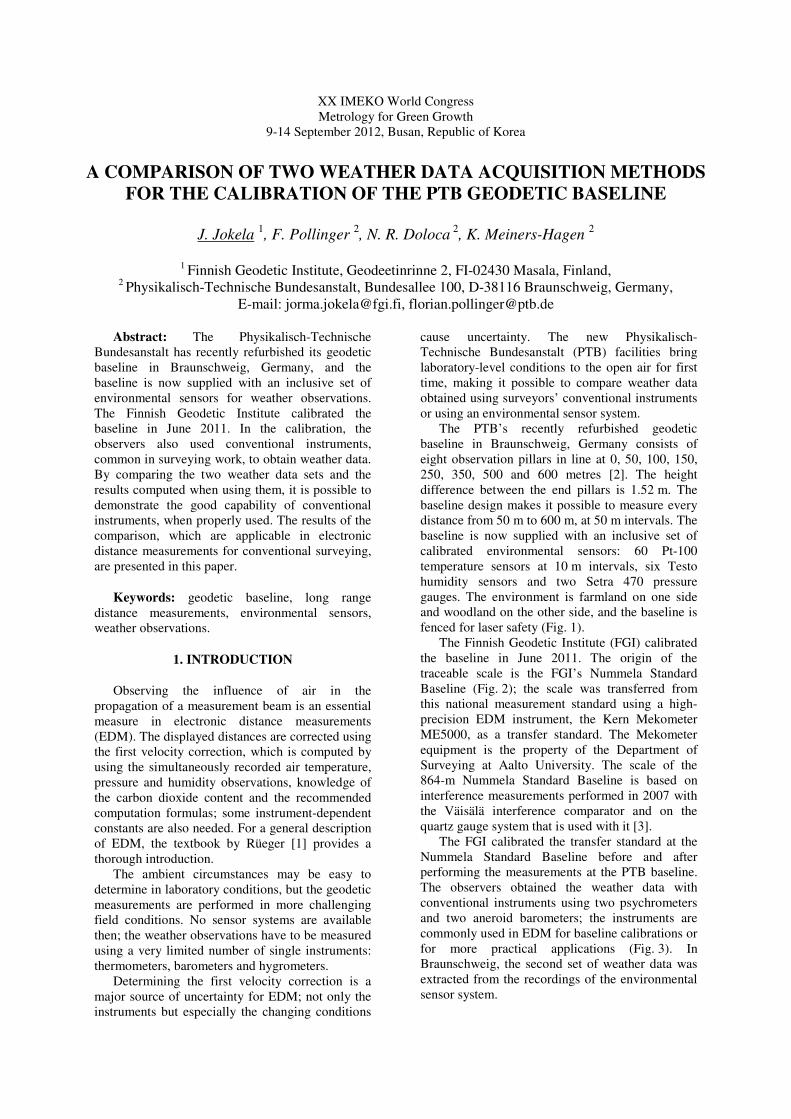
Figure 1 The first 100 metres with the first ten
environmental sensor poles at the PTB geodetic baseline.
The instrument and office room is next to the roofed zero
pillar. The baseline is fenced for laser safety.
Figure 2 Calibration facilities at the FGI’s Nummela
Standard Baseline. New instrument and office rooms
serve the 80-year-old baseline. The underground markers
and observation pillars are fenced.
Figure 3 Calibration of a Kern ME5000 EDM
instrument at the 0-m observation pillar of the Nummela
Standard Baseline, with two aneroids on the pillar on the
left and a psychrometer hanging from the roof.
For the computation, the FGI determined the
group refractive index of air for the first velocity
correction using a computation method first
proposed by Ciddor [4], as recommended in
Resolution no. 3 of the International Association of
Geodesy (IAG) General Assembly in 1999, and the
computation program written by S. K. Johnson and
J. M. Rüeger of the School of Geomatic
Engineering, University of New South Wales,
Australia. The FGI performed the final computation
using common least squares adjustment algorithms.
2. CALIBRATION PROCEDURE AND
WEATHER DATA ACQUISITION
The FGI began the calibration procedure at the
Nummela Standard Baseline on 9-11 May 2011
with projection measurements, which connect the
stable underground benchmarks to the aboveground
observation pillars. The projection measurements
are based on precise angle measurements. Weather
observations are not needed.
Using the observation pillars, each equipped
with an individual forced-centring plate, three
calibrations of the Kern Mekometer (no. 357094)
and a prism reflector (no. 374414) were performed
on May 16th
, 23rd
and 30th
. For every calibration, all
15 of the known pillar intervals, ranging from 24 m
to 864 m, were measured from both ends. Every
measurement consists of at least two single
observations. After making the first velocity
corrections, geometrical corrections due to height
differences and least-squares adjustments, the three
calibrations resulted in scale correction values of
(with standard uncertainties from the adjustments)
+0.28 mm/km ±0.17 mm/km, +0.13 mm/km ±0.10
mm/km and +0.28 mm/km ±0.12 mm/km.
The observers measured the dry and wet
temperatures with 0.1 °C resolution using a
psychrometer both at the Mekometer and at the
prism reflector. The thermometers in the
psychrometers are ventilated with an aspirator.
Based on the validation certificates for the FGI’s
Assmann-type, Thies-Clima psychrometers, the
calibration corrections for the single, liquid-in-glass
thermometers range from 0.00 °C to +0.15 °C, and
the uncertainty of the measurement is ±0.08 °C.
The relative air humidity was calculated from the
temperature difference between the dry and the
moistened thermometers.
The observers measured the air pressure using
two Thommen aneroid barometers. Both of the
instruments were placed at the Mekometer, since all
redundant transporting of a delicate mechanical
instrument has proved to be somewhat disadvanta-
geous. The dependence of air pressure on height
was not corrected (and practically not observable
with the aneroids, nor was the pressure difference
due to the weather differences between the ends),

but the minor influence can be eliminated when all
of the distances are measured from both ends.
The observers compared the two aneroids with
the FGI’s mercury barometer before and after
performing the measurements at the PTB. One
aneroid was slightly damaged when it was being
transported to the PTB, and its stability could not
be verified in the latter comparison. Therefore, the
observations made with it were not used in the final
computation, which is based on observations with
one aneroid only. For this instrument, the
comparisons with the mercury barometer yielded a
correction of –20 Pa ±10 Pa.
For the calibration of the PTB baseline, the
observation procedure was quite similar as for the
calibration of the Mekometer. Unlike at Nummela,
the instrument scale at Braunschweig was traceably
known and the baseline section lengths were
unknown; the results are shown in Section 4. In five
days, all 28 of the different distances between the
eight observation pillars were observed from both
ends during three calibrations, yielding a total of
168 distances. The two observers read the
psychrometers at least twice for every distance, and
one observer read the aneroids once. The
environmental sensor system (Fig. 4) was running
continuously, recording the average values every
30 seconds and making 6–16 recordings (3–8
minutes) for every distance. The applicable average
values for every distance were computed afterwards
with the help of the start and end times of the
observations.
The uncertainties for the corrected temperature,
pressure and relative humidity from the sensor
system are estimated to be smaller than 80 mK,
5.1 Pa and 0.35 %, respectively. Variations around
the baseline pillars and sensors are treated
separately, as presented in detail by Pollinger et al.
[2]. Significantly larger uncertainty estimates were
used for the computation with the data from the
conventional instruments: 0.3 K, 30 Pa and 5%;
these values include the uncertainty estimate for
weather variations.
After the measurements at the PTB baseline, the
transfer standard was calibrated again at the
Nummela Standard Baseline, now twice, on 13–14
June and on 14–15 June. At that time, scale
correction values of +0.02 mm/km ±0.10 mm/km
and +0.19 mm/km ±0.12 mm/km were obtained. In
the final computation, the average value from five
equally weighted calibrations was used:
+0.181 mm/km ±0.139 mm/km. Here the standard
uncertainty estimate also includes the uncertainty of
the Nummela Standard Baseline: ±0.100 mm/km
for the interference measurement procedure and the
quartz gauge system, and ±0.083 mm/km for the
projection measurements. The additive constant
was +0.039 mm ±0.022 mm.
Figure 4 The southern end of the PTB geodetic baseline.
The weather sensor system records temperatures next to
the measurement beam at 10 m distance intervals and
30 s time intervals.
Table 1 Air temperature (t), pressure (p) and relative
humidity (rh) during the three calibration measurement
periods at the FGI and PTB baselines.
Nummela Braunschweig Nummela
May 16/23/30 June 6–10 June 13–15
t (°C) 8.2–15.9 15.6–27.8 10.8–15.7
p (kPa) 99.42–100.14 99.30–100.86 99.40–99.66
rh (%) 54–100 35–99 71–99
The observers used the same psychrometers and
aneroids equally at the two baselines, which
decreases some instrument-dependent uncertainty
components. The weather conditions at the time
when the transfer standard and the PTB baseline
were being calibrated are listed in Table 1. The
different temperature conditions as well as the
rather equal pressure conditions may be noteworthy
when analyzing the distance measurement results.
The calibration procedure was ended in new
projection measurements, which were completed on
20–22 June. The differences between the two sets
of five projection corrections ranged from –0.10
mm to +0.27 mm. This shows the reproducibility of
the measurement, or, rather, how accurately the less
than 10-7
degree of uncertainty for the interference
measurements was transferred for the calibration of
the EDM instruments. In also confirms the short-
term stability of the Nummela Standard Baseline.
They also contribute to the global uncertainty
estimate of the calibration procedure for the PTB
baseline.
3. THE TWO WEATHER DATA SETS
On average, the psychrometers showed dry
temperatures that were 0.27 °C lower than from the
sensors (Fig. 6). An obvious reason for this is that
the psychrometers were always in shade; the
average difference was just 0.01 °C on the third
cloudy measurement day, when all the instruments
were in the shade. The largest single differences
were –1.8 °C and +1.1 °C. The differences were not
dependent on the distances.

In order to understand the discrepancies in
temperatures, it is instructive to investigate the
statistical distribution of the temperature readings
of the individual sensors along the baseline. For
optimum conditions, i.e. cloudy weather with slight
rain, the standard deviation for the complete set of
60 temperature sensors remains well below 0.1 K,
as can be seen in Fig. 5 for the data of June 8th
.
During times of maximum sun exposure,
however, the temperature distribution becomes
extremely inhomogeneous along the baseline. For
example, the standard deviation on June 6th
, which
was the sunniest day of the calibration campaign,
reached an average of 1.0 K in the morning hours.
In general, the standard deviation is a direct
measure of the achievable measurement uncertainty
for the effective temperature and, thus, the overall
length measurement [2].
In the latter case, the uncertainty of the
temperature measurement limits the length-
dependent part of the uncertainty of the length
measurement to 10-6
L (k = 1), while in the former
case the temperature-induced uncertainty is one
order of magnitude lower. The two extreme cases
demonstrate that, despite the large effort to monitor
the temperature at the PTB baseline, the achievable
uncertainty of the effective temperature remains
strongly weather-dependent. The deviation between
the single readings and mean values of the 60-
sensor ensemble can even be as much as several
Kelvins (Fig. 5). Hence, local deviations might
explain part of the observed deviations between
psychrometer readings and the readings of the PTB
sensor system. Besides, the data set also clearly
demonstrates how an extremely unlucky placement
of the temperature sensor might induce a
systematically erroneous velocity correction in the
order of several ppm.
Figure 5 Distribution of temperature readings from the
individual sensor heads along the complete 600 m range
of the PTB baseline on two different days during the
calibration. The standard deviation σ(T) is represented by
solid lines. Dashed lines indicate the maximum deviation
of the individual temperature readings from the
corresponding mean value. Data taken on June 6th is
depicted in red, and data taken on June 8th is depicted in
blue.
Figure 6 Average temperature during the 168 distance
measurements at the PTB geodetic baseline. The red
circles depict the data obtained with the FGI weather
instruments and the blue squares depict the data obtained
with the PTB sensor system. The dashed green lines
separate the data for the three calibrations, and the solid
green lines separate the five measurement days (on 6–10
June, 2011) with different weather conditions. The third
day was the most favourable (mostly cloudy and rainy),
whereas the other days were mostly clear or partly
cloudy.
Figure 7 Average relative humidity during the 168
distance measurements at the PTB geodetic baseline (for
an interpretation, see the caption for Figure 6).
Figure 8 Average air pressure during the 168 distance
measurements at the PTB geodetic baseline (for an
interpretation, see the caption for Figure 6).
15
20
25
30
0 56 112 168
t (°
C)
n
0
20
40
60
80
100
0 56 112 168
rh(%
)
n
990
995
1000
1005
1010
0 56 112 168
p(h
Pa
)
n

On average, the psychrometers gave relative
humidity values that were three percentage points
higher than from the sensors, with the variation
ranging from –6 to +12 (Fig. 7). When determining
relative humidity with psychrometers, the same
problems with shading exist as with the
temperature observations.
On average, the aneroids showed air pressure
that was 8 Pa lower than from the pressure gauges,
with the largest single differences being –80 Pa and
+70 Pa (Fig. 8). Aneroids are mechanical
measurement instruments and it is essential to
regularly calibrate them, preferably with a long
time series to track the possible drift.
In favourable weather conditions, the
differences are in accordance with the uncertainties
estimated in Section 2, but much larger variations
are common in sunny weather. A 0.27 K “error” in
temperature, applied in the formula for the first
velocity correction, changes the scale of the EDM
by nearly 0.27 mm/km, which means 0.16 mm or
less for baseline distances of 600 m or less. Such
minor differences are difficult to discern from other
sources of uncertainty and they are barely visible in
the results.
4. RESULT OF CALIBRATION
The results of the calibration for the PTB
baseline are presented in Table 2. The FGI
estimated that the combined standard uncertainty is
������� �9.9 10��m�� � �3.4 10����� (1)
for the adjusted individual distances when only
using the conventional weather observation
instruments. The distances were also computed
with the data from the sensor system; the changes
in the results remain clearly within the estimated
measurement uncertainty.
Based on our current limited knowledge of the
long-term stability of the baseline, using the result
of the calibration and utilizing the environmental
sensor system the PTB currently estimates that the
standard uncertainty for further calibration of
geodetic instruments at the baseline is
������� �3.1 10��m�� � �3.7 10�����, (2)
if the ambient conditions are favourable [2].
Table 2 The adjusted horizontal distances, when
corrected using weather data obtained with conventional
weather instruments, and the difference, when corrected
using the environmental sensor system data. The
uncertainties are expanded (k = 2) values.
Pillar
interval
Horizontal distance
(mm)
Difference
(mm)
0–50 49 997.80 ±0.20 –0.07
50–100 49 995.56 ±0.19 +0.03
100–150 50 011.59 ±0.18 0.00
150–250 99 993.83 ±0.19 +0.03
250–350 100 002.73 ±0.19 +0.01
350–500 149 997.08 ±0.21 +0.04
500–600 99 990.02 ±0.20 +0.09
0–50 49 997.80 ±0.20 –0.07
0–100 99 993.36 ±0.22 –0.05
0–150 150 004.95 ±0.24 –0.05
0–250 249 998.78 ±0.28 –0.02
0–350 350 001.51 ±0.33 0.00
0–500 499 998.59 ±0.41 +0.03
0–600 599 988.61 ±0.47 +0.12
5. CONCLUSION
If the path of a measurement beam alternates
between a shaded and sunny environment and is
also always affected by the air turbulence, it is
difficult to determine the temperature differences
along the beam with any instrumentation. This
results in multiple variations in the measurement
results compared with favourable weather condi-
tions. Independent of the method, temperatures
should be measured as close to the measurement
beam as possible, both horizontally and vertically.
The two geodetic baselines discussed in this
paper are outstanding resources for long-range,
outdoor length metrology. Naturally, when two sets
of weather data are practically identical, the
determined refractive index and first velocity
corrections are also equal, having little effect on the
resulting baseline lengths. A basic set of
conventional, high-quality weather observation
instruments may thus be sufficient, even in high-
precision surveying work, at least during
favourable weather conditions. For more scientific
work, a system of environmental sensors yields a
much larger set of crucial information. For
achieving reliable results, reasonable planning of
baseline structures and facilities, their careful
maintenance, regular calibrations and capable users
are all essential for both data acquisition methods.
Regardless of the method, estimating the
uncertainty of measurement in field conditions
remains troublesome; observations in unfavourable
weather conditions should be avoided.

6. ACKNOWLEDGEMENTS
The authors would like to thank T. Meyer and
W. Malek at the PTB and S. Marila at the FGI for
their technical support during the measurements.
7. REFERENCES
[1] Rüeger, J. M., “Electronic Distance Measurement,
An Introduction”, 4th ed., 276 p., Springer, 1996.
[2] F. Pollinger, T. Meyer, J. Beyer, N. R. Doloca, W.
Schellin, W. Niemeier, J. Jokela, P. Häkli, A.
Abou-Zeid and K. Meiners-Hagen, “The upgraded
PTB 600 m baseline: A high-accuracy reference
for the calibration and the development of long
distance measurement devices”, accepted by Meas.
Sci. Technol., 2012.
[3] J. Jokela and P. Häkli, “Interference measurements
of the Nummela Standard Baseline in 2005 and
2007”, Publ. Finn. Geod. Inst. no. 144, 85 p.,
Kirkkonummi 2010. Available at http://www.fgi.fi
[4] P. E. Ciddor, “Refractive Index of Air: New
Equations for the Visible and Near Infrared”,
Applied Optics, vol. 35, no. 9, p.1566–1573, 1996.