Embed Size (px)
Citation preview
Original ArticlePublished on 29-12-2002
In italiano, per favoreEn español, por favor
A COMPARISON OF SKELETAL AND DENTOALVEOLAR CHANGES DURING FACEMASK THERAPYWITH GROWTH CHANGES IN UNTREATED CLASS III CONTROLS
Allan G Jones*, Farhad B Naini**, James C Stubbs***,
KINGSTON HOSPITAL AND GUY'S HOSPITAL, LONDON, UK.
*BDS, MSc, FDS RCS, M.Orth RCS, Consultant Orthodontist
**BDS, MSc, FDS RCS, M.Orth RCS, Senior Registrar [Medline Lookup]
*** BDS, MSc, M.Orth RCS, Registrar
Corresponding author:Farhad B Naini, BDS, FDS, Msc. Registrar, Central Middlesex Hospital and the Royal London Hospital, fax, 0044 208 963 8844 e-mail:[email protected]
Parole chiave: Facemask, Class III, Dentoalveolar changes
Abstract: The purpose of this study was to compare the effects of facemask therapy in a slightly later age group than average (11.5 years forfemales, 11.8 years for males), with lighter forces than average (100-200g per side), to a Class III untreated control group and a normalcontrol group. The treatment group consisted of 32 protraction headgear cases (15 males, 17 females). The Class III control group consistedof mixed longitudinal data from 50 untreated subjects (32 males, 18 females). The treatment group was also compared to subjects from theBhatia and Leighton growth study. Linear and angular cephalometric measurements were taken before and after treatment. The facemaskgroup showed significant dento-alveolar changes but no significant skeletal changes. Therefore facemask therapy in this age group and withlight forces can be expected to help correct a Class III relationship with only dento-alveolar changes.
INTRODUCTIONThe use of the protraction face-mask was first described more than 100 years ago by Potpeschnigg (1875). Delaireet al. (1976) revived the interest in this technique and later Petit (1983) modified the basic concepts of Delaire byincreasing the amount of force generated by this appliance. There has been very little research in the UK whencomparing the effects of protraction headgear to normal growth. Numerous studies have been done in Japan andto a certain extent in America. It is difficult to assess and compare the data from these studies to the UKpopulation, as there are too many variables. Ideally, the effects of treatment with orthopaedic appliances should becompared with samples in the same skeletal category. For this study it has been possible to find a good samplesize from the Greater London (UK) area and compare them to an untreated Class III growth study (Kangesu,2000), and Bhatia and Leighton's growth study (1993). In this study the measurements are taken from longitudinaldata and primarily linear measurements and ratios are analysed. These linear measurements would be a trueindicator of any changes in normal skeletal growth during the protraction phase of therapy. It is known that theoriginal design of the protraction headgear was to optimise the growth of the maxilla and to restrain the growth ofthe mandible. There are other documented changes that this type of therapy can introduce and dento-alveolarchanges would be the most noticeable. Therefore, certain dental measurements have been included. The use ofprotraction headgear in the UK seems to be on the decrease but this form of therapy still stays popular in otherorthodontic centres throughout the world. This study is to ascertain the outcome of protraction headgear that wasused quite extensively at Kingston Hospital (Orton, 1992) during the 80's and early 90's. A number of questionsneed to be answered regarding the use of protraction headgear and hopefully this study can reveal the affects onskeletal growth with the use of the face-mask. It was intended to compare the treatment changes with normalgrowth and this would be done with linear and angular measurements. Longitudinal cephalometric radiographs ofpatients who had undergone orthodontic appliance therapy together with protraction facemasks were analysed withthe following objectives in mind:
Does this mode of therapy really improve skeletal relationship?1.Which clinical parameters are influenced the most?2.Is the effect clinically significant and are treatment objectives obtained?3.
MATERIALS and METHOD
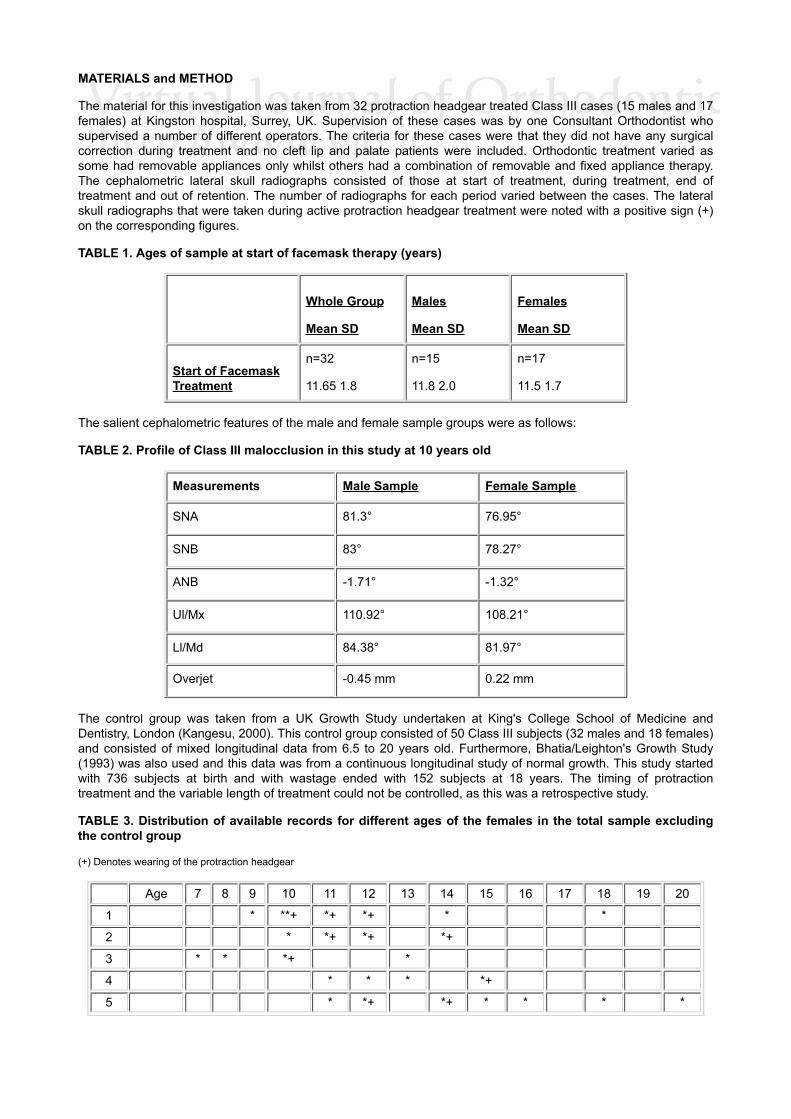
The material for this investigation was taken from 32 protraction headgear treated Class III cases (15 males and 17females) at Kingston hospital, Surrey, UK. Supervision of these cases was by one Consultant Orthodontist whosupervised a number of different operators. The criteria for these cases were that they did not have any surgicalcorrection during treatment and no cleft lip and palate patients were included. Orthodontic treatment varied assome had removable appliances only whilst others had a combination of removable and fixed appliance therapy.The cephalometric lateral skull radiographs consisted of those at start of treatment, during treatment, end oftreatment and out of retention. The number of radiographs for each period varied between the cases. The lateralskull radiographs that were taken during active protraction headgear treatment were noted with a positive sign (+)on the corresponding figures.
TABLE 1. Ages of sample at start of facemask therapy (years)
Whole Group
Mean SD
Males
Mean SD
Females
Mean SD
Start of FacemaskTreatment
n=32
11.65 1.8
n=15
11.8 2.0
n=17
11.5 1.7
The salient cephalometric features of the male and female sample groups were as follows:
TABLE 2. Profile of Class III malocclusion in this study at 10 years old
Measurements Male Sample Female Sample
SNA 81.3° 76.95°
SNB 83° 78.27°
ANB -1.71° -1.32°
Ul/Mx 110.92° 108.21°
Ll/Md 84.38° 81.97°
Overjet -0.45 mm 0.22 mm
The control group was taken from a UK Growth Study undertaken at King's College School of Medicine andDentistry, London (Kangesu, 2000). This control group consisted of 50 Class III subjects (32 males and 18 females)and consisted of mixed longitudinal data from 6.5 to 20 years old. Furthermore, Bhatia/Leighton's Growth Study(1993) was also used and this data was from a continuous longitudinal study of normal growth. This study startedwith 736 subjects at birth and with wastage ended with 152 subjects at 18 years. The timing of protractiontreatment and the variable length of treatment could not be controlled, as this was a retrospective study.
TABLE 3. Distribution of available records for different ages of the females in the total sample excludingthe control group
(+) Denotes wearing of the protraction headgear
Age 7 8 9 10 11 12 13 14 15 16 17 18 19 20
1 * **+ *+ *+ * *
2 * *+ *+ *+
3 * * *+ *
4 * * * *+
5 * *+ *+ * * * *

6 * *+ *+ *
7 * *+ * * *
8 * *+ *
9 * *+ **
10 * * *+ *
11 * * *+ *+
12 * *+ * *
13 * *+
14 * * * *+ *+
15 * * * *+ *+
16 * * *+ *+ *+
17 * *+ +* *+
TABLE 4. Distribution of available records for different ages of the males in the total sample excluding thecontrol group
(+) denotes wearing of the protraction headgear
Age 7 8 9 10 11 12 13 14 15 16 17 18 19 20
1 * *+ *+
2 * * *+ *
3 * *+ * *
4 **+ * *
5 * * * **+ *+ *+
6 * * * *+
7 * *+ *
8 * * * *+ *+ * *
9 * * *+ *+ * * *
10 * *+ *+ * *
11 * *+ *
12 * * *+ *+ *
13 * + *
14 * * *+ *
15 * *+ *+ *
METHOD
Tracing TechniqueA program was prepared with the list of 24 points to be digitised from each radiograph. The number, sex and age ofthe cases were recorded together with the number of radiographs. The longitudinal radiographs were digitised foreach case in sequence noting the age of each radiograph. This ensured the same mental image was used forlandmark identification. The landmarks, that were ambiguous due to lack of definition, were frequently checked tothe others in the series.
All digitisation's were carried out by one operator (JCS) and this was done using an integrated hardware andsoftware computer system in the Orthodontic Department at King's College School of Medicine and Dentistry(Bhatia, 1987). The software package allows collection, editing and analysis of the data. The digitiser has aresolution of 0.025mm and an accuracy of 0.125mm, which is sufficiently sensitive to identify small yearly changesin skeletal dimensions.
Each radiograph was digitised twice and the mean was taken for each value
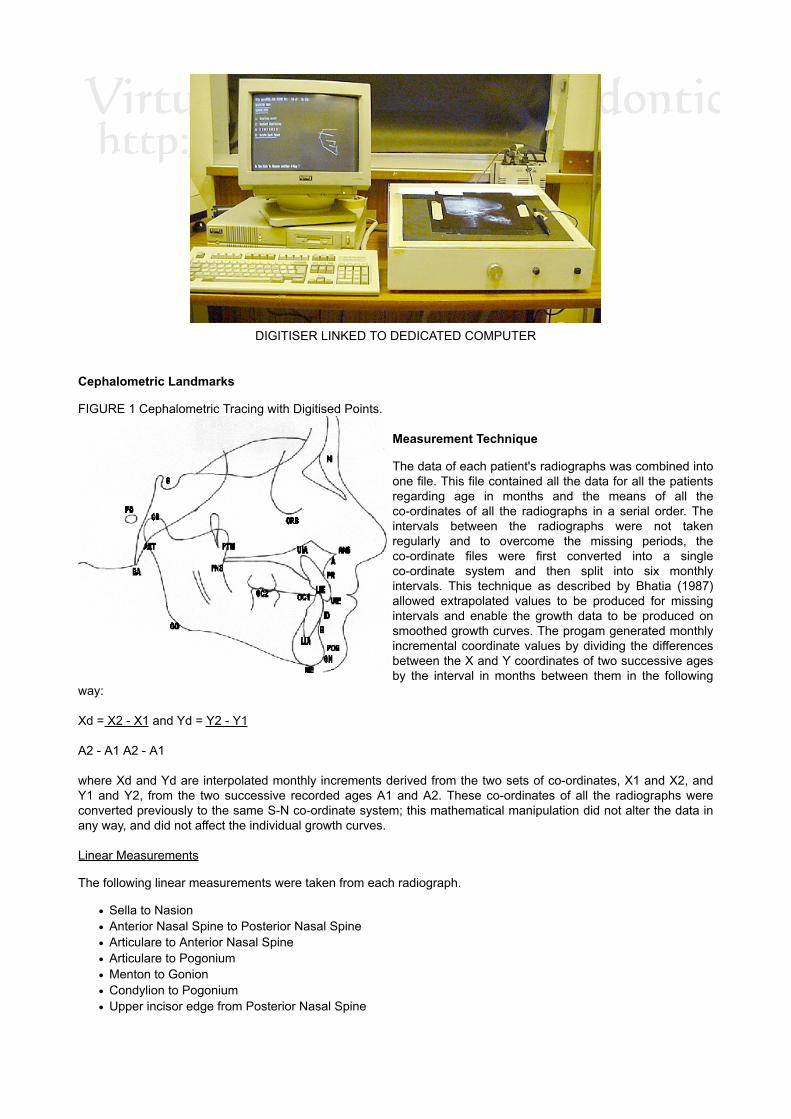
DIGITISER LINKED TO DEDICATED COMPUTER
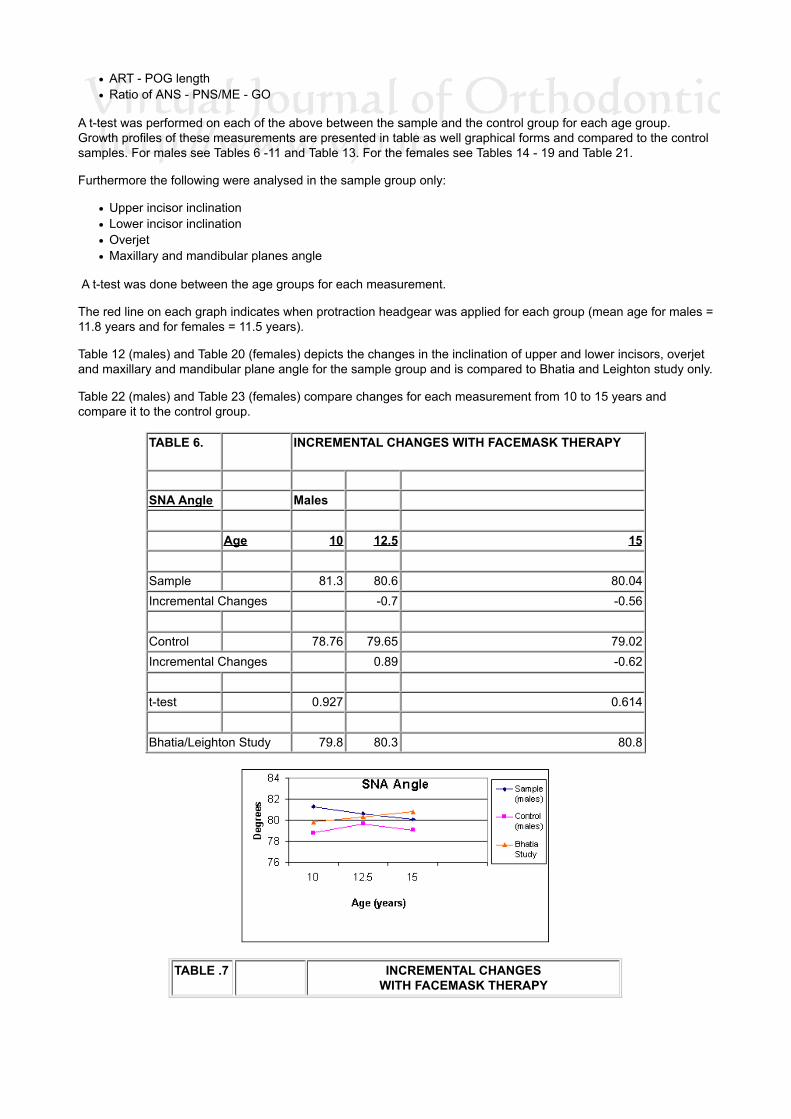
Cephalometric Landmarks
FIGURE 1 Cephalometric Tracing with Digitised Points.
Measurement Technique
The data of each patient's radiographs was combined intoone file. This file contained all the data for all the patientsregarding age in months and the means of all theco-ordinates of all the radiographs in a serial order. Theintervals between the radiographs were not takenregularly and to overcome the missing periods, theco-ordinate files were first converted into a singleco-ordinate system and then split into six monthlyintervals. This technique as described by Bhatia (1987)allowed extrapolated values to be produced for missingintervals and enable the growth data to be produced onsmoothed growth curves. The progam generated monthlyincremental coordinate values by dividing the differencesbetween the X and Y coordinates of two successive agesby the interval in months between them in the following
way:
Xd = X2 - X1 and Yd = Y2 - Y1
A2 - A1 A2 - A1
where Xd and Yd are interpolated monthly increments derived from the two sets of co-ordinates, X1 and X2, andY1 and Y2, from the two successive recorded ages A1 and A2. These co-ordinates of all the radiographs wereconverted previously to the same S-N co-ordinate system; this mathematical manipulation did not alter the data inany way, and did not affect the individual growth curves.
Linear Measurements
The following linear measurements were taken from each radiograph.
Sella to NasionAnterior Nasal Spine to Posterior Nasal SpineArticulare to Anterior Nasal SpineArticulare to PogoniumMenton to GonionCondylion to PogoniumUpper incisor edge from Posterior Nasal Spine

Lower incisor edge from Posterior Nasal Spine
The use of ratios is useful if we wish to see the change of jaw relationships with age and treatment, and thefollowing were measured;
Nasion to Sella / Anterior Nasal Spine to Posterior Nasal SpineNasion to Sella / Menton to GonionAnterior Nasal Spine to Posterior Nasal Spine / Menton to GoniumOverjet measured with relation to occlusal plane
Angular Measurements
It was felt that the following angular measurements would be recorded to show the correction of the Class IIImalocclusion:
Sella - Nasion - A-pointSella - Nasion - B-pointA-point - Nasion - B-pointUpper incisor to maxillary planeLower incisor to mandibular planeMaxillary and mandibular plane angle
STATISTICAL ANALYSIS
Descriptive Statistics
The following were calculated for each of the variables used:
Mean (X) = å X
N
Standard Deviation (S.D.) = Ö å (X-X)²
N
Standard Error of the Mean (S.E.) = S.D.
Ö N
where N = the number of observations
X = the value of each observation
Inferential statistics
An independent t-test was carried out for comparison between the mean values of the 10 and 15-year-old groupsfor the different sexes.
t = Mf - Mg _
Ö (S.E.f + S.E.g )
where S.E. = S.D.
Ö N
and N = the number of male or female cases.
Error study
The variability in identification of the hard-tissue landmarks was determined by direct double digitisation ofradiographs. It was attempted to digitise all radiographs of subject in one sitting to ensure that the same mentalpicture of a landmark was used. These coordinates were utilised to calculate the variability in the identification ofthe landmarks in X and Y directions. The variability of 24 landmarks is shown as standard deviations of thecoordinates numerically in Table 5.

TABLE 5. The root mean squares (mm) of the differences between the coordinates obtained on doubledigitisation at 12 years
X Y
N 0.19 0.33
S 0.17
BA 0.41
0.19
0.33
CD 0.55 0.67
ART 0.35 0.37
GO 0.6 0.5
ME 0.24 0.19
GN 0.33 0.33
PG 0.24 0.7
B 0.18 0.4
ID 0.14
LIE 0.28
0.33
0.3
LIA 0.47 0.59
UIE 0.22 0.25
UIA 0.50 0.49
PR 0.30 0.26
A 0.3 0.5
ANS 0.76 0.39
PNS 0.79 0.26
PTM 0.37 0.88
OC1 1.22 0.30
OC2 0.9 0.35
ORB 1.1 0.4
PO 0 .68 0.68
These above figures were compared to Bhatia and Leighton (1993) error study and it was noted that the values forthe X and Y were similar which implied that error in identification was on par with their study.
RESULTS
Although the data for some patients ranged from 10 to 17 years, to improve the adequacy of the sample only ages10 to 15 were considered. The following measurements were analysed in more detail for this study:
SNA angleSNB angleANB angleANS - PNS lengthART - ANS length
ART - POG lengthRatio of ANS - PNS/ME - GO
A t-test was performed on each of the above between the sample and the control group for each age group.Growth profiles of these measurements are presented in table as well graphical forms and compared to the controlsamples. For males see Tables 6 -11 and Table 13. For the females see Tables 14 - 19 and Table 21.
Furthermore the following were analysed in the sample group only:
Upper incisor inclinationLower incisor inclinationOverjetMaxillary and mandibular planes angle
A t-test was done between the age groups for each measurement.
The red line on each graph indicates when protraction headgear was applied for each group (mean age for males =11.8 years and for females = 11.5 years).
Table 12 (males) and Table 20 (females) depicts the changes in the inclination of upper and lower incisors, overjetand maxillary and mandibular plane angle for the sample group and is compared to Bhatia and Leighton study only.
Table 22 (males) and Table 23 (females) compare changes for each measurement from 10 to 15 years andcompare it to the control group.
TABLE 6. INCREMENTAL CHANGES WITH FACEMASK THERAPY
SNA Angle Males Age 10 12.5 15
Sample 81.3 80.6 80.04Incremental Changes -0.7 -0.56
Control 78.76 79.65 79.02Incremental Changes 0.89 -0.62
t-test 0.927 0.614
Bhatia/Leighton Study 79.8 80.3 80.8
TABLE .7 INCREMENTAL CHANGESWITH FACEMASK THERAPY

SNBAngle
Males
Age 10 12.5 15
Sample 83 82.9 81.59
Incremental Changes -0.1 -1.31
Control 79.94 80.47 82.36
Incremental Changes 0.53 1.89
t-test 1.717 -0.491
Bhatia/Leighton Study 76.5 77.1 78
TABLE 8. INCREMENTAL CHANGES WITH FACEMASKTHERAPY
ANB
Males
AGE 10 12.5 15
Sample
-1.71 -2.31 -2.01
Incremental Changes
-0.6 0.3
Control
-1.18 -2.19 -3.34

Incremental Changes
0.35 2.51
t-test
0.53
-1.119
Bhatia/Leighton Study 3.3 3.2 2.8
TABLE 9. INCREMENTAL CHANGES
WITH FACEMASK THERAPY
ANS-PNS
Males
Age 10 12.5 15
Sample
48.07 49.62 51.46
Incremental Changes
1.55 1.84
Control
43.2 46.56 46.58
Incremental Changes
3.36 0.02
t-test
3.233
4.948
Bhatia/Leighton Study 47.4 49 51.8

TABLE 10. INCREMENTAL CHANGES
WITH FACEMASK THERAPY
ART-POG
Males
Age 10 12.5 15
Sample
99.42 104.11 111.33
Difference
4.69 7.22
Control
99.09 105.21 110.84
Difference
6.12 5.63
t-test
0.108
0.209
Bhatia/Leighton Study 93.4 97.1 105.2
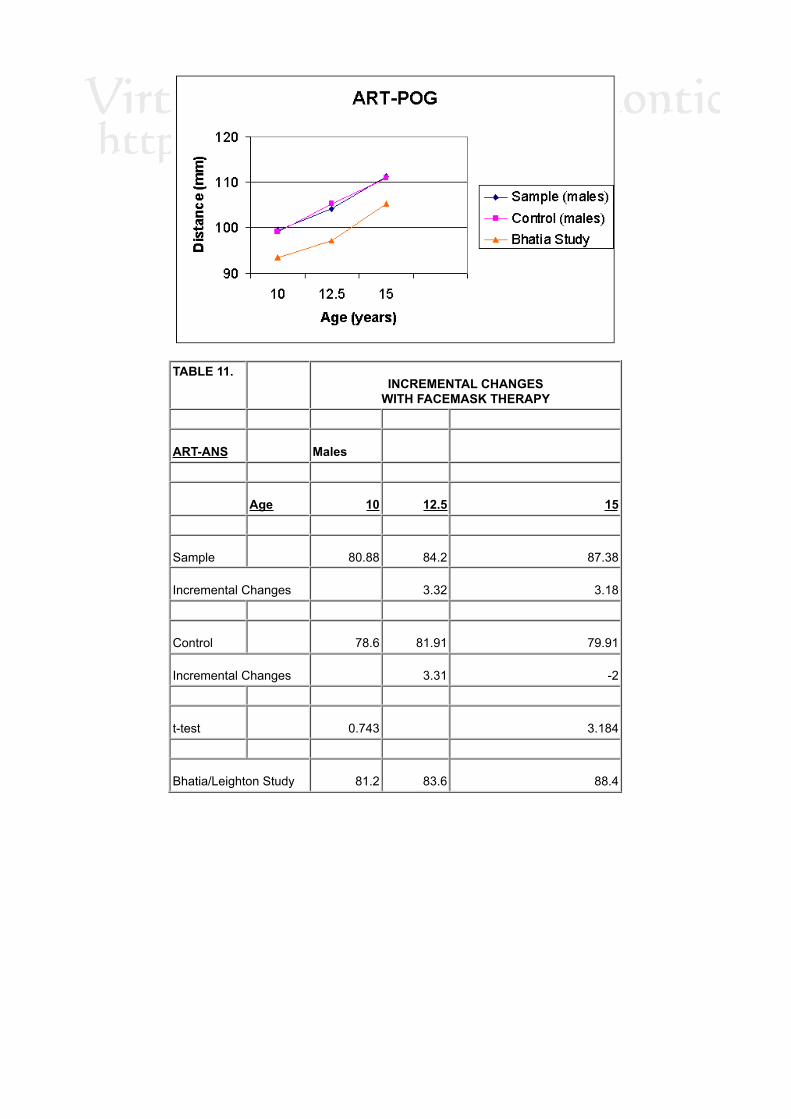
TABLE 11. INCREMENTAL CHANGES
WITH FACEMASK THERAPY
ART-ANS
Males
Age 10 12.5 15
Sample
80.88 84.2 87.38
Incremental Changes
3.32 3.18
Control
78.6 81.91 79.91
Incremental Changes
3.31 -2
t-test
0.743
3.184
Bhatia/Leighton Study 81.2 83.6 88.4

TABLE 12. INCREMENTAL CHANGES
WITH FACEMASK THERAPY
UI/Mx PlaneAngle
Males
AGE(years)
10 12.5 15
t-test
Sample
110.92 115.11 115.08
1.307
Incremental Changes
4.19 -0.03
Bhatia/Leighton study 109.2 109.5 109.6
t-test
0.952
2.373
LI/Md PlaneAngle
Sample
84.38 79.77 78.13
-2.742
Incremental Changes
-4.61 -1.64
Bhatia/Leighton study 90.2 91.7 91.8
t-test
3.02
6.163
Overjet
Sample
-0.45 1 1.82
1.669
Incremental Changes
1.45 0.82
Bhatia/Leighton study

t-test
Mx/Md PlaneAngle
Sample
28.32 29.14 31.16
-1.17
Incremental Changes
0.82 2.02
Bhatia/Leighton study 29.3 28.8 27.6
t-test
0.534
1.941
Table 13.RATIOS Males
Mx/MD
Age 10 12.5 15
Sample
0.72 0.69 0.69
Control
0.64 0.66 0.62
Bhatia/Leighton Study 0.74 0.74 0.73
t-test for Sample and Control
3.81
5
TABLE 14. INCREMENTAL CHANGES
WITH FACEMASK THERAPY
SNA Angle
Females
Age 10 12.5 15

Sample
76.95 78.57 80
Incremental Changes
1.62 1.43
Control
76.77 77.67 77.51
Incremental Changes
0.9 -0.06
t-test
0.102
1.852
Bhatia/Leighton Study 79.4 79.9 80
TABLE 15. INCREMENTAL CHANGES
WITH FACEMASK THERAPY
SNB Angle
Females
Age 10 12.5 15
Sample
78.27 80.08 79.65
Incremental Changes
1.81 -0.43
Control
78.13 78.7 79.26
Incremental Changes
0.63 0.5
t-test
0.104
0.272

Bhatia/Leighton Study 76.7 77.5 77.9
TABLE 16. INCREMENTAL CHANGES
WITH FACEMASK THERAPY
ANS-PNS
Females
Age 10 12.5 15.5 17
Sample
44.99 47.22 47.33 48.66
Difference
2.23 0.11 1.33
Control
43.73 45.1 46.93 45.7
Difference
1.37 1.83 -1.23

TABLE 17. INCREMENTAL CHANGES
WITH FACEMASK THERAPY
ART-POG
Females
Age 10 12.5 15.5 17
Sample
94.62 99.55 102.84 105.5
Difference
4.93 3.29 2.66
Control
96.87 101.38 105.22 105.71
Difference
4.51 3.84 0.49

TABLE 18. INCREMENTAL CHANGES
WITH FACEMASK THERAPY
ART-POG
Females
Age 10 12.5 15
Sample
94.62 99.55 102.97
Incremental Changes
4.93 3.42
Control
96.87 101.38 104.35
Incremental Changes
4.51 2.97
t-test
-1.521
-0.644
Bhatia/Leighton Study 91.4 95.8 100.4
TABLE 19. INCREMENTAL CHANGES
WITH FACEMASK THERAPY
ART-ANS
Females
Age 10 12.5 15
Sample
76.3 79 79.69

Incremental Changes
2.7 0.69
Control
76.47 78.23 79.43
Incremental Changes
1.76 1.2
t-test
0.11
0.13
Bhatia/Leighton Study 79.1 81.4 83.9
TABLE 20. INCREMENTAL CHANGES
WITH FACEMASK THERAPY
UI/Mx Planeangle
Females
Age 10 12.5 15
t-test
Sample
108.21 113.58 115.43
-1.948
Incremental Changes
5.37 1.85
Bhatia/Leighton study 109.8 109.4 109.2
t-test
0.577
2.226
LI/Md Planeangle
Sample
81.97 80.32 76.3
1.431
Incremental Changes
-1.65 -4.02

Bhatia/Leighton study 90.8 90.7 89.6
t-test
3.013
4.688
Overjet
Sample
0.02 1.89 2.99
3.177
Incremental Changes
1.87 1.1
Bhatia/Leighton study
t-test
Mx/Md Planeangle
Sample
31.2 29.51 31.35
0.061
Incremental Changes
-1.69 1.84
Bhatia/Leighton study 28.5 27.8 26.3
t-test
1.49
2.666
TABLE 21. INCREMENTAL CHANGESWITH FACEMASK THERAPY
RATIOS Females
Mx/MD Age 10 12.5 15
Sample 0.71 0.71 0.71Control 0.69 0.68 0.69BhatiaStudy
0.75 0.74 0.73
t-test betweenSample and Control
1.818 0.942

TABLE 22.CHANGES IN MEASUREMENTS
BETWEEN 10 AND 15 YEARS OLD
SAMPLE MEAN S.D.
MEAN S.D. Difference
Male 10 YearsOld
15 YearsOld
in mean
SNA81.3
3.07
80.04 3.65 -1.26
SNB83
3.26
81.59 4.31 1.41
ANB-1.71
1.54
-1.55 2.34 0.16
N-S65.33
1.7
68.85 3.98 3.52
ANS-PNS48.07
1.73
51.46 1.99 3.39
ME-GO66.58
4.14
74.8 5.39 8.22
CD-POG106.88
4.16
118.42 6.99 11.54
CD-ANS81.4
3.68
87.33 5.31 5.93
ART-POG99.42
4.26
111.34 5.98 11.92
ART-ANS80.88
3.74
87.17 5.08 6.29
RATIO N-S/ANS-PNS1.36
0.05
1.33 0.06 -0.03
RATIO N-S/ME-GO0.98
0.05
0.92 0.06 -0.06RATIOANS-PNS/ME-GO
0.72 0.03 0.69 0.04 -0.03
UI/MxP 110.92 7.34 115.08 6.42 4.16
UIE-PNS45.6 2.66 49.66 2.26
4.06
LIE-PNS46.06 3.66 47.84 3.38
1.78
Overjet-0.46 2.71 1.82 3.21
2.28
LI/MdP84.38 3.39 78.13 6.26
-6.25
Mx/MdPA 28.32 5.33 31.16 5.222.84
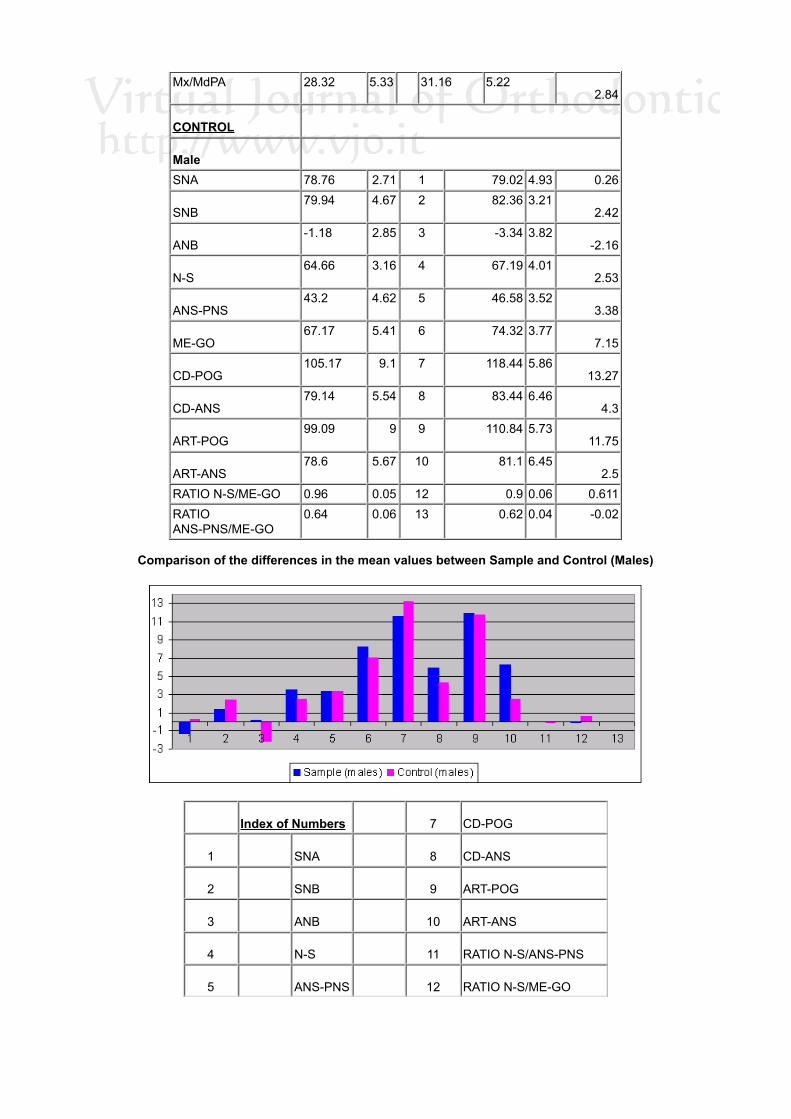
CONTROL
Male
SNA 78.76 2.71 1 79.02 4.93 0.26
SNB79.94 4.67 2 82.36 3.21
2.42
ANB-1.18 2.85 3 -3.34 3.82
-2.16
N-S64.66 3.16 4 67.19 4.01
2.53
ANS-PNS43.2 4.62 5 46.58 3.52
3.38
ME-GO67.17 5.41 6 74.32 3.77
7.15
CD-POG105.17 9.1 7 118.44 5.86
13.27
CD-ANS79.14 5.54 8 83.44 6.46
4.3
ART-POG99.09 9 9 110.84 5.73
11.75
ART-ANS78.6 5.67 10 81.1 6.45
2.5RATIO N-S/ME-GO 0.96 0.05 12 0.9 0.06 0.611RATIOANS-PNS/ME-GO
0.64 0.06 13 0.62 0.04 -0.02
Comparison of the differences in the mean values between Sample and Control (Males)
Index of Numbers
7 CD-POG
1
SNA
8 CD-ANS
2
SNB
9 ART-POG
3
ANB
10 ART-ANS
4
N-S
11 RATIO N-S/ANS-PNS
5
ANS-PNS
12 RATIO N-S/ME-GO

6
ME-GO
13 RATIO ANS-PNS/ME-GO
TABLE 23.CHANGES IN MEASUREMENTS BETWEEN 10 AND 15 YEARS OLD
SAMPLE
MEAN S.D.
MEAN S.D. Difference
Female
10 Years Old
15 Years Old in mean
SNA
76.95 3.21
80 3.06 3.05
SNB
78.27 3.41
79.65 4.05 1.38
ANB
-1.32 1.53
0.35 3.33 1.67
N-S
62.5 2.32
64.38 3.11 1.88
ANS-PNS
44.99 1.84
47.97 2.24 2.99
ME-GO
63.05 2.39
67.62 3.67 4.57
CD-POG
102.08 4.89
111.06 4.57 8.98
CD-ANS
77.43 3.08
81.02 4.84 3.59
ART-POG
94.62 4.3
102.97 4.35 8.35
ART-ANS
76.3 3.03
79.69 4.44 3.39
RATIO N-S/ANS-PNS
1.39 0.04
1.34 0.06 0.05
RATIO N-S/ME-GO
0.99 0.05
0.95 0.05 -0.04
RATIO ANS-PNS/ME-GO 0.71 0.02
0.71 0.05 0
UI/MxP
108.21 7.76
115.43 8.79 7.22
UIE-PNS
41.82 3.16
47.74 3.98 5.92
LIE-PNS
41.8 3.32
44.75 4.6 2.95
Overjet
0.02 1.58
2.99 2.55 2.97
LI/MdP
81.97 8.72
78.27 8.92 -3.7
Mx/MdPA
31.2 5.14
31.35 5.85 0.15
CONTROL
SNA
76.77 3.74 1 77.51 3.64 0.74 0.74
SNB
78.13 4.19 2 79.26 2.89 1.13 1.13

ANB
-1.37 3.1 3 -1.75 2.98 -0.38 -0.38
N-S
63.62 1.35 4 65.54 2.48 1.92 1.92
ANS-PNS
43.73 1.35 5 46.64 3.21 2.91 2.91
ME-GO
62.87 3.17 6 67.25 4.16 4.38 4.38
CD-POG
103.51 1.47 7 110.47 3.85 6.96 6.96
CD-ANS
77.55 3.23 8 80.31 4.57 2.76 2.76
ART-POG
96.87 0.99 9 104.35 3.52 7.48 7.48
ART-ANS
76.47 3.09 10 79.43 4.2 2.96 2.96
RATIO N-S/ANS-PNS
1.45 0.03 11 1.4 0.08 -0.05 -0.05
RATIO N-S/ME-GO
1 0.04 12 0.97 0.07 -0.03 -0.03
RATIOANS-PNS/ME-GO
0.69 0.02 13 0.69 0.06 0 0
Comparison of the differences in the mean values between Sample and Control (Females)
Index of Numbers
7 CD-POG
1
SNA
8 CD-ANS
2
SNB
9 ART-POG
3
ANB
10 ART-ANS
4
N-S
11 RATIO N-S/ANS-PNS
5
ANS-PNS
12 RATIO N-S/ME-GO
6
ME-GO
13 RATIO ANS-PNS/ME-GO
DISCUSSION
This study is based on clinical records from subjects that had protraction headgear therapy at Kingston Hospital,where it was previously felt that protraction headgear therapy was beneficial in the treatment of Class IIImalocclusions using the lightest force that would still produce a useful clinical result. The present study investigates

this principle with a view in isolating skeletal changes from dento-alveolar changes. The timing with the applicationof protraction headgear is later than conventionally applied and this could be due to the later age of referring to thehospital in the UK. Thus it could be expected that the study might not show any skeletal changes. This study had amean of 11.8 years for the males (S.D. = 2.0) and 11.5 years for the females (S.D. = 1.7). Patient co-operation is ofmajor importance for the treatment outcome and it is suggested, the younger the patient, the more co-operative thepatient will be. Furthermore early intervention with orthopaedic maxillary protraction could provide a non-surgicalalternative. Cozzani (1981) advocated starting at a young age, even as young as 4 years old and he concludedthat starting after 6 years of age would limit the orthopaedic changes. On the contrary, Merwin et al. (1997) foundthat similar skeletal response can be obtained when maxillary protraction was started either before age 8 (5-8years) or after 8 (8-12 years). The main control group (Class III) was from a mixed longitudinal study that has adisadvantage of not being a true continuous longitudinal study. The other control group (Bhatia/Leighton) is a truelongitudinal growth study but the data was taken from normal growth patterns incorporating mainly Class I subjects.
Changes in skeletal relationshipAngular Measurements
Male GroupIn the male sample group, SNA reduces (1.26 degrees) between 10 and 15 years, whilst the control group showsvery little change (0.27 degrees). Bhatia/Leighton's sample increases for this period by 1 degree. However, SNBreduces by 1.41 degrees compared to the other 2 control studies that both show increases (> 2 degrees for thecontrol). This is further reflected with ANB angle, which increases for the sample whilst with the 2 control groups itdecreases. The trend shows an increase in ANB but it is not statistically significant.
Female GroupIn the female sample group, the SNA increases between 10 and 15 years old (average + 3.05 degrees), whilst thecontrol group shows very little change (0.84 degrees), as does Bhatia/Leighton's study. SNB does not showstatistically any significant changes between the 3 groups. However, ANB shows an increase by 1.67 degreescompared to the other 2 groups that both show a decrease in value. The trend shows an improvement in ANB butonce again not statistically significant.
Linear Measurements
Male GroupIn the male sample group, ANS - PNS length did show a statistically significant (p<0.001) increase compared to thecontrol group but not when compared to Bhatia/Leighton's study. The ART - POG measurements for the 3 groupsdo not show any significant differences when compared to each other. However, ART - ANS for the sample groupdid show a significant increase (6.5mm) when compared to the control group (1.31mm) but increases in the sameproportion when compared to Bhatia/Leighton's study (7.2mm). The ratio of maxillary length to mandibular length isstatistically significantly higher in the male sample when compared to the control group (p<0.001), which seems tobe due to a larger ANS - PNS measurement in the sample group.The male sample group seemed to respond better when the measurement ART-ANS was compared to the controlgroup and the indication is that the protraction therapy facilitated the full growth potential. Female Group In thefemale sample group, ANS - PNS length and ART- POG length increases incrementally in the same proportionbetween all three groups. The increases in ANS - PNS length of the sample (2.98mm) and control group (2.91mm)are similar when they are compared to Bhatia/Leighton's study (2.8mm). Similarly, the ART-POG length (8.35mm)is not significantly greater in length when compared to Bhatia/Leighton's study (9mm) and when compared to thecontrol group (7.48mm). The incremental changes in ART - ANS lengths are proportionally similar between allthree groups as was shown with ART - POG length. The ratio Mx length/Md length for the sample did not alter from10 to 15 year age groups but did slightly reduce for the control and Bhatia/Leighton's study group.In this study the ART - ANS and ART - POG measurements seem to indicate that the maxillary length for thesample and control seems to slow down in growth when compared to Bhatia/Leighton's study. Furthermore,protraction therapy with light forces and applied at a later age do not induce any significant skeletal changes.
Dento-alveolar Changes
Male sample groupClinically and radiographically, it was noted that the upper incisors proclined (4.16 degrees) and the lower incisorsretroclined (6.25 degrees) and a positive overjet (1.82mm) was achieved. The Mx/Md plane angle increased by 2.9degrees and this compares to a reduction of 2 degrees in Bhatia/Leighton's study.
Female sample groupThe upper incisors proclined by 7.22 degrees and the lower incisors retroclined by 5.67 degrees. The overjetcorrected by 2.97 mm and this was statistically significant (p<0.001). The Mx/Md plane angle reduced by 0.15degrees and this compares to 2.5 degrees in Bhatia/Leighton's study.

The significance of this data was obscured by the wide range of variability of the different patients in this sample.This has been a problem in past studies and Delaire (1997) noted that SNA ranged from 68 to 90 degrees, SNBfrom 70 to 90 degrees and ANB between -5 to +7.5 degrees in 172 cases treated with facemasks. This vast rangeof variables increases the difficulty to analyse the data successfully and a number of different approaches havebeen used to overcome this problem. Certain studies used a smaller group with similar starting measurements(Pangrazio-Kulbersch et al., 1998), whilst others only measured incremental growth changes (Franchi et al., 1998).Delaire used cranio-facial architectural analyses and superimposition to overcome the wide variance. However, thedata did show the different tendencies when protraction headgear was applied and the individual responses fromskeletal and dento-alveolar structures were noted.The facemask appliance used at Kingston Hospital was used at a later age when compared to other centres andthe force applied was approximately 100-200 g per side. Delaire (1997) uses anything up to 1000 g per side whenusing protraction facemasks. The skeletal response for this sample was not significant when compared to thecontrol group and the Bhatia/Leighton's growth study. The mean age for the females was 11.5 and 11.8 for themales which is much later than suggested by Tindlund (1994) and Ngan et al. (1996) who recommended use ofprotraction headgear in the early mixed dentition. Delaire (1997) noted that an increase in SNA from protractionreduced as the patient got older and the average for the 12-14 years group was an average increase of 1.84degrees. In other studies an increase of up to 3.6 degrees with SNA was reported (Cozzani, 1981) but treatmentwas started before the age of 9 years. Cozzani also advocated forces approximately 1000 g per side.In this study SNA increased by 3.05 degrees for the female sample but then decreased by 1.26 degrees for themale sample. The change in ANB was not significant but it did show an improvement and a correcting trend wasnoted for the protraction group when compared to the control group.The male group responded more favourably with protraction therapy than the female group when the ART - ANSchanges was compared to the control and Bhatia/Leighton's study.Dento-alveolar changes were most significant with the protraction sample as correction of overjet was on average2.62mm. Upper incisors proclined on average by 5.69 degrees and lower incisors retroclined by 5.96 degrees. TheMx/Md plane angle did not change in the female group but did increase by 2.9 degrees for the males.
CONCLUSION
In summary, the protraction group did show dento-alveolar changes during protraction therapy but no significantskeletal changes. The main factors for this are:
Later age of application of facemasksLight forces used with facemask therapyMost of the force was applied to removable appliances, which do not fully transmit the forces to the skeletalstructures.
In view of the above, it would seem that protraction therapy as previously used at Kingston Hospital was designedto correct mild Class III malocclusions effectively by dento-alveolar means only.Considering the great diversity of anatomical forms of Class III, it is not surprising that protraction headgear giveswidely varying results.Unfortunately this study does not answer the question regarding post-treatment relapse or if normal growth willcatch up?However, from this sample only one patient continued treatment with a surgical correction.Clinically it was noted that certain cases showed a mild form of relapse, which was evident when measuring theoverjet.
REFERENCES
Potpeschnigg: Deutsch viertel Jahrschrift fur Zahnheilkunde, Monthly Review of Dentistry 3: 464-465, 1875.1.Delaire J: L'articulation fronto-maxillaire: Bases theoretiques et principles generaux d'application de forces extra-orales postero-anterieures sur masque orthopedique, Rev.Stomat.Paris 77:921-930, 1976.
2.
Petit H: Adaptations following accelerated facial mask therapy, Clinical Alteration of the Growing Face, Ed: J A McNamara, Jr, K ARibbens, and R P Howe, University of Michigan, Ann Arbor, 1983.
3.
Kangesu N: Growth in untreated Class III subjects in London, Dissertation for Master's thesis in Orthodontics, King's College, London,UK, 2000.
4.
Bhatia SN, Leighton BC: A manual of Facial Growth, Oxford University Press, 1993.5.Orton HS, Noar JH, Smith AJ: The Customised Facemask, Journal of Clinical Orthodontics 4: 230-235, 1992.[PubMed Citation]6.Bhatia SN: An interactive computer program for recording and analysing longitudinal cephalometric growth material, British Journal ofOrthodontics 14: 299-304, 1987.[PubMed Citation]
7.
Cozzani G: Extra oral traction and Class III treatment, American Journal of Orthodontics 80: 638-650, 1981.[PubMed Citation]8.Merwin D, Ngan P, Hagg U, Yin C, Wei Shy: Timing for effective application of anteriorly directed orthopedic force to the maxilla,American Journal of Orthodontics 112(3): 292-299, 1997.[PubMed Citation]
9.
Delaire J: Maxillary development revisited: relevance to the orthopaedic treatment of Class III malocclusions, European Journal of10.

Orthodontics 19: 289-311, 1997.[PubMed Citation]Pangrazio-Kulbersch V, Berger J, Kersten G: Effects of protraction mechanics on the midface, American Journal of Orthodontics andDentofacial Orthopedics 114: 484-491, 1998. [PubMed Citation]
11.
Franchi L, Baccetti T, McNamara J: Shape-coordinate analysis of skeletal changes induced by rapid maxillary expansion and facialmask therapy.Am J Orthod Dentofacial Orthop. 1998 Oct;114(4):418-26.[PubMed Citation]
12.
Tindlund RS: Skeletal response to maxillary protraction in patients with cleft lip and palate before age 10 years, Cleft Palate-Craniofacial Journal 31:259-308, 1994.[PubMed Citation]
13.
Ngan P, Hagg U, Yiu C, Merwin D, Wei S: Treatment response to maxillary expansion and protraction, Eur J Orthod 1996Apr;18(2):151-68 [PubMed Citation]
14.
To cite this article please write:
Jones AG., Naini FB., Stubbs JC. A comparison of skeletal and dentoalveolar changes during facemask therapy with growth changes in untreated class III controls.Virtual Journal of Orthodontics [serial online] 2002 December 29; 5(2): Available from URL:http://www.vjo.it/052/facem.htm
about us | current issue | home
Virtual Journal of Orthodontics ISSN - 1128 6547Issue 5.2 - 2002 - http://www.vjo.it/vjo052.htm
Copyright © 1996-2003 All rights reservedE-mail: [email protected].