Embed Size (px)
Citation preview

Marine Sanctuaries Conservation Series ONMS-09-02
U.S. Department of Commerce National Oceanic and Atmospheric Administration National Ocean Service Office of Ocean and Coastal Resource Management Office of National Marine Sanctuaries March 2009
A Comparison of Seafloor Habitats and Associated Benthic Fauna in Areas Open and Closed to Bottom Trawling Along the Central
California Continental Shelf

About the Marine Sanctuaries Conservation Series
The National Oceanic and Atmospheric Administration’s Office of National Marine Sanctuaries (ONMS) administers the Office of National Marine Sanctuaries. Its mission is to identify, designate, protect and manage the ecological, recreational, research, educational, historical, and aesthetic resources and qualities of nationally significant coastal and marine areas. The existing marine sanctuaries differ widely in their natural and historical resources and include nearshore and open ocean areas ranging in size from less than one to over 5,000 square miles. Protected habitats include rocky coasts, kelp forests, coral reefs, sea grass beds, estuarine habitats, hard and soft bottom habitats, segments of whale migration routes, and shipwrecks. Because of considerable differences in settings, resources, and threats, each marine sanctuary has a tailored management plan. Conservation, education, research, monitoring and enforcement programs vary accordingly. The integration of these programs is fundamental to marine protected area management. The Marine Sanctuaries Conservation Series reflects and supports this integration by providing a forum for publication and discussion of the complex issues currently facing the Office of National Marine Sanctuaries. Topics of published reports vary substantially and may include descriptions of educational programs, discussions on resource management issues, and results of scientific research and monitoring projects. The series facilitates integration of natural sciences, socioeconomic and cultural sciences, education, and policy development to accomplish the diverse needs of NOAA’s resource protection mandate.

A Comparison of Seafloor Habitats and Associated Benthic Fauna in Areas Open and Closed to Bottom Trawling Along
the Central California Continental Shelf
J. de Marignac1, J. Hyland2, J. Lindholm3, A. DeVogelaere1, W.L. Balthis2, and D. Kline3
1 NOAA/NOS Office of National Marine Sanctuaries (ONMS), Monterey Bay National Marine Sanctuary, 299 Foam Street, Monterey, CA 93940
2 NOAA/NOS National Centers for Coastal Ocean Science (NCCOS), Center for Coastal Environmental Health and Biomolecular Research (CCEHBR), 219 Fort Johnson Road,
Charleston, SC 29412-9110 3 Institute for Applied Marine Ecology, California State University Monterey Bay, 100
Campus Center, Building 53, Seaside, CA 93955
Silver Spring, Maryland March 2009
U.S. Department of Commerce Otto Wolff, Acting Secretary
National Oceanic and Atmospheric Administration
Dr. Bill Brennan, Acting Administrator Under Secretary of Commerce for Oceans and Atmosphere
National Ocean Service
Jack Dunnigan, Assistant Administrator
Office of National Marine Sanctuaries Daniel J. Basta, Director

DISCLAIMER
Report content does not necessarily reflect the views and policies of the Office of National Marine Sanctuaries or the National Oceanic and Atmospheric Administration, nor does the mention of trade names or commercial products constitute endorsement or recommendation for use.
REPORT AVAILABILITY
Electronic copies of this report may be downloaded from the National Marine Sanctuaries Program web site at www.sanctuaries.nos.noaa.gov. Hard copies may be available from the following address: National Oceanic and Atmospheric Administration Office of National Marine Sanctuaries SSMC4, N/ORM62 1305 East-West Highway Silver Spring, MD 20910
COVER NOOA Ship McArthur II (Credit: NOAA)
SUGGESTED CITATION
de Marignac, J., J. Hyland, J. Lindholm, A. DeVogelaere, W.L. Balthis, and D. Kline. 2008. A comparison of seafloor habitats and associated benthic fauna in areas open and closed to bottom trawling along the central California continental shelf. Marine Sanctuaries Conservation Series ONMS-09-02. U.S. Department of Commerce, National Oceanic and Atmospheric Administration, Office of National Marine Sanctuaries, Silver Spring, MD. 44 pp.
CONTACT Jean de Marignac, SIMoN Scientist Monterey Bay National Marine Sanctuary, 299 Foam Street, Monterey, CA 93940. E-mail: [email protected]

1
EXECUTIVE SUMMARY
A number of studies have shown that mobile, bottom-contact fishing gear (such as otter trawls) can alter seafloor habitats and associated biota. Considerably less is known about the recovery of these resources following such disturbances, though this information is critical for successful management. In part, this paucity of information can be attributed to the lack of access to adequate control sites – areas of the seafloor that are closed to fishing activity. Recent closures along the coast of central California provide an excellent opportunity to track the recovery of historically trawled areas and to compare recovery rates to adjacent areas that continue to be trawled. In June 2006 we initiated a multi-year study of the recovery of seafloor microhabitats and associated benthic fauna inside and outside two new Essential Fish Habitat (EFH) closures within the Cordell Bank and Gulf of the Farallones National Marine Sanctuaries. Study sites inside the EFH closure at Cordell Bank were located in historically active areas of fishing effort, which had not been trawled since 2003. Sites outside the EFH closure in the Gulf of Farallones were located in an area that continues to be actively trawled. All sites were located in unconsolidated sands at equivalent water depths. Video and still photographic data collected via a remotely operated vehicle (ROV) were used to quantify the abundance, richness, and diversity of microhabitats and epifaunal macro-invertebrates at recovering and actively trawled sites, while bottom grabs and conductivity/temperature/depth (CTD) casts were used to quantify infaunal diversity and to characterize local environmental conditions. Analysis of still photos found differences in common seafloor microhabitats between the recovering and actively trawled areas, while analysis of videographic data indicated that biogenic mound and biogenic depression microhabitats were significantly less abundant at trawled sites. Each of these features provides structure with which demersal fishes, across a wide range of size classes, have been observed to associate. Epifaunal macro-invertebrates were sparsely distributed and occurred in low numbers in both treatments. However, their total abundance was significantly different between treatments, which was attributable to lower densities at trawled sites. In addition, the dominant taxa were different between the two sites. Patchily-distributed buried brittle stars dominated the recovering site, and sea whips (Halipteris cf. willemoesi) were most numerous at the trawled site though they occurred in only five of ten transects. Numerical classification (cluster analysis) of the infaunal samples also revealed a clear difference between benthic assemblages in the recovering vs. trawled areas due to differences in the relative abundances of component species. There were no major differences in infaunal species richness, H′ diversity, or J′ evenness between recovering vs. trawled site groups. However, total infaunal abundance showed a significant difference attributable to much lower densities at trawled sites. This pattern was driven largely by the small oweniid polychaete Myriochele gracilis, which was the most abundant species in the overall study region though significantly less abundant at trawled sites. Other taxa that were significantly less abundant at trawled sites included the polychaete M. olgae and the polychaete family Terebellidae. In contrast, the thyasirid bivalve Axinopsida serricata and the polychaetes Spiophanes spp. (mostly S. duplex), Prionospio spp., and Scoloplos armiger all had significantly to near significantly higher abundances at trawled sites. As a result of such contrasting species patterns, there also was a significant difference in the overall dominance structure of infaunal assemblages between the two treatments.

2
It is suggested that the observed biological patterns were the result of trawling impacts and varying levels of recovery due to the difference in trawling status between the two areas. The EFH closure was established in June 2006, within a month of when sampling was conducted for the present study, however, the stations within this closure area are at sites that actually have experienced little trawling since 2003, based on National Marine Fishery Service trawl records. Thus, the three-year period would be sufficient time for some post-trawling changes to have occurred. Other results from this study (e.g., similarly moderate numbers of infaunal species in both areas that are lower than values recorded elsewhere in comparable habitats along the California continental shelf) also indicate that recovery within the closure area is not yet complete. Additional sampling is needed to evaluate subsequent recovery trends and persistence of effects. Furthermore, to date, the study has been limited to unconsolidated substrates. Ultimately, the goal of this project is to characterize the recovery trajectories of a wide spectrum of seafloor habitats and communities and to link that recovery to the dynamics of exploited marine fishes.
KEY WORDS
Fishing gear impacts, bottom trawling disturbances, benthic fauna, seafloor microhabitats, habitat recovery, central California continental shelf, National Marine Sanctuaries.

3
TABLE OF CONTENTS
Topic Page EXECUTIVE SUMMARY ............................................................................................................ 1 KEY WORDS ................................................................................................................................. 2 TABLE OF CONTENTS ................................................................................................................ 3 INTRODUCTION .......................................................................................................................... 4 METHODS ..................................................................................................................................... 5
Study area and sampling locations .............................................................................................. 5 ROV Survey of Seafloor Microhabitats and Epifaunal Macro-Invertebrates ............................. 6 Benthic Grab and CTD Survey ................................................................................................... 8
RESULTS AND DISCUSSION ................................................................................................... 10
Water Quality Characteristics ................................................................................................... 10 Sediment Grain Size, TOC, and Depth ..................................................................................... 10 Seafloor Microhabitats .............................................................................................................. 11 Epifaunal Macro-invertebrates.................................................................................................. 11 Benthic Infauna ......................................................................................................................... 13
CONCLUSIONS AND RECOMMENDATIONS ....................................................................... 16 ACKNOWLEDGMENTS ............................................................................................................ 17 REFERENCES ............................................................................................................................. 17 FIGURES and TABLES ............................................................................................................... 21

4
INTRODUCTION
There is no doubt that mobile, bottom-contact fishing gear (such as otter trawls and scallop dredges) alters seafloor communities (Jones 1992, Auster et al. 1996, Jennings and Kaiser 1998, Hall 1999, Auster and Langton 1999, Collie et al. 2000, National Research Council 2002, Barnes and Thomas 2005, Løkkeborg 2005). In fact, fishing has been described as the dominant direct anthropogenic impact to marine ecosystems worldwide (Dayton et al. 1995). Watling and Norse (1998) have suggested that below the effective depth of storm penetration, fishing is the prominent disturbance to the marine environment. Mobile fishing gear reduces seafloor complexity through the removal of attached and emergent fauna that provide structure (e.g., corals and sponges), the removal of other sediment-associated megafauna that produce pits and burrows (e.g., crabs, fish), and the smoothing of bedforms (e.g., sand waves; Lindholm et al. 2004). In addition to the removal of targeted species, such operations can cause a variety of incidental biological impacts to non-targeted benthic organisms including changes in population densities, species diversity, community structure and composition, trophic structure, and productivity (Thrush and Dayton 2002, Hixon and Tissot 2007). The spatial scale and temporal duration of impacts from fishing activity are of particular interest to the National Marine Sanctuaries, where conservation and protection of natural resources are mandated goals. Developing related information to support protective habitat zoning has been identified as a high research priority for a majority of National Marine Sanctuaries along the west coast of the U.S. (Gittings et al. 2002). As part of its recent (2001-2002) management plan review process, the Monterey Bay National Marine Sanctuary (MBNMS), in particular, has emphasized the need for additional research on the potential effects of bottom trawling on benthic habitats and associated living resources. Based on recommendations of a working group addressing this issue, the sanctuary developed an Action Plan with strategies for assessing such impacts and applying related protective measures as necessary (MBNMS 2006). One of the key research strategies recommended in the plan (Strategy BH-5) is to use recent fishing closures on the continental shelf as a basis for monitoring the recovery of disturbed benthic habitats within these areas relative to comparable habitats still being trawled. Results of an earlier 1998 study (Engel and Kvitek 1998) demonstrated impacts of bottom trawling on benthic fauna within MBNMS, yet still very little is known with respect to the extent and length of recovery following the cessation of fishing in such areas. The primary objective of the present study was to evaluate recovery of seafloor microhabitats and associated benthic fauna from trawling-related impacts in National Marine Sanctuaries along the central California continental shelf. This objective is being addressed by comparison of the condition of these resources at previously trawled sites within an Essential Fish Habitat (EFH) ground-fish closure area, located within Cordell Bank National Marine Sanctuary (CBNMS), to actively trawled sites of comparable habitat type (unconsolidated fine sediments at depths of 113-152 m) outside the closure area (Figure 1). The EFH closure area was established in June 2006, though study sites within this area have experienced no trawling since 2003, based on trawl records from the National Marine Fisheries Service (NMFS). Currently trawled sites outside the closure area are within the adjacent Gulf of Farallones National Marine Sanctuary (GFNMS). The results of this study are intended to assist the MBNMS in fulfilling its Benthic

5
Habitat Action Plan and revised 2006 Draft Sanctuary Management Plan requirements, which call for such studies, and to contribute to a related long-term goal aimed at maintaining the natural state of biological communities and ecological processes while promoting the sustainability of local fisheries. Results also will be made available to address related management issues of adjacent CBNMS and GFNMS where the actual sampling sites are located. The study consisted of two components: (1) a remotely operated vehicle (ROV) sampling effort to collect videographic and still photographic data on seafloor microhabitats and epifaunal macro-invertebrates at 10 stations within each of the trawling-effort treatments; and (2) a sediment-grab and CTD companion effort to collect data on condition of benthic macro-infaunal assemblages and other abiotic environmental characteristics of the sediment and water column at corresponding sites. The sampling strategy for both study components includes an initial survey conducted in June-July 2006 and at least one more follow-up field effort (schedule pending) to assess any persistent impacts or recovery trends. The present report provides results of the initial 2006 baseline survey.
METHODS Study area and sampling locations Study sites were selected using data on trawling effort provided by the NMFS. Data were analyzed, first as aggregated effort in 0.25 km2 blocks to determine high trawling activity areas, and then as individual trawl tracks to select a study area with intense bottom trawling effort. Stations were systematically sited within the CBNMS EFH closure in an area that was intensely trawled through 2003, while stations adjacent to the GFNMS EFH closure were similarly sited in an area that continued to be actively trawled through 2005 (the most recent effort data available at the time). Due to the proprietary nature of the information on specific fishing vessels and the location of their activities, we were unable to publish either the aggregated or individual trawl track data. Keeping depth variations to a minimum between the two treatment categories was an important criterion of this study to control for natural depth-related variations in benthic fauna that could otherwise interfere with our ability to evaluate trawling-related impacts. The nearest sites that fit such sampling-design requirements were the above-mentioned EFH closure sites within the neighboring CBNMS and corresponding trawled sites of similar depths and bottom type located outside the EFH within GFNMS (Figure 1). The resulting sampling framework consists of a balanced factorial design to test for differences in microhabitat and biological response variables between the 10 stations within the Cordell Bank EFH closure area (hereafter referred to as “recovering” sites) and the 10 stations located in GFNMS at actively trawled sites outside the closure area (hereafter referred to as “trawled” sites). Comparisons of response variables between recovering and trawled sites provided a basis

6
for evaluating the extent of recovery from any trawling impacts within the EFH conservation area since the decline of trawling in 2003 and subsequent 2006 closure. ROV Survey of Seafloor Microhabitats and Epifaunal Macro-Invertebrates Still Photographic and Videographic Data Acquisition The ROV survey was conducted at 20 stations, 10 each in the recovering and trawled areas, on Leg 3 of NOAA Ship McArthur II Cruise AR06-08, June 22-27, 2006. A single combined video and still photographic transect was conducted at each station (Figure 2) using the X2 ROV (operated by Deep Ocean Exploration and Research, Alameda, CA; Figure 3). The ROV was configured with two video cameras (forward and down-looking), a down-looking digital still camera, and two down-looking lasers for image calibration and estimating height off the bottom. Quartz halogen HMI lights provided illumination for the video and lighting for still photographs. The ROV was flown at an altitude of approximately 0.5 m above the seafloor. Each transect consisted of 20 min of continuous video and 20 digital-still photographs recorded on DVD. Still photographs were taken at approximately 1-min intervals throughout each transect. Seafloor Microhabitats Seafloor microhabitats were defined as features of the seafloor that occur at the scale at which individual fish associate, including physical substrata (such as boulders and sand waves), biogenic structure (such as erect sponges or anemones), and structures of biogenic origin (such as depressions and mounds formed by mobile fishes and invertebrates). Digital-still photographs were used to assess the relative abundance of ‘common’ microhabitat types. Additional photographs were taken to document habitat features and organisms and were not used for quantitative analyses. Down-looking video was quantified for computing the relative abundance of ‘rare’ habitat types. Note that the term rare is used in the numerical sense based on under-representation in the photographs rather than in a population context. Paired parallel lasers (20-cm spacing) were used to indicate a consistent height for taking still photographs (to maintain constancy in area of coverage for each image) and for maintaining altitude for video transects. Still photographs were taken from a camera height of approximately 0.75 m off the seafloor and covered an area of approximately 0.42 m2. Data on the percent relative abundance of 15 common microhabitats were derived from images using a classification system based on abiotic and biotic seafloor features that fishes have been shown to use for cover (Auster 1998, Lindholm et al. 2004). Data were produced from the still photographs using a series of 50 randomly distributed dots overlaid on each photograph (Figure 4). The microhabitat feature under each dot was counted and apportioned to a particular microhabitat type. New random patterns were used for each photograph from each transect. The percent relative abundance of a given microhabitat was calculated as the number of each habitat type divided by the total number of occurrences for all microhabitats for that transect. Imagery from the down-looking video camera was used to characterize the relative abundance of rare microhabitats (i.e. biogenic depressions and biogenic mounds). These two microhabitat types were not well represented by the still photographs and were subsequently removed from

7
those analyses. However, both depressions and mounds were obviously present from qualitative viewing of the video. Each video transect was treated as a series of non-overlapping video frames (Auster et al. 1991, Lindholm et al. 2004). The size of a down-looking video frame at a height of 0.75 m from the seafloor was 0.48 m2. The relative abundances for depressions and mounds were calculated based on the number of video frames in which the microhabitat type occurred divided by the transect distance in meters (i.e., frames m–1). The paired 20-cm lasers were used to distinguish two size classes for each microhabitat: 10 – 20 cm and 21+ cm. Each measurement was based on the maximum width of a depression or mound that was discernable from the video. No effort was made to quantify either depressions or mounds < 10 cm in width, nor was any effort made to quantify the depth of depressions or the height of mounds. Epifaunal Macro-Invertebrates Digital-still photographs were also used to assess the relative abundance, diversity, and species richness of epifaunal, macro-invertebrate species. Analyses were conducted using individual transects as replicate sampling units. Counts of all individuals distinguishable to major taxa, and identified to lowest possible taxonomic level, were made by overlaying each image with a 10-cm grid (Figure 5). Total counts for each species were made at least twice and, if the two counts differed, a third count was made. If two counts were in agreement, that number was recorded. If counts differed after three attempts, the photo was reevaluated at a later date until two of three counts were in agreement. Individual photos were eliminated if greater than 20% of the photo was obscured by sediment disturbance from the ROV or focus was too poor to identify taxa present. Multiple measures were used to compare trawled and recovering sites to test for differences between epifaunal communities. Species richness (S) was calculated as the total number of species per transect for each site. Means were compared using a t-test assuming either equal or unequal variance, as appropriate after initial estimates of variance were calculated. T-tests were used to evaluate the null hypothesis that there was no difference in abundance, species richness, or diversity between trawled and recovering sites using transects as replicates. The Shannon-Weaver index (H’) was used to calculate diversity (Pielou 1966, Krebs 1999). This index incorporates both numbers of species and their proportional abundance as an estimate of diversity:
H′ = ∑-pi * ln(pi) where i = 1-S and i represents the ith species of a total of S species; pi is the fraction of total individuals made up of species i. Means were compared using a t-test assuming equal or unequal variance after initial estimates of variance were calculated. A series of analysis of covariance (ANCOVA) and non-parametric analysis of similarity (ANOSIM; Clarke 1993) tests were conducted to determine if there were significant differences in species richness, diversity, and abundance between sites and whether depth differences between sites significantly influenced the response variables. Both non-parametric and

8
parametric tests were used because species distributions were unknown. In addition, for the less frequently observed taxa, residuals from ANCOVAs did not appear to be normally distributed due to a high number of zero counts. To assess whether residuals were normally distributed, histograms of fitted model residuals were plotted and diagnostic graphs including normal quantile/quantile (Q-Q) plots were examined in the statistical program R (Dalgaard 2002). Percent frequency of occurrence was calculated for each species in both trawled and recovering sites by dividing the number of transects at each site within which the species occurred by the total number of transects represented in each area. Percent frequency of occurrence within photos was calculated for each species by dividing the number of photos within which the species occurred by the total number of photos. Community comparison of species composition and relative abundance between trawled and recovering sites were measured using the Percent Similarity Index (PSI; Wolda 1981, Krebs 1999). PSI was calculated using the following formula: S
PSI = ∑ minimum (p1i, p2i) x 100 1
where p1i = percentage of species i in community sample 1 and p2i = percentage of species i in community sample 2 and for each species represented i represents the ith species of a total of S species (Krebs 1999). The zero-adjusted Bray-Curtis measure of dissimilarity (D; Bray and Curtis 1957, Clarke et al. 2006; 0 = similar, 1 = dissimilar) was also used to evaluate area resemblance in community composition:
( )∑∑
++
−=−
XikXijXikXij
D CadjBjk 2
||*100
where Xij and Xik = number of individuals in species i in each area j or k (Krebs 1999). The zero-adjustment was used to moderate the erratic behavior of Bray-Curtis for near-denuded samples. As one of the sites was a fishery closure area and the other continues to be trawled using mobile bottom fishing gear, and both contained few species, this adjustment was considered appropriate. Benthic Grab and CTD Survey The sediment-grab and CTD sampling was conducted on the companion Leg 5 of NOAA Ship McArthur II Cruise AR06-08, July 2-5, 2006. Mapped locations and coordinates of the sampling stations are identified in Figure 1 and Table 1, respectively. The stations were located as the centroids of the 20 ROV transects completed during the previous Leg 3 of Cruise AR06-08 (Figure 2). Sediment grab samples for the analysis of macro-infaunal assemblages were collected in duplicate at each of the 20 stations (10 recovering and 10 trawled) using a Van Veen bottom grab (0.1 m2). Sediment samples were live-sieved in the field through a 1.0-mm mesh screen and preserved in 10%-buffered formalin with rose bengal. As part of the QA/QC procedures,

9
samples that showed significant slumping or loss of material through the jaws of the grab (e.g., samples with a sediment layer < 5 cm) were rejected. All samples were appropriately labeled with pertinent information on the project, station/replicate ID, and sample type. Also, prior to sampling at a station, all sampling equipment was washed with in-situ seawater to minimize contamination with sediment from prior stations. All infaunal samples were transferred to 70% ethanol after returning to the laboratory, where animals were sorted from sample debris under a microscope and identified to the lowest practical taxon (usually to species). Resulting data were entered into an electronic database as numbers of individuals by species and sample. The upper 3-5 cm of sediment from an additional 1-2 grabs also was taken at each station, combined into a single station composite, and then sub-sampled for analysis of total organic carbon (TOC) content and grain-size distribution. As part of this process, the surface layer of sediment was removed from the grab with a scoop, placed in a bowl, and mixed. A TOC sub-sample was then removed from the homogenized sample and placed in a 125-mL plastic jar with lid and stored frozen. An additional sub-sample for grain-size analysis was removed from the homogenate and placed in a 500-mL plastic jar with lid and stored frozen. TOC and grain-size samples were processed using protocols modified from Plumb (1981). TOC content of sediment was measured on a carbon:hydrogen:nitrogen (CHN) elemental analyzer at 950 °C combustion temperature. A CTD unit (Sea-Bird SEACAT, SBE 19 plus), equipped with additional dissolved oxygen (DO) and pH sensors, was used to acquire vertical profiles of conductivity/salinity, temperature, pressure, DO, and pH at six of the 20 stations, including three in the recovering area and three in the trawled area (Table 3). A variety of data-analysis methods were used to characterize benthic communities and examine patterns in relation to other measured environmental variables and potential trawling-related impacts. Spatial patterns in the distributions of benthic communities, including differences between the two trawling categories, were examined using normal (Q mode) cluster analysis (Boesch 1977). Group-average sorting (= unweighted pair-group method, Sneath and Sokal 1973) was used as the clustering method and Bray-Curtis similarity (Bray and Curtis 1957) was used as the resemblance measure. Analyses were run on double-square-root transformed abundances using the PRIMER software package (Clarke and Gorley 2001). Results were expressed as a dendrogram in which samples were ordered into groups of increasingly greater similarity based on resemblances of component-species abundances. Spatial patterns in community structure also were examined using non-metric multidimensional scaling ordination (MDS) (Kruskal and Wish 1978) on the Bray-Curtis similarity matrix of double-square-root transformed species abundance data. The latter analysis also was performed with the PRIMER software package. Student t-tests were performed in conjunction with the above analyses to examine statistical differences in benthic and abiotic environmental variables among resulting site groups. Benthic variables included number of species, H′ diversity derived with base-2 logarithms (Shannon and Weaver 1949), the associated evenness component J′ (Pielou 1966), density (m-2) of total fauna (all species combined), density (m-2) of major taxonomic groups, and density (m-2) of

10
numerically dominant fauna. All t-tests and supporting statistical analyses (e.g., tests for homogeneity of variances, normality, etc.) were based on procedures in SAS (2004).
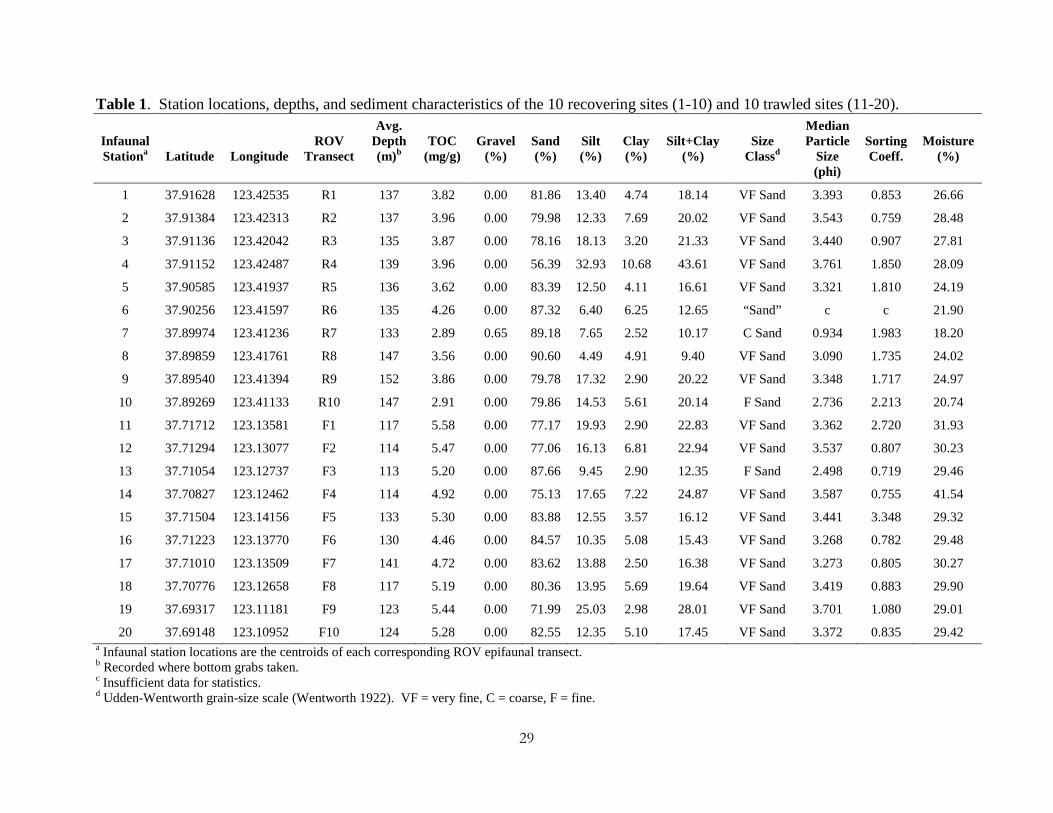
RESULTS AND DISCUSSION Water Quality Characteristics Water-quality characteristics (Table 2) were typical of offshore oceanographic conditions for the area and time of year, with near-bottom temperature, salinity, DO, and pH ranging from 8.71-9.22 °C, 33.90-34.05 psu, 9.26-9.35 mg/L, and 7.61-7.73 respectively among the various stations. There were slight differences between near-bottom and near-surface conditions, with near-bottom water having lower temperature (mean of 8.91 °C on bottom vs. 11.59 °C at surface), higher salinity (mean of 33.99 psu on bottom vs. 33.43 at surface), higher DO (mean of 9.32 mg/L on bottom vs. 8.81 mg/L at surface), and lower pH (mean of 7.67 on bottom vs. 8.08 at surface). There were no apparent differences between recovering stations in CBNMS vs. trawled stations in GFNMS. Sediment Grain Size, TOC, and Depth The seafloor throughout the study area consisted of coarse to very fine sands with median particle size ranging from 0.934 to 3.761 phi on the Udden-Wentworth scale (Wentworth 1922) and with moderate amounts of silt-clay (10.2 to 43.6% and < 30% at all but one site) (Table 1). Sediments (also referred to as “sands” hereafter) were moderately to very poorly sorted, with sorting coefficients ranging from 0.719 to 3.348 phi. There were no obvious differences in these parameters between stations in the recovering vs. trawled areas (Table 3). The TOC content of sediment averaged 3.7 mg/g at the 10 recovering stations and 5.2 mg/g at the 10 trawled stations (Table 3). The difference, statistically significant at P < 0.001, may be a signal of trawling-related physical disruption of the seafloor. For example, elevated levels of TOC in surficial sediments could result from the transport of organic matter buried in the sediment to the surface due to physical mixing by contact with the trawl gear (Stone and Masuda 2003). However, note that the TOC values for both areas are still at relatively low levels well below a reported range (> 35 mg/g) associated with high risks of impaired benthic condition (e.g., reduced species diversity and abundance) from organic over-enrichment (Hyland et al. 2005). Station depths ranged from 113 to 152 m overall (Table 1) and averaged 140 m at the 10 recovering sites and 130 m at the 10 trawled sites (Table 3). The statistically significant difference between the two groups (P < 0.001) is a result of the relatively tight within-group variances and is not likely to be of major biological significance given their common offshore outer-shelf locations (Figure 1) within a relatively small depth range (see further infaunal discussion below).

11
Seafloor Microhabitats Analysis of common microhabitats from still photographs (Table 4) indicated that both trawled and recovering sites were dominated by unconsolidated sands (with a noticeable fine fraction) with mean percent relative abundance of 99.66% and 100%, respectively. Cobble habitat occurred in one transect within the actively trawled site but none was observed at the recovering site. Small proportions of the sandy substrate also contained attached and mobile epifauna or biogenic debris. Five of the ten transects (transect #’s 1-4 and 8 in Figure 2B) conducted at the actively trawled area adjacent to the GFNMS contained living sea whips Halipteris cf. willemoesi (identified initially by Scott McEuen, Pacific Marine Taxonomy, and confirmed by Gary Williams, California Academy of Sciences). While little is known about these organisms, they are considered to be sensitive to some mobile fishing gear (Troffe et al. 2005, Brodeur 2001, Wilson et al. 2002) especially due to their exposed structure extending vertically above the seafloor. As such, we interpreted the presence of these organisms at the above five transects as an indication that these particular locations (all positioned in close proximity of one another and inshore of the remaining five) may not have been actively trawled in the recent past. ANCOVA results identified significant differences between trawled and recovering sites for all habitat categories except featureless sands (Table 5). Depth was a significant influence in featureless sand, sand with sessile epifauna, and sand with mobile fauna. The interaction between site and depth was significant for only the sand with sessile epifaunal category of microhabitats. Analysis of rare microhabitats from video data (Table 6) indicated that significant differences were present between trawled and recovering areas in all categories except small (10-20 cm) depressions. Both small (10-21 cm) and large (>21 cm) biogenic mounds and large (>21 cm) depressions were significantly more abundant at the recovering area than at the trawled area (p<0.05). Epifaunal Macro-invertebrates Differences between trawled and recovering sites were minor but distinct. A total of eight epifaunal taxa were observed at both sites combined. Two taxa occurred in both areas, decapod crustaceans (crabs) and polychaetes (fanworms), though different crab species were found at the two sites. A Brachyuran crab, Cancer sp., was observed at the recovering site and an Anomuran crab, possibly Lopholithodes sp., was observed. at the recovering site. Trawled transects were populated by Pannatulaceans (sea whips) and gastropods whereas transects within the recovering site were consistently populated by ophiuroids (brittle stars; Table 8). Tentative species identifications (without specimen collection) were based on literature and field guides and internet sources (Smith and Carleton 1975, Gotshall 1994, Kozloff 1996, Lambert 2007). The dominant taxa within trawled transect photos was a sea whip, identified by a recovered specimen as Halipteris cf. willemoesi (Octocorallia: Pannatulacea).

12
Trawled-transect photo analyses included 195 photos from ten transects. Twenty photos were eliminated due to either poor focus (9) or mud cloud obscurity (11) of at least 20% of the photo. A total of only 189 individuals from six taxa were identified, the dominant organism was the sea whip Halipteris cf. willemoesi. In addition, three distinct species of gastropod were recorded, the most common a Conus species. In addition, one moon snail (unknown species) and two cowries (possibly Cypraea spadicea, the chestnut cowrie known to occur in the area) were observed. Fanworms were observed in the photos from both sites but were likely underrepresented due to retraction. Data collected from the ten recovering site transects included a total of 182 photos. Thirteen photos were eliminated due to either poor focus (12) or mud cloud obscurity (1) of at least 20% of the photo leaving 169 photos for analyses. Three macro-invertebrate taxa, totaling 3220 individuals, were identified. Recovering transects were dominated by patchily distributed ophiuroids, evidenced by single brittle star arms (n = 3190) emerging from the sediment, unidentifiable to species level. Invertebrates other than ophiuroids were sparsely distributed and occurred in very low numbers in all of the recovering-area transect photos. Macrofaunal species richness was very low for both actively trawled and recovering sites. The trawled site contained only six distinct species and the recovering site only three. Differences between the two areas were not significant at the level of transects (Table 9). Diversity was low in both actively trawled and recovering sites (Table 9). Differences in mean diversity between the two sites were significant (n = 10, p = 0.0095). Dominant taxa differed between the two areas and overall numbers were significantly lower at the trawled site. Abundance was relatively high at the recovering site, due to the presence of patchily distributed ophiuroids. Differences in mean number of individuals were highly significant at the scale of transects (n = 10, p = 0.0012). The two sites were statistically different using both parametric and non-parametric tests for abundance (F = 16.475, p = 0.0009, n = 10) and species diversity (F = 8.539, p = 0.014) and the depth influence was significant as well (F = 5.484, p = 0.0325, n = 10). Differences were not significant between sites for species richness (F = 3.2615, p = 0.0898, n = 10). ANOSIM tests confirmed the findings of the ANCOVAs. Overlap in epifaunal macroinvertebrate species composition between actively trawled and recovering sites was low. Two taxa were present at both sites, decapod crustaceans of different species and Sabellid fanworms, probably multiple species. Percent similarity between sites was low (S = 0.96). Dissimilarity between sites was very high (zero-adjusted Bray-Curtis dissimilarity D = 98.89). The two crab species that were observed each occurred in a single photo, an anomuran crab in a photo from the actively trawled site and a cancer crab in a photo from the recovering site (Tables 8 and 10), though both were more numerous in complete video footage. The most commonly occurring species was the ophiuroid, which occurred in 100% of the recovering site transects and 96.5% of photos. Ophiuroids were not observed in any photos within the actively trawled area. Fanworms were the only species observed at both sites and occurred in nearly all transects, 50% of trawled and 90% of recovering, but infrequently. They were captured in 8.57% of photos from the trawled site and 14.2% of photos from the recovering site. Sea whips and gastropods

13
were not observed in any photos from the recovering transects, but occurred in 39.43% and11.42% of photos from the trawled site respectively. Benthic Infauna Results of multivariate cluster analysis of benthic infaunal data from the 10 recovering stations at CBNMS and 10 trawled stations at GFNMS are presented as a dendrogram in Figure 6. Each station is represented by two combined replicate samples. There is a distinct separation of recovering vs. trawled sites (at Bray-Curtis dissimilarity level of 0.36). A two-dimensional plot of the MDS results (Figure 7) shows a consistent pattern based on individual replicate samples. Contour lines drawn around samples having similar benthic composition at a Bray-Curtis dissimilarity level< 0.48 yield the same two recovering vs. trawled site groups. To explore whether the previously mentioned depth-related variation between the two trawling-status categories (Section on grain size, TOC, and depth) may have influenced this site-group separation, an additional cluster analysis was performed on a subset of the data from individual samples at Stations 1-7 in the recovering area (depths of 133-139 m) and Stations 15-17 at corresponding depths in the trawled area (130-141 m). Results (Figure 8) show that the same pattern is maintained, with a clear separation of the trawled and recovering areas, even after removing any potential depth-related influence from the analysis. Thus, the pattern that emerged from the full cluster analysis (all stations included) is not likely to be the result of a major depth-related break in benthic community structure and composition, particularly within such common outer-shelf locations and the relatively small depth range overall (average of 140 m for the 10 recovering stations and 123 m for the 10 trawled stations). The small difference in average depths between the two trawling-status groups (only 17 m) was detectable statistically because of tight within-group variances. Hyland et al. (1991) reported depth-related patterns in the structure and composition of benthic macroinfaunal assemblages along the Santa Maria Basin portion of the California outer continental shelf and slope; however they found little variation in these assemblages within a depth range of 145-161 m, a comparable difference of 16 m, compared to deeper stations with depths > 200 m. Species richness, diversity, and abundances declined precipitously at mid-slope (409-410 m) and sea valley (595 m) stations compared to stations shallower than 200 m. There were no major differences in measures of species richness, H′ diversity, or J′ evenness between trawled vs. recovering site groups (Table 11). Type 1 error probabilities from t-tests of the significance of mean differences in these variables between the two site groups (n1 = n2 = 10) were all in a range of p > 0.1. However, total faunal abundance showed a significant difference at the 10% level (p = 0.065) attributable to much lower densities at trawled sites. This pattern was driven largely by the small oweniid polychaete Myriochele gracilis, which was the most abundant species in the overall study region though significantly less abundant (p = 0.010) at trawled sites (Table 11). Polychaeta as a group also had significantly lower abundances (p = 0.045) at trawled sites, due similarly to the influence of M. gracilis (Table 11). In fact, when M. gracilis are removed from the analysis, the pattern shifts to significantly higher abundances at trawled sites for all fauna combined and polychaeta as a group.

14
Two other major taxonomic groups, mollusca and non-pennatulacean anthozoans (i.e., ceriantharians and sea anemones), displayed an opposite pattern with significantly higher abundances at trawled sites (p ≤ 0.001, Table 11). Pennatulacean anthozoans (sea whips), though slightly more abundant at trawled sites, were not significantly different between the two treatment groups (p = 0.220). Crustacea and two of the three echinoderm classes — Echinoidea (sea urchins) and Holothuroidea (sea cucumbers) — also did not reveal any discernable differences between the recovering and trawled areas (at p < 0.1). It has been predicted that densities of longer-lived and lesser-mobile animals such as bivalves, echinoids, and anemones should decrease following trawling disturbances, while faster-growing, regenerative, and more mobile groups such as polychaetes, crustaceans, and ophiurids should increase (see discussion by Hansson et al. 2000 with relevant citations therein). Our results are consistent with the evolving, alternative realization that patterns of biological response to trawling effects may vary in complex ways among different types of organisms (Hansson et al. 2000, Currie and Parry 1996, Tuck et al. 1998). Table 12 provides a comparison of the densities of major individual taxa (i.e., each representing > 1% of total faunal abundance) between the recovering and trawled areas. Cumulatively these taxa accounted for 75% of the abundances of all fauna combined. The two oweniid polychaetes, Myriochele gracilis and M. olgae, and the polychaete family Terebellidae all had significantly lower densities (p = 0.004 to 0.01, n1 = n2 = 10) at trawled sites. Similar response patterns for related taxa have been observed in other studies as well. For example, Hansson et al. (2000) observed a 43% decrease in abundances of Myriochele oculata at trawled sites, compared to a 127% increase at control sites, following an experimental shrimp-trawling disturbance in Gullmarsfjorden, Sweden. In this same study, terebellid polychates decreased at trawled sites by an average of 62% in comparison to only 28% at control sites (Hansson et al. 2000). Although these authors caution that such differences cannot be unambiguously attributed to trawling, the directions of the patterns are suggestive of at least partial trawling influences that are consistent with the present study. Similarly, the abundance patterns of M. gracilis and M. olgae in the present study are consistent with the results of Flåten et al. (2007) who found highest abundances of a related oweniid polychaete, Owenia fusiformis, at reference sites furthest from an oilfield in the North Sea. The authors also noted that this species is not known to have strong opportunistic properties. Terrebellids and many oweniids including Myriochele are tubicolous, sessile to relatively sessile, polychaetes that probably do not move around to any great extent (Fauchald and Jumars 1979). Thus these animals may not be able to recover readily from physically disturbed sediment. In contrast to the above patterns, the thyasirid bivalve Axinopsida serricata and the polychaetes Spiophanes spp. (97% of which were S. duplex and the remaining 3% S. bombyx), Prionospio spp., and Scoloplos armiger all had significantly to near-significantly higher abundances (p < 0.001 to 0.080, n1 = n2 = 10) at trawled sites (Table 12). Similarly, Hansson et al. (2000) observed a proportionally higher increase in abundances of thyasirid bivalves at trawled sites (average of 239%) following an experimental disturbance by shrimp trawling than at control sites (average of 137%). Axinopsida serricata also has been reported in high abundance in organically enriched areas of Puget Sound, WA (Nichols 2002, Armstrong et al. 1980) and as an abundant member of altered benthic assemblages in organically enriched areas of Santa Monica Bay, CA (Bergen et al. 2000). Other members of the family Thyasiridae (e.g., Thyasira flexuosa,

15
T. sarsi), as well as the polychaete Scoloplos armiger and several members of the polychaete genus Prionospio, are well known initial to second-stage colonizers in polluted sediments (Pearson and Rosenberg 1978). The polychaete Spiophanes duplex is a common dominant in outer-shelf habitats off the California coast, e.g. as reported by Bergen et al. (2001) at depths of 115-200 m in the Southern California Bight. However, we are not aware of studies that suggest an affinity of this species for disturbed substrates. There also was a significant difference in the dominance structure of infaunal assemblages from the two areas (Table 13). The highest ranked (most abundant) dominant in the recovering area was the polychaete Myriochele gracilis. This species did not appear as a dominant (i.e., among the five most abundant species) in the trawled area, though it was present there at much lower densities. In comparison, the bivalve Axinopsida serricata, while not ranked as a dominant in the recovering area, appeared as the second most dominant species in the trawled area. Spiophanes (mostly S. duplex) was dominant in both areas. Kendall’s concordance test (Kendall 1975) showed no significant concordance (at P < 0.01) in the ranking of these dominants between the two areas (coefficient of concordance W = 0.4225, Χ2 = 5.63, 7 df), thus revealing a significant difference in the dominance hierarchy of these assemblages. The above results, based on both multivariate and univariate techniques, revealed a clear difference between benthic infaunal communities in the recovering vs. trawled areas due to differences in the relative abundances of component species. An important question is whether such differences are attributable to a trawling effect or whether the benthic fauna of the two areas have always been different due to other natural environmental factors. The two areas are in similar oceanographic regimes with common outer-shelf locations off the central California coast (only about 35 km apart) and with similar ranges in other measured environmental variables (salinity, DO, temperature, pH, sediment grain size). There was a small, yet statistically significant, difference in the average TOC content of sediments between the two areas (recovering sites: 3.7 mg/g, trawled sites: 5.2 mg/g; Table 3). While these values are well below a TOC range (>35 mg/g) associated with impaired benthic condition (Hyland et al. 2005), the slightly higher levels of TOC in the fished area could be a sign of recent trawling interactions with the seafloor which in turn may have caused physical disruption of benthic communities. Stone and Masuda (2003) similarly found higher levels of TOC in trawled area than in closed areas in the Gulf of Alaska, and attributed the result to the transport of TOC from within the sediments to the surface due to physical mixing by contact with the trawl gear. There also was a small, yet statistically significant, difference in the average sampling depth between our two study areas (closed: 140 m, trawled: 123 m; Table 3), but this variation is minor relative to the generally deep, outer-shelf locations and appeared to have little influence on the separation of recovering vs. trawled site groups in the numerical classification (cluster) analysis of infaunal abundance. Given these points, it is suggested that the observed biological patterns are the result of trawling impacts and varying levels of recovery due to the difference in trawling status between the two areas. The EFH closure was established in June 2006, within a month of when sampling was conducted for the present study, however the stations within this closure area are at sites that actually have experienced little trawling since 2003, based on NMFS trawl records. Thus, the three-year period would be sufficient time for some post-trawling changes to have occurred. The
16
significantly higher densities of suspected stress-sensitive species (e.g., the owenid polychaetes, Myriochele gracilis and M. oglae, and the polychaete family Terebellidae) and lower densities of suspected or known stress-tolerant species (e.g., the bivalve Axinopsida serricata and the polychaetes Prionospio spp. and Scoloplos armiger) in the closure area at CBNMS seem to suggest that recovery is occurring. Other measures also indicate that recovery within the closure area is not yet complete. Both areas had similar, moderate numbers of infaunal species (mean of 62 species/0.1m2 at recovering sites and 65 species/0.1m2 at trawled sites) that are lower than values recorded elsewhere in comparable habitats along the California continental shelf. For example, Bergen et al. (2001) reported an overall mean of 87 species/0.1 m2 (1.0 mm sieve size) at comparable sandy, outer-shelf sites (115-200 m) throughout the Southern California Bight. Hyland et al. (1991) also reported means of 85-123 species/0.1m2 at depths of 145-161 m in the Santa Maria Basin, off the central California coast between Pt. Arguello and Pt. San Luis (though these samples were processed on finer-mesh 0.5 mm sieves). Data from a recent survey of ecological conditions in coastal-ocean waters along the western U.S. continental shelf (from Straits of Juan de Fuca, WA to Channel Islands, CA), as part of the U.S. Environmental Protection Agency’s National Coastal Assessment Program, show an average of 83.7 species/0.1 m2 (1.0 mm sieve size) at comparable depths (102-123 m) in the central to northern California portion of the study area (unpublished data, U.S. Environmental Protection Agency, Newport OR). Tuck et al. (1998) showed that physical effects of an experimental trawling disturbance on seabed topography were almost indistinguishable by 18 months of recovery, although there were clear longer-term effects on infaunal communities that persisted beyond that time and the life of the study. Lindholm et al. (2004) also demonstrated measurable differences in microhabitat resources between trawled and non-trawled sites on Georges Bank after 4.5 years of closure.
CONCLUSIONS AND RECOMMENDATIONS Our results indicate that significant differences existed between an actively trawled area and an area that had been recovering from trawling impacts for three years at the time of sampling. These differences were manifest in the micro-topographic structure that fish utilize for protection from predation and as refugia from currents, as well as in invertebrate epifaunal and infaunal communities. Each of the differences is consistent with the literature dealing with gear impacts to seafloor communities (Jones 1992, Auster et al. 1996, Jennings and Kaiser 1998, Hall 1999, Auster and Langton 1999, Collie et al. 2000, National Research Council 2002, Barnes and Thomas 2005, Løkkeborg 2005). However, this first year of sampling was intended as a point of departure for a multi-year study rather than an end in itself. Additional sampling is needed to evaluate subsequent recovery trends and persistence of effects over time and to further investigate any differences between our experimental treatments that may be due to factors other than trawling activity. Furthermore, to date, the study has been limited to unconsolidated substrates. Ultimately, a goal of this type of project would be to characterize the recovery trajectories of a wide spectrum of seafloor habitats, and to link that recovery to the dynamics of exploited marine fishes.

17
A final important recommendation based on our efforts to date relates to the need for better control areas in the field in which studies like this one can be conducted (see similar discussion in Engel and Kvitek 1998). From our earliest efforts at designing this experiment through our analysis of the first year’s data, we were forced to adjust repeatedly to variables that were beyond our experimental control due to the lack of a well-designed research closure. The importance of understanding the impacts of mobile fishing gear to seafloor communities is increasingly clear to managers and policy-makers alike. A network of well-designed research closures, which encompass a variety of seafloor substrata and biological communities, will allow for a robust, statistically sound quantification of seafloor recovery from impacts due to fishing with mobile gear. Ultimately, such data will allow for the zoning of the seafloor analogous to existing zoning efforts on land in the interest of all those who manage and/or utilize marine resources.
ACKNOWLEDGMENTS This work was conducted through a partnership agreement between NOAA’s Office of National Marine Sanctuaries (ONMS) and National Centers for Coastal Ocean Science (NCCOS) and supported largely by FY06 Ocean Assessment Program (OAP) funds directed to NCCOS. Additional funding support was provided through the MBNMS’s “Sanctuary Integrated Monitoring Network (SIMoN)” program. Special recognition is extended to Marine Taxonomic Services (Corvallis, OR) for the analysis of macroinfaunal samples and to Barry Vittor and Associates (Mobile, AL) for TOC and grain size analyses. Field operations were supported by the NOAA Ship McArthur II (Cruise AR06-08: Legs 3 and 5) and the Ocean Explorer X2 ROV (owned and operated by Deep Ocean Exploration and Research, Alameda CA). We also wish to thank the following members of the scientific sampling teams for their invaluable field support: JD Dubick (NCCOS), Erica Burton (MBNMS), Lorraine Anglin (MBNMS), Ashley Knight (Pfleger Institute of Environmental Research), Bob Lea (Natural History Museum of Los Angeles County), Lisa Uttal (Moss Landing Marine Laboratories), Dan Howard (CBNMS), and Tom Laidig (NMFS, Santa Cruz). We are grateful for the valuable comments of three dedicated anonymous reviewers.
REFERENCES Armstrong, J. W., R. M. Thom, and K. K. Chew. 1980. Impact of a combined sewer overflow on
the abundance, distribution and community structure of subtidal benthos. Mar. Envir. Res., 4: 3–23.
Auster, P.J. 1998. A conceptual model of the impacts of fishing gear on the integrity of fish habitats. Cons. Biol. 12(6):1198-1203.
Auster, P.J., R.J. Malatesta, S.C. LaRosa, R.A. Cooper, and L.L. Stewart. 1991. Microhabitat utilization by the megafaunal assemblage at a low relief outer continental shelf site – Middle Atlantic Bight, USA. J. Northwest Atl Fish Sci 11:59-69.

18
Auster, P.J. and R.W. Langton. 1999. The effects of fishing on fish habitat. In: Benaka, L., ed. Fish habitat: essential fish habitat and rehabilitation. Am. Fish. Soc. Symp. 22:150-187.
Auster, P.J., R.J. Malatesta, R.W. Langton, L. Watling, P.C. Valentine, C.L.S. Donaldson, E.W. Langton, A.N. Shepard, and I.G. Babb. 1996. The impacts of mobile fishing gear on seafloor habitats in the Gulf of Maine (Northwest Atlantic): implications for conservation of fish populations. Rev. Fish. Sci. 4:185-202.
Barnes, P.W. and J.P. Thomas (eds.). 2005. Benthic habitats and the effects of fishing. Proceedings of “Symposium on Effects of Fishing Activities on Benthic Habitats: Linking Geology, Biology, Socioeconomics, and Management,” November 12-14, 2002, Tampa, FL. American Fisheries Society Symposium 41, Bethesda, MD, 890 p.
Bergen, M., D. Cadien, A. Dalkey, D.E. Montagne, R.W. Smith, J.K. Stuhl, R.G. Velarde, and S.B. Weisberg. 2000. Assessment of benthic infaunal condition on the mainland shelf of southern California. Environ. Monitor. & Assess., 64: 421-434.
Bergen, M., S.B. Weisberg, R.W. Smith, D.B. Cadien, A. Dalkey, D.E. Montagne, J.K. Stuhl, R.G. Velarde, and J.A. Ranasinghe. 2001. Relationship between deoth, sediment. Latitude, and the structure of benthic infaunal assemblages on the mainland shelf of southern California. Mar. Biol., 138: 637-647.
Boesch, D.F. 1977. Application of numerical classification in ecological investigations of water pollution. U.S. Environmental Protection Agency, Grant No. R803599-01-1, ROAP/TASK No. 21 BEI, Corvallis Environmental Research Laboratory, Newport, Oregon, 115 p.
Bray, J.R. and J.T. Curtis. 1957. An ordination of the upland forest communities of southern Wisconsin. Ecol. Monogr. 27, 320-349.
Brodeur, R.D. 2001. Habitat-specific distribution of Pacific Ocean perch (Sebastes alutus) in Pribilof Canyon, Bering Sea. Contin. Shelf Res., 21: 207-224.
Clarke, K. R. 1993. Non-parametric multivariate analysis of changes in community structure. Australian Journal of Ecology 18:117-143.
Clarke, K.R., Gorley, R.N., 2001. PRIMER v5: User Manual/Tutorial. PRIMER-E Ltd, Plymouth England.
Clarke, K.R., P.J. Somerfield, and M.G. Chapman. 2006. On resemblance measures for ecological studies, including taxonomic dissimilarities and a zer0-adjusted Bray-Curtis coefficient for denuded assemblages. J. Exp. Mar. Biol. Ecol. 330:55-80.
Collie, J.S., S.J. Hall, M.J. Kaiser, and I.R. Poiners. 2000. A quantitative analysis of fishing impacts on shelf-sea benthos. J. Anim. Ecol. 69:785-798.
Currie, D.R. and G.D. Parry. 1996. Effects of scallop dredging on a soft sediment community: A large scale experimental study. Mar. Ecol. Prog. Ser., 134: 131-150.
Dalgaard, P. 2002. Introductory statistics with R. Springer Science+Business Media, Inc. New York, NY. 267 p.
Dayton, P.K., S.F. Thrush, T.M. Agardy, and R.J. Hofman. 1995. Environmental effects of fishing. Aquat Conserv, 5: 205-232.
Engel, J. and R. Kvitek. 1998. Effects of otter trawling on a benthic community in Monterey Bay National Marine Sanctuary. Conserv. Biol., 12(6): 1204-1214.
Fauchald, K. and P.A. Jumars. 1979. The diet of worms: A study of polchaete feeding guilds. Oceanogr. Mar. Biol. Ann. Rev., 17: 193-284.
Flåten, G.R., H. Botnen, B. Grung, and O.M. Kvalheim. 2007. Quantifying disturbances in benthic communities – comparison of the community disturbance index (CDI) to other multivariate methods. Ecol. Indicators, 7(2): 254-276.

19
Gittings, S.R., K.E. Benson, P.J. Souik, and M.S. Tartt. 2002. Sanctuary Science: evaluation of status and information needs. NOAA/NOS, Silver Spring, MD.
Gotshall, D.W. 1994. Guide to marine invertebrates, Alaska to Baja California. Sea Challengers, Monterey, Santa Rosa, CA.
Greene, H.G., M.M. Yoklavich, R.M. Starr, V.M. O’Connell, W.W. Wakefield, D.E. Sullivan, J.E. McRea, Jr., G.M. Cailliet. 1999. A classification scheme for deep seafloor habitats. Oceanologica Acta. 22(6):663.
Hall, S.J. 1999. The effects of fishing on marine ecosystems and communities. Blackwell Science, Oxford.
Hansson, M., M. Lindegarth, D. Valentinsson, and M. Ulmestrand. 2000. Effects of shrimp-trawling on abundance of benthic macrofauna in Gullmarsfjorden, Sweden. Mar Ecol. Prog. Ser., 198: 191-201.
Hixon, M.A. and B.N. Tissot. 2007. Comparison of trawled vs. untrawled mud seafloor assemblages of fishes and macroinvertebrates at Coquille Bank, Oregon. J. Exp. Mar. Biol. Ecol. 34:23-34.
Hyland, J., E. Baptiste, J. Campbell, J. Kennedy, R. Kropp, and S. Williams. 1991. Macroinfaunal communities of the Santa Maria Basin on the California outer continental shelf and slope. Mar. Ecol. Prog. Ser, 78:147-161.
Hyland, J.L., L. Balthis, I. Karakassis, P. Magni, A.N. Petrov, J.P. Shine, O. Vestergaard, and R.M. Warwick. 2005. Organic carbon content of sediments as an indicator of stress in the marine benthos. Mar Ecol. Prog. Ser., 295, 91-103.
Jennings, S., and M.J. Kaiser. 1998. The effects of fishing on marine ecosystems. Adv. Mar. Biol., 34:201-352.
Jones, J.B. 1992. Environmental impact of trawling on the seabed: a review. NZ J Mar Freshw Res., 26: 59-67.
Kendall, M.G. 1975. Rank correlation methods. 4th ed., 2nd impression. Charles Griffin & Company, LTD, London.
Krebs, C.J. 1999. Ecological Methodology, 2nd Edition. Addison Wesley Longman, Inc., Reading, MA. 620 p.
Kruskal, J.B. and M. Wish. 1978. Multidimensional Scaling. Sage Publications, Beverly Hills, CA.
Kozloff, E.N. 1996. Marine invertebrates of the Pacific Northwest. University of Washington Press. Seattle and London.
Lambert, P. 2007. Checklist of the Echinoderms of British Columbia. Royal British Columbia Museum. [Internet] [Cited 4 April 2007]. Available from: http://www.royalbcmusem.bc.ca/.
Lindholm, J., P. Auster, and P. Valentine. 2004. Role of a large marine protected area for conserving landscape attributes of sand habitats on Georges Bank (NW Atlantic). Mar. Ecol. Prog. Ser., 269: 61-68.
Løkkeborg, S. 2005. Impacts of trawling and scallop dredging on benthic habitats and communities. FAO Fisheries Technical Paper. No. 472. Rome, FAO. 2005. 58p.
Monterey Bay National Marine Sanctuary (MBNMS). 2006. Bottom trawling effects on benthic habitats action plan, pp. 123-131, In: Monterey Bay Draft Management Plan, Section III – Ecosystem Protection. MBNMS, Monterey CA. (<http://sanctuaries.noaa.gov/jointplan/drafts/mb_mp.html>).

20
National Research Council. 2002. Effects of trawling and dredging on seafloor habitat. National Academy Press, Washington D.C. 126 p.
Nichols, F. H. 2002. Is climate change a factor in observed interdecadal change in the deep Puget Sound benthos? In: T. Droscher (ed.), “Proceedings of the 2001 Puget Sound Research Conference, February 12-14, 2001, Bellevue WA.” Puget Sound Action Team. Olympia, Washington.
Pearson T.H. and R. Rosenberg. 1978. Macrobenthic succession in relation to organic enrichment and pollution of the marine environment. Oceanogr & Mar Biol Ann Rev, 16: 229-311.
Pielou, E.C. 1966. Species-diversity and pattern-diversity in the study of ecological succession. J. Theoret. Biol., 10: 370-383.
Plumb, R.H. 1981. Procedures for handling and chemical analysis of sediment and water samples. Technical Report EPA/CE-8 1-1. U.S. Environmental Protection Agency/Corps of Engineers Technical Committee on Criteria for Dredged and Fill Material. U.S. Army Engineer Waterways Experiment Station, Vicksburg, MS.
SAS Institute Inc. 2004. SAS OnlineDoc® 9.1.3. SAS Institute Inc., Cary, NC. Satterthwaite, F.W. 1946. An approximate distribution of estimates of variance components.
Biometrics Bull., 2: 110-114. Shannon, C. E. and W. Weaver. 1949. The mathematical theory of communication. U. of Illinois
Press, Urbana, Illinois. 117 p. Smith, R.I. and J.T. Carlton, (eds). 1975. Light’s Manual: Intertidal Invertebrates of the Central
California Coast, Third Edition. Univ. of California Press, Ltd., Berkeley and Los Angeles, CA.
Sneath, P.H.A. and R.R. Sokal. 1973. Numerical Taxonomy. Freeman, San Francisco, CA. 573 p.
Stone, R.P. and M.M. Masuda. 2003. Characteristics of benthic sediments from areas open and closed to bottom trawling in the Gulf of Alaska. U.S. Dep. Commer., NOAA Technical Memorandum NMFS-AFSC-140, 111 p.
Thrush, S.F. and P.K. Dayton. 2002. Disturbance to marine benthic habitats by trawling and dredging: implications for marine biodiversity. Ann. Rev. Ecol. & Systematics, 33: 449-473.
Troffe, P.M., C.D. Levings, G.E. Piercy, and V. Koeng. 2005. Fishing gear effects and ecology of the sea whip (Halipteris willemoesi (Cnidaria: Octocorallia: Pennatulacea)) in British Columbia, Canada: preliminary observations. Aquatic Conserv: Mar. Freshw. Ecosyst., 15: 523-533.
Tuck, I.D., S.J. Hall, M.R. Robertson, E. Armstrong, and D.J. Basford. 1998. Effects of physical trawling disturbance in a previously unfished sheltered Scottish sea loch. Mar. Ecol. Prog. Ser., 162: 227-242.
Watling, L. and E. A. Norse. 1998. Disturbance of the seabed by mobile fishing gear: A comparison with forest clear-cutting. Conserv. Biol., 12: 1180-1197.
Wentworth, C. K. 1922. A scale of grade and class terms for clastic sediments. J. Geology, 30: 377-392.
Wilson, M.T., A.H. Andrews, A.L. Brown, and E.E. Cordes. 2002. Axial rod growth and age estimation of the sea pen, Halipteris willemoesi Kölliker. Hydrobiology, 47: 133-142.
Wolda, H. 1981. Similarity indices, sample size and diversity. Oecologia 50:296-302.

21
FIGURES and TABLES
Figure 1. Study area showing stations inside the 2006 Essential Fish Habitat (EFH) Closure Area within the Cordell Bank National Marine Sanctuary (“recovering”) and in a currently trawled area outside the EFH Closure Area within the Gulf of Farallones National Marine Sanctuary (“trawled”).

22
A. Recovering stations (R1-10) in CBNMS EFH Closure.
B. Trawled stations (F1-10) in GFNMS outside EFH Closure
Figure 2. Locations of ROV transects: A) Recovering stations within CBNMS EFH Closure area (R1-10), and B) Trawled stations in GFNMS outside closure area (F1-10).

23
Figure 3. The X2 ROV configured with forward and down-looking video cameras and down-looking digital still camera and paired 20 cm lasers.

24
Figure 4. Still photographic image taken by the X2 ROV, including an overlay with 50 randomly distributed dots used for the quantification of common seafloor microhabitat abundance. “OV1D” is a unique overlay photo identifier.

25
Figure 5: Still photographic image taken by the X2 ROV, including a 10 cm grid overlay used to quantify epifaunal invertebrates abundance. The “OV1B” is a unique overlay identifier. Linear red features are brittle star arms (possibly Ophiothrix spiculata) and the crab is a Cancer sp. (possibly Cancer magister or Cancer productus).

26
Figure 6. Dendrogram resulting from clustering of the 10 trawled and 10 recovering stations using group-average sorting and Bray-Curtis dissimilarity. Each station is represented by two combined replicate infaunal samples (0.1 m2 each) sieved through a 1.0 mm screen. The analysis was performed on double-square-root transformed abundances. Two major site groups, trawled vs. recovering, are distinguished at a Bray-Curtis dissimilarity level of 0.36.

27
Figure 7. Results of non-metric, two-dimensional MDS ordination on the Bray-Curtis dissimilarity matrix of double-square-root transformed infaunal species abundance data from individual replicate samples at the 10 recovering and 10 trawled stations. Boundaries are 99% confidence ellipses. Encircled samples are Bray-Curtis dissimilarity < 0.48.

28
Figure 8. Dendrogram resulting from clustering of individual replicate infaunal samples from Stations 1-7 (depths of 133-139 m) in the EFH closure area at CBNMS (recovering stations) and Stations 15-17 at corresponding depths (130-141 m) in the actively trawled area at GFNMS, using group-average sorting and Bray-Curtis dissimilarity. Each sample is represented by a single replicate (0.1 m2) sieved through a 1.0 mm screen. The analysis was performed on double-square-root transformed abundances.
29
Table 1. Station locations, depths, and sediment characteristics of the 10 recovering sites (1-10) and 10 trawled sites (11-20).
Infaunal Stationa
Latitude
Longitude
ROV
Transect
Avg. Depth (m)b
TOC
(mg/g)
Gravel
(%)
Sand (%)
Silt (%)
Clay (%)
Silt+Clay
(%)
Size
Classd
Median Particle
Size (phi)
Sorting Coeff.
Moisture
(%)
1 37.91628 123.42535 R1 137 3.82 0.00 81.86 13.40 4.74 18.14 VF Sand 3.393 0.853 26.66
2 37.91384 123.42313 R2 137 3.96 0.00 79.98 12.33 7.69 20.02 VF Sand 3.543 0.759 28.48
3 37.91136 123.42042 R3 135 3.87 0.00 78.16 18.13 3.20 21.33 VF Sand 3.440 0.907 27.81
4 37.91152 123.42487 R4 139 3.96 0.00 56.39 32.93 10.68 43.61 VF Sand 3.761 1.850 28.09
5 37.90585 123.41937 R5 136 3.62 0.00 83.39 12.50 4.11 16.61 VF Sand 3.321 1.810 24.19
6 37.90256 123.41597 R6 135 4.26 0.00 87.32 6.40 6.25 12.65 “Sand” c c 21.90
7 37.89974 123.41236 R7 133 2.89 0.65 89.18 7.65 2.52 10.17 C Sand 0.934 1.983 18.20
8 37.89859 123.41761 R8 147 3.56 0.00 90.60 4.49 4.91 9.40 VF Sand 3.090 1.735 24.02
9 37.89540 123.41394 R9 152 3.86 0.00 79.78 17.32 2.90 20.22 VF Sand 3.348 1.717 24.97
10 37.89269 123.41133 R10 147 2.91 0.00 79.86 14.53 5.61 20.14 F Sand 2.736 2.213 20.74
11 37.71712 123.13581 F1 117 5.58 0.00 77.17 19.93 2.90 22.83 VF Sand 3.362 2.720 31.93
12 37.71294 123.13077 F2 114 5.47 0.00 77.06 16.13 6.81 22.94 VF Sand 3.537 0.807 30.23
13 37.71054 123.12737 F3 113 5.20 0.00 87.66 9.45 2.90 12.35 F Sand 2.498 0.719 29.46
14 37.70827 123.12462 F4 114 4.92 0.00 75.13 17.65 7.22 24.87 VF Sand 3.587 0.755 41.54
15 37.71504 123.14156 F5 133 5.30 0.00 83.88 12.55 3.57 16.12 VF Sand 3.441 3.348 29.32
16 37.71223 123.13770 F6 130 4.46 0.00 84.57 10.35 5.08 15.43 VF Sand 3.268 0.782 29.48
17 37.71010 123.13509 F7 141 4.72 0.00 83.62 13.88 2.50 16.38 VF Sand 3.273 0.805 30.27
18 37.70776 123.12658 F8 117 5.19 0.00 80.36 13.95 5.69 19.64 VF Sand 3.419 0.883 29.90
19 37.69317 123.11181 F9 123 5.44 0.00 71.99 25.03 2.98 28.01 VF Sand 3.701 1.080 29.01
20 37.69148 123.10952 F10 124 5.28 0.00 82.55 12.35 5.10 17.45 VF Sand 3.372 0.835 29.42 a Infaunal station locations are the centroids of each corresponding ROV epifaunal transect. b Recorded where bottom grabs taken. c Insufficient data for statistics. d Udden-Wentworth grain-size scale (Wentworth 1922). VF = very fine, C = coarse, F = fine.

30
Table 2. Summary of water-quality measurements taken at three of the 10 infaunal stations in the recovering area (2, 6, 9) and three in the trawled area (12, 16, 19).
Temp. (C) Salinity (PSU) D.O. (mg/L) pH
Station Depth (m)a Surface Bottom Surface Bottom Surface Bottom Surface Bottom
2 130 10.85 9.04 33.47 34.00 8.95 9.29 7.97 7.69
6 129 11.04 8.99 33.45 33.96 8.92 9.3 7.98 7.68
9 122 11.01 9.22 33.46 33.9 8.92 9.26 7.99 7.73
Mean 127 10.97 9.08 33.46 33.95 8.93 9.28 7.98 7.70
12 109 12.16 8.72 33.41 34.03 8.71 9.35 8.17 7.63
16 117 12.14 8.77 33.38 34.01 8.68 9.35 8.16 7.61
19 117 12.31 8.71 33.43 34.05 8.68 9.35 8.19 7.66
Mean 114 12.20 8.73 33.41 34.03 8.69 9.35 8.17 7.63 a Depth of CTD sensors at bottom of profile

31
Table 3. Comparison of abiotic environmental variables at recovering (n = 10) vs. trawled (n = 10) sampling sites Trawling Status Statistical Results
Variable Recovering Trawled t-value a df b p
TOC (mg/g) 3.7 5.2 8.21 17.1 <0.001 % Sand 80.6 80.4 0.07 13.4 0.942 % Silt/Clay 19.2 19.6 0.11 13.4 0.915 Median Particle Size (Phi) 3.06 3.35 0.94 10.1 0.369 Sorting coefficient 1.54 1.27 0.75 14.6 0.464 % Moisture 24.5 31.1 4.06 17.8 0.001 Depth (m) c 140 123 4.75 15.9 <0.001
a Student’s t-test performed under the assumption of unequal variances. b Degrees of freedom computed using Satterthwaite’s (1946) approximation. c Mean of average recorded station depth where bottom grabs were taken.

32
Table 4. Mean percent relative abundance of common microhabitat types from still photographs taken in 2006 at trawled sites in GFNMS and recovering sites in CBNMS. Microhabitat classification was based on Greene et al. (1999). Mean percent relative abundance Microhabitat type Trawled Recovering Combined cobble 0.34% 0% Cobble 0.31 0 Cobble, sessile epifauna 0.03 0 Combined sand 99.66% 100% Featureless sand 97.16 98.87 Sand, sessile epifauna 1.99 0.01 Sand, mobile epifauna 0.06 0.83 Sand, debris 0.45 0.26

33
Table 5. Results of ANCOVA used to test for site effects (trawled vs recovering), water depth, and site-depth interactions on mean transect abundance of common microhabitats from still photographs (n = 426). All data were square-root arcsine transformed prior to analysis. Microhabitat classifications were based on Greene et al. (1999). (* = significantly different at P=0.05.) Source Df Mean square F p Featureless sand Site 1 0.0021 0.0547 0.818 Depth 1 0.0176 4.601 0.0477* Site x depth 1 0.0046 1.1981 0.290 Error 16 0.0038 Sand, sessile epifauna Site 1 5.7764 2866.4129 < 2e-16 * Depth 1 3.7061 1839.0987 < 2e-16 * Site x depth 1 0.0125 6.2271 0.0239 * Error 16 0.0020 Sand, mobile epifauna Site 1 0.0175 19.5282 0.0004* Depth 1 0.0075 8.4141 0.0104* Site x depth 1 0.0005 0.5054 0.4874 Error 16 0.0009 Sand, debris Site 1 0.0096 6.5046 0.0214 * Depth 1 0.0003 0.2020 0.6591 Site x depth 1 0.0001 0.0345 0.8551 Error 16 0.0015

34
Table 6. Mean percent relative abundance of rare microhabitat types, biogenic mounds, and depressions at recovering and trawled transects in 2006, based on the number of video frames per ROV transect. Mean percent relative abundance Microhabitat type Trawled Recovering Biogenic Mounds Combined 11.9 28.3 10-20 cm 11.1 23.5 21 + cm 0.78 4.9 Biogenic Depressions Combined 12.9 31.6 10-20 cm 11.4 22.8 21 + cm 1.6 8.8

35
Table 7. Results of ANCOVA used to test for site effects (trawled vs recovering), water depth, and site-depth interactions on mean transect abundance of uncommon microhabitats from video records. All data were square-root arcsine transformed prior to analysis. Microhabitat classifications were based on Greene et al. (1999). (* = significantly different at P=0.05, ** P=0.01, *** P=0.001.) Source Df Mean square F p Biogenic mounds 10-20 cm Site 1 0.0232 5.4305 0.0332 * Depth 1 0.1072 25.0631 0.0001 *** Site x depth 1 0.0117 2.7399 0.1173 Error 16 0.0043 Biogenic mounds 20+ cm Site 1 0.0306 7.9197 0.0125 * Depth 1 0.1010 26.1682 0.0001 *** Site x depth 1 0.0050 1.3004 0.2709 Error 16 0.0039 Biogenic mounds, combined Site 1 0.0403 6.9028 0.01830 * Depth 1 0.1720 29.4323 5.61e-05 *** Site x depth 1 0.0209 3.5785 0.0768 Error 16 0.0058 Biogenic depressions 10-20 cm Site 1 0.0319 3.6572 0.0739 Depth 1 0.0849 9.7243 0.00662 ** Site x depth 1 0.0019 0.2228 0.64326 Error 16 0.0087 Biogenic depressions 20+ cm Site 1 0.0560 7.3119 0.0156 * Depth 1 0.1608 20.9840 0.0003 *** Site x depth 1 0.0010 0.1326 0.7205 Error 16 0.0077 Biogenic depressions, combined Site 1 0.0806 5.5066 0.0322 * Depth 1 0.1892 12.9220 0.0024 ** Site x depth 1 0.0014 0.0945 0.7624 Error 16 0.0146

36
Table 8. Occurrence of epifaunal macro-invertebrate taxa from ten trawled (A) and ten recovering (B) transects in 2006. A.
Trawled Transect #
# Photos
Sea whip
(Halipteris cf.
willemoesi)
Crab (Lopholithoides
sp.)
Fan worm
(Sabellid)
Gastropod A
(Conus sp.)
Gastropod B
Gastropod C Richness
(Number of Species )
Shannon-Weaver
Diversity Index (H’)
06-1F-01 10 14 0 0 0 0 0 1 0
06-2F-01 16 37 0 0 0 1 0 2 0.1217
06-3F-01 20 34 0 0 2 0 0 2 0.2146
06-4F-01 25 43 0 0 9 0 2 3 0.6021
06-5F-01 20 0 0 0 1 0 0 1 0
06-6F-01 16 0 1 5 0 0 0 2 0.4506
06-7F-01 18 0 0 2 0 0 0 1 0
06-8F-01 16 4 0 7 21 0 0 3 0.8688
06-9F-01 19 0 0 2 2 0 0 2 0.6931
06-10F-01 15 0 0 1 1 0 0 2 0.6931
TOTAL 175 132 1 17 36 1 2 6 0.8868 B.
RecoveringTransect # # Photos
Crab (Cancer sp.)
Fan worm (Sabellid)
Brittle star (Ophiothrix spiculata?)
Richness (Number of Species
)
Shannon-Weaver Diversity Index
(H’)
06-1R-01 20 0 4 680 2 0.0359
06-2R-01 19 0 2 568 2 0.0233
06-3R-01 14 0 2 349 2 0.0351
06-4R-01 20 0 1 523 2 0.0139
06-5R-01 18 0 1 283 2 0.0234
06-6R-01 18 1 7 237 3 0.1562
06-7R-01 8 0 1 23 2 0.1732
06-8R-01 16 0 0 90 1 0
06-9R-01 18 0 6 132 2 0.1788
06-10R-01 18 0 5 275 2 0.0896
TOTAL 169 1 29 3190 3 0.0546

37
Table 9. Macrofaunal richness (A), diversity (B), and abundance (C) comparisons for ten trawled and ten recovering benthic transects in 2006. Probability values from ANCOVAs are given for site effects, depth effects, and interaction of site and depth. (* = significantly different at P=0.05, ** P=0.01, *** P=0.001.) A. Richness (Number of species) Transect as replicate ANCOVA (parametric) Site Mean SE n T-test (P) Source df F P Trawled 1.9 0.233 10 0.722 Site 1 3.2615 0.0898 Recovering 2 0.149 10 Depth 1 1.746 0.2050 S x D 1 0.3707 0.5512 Residuals 16
B. Diversity (Shannon-Weaver Index) Transect as replicate ANCOVA (parametric) Site Mean SE n T-test (P) Source df F P Trawled 0.3644 0.150 10 0.0095** Site 1 3.8975 0.0659 Recovering 0.0154 0.005 10 Depth 1 5.9717 0.0265 S x D 1 0.0419 0.8404 Residuals 16
C. Abundance (Number of individuals) Transect as replicate ANCOVA (parametric) Site Mean SE n T-test (P) Source df F P Trawled 18.9 1.46 10 0.0012* Site 1 16.475 0.0009*** Recovering 319 23.02 10 Depth 1 5.484 0.0325* S x D 1 2.231 0.1547 Residuals 16

38
Table 10. Percent frequency of occurrence in transects by taxa/species (genus identifications are tentative as none were collected by sampling) within ten trawled and ten recovering benthic transects in 2006 determined by counts from still photos (n = 175 trawled photos, n = 169 recovering photos, total = 344 photos). Numbers in parentheses are percent frequency of occurrence in photos within the transects. Trawling Status
Recovering Trawled Percent frequency in all photos combined Sea whip (Halipteris cf.) 0 50 (39.43) 20.1 Crab (Lopholithodes sp.) 0 10 (0.57) 0.29 Crab (Cancer sp.) 10 (0.59) 0 0.29 Fan worm (Sabellidae) 90 (14.2) 50 (8.57) 11.34 Gastropod A (Conus sp.) 0 60 (9.71) 4.94 Gastropod B (mud snail) 0 10 (0.57) 0.29 Gastropod C (cowrie) 0 10 (1.14) 0.58 Ophiuroid (brittle star, (Ophiothrix sp.) 100 (96.5) 0 47.38

39
Table 11. Comparison of benthic infaunal community characteristics at recovering sites (n=10 sites x 2 reps each) vs. trawled sites (n=10 sites x 2 reps each). Trawling Status Statistical Results Benthic Variable Recovering Trawled df b t-value a P Mean # taxa grab-1 62 65 18 0.93 0.365 Mean # taxa station-1 (pooled replicates) 87 89 17.8 0.34 0.736 Mean H′ grab-1 3.4 4.0 9.44 1.26 0.237 Mean J′ grab-1 0.57 0.67 9.32 1.15 0.2795 Mean density grab-1 (# m-2): All fauna 8626 5023 9.41 -2.09 0.065 All fauna (Myriochele gracilis removed) 3326 4945 18 4.99 <0.001
Polychaeta 7684 3689 9.36 -2.31 0.045 Polychaeta (M. gracilis removed) 2384 3611 18 4.17 0.001 Crustacea 275 249 17 -0.53 0.604 Mollusca 477 737 14.8 8.43 <0.001 Ophiuroidea 114 112 12.6 -0.09 0.931 Holothuroidea 14 41 9.59 1.28 0.232 Echinoidea 8 12 17.9 0.95 0.353 Pennatulacea 1 3 14.7 1.28 0.220 Other Anthozoans 11 55 12.1 4.07 0.001
a Student’s t-test were performed under the assumption of unequal variances. Replicates were combined for each of the 20 sites, thus n = 10 for each of the two treatment groups. b Degrees of freedom computed using Satterthwaite’s (1946) approximation.

40
Table 12. Comparison of benthic infaunal species abundances at recovering sites (n = 10 sites x 2 reps each) vs. trawled sites (n = 10 sites x 2 reps each). Included are species each representing at least 1% of total faunal abundance of all species combined (75% of cumulative abundance collectively). Mean density grab-1 (# m-2) % difference
relative to recovering
area
Statistical Results
Taxon
Recovering
Trawled
df b
t-value a
p
Myriochele gracilis 5300 77 -99 9.0 -3.27 0.010 Spiophanes spp.c 279 1894 579 11.9 11.71 <0.001 Myriochele olgae 618 127 -79 14.9 -3.36 0.004 Cirratulidae 196 218 11 17.6 1.32 0.205 Axinopsida serricata 102 273 168 11.9 7.79 <0.001 Maldanidae 104 149 43 11 0.82 0.431 Terebellidae 152 40 -74 10.1 -3.46 0.006 Prionospio spp. 76 149 96 18 4.14 0.001 Ophiuroidea juv. 114 112 -2 12.6 -0.09 0.931 Decamastus gracilis 75 64 -15 18 -0.41 0.685 Scoloplos armiger 59 92 56 18 1.86 0.080 a t-tests were performed under the assumption of unequal variances. Replicates were combined for each of the 20 sites, thus n = 10 for each of the two treatment groups.. b Degrees of freedom computed using Satterthwaite’s (1946) approximation. c Mostly S. duplex (97%).

41
Table 13. Dominant (five most abundant) infaunal species, listed in decreasing order of abundance, at recovering sites (n = 10 sites x 2 reps each) vs. trawled sites (n = 10 sites x 2 reps each). Recovering Sites Trawled Sites
Taxon Mean Density (m-2)
Frequency* (%) Taxon Mean
Density (m-2) Frequency*
(%) Myriochele gracilis 5300 100 Spiophanes spp. 1894 100 Myriochele olgae 618 100 Axinopsida serricata 273 100 Spiophanes spp. 279 100 Cirratulidae 247 100 Cirratulidae 196 100 Maldanidae 149 100 Terebellidae 152 100 Prionospio spp. 149 95 *Percentage of samples (individual replicates) in which species occurred.

42
NMSP CONSERVATION SERIES PUBLICATIONS To date, the following reports have been published in the Marine Sanctuaries Conservation Series. All publications are available on the Office of National Marine Sanctuaries Web site (http://www.sanctuaries.noaa.gov/). Chemical Contaminants, Pathogen Exposure and General Health Status of Live and Beach-Cast Washington Sea Otters (Enhydra lutris kenyoni) (ONMS-09-01) Caribbean Connectivity: Implications for Marine Protected Area Management (ONMS-08-07) Knowledge, Attitudes and Perceptions of Management Strategies and Regulations of FKNMS by Commercial Fishers, Dive Operators, and Environmental Group Members: A Baseline Characterization and 10-year Comparison (ONMS-08-06) First Biennial Ocean Climate Summit: Finding Solutions for San Francisco Bay Area's Coast and Ocean (ONMS-08-05) A Scientific Forum on the Gulf of Mexico: The Islands in the Stream Concept (NMSP-08-04) M/V ELPIS Coral Reef Restoration Monitoring Report Monitoring Events 2004-2007 Florida Keys National Marine Sanctuary Monroe County, Florida (NMSP-08-03) CONNECTIVITY Science, People and Policy in the Florida Keys National Marine Sanctuary (NMSP-08-02) M/V ALEC OWEN MAITLAND Coral Reef Restoration Monitoring Report Monitoring Events 2004-2007 Florida Keys National Marine Sanctuary Monroe County, Florida (NMSP-08-01) Automated, objective texture segmentation of multibeam echosounder data - Seafloor survey and substrate maps from James Island to Ozette Lake, Washington Outer Coast. (NMSP-07-05) Observations of Deep Coral and Sponge Assemblages in Olympic Coast National Marine Sanctuary, Washington (NMSP-07-04) A Bioregional Classification of the Continental Shelf of Northeastern North America for Conservation Analysis and Planning Based on Representation (NMSP-07-03) M/V WELLWOOD Coral Reef Restoration Monitoring Report Monitoring Events 2004-2006 Florida Keys National Marine Sanctuary Monroe County, Florida (NMSP-07-02) Survey report of NOAA Ship McArthur II cruises AR-04-04, AR-05-05 and AR-06-03: Habitat classification of side scan sonar imagery in support of deep-sea coral/sponge explorations at the Olympic Coast National Marine Sanctuary (NMSP-07-01) 2002 - 03 Florida Keys National Marine Sanctuary Science Report: An Ecosystem Report Card After Five Years of Marine Zoning (NMSP-06-12) Habitat Mapping Effort at the Olympic Coast National Marine Sanctuary - Current Status and Future Needs (NMSP-06-11)

43
M/V CONNECTED Coral Reef Restoration Monitoring Report Monitoring Events 2004-2005 Florida Keys National Marine Sanctuary Monroe County, Florida (NMSP-06-010) M/V JACQUELYN L Coral Reef Restoration Monitoring Report Monitoring Events 2004-2005 Florida Keys National Marine Sanctuary Monroe County, Florida (NMSP-06-09) M/V WAVE WALKER Coral Reef Restoration Baseline Monitoring Report - 2004 Florida Keys National Marine Sanctuary Monroe County, Florida (NMSP-06-08) Olympic Coast National Marine Sanctuary Habitat Mapping: Survey report and classification of side scan sonar data from surveys HMPR-114-2004-02 and HMPR-116-2005-01 (NMSP-06-07) A Pilot Study of Hogfish (Lachnolaimus maximus Walbaum 1792) Movement in the Conch Reef Research Only Area (Northern Florida Keys) (NMSP-06-06) Comments on Hydrographic and Topographic LIDAR Acquisition and Merging with Multibeam Sounding Data Acquired in the Olympic Coast National Marine Sanctuary (ONMS-06-05) Conservation Science in NOAA's National Marine Sanctuaries: Description and Recent Accomplishments (ONMS-06-04) Normalization and characterization of multibeam backscatter: Koitlah Point to Point of the Arches, Olympic Coast National Marine Sanctuary - Survey HMPR-115-2004-03 (ONMS-06-03) Developing Alternatives for Optimal Representation of Seafloor Habitats and Associated Communities in Stellwagen Bank National Marine Sanctuary (ONMS-06-02) Benthic Habitat Mapping in the Olympic Coast National Marine Sanctuary (ONMS-06-01) Channel Islands Deep Water Monitoring Plan Development Workshop Report (ONMS-05-05) Movement of yellowtail snapper (Ocyurus chrysurus Block 1790) and black grouper (Mycteroperca bonaci Poey 1860) in the northern Florida Keys National Marine Sanctuary as determined by acoustic telemetry (MSD-05-4) The Impacts of Coastal Protection Structures in California's Monterey Bay National Marine Sanctuary (MSD-05-3) An annotated bibliography of diet studies of fish of the southeast United States and Gray's Reef National Marine Sanctuary (MSD-05-2) Noise Levels and Sources in the Stellwagen Bank National Marine Sanctuary and the St. Lawrence River Estuary (MSD-05-1) Biogeographic Analysis of the Tortugas Ecological Reserve (MSD-04-1) A Review of the Ecological Effectiveness of Subtidal Marine Reserves in Central California (MSD-04-2, MSD-04-3) Pre-Construction Coral Survey of the M/V Wellwood Grounding Site (MSD-03-1)

44
Olympic Coast National Marine Sanctuary: Proceedings of the 1998 Research Workshop, Seattle, Washington (MSD-01-04) Workshop on Marine Mammal Research & Monitoring in the National Marine Sanctuaries (MSD-01-03) A Review of Marine Zones in the Monterey Bay National Marine Sanctuary (MSD-01-2) Distribution and Sighting Frequency of Reef Fishes in the Florida Keys National Marine Sanctuary (MSD-01-1) Flower Garden Banks National Marine Sanctuary: A Rapid Assessment of Coral, Fish, and Algae Using the AGRRA Protocol (MSD-00-3) The Economic Contribution of Whalewatching to Regional Economies: Perspectives From Two National Marine Sanctuaries (MSD-00-2) Olympic Coast National Marine Sanctuary Area to be Avoided Education and Monitoring Program (MSD-00-1) Multi-species and Multi-interest Management: an Ecosystem Approach to Market Squid (Loligo opalescens) Harvest in California (MSD-99-1)