Embed Size (px)
Citation preview

J. Physiol. (Paris) 93 (1999) 43-59 0 Elsevier, Paris
A comparison of human motoneuron data to simulated data using cat motoneuron models
Kelvin E. Jonesa, Parveen Bawab*
“Department of Physiology, University of Manitoba, 730 William Ave, BMSB 404, Winnipeg, MB, R3E 3J7, Canada ‘School of Kinesiology, Simon Fraser University, Bumaby, B.C., V5A IS6, Canada
Abstract - The response of repetitively firing human motoneurons to a composite excitatory input was evaluated. It was clearly shown that the response of the motoneurons to the transient input decreased with an increase in the background firing rate of the cell. The current model of repetitively firing human motoneurons could not account for this experimental result. Therefore, a compartmental modelling approach was used to simulate the repetitive firing properties of anaesthetised cat motoneurons under current clamp conditions. The modelled motoneurons were used in simulations similar to the experimental paradigms where the response to a composite excitatory input was evaluated at different background firing rates. The motoneuron models also showed a decrease in response to the excitatory input at faster background firing rates. The results suggest that human motoneurons are more comparable to motoneurons in the anaesthetised cat preparation than formerly thought. The results also demonstrate that the apparent efficacy of a synaptic input may be modulated by changes in background firing rate of the postsynaptic neuron. 0 Elsevier, Paris
AHP / motor unit I spike train I spinal cord
1. Introduction
Motoneurons are those essential neurons upon which the very existence of life depends. Their impor- tance in the control of muscle contraction, and the relative ease of experimental approachability has en- couraged extensive studies of these neurones. During the twentieth century these studies yielded a wealth of information on properties of motoneurons. With the advances in techniques and technology, we have ob- tained information on their firing behaviours, recruit- ment properties, neuronal architecture, passive bio- physical properties and various types of membrane conductances in reduced preparations of the cat. The ultimate aim of neuroscience, is of course, to under- stand human behaviour, and because invasive tech- niques used in the cat cannot be employed in humans, it is imperative to find out if the information gained in the cat can be transferred to the properties of human motoneurons. In this chapter we will examine the equivalence of rhythmically firing cat and human motoneurons.
In repetitively firing spinal motoneurons of the cat, intracellularly recorded membrane voltage trajectories between spikes undergo predictable changes with in- creases in firing rate under current clamp condi- tions [2, 3, 411. Within the primary range of firing an increase in firing rate is accompanied by a decrease in the maximum depth of the membrane voltage trajec- tory (the scoop) following a spike with relatively little change in the latter portion of the trajectory (the ramp) in which the membrane potential approaches threshold in a ramp-like fashion [41]. The changes in membrane
* Correspondence and reprints
voltage at different firing rates are accompanied by firing rate dependent changes in membrane conduc- tance [2, 3, 421. We define the excitability of a rhy- thmically firing motoneuron as the probability of response to an impulse perturbation. Then consider how changes in scoop depth and conductance during the IS1 are expected to alter the excitability of the motoneuron and, because of these parameters, rate dependence, motoneuronal excitability is predicted to vary with firing rate. In addition to the effects of membrane voltage and conductance, the level of mem- brane noise produced by background synaptic in- put [8] affects the excitability of the motoneuron.
If human motoneurons behave the same way as cat motoneurons, then one would predict that the average response probability, i.e., excitability, should be higher at the faster firing rate. This was tested in human motoneurons for: i) fast upper limb flexor carpi radialis motoneurons; and ii) slow lower limb soleus motoneu- rons using homonymous la volleys as the impulse pertubation to determine excitability. Following the experimental work, the same experiments were simu- lated on computer models of fast and slow motoneu- rons. The motoneurons were architecturally and elec- trotonically fashioned after an S and an FR type motoneuron innervating the medial gastrocnemius muscle of the cat [12, 171. The conductances used to simulate active properties included a sodium and fast potassium conductance in the initial segment as well as a sodium, fast potassium and slow potassium conduc- tance in the soma [ 14, 461. The slow potassium con- ductance was described as a time- and voltage- dependent process rather than a calcium-mediated process for simplicity. The results of the simulations using these models support the idea that extrapolation

44 Jones and Bawa
of properties of cat motoneurons to human motoneu- rons is appropriate for the explanation of the human results [20]. This paper reviews the original results previously published in abstract and full manuscript format [20-24, 271.
2. Human experiments
2.1. Methods
Single motor unit (SMU) activity was recorded from the right flexor carpi radialis (FCR) or the right soleus muscle using bipolar intramuscular electrodes. Differential surface electromyographic (EMG) record- ings were made with Ag/AgCl disc electrodes fixed to the skin overlying the FCR or soleus muscles. Com- posite Ia EPSPs were produced in either FCR or soleus motoneurons by delivering constant current stimuli to the median nerve at the cubital fossa or the posterior tibia1 nerve at the popliteal fossa, respectively. Sub- jects were asked to voluntarily recruit an SMU and maintain a tonic discharge at a constant firing rate using audio and visual feedback. Initially, the subject was required to maintain the repetitive discharge of the SMU at a rate that was as slow as possible and yet rhythmic. These slow firing rates were noticeably different for soleus and FCR motoneurons. While the subject maintained tonic discharge of the SMU, stimuli were delivered to the nerve in one of two different modes: random or triggered [23]. In the random mode of stimulation, the stimulus was given irrespective of the times of discharge of the SMUs. That is, the stimulus could induce an EPSP with equal probability during all phases of the ISI. In the triggered mode, the stimulus was applied at a particular delay, d, with respect to the SMU spike in order to induce composite EPSPs at a specific phase of the ISI. These delays ranged from l-60 ms for FCR and l-80 ms for soleus SMUs. The upper limit of these delay ranges was set so that the composite EPSP would be induced prior to the next naturally occurring action potential when the motoneuron was firing at the faster of the two rates being compared. With respect to the motoneuron spike the total delay is T = t+ d, where t is the dead time due to conduction and transmission times in the afferent and efferent pathways. Thus the EPSPs were produced at a delay of T ms with respect to the motoneuron spike.
The firing rate of a motoneuron was computed by constructing first order interval histograms for each SMU, for each experimental condition. To assess response probability of the motoneuron in response to the Ia composite EPSP, peri-stimulus time histograms (PSTHs) were constructed between SMU spikes and stimulus pulses. For the triggered mode of stimulation, the response probability at time T, P(T), was calculated
by dividing the total number of spikes in the short latency peak of the PSTH by the total number of stimuli applied. For the random mode of stimulation response probability, P,, was calculated after subtract- ing the mean background firing probability from the peak [50]. The resulting value is a measure of the probability of response to a single stimulus, so that a P(T) (or P,) of 0.5 is equivalent to saying that there is a 50% chance that the composite la EPSP will perturb the rhythmic firing and evoke an action potential in the motoneuron. In the triggered mode P(T) depended not only on the firing rate and the strength of perturbing volley but also on the value of T at which the EPSP was produced during the ISI.
3. Results
3. I. l@ects of baseline jiring rate on response probability using random stimulation.
Contrary to our expectations based on the litera- ture [ 1, 301, firing rate had a clear effect on response probability of both the FCR and soleus motoneurons. Figure 1 shows PSTHs for an FCR and a soleus motoneuron at fast and slow firing rates. The FCR motoneuron shows a 46% decrease in response prob-
FCR Soleus
-50 0 50 -50 0
POST-STIMULUS TIME (ms)
50
Figure 1. Effects of firing rate on the response probabilities of motoneurons during random stimulation. In the FCR motoneuron the response probability increased from P, = 0.26 at the fast firing rate (14.3 imp/s, top left) to P, = 0.48 when the firing rate decreased (10 imp/s, middle left). In the soleus motoneuron the response probability increased from P, = 0.31 at the fast firing rate (8 imp/s, top right) to P, = 0.56 at the slower rate (5.1 imp/s, middle right).

Simulating human motoneurons 45
Soleus
P= 0.54 N= 54 T= 109
FCR
I5 P= 0.85 N= 40 T= 103
0 I -
‘*
I T= P= N= 0.63 51 82 II
I
T=78 N= P= 0.11 56
POST-STIMULUS TIME (ms)
Figure 2. Peri stimulus time histograms (PSTHs) with the triggered mode of stimulation. Response probabilities for an FCR motoneuron and a soleus motoneuron from the same subject are shown for four different motoneuron spike-to-stimulus delays. As the motoneuron spike-to-stimulus delay, T, was decreased, the response probability decreased. The mean firing rate for the FCR motoneuron was 8.3 imp/s and the mean firing rate for the soleus motoneuron was 6.8 imp/s.
ability at the fast rate compared to the slow. Similarly, the soleus motoneuron’s response probability is 45% lower at the faster firing rate. Both motoneurons show a decreased response probability at the fast firing rate. For all 15 motoneurons (eight FCR and seven soleus) tested, the mean percentage decrease in response probability at the fast firing rate was 58% for FCR and 44% for soleus. Paired t-tests suggested that there was a significant difference in the response probability of a motoneuron at fast and slow rates.
3.2. Response probabilities at direrent delays with triggered stimulation
Random stimulation induces EPSPs at all phases of the IS1 with equal probability, therefore, P, measures an averaged response probability over the whole ISI.
In order to understand the properties of human moto- neurons at specific times during the ISI, the triggered mode of stimulation was employed. The triggered mode of stimulation confined the EPSP to being produced at a set delay, d, following an SMU spike and hence the equivalent total delay, T, following the motoneuron spike. Figure 2 shows the results of triggered stimulation at four different delays during the IS1 for an FCR and a soleus motoneuron. In both cases the motoneuron was being voluntarily driven at a constant firing rate of 8.3 imp/s for the FCR motoneu- ron and 6.8 imp/s for the soleus motoneuron. The total delay (T) at which the EPSP was produced following the motoneuron spike was estimated from the onset latency of the peak during random stimulation plus the SMU spike-to-stimulus delay, d. For both motoneu- rons the response probability was the greatest at the

46 Jones and Bawa
TOTAL 6&.AY, T (ms)
Figure 3. Response trajectories for FCR and soleus motoneurons. The two response trajectories shown above for the FCR (0) and soleus (CI) motoneurons are plotted with data obtained from the same motoneurons presented in jgure 2. The total delay along the abscissa comprises the onset time of the peak for the motor unit (i.e., dead time) plus the motor unit spike-to-stimulus delay, d. The firing rates were 8.3 imp/s for FCR and 6.8 imp/s for soleus.
longest delay and decreased as the EPSP was produced progressively at shorter delays during the ISI.
The response probabilities at various delays are plotted graphically in$gure 3 for the two motoneurons shown in figure 2. The curves formed by joining the consecutive response probability values will be re- ferred to as ‘response trajectories’ in contrast to the membrane voltage trajectories which are expected to constitute an important parameter affecting the re- sponse trajectories. From figure 3 it can be seen that the response probability increases in a monotonic fashion with increases in the total delay. The regions of the IS1 that were not tested include both early and later phases. In the initial phase of the ISI the earliest delay testable with triggered stimulation is equivalent to a SMU spike-to-stimulus delay of 1 ms plus the dead time, t. In the FCR motoneuron this is approximately 10 ms shorter than in the soleus motoneuron because of differences in the conduction time between the periphery and spinal cord.
It may be noted that the shapes of response trajec- tories depend on the stimulus intensity, in addition to the motoneuron properties. At a given firing rate, the stimulus may be strong enough to produce a response probability of 1 at most of the delays. At the other extreme, stimuli may be weak such that response probability remains 0 during most of the ISI. To avoid these two extremes we tried to adjust the stimulus strength so that response probability was approxi- mately 0.5 at SMU spike-to-stimulus delays of 3040
ms. An additional factor responsible for the shape of the response trajectory is the background noise. In the absence of noise the shape of the response trajectory would appear as a step function.
3.3. Effect of baseline firing rate on response probability using triggered stimulation
Having established the relative response probabili- ties at various delays we proceeded to examine the effect of firing rate on the response probability at these specific delays. Figure 4 shows PSTHs from an FCR and a soleus motoneuron during triggered stimulation at two different firing rates. The EPSP was induced in the FCR motoneuron approximately 53 ms following the motoneuron spike and resulted in a response probability of 0.49 at the slow rate (11.8 imp/s) which increased to 0.77 at the faster rate (13.3 imp/s). The effect of firing rate is similar for the soleus motoneuron where the EPSP was induced approximately 86 ms following the motoneuron spike resulting in a response probability of 0.12 at the slow rate (4.9 imp/s) which increased to 0.47 at the fast rate (7.1 imp/s). Compari- sons of responses at slow and fast firing rates for 28 FCR and 10 soleus motoneurons showed that the response probability was significantly higher at the faster firing rate for both motoneuron types.
In conclusion, observations on human motoneurons yielded results predicted from properties of cat moto- neurons only in the triggered mode of stimulation. The

Simulating human motoneurons 47
FCR
15
Soleus
P= 0.47 N= 55
POST-STIMULUS TIME (ms)
Figure 4. PSTHs illustrating the effect of firing rate on two motoneurons. The figure shows the effect of firing rate on the response probability during the triggered mode. For FCR, the spike-to-stimulus delay, d, was 30 ms (T = 53ms) and for soleus it was 50 ms (T = 86 ms). The response probabilities are P = 0.49 (n = 41, number of stimuli) at the slow rate of 11.8 imp/s which increased to P = 0.77 (n = 52) at the fast rate of 13.3 imp/s in FCR. In soleus, at the slow rate of 4.9 imp/s the response probability was P = 0.12 (n = 43). At the fast rate of 7.1 imp/s, response probability increases to P = 0.47 (n = 55).
random mode of stimulation produced results that were the opposite of what was expected and this motivated us to proceed with the following model.
4. Model
4.1. Methods
All simulations were done with the Nodus soft- ware [13] on a Macintosh Centris 660AV computer. Once the characteristics of cat motoneurons were reproduced by the models, experiments previously carried out on human motoneurons were simulated with the model motoneurons.
4.2. Neuron structure
Motoneurons were modeled in a compartmental fashion with partitions representing the soma, initial segment and equivalent dendrite [39]. The measure- ments of the compartments were based on the recon- struction of cat lumbosacral motoneurons reported in the literature [ 12, 171. The compartmental structure of the two motoneuron models is illustrated in jigure 5. The somata are represented by spheres of diameters 50.9 and 48.8 mm for the S and FR motoneuron respectively [ 121. The initial segment compartments
are represented by identical cylinders with a diameter of 10 and length of 100 mm [46] in both motoneurons. The dendrites for each motoneuron are represented by an equivalent cable whose diameter changes as a function of distance from the soma [lo, 171. Each equivalent dendrite is based on measurements taken from Fleshman et al. [17] (their figure 9, Step Model). The diameter of the stem compartment of the equiva- lent dendrite (deqotem)) was estimated from the equa- tion:
d eq( Sfwn ) (1)
where dj is the mean diameter of the j’th stem dendrite for n number of stem dendrites [17]. The length of each dendritic compartment was varied so that no compartment had an electrotonic length greater than 0.2 h [45]. The total lengths of the equivalent dendrites were 7000 and 6675 mm for the S and FR type motoneurons, respectively.
4.3. Passive and active parameters
The passive parameters determining the cable prop- erties of the neurons were set according to the values

48 Jones and Bawa
S-tpe motoneuron
Soma d17
FR-type motoneuron
Is- 0 Soma do d19
reported by Fleshman et al. [17] for these two cells (see [23] for details).
Active properties were associated with the initial segment and soma compartments only (figure 6), and consisted of five voltage gated ionic currents (equa- tions in Jones and Bawa [27]) simulated by standard Hodgkin-Huxley (H-H) equations [ 191 as described and adapted from Traub [46]. The initial segment contained a fast sodium conductance and a fast de- layed rectifier type potassium conductance (cf. [5]). The soma compartment contained a sodium conduc- tance, a fast potassium conductance, and a slow potassium conductance which gave rise to the afterhy- perpolarization. The ‘fast’ and ‘slow’ potassium con- ductances are analogous with those described by Barrett et al. [4] for cat motoneurons. The sodium and ‘fast’ potassium conductances in the initial segment
Figure 5. Structure of the S- and FIX-type motoneuron models and their associated synapses. The morphology of the S- and FR-type motoneurons was roughly based on the structure of cells 35/4 (S) and 43/S (FR) as described by Cullheim et al. [ 123 and Fleshman et al. [ 171. The dendritic compartments are named as do, dt, d2,... etc. with the compartment most proximal to the soma being do. The specific membrane resistivity has been set according to the step model with values for the soma and dendritic compart- ments taken from the data of Fleshman et al. [17] for these two cells. This resulted in a total electrotonic length of 2.29 and 2.45 for the S- and FRtype motoneurons respectively. The size of the initial segments, to the left of the soma, was the same in both models. Synaptic distribution was roughly based on the results of Segev et al. [44] for these same two motoneurons. Although shown as number of synapses per compartment, synaptic input was actually modeled as a single synapse in each compartment with a peak conduc- tance equal to the number of synapses assigned to the compartment as shown above multiplied by a variable maximum conductance for a single synapse.
were activated at a lower threshold relative to the equivalent conductances in the soma [14]. All sodium and fast potassium conductances were the same for the two types of motoneurons, however, the slow potas- sium conductance parameters were adjusted differently in each model. The density of sodium and fast potas- sium conductances was set according to previous models of cat spinal motoneurons [46, 471 and were the same for both models.
4.4. Behaviour of the motoneuron models
In order to obtain the input resistance, R,, of the two motoneuron models, hyperpolarizing current pulses of 1,2, 3 nA amplitude and 50 ms duration were applied to the soma compartment. The linear steady state current/voltage relationships (figure 7A) resulted
Initial Segment Soma Dendrite 0
I I ---___ WWI WWI c-NT 3x-E. ~+~G,,(V,,-Ei_)+‘~,-‘~‘, +vmi;-vND, +I+
R, 1WFl MW
Figure 6. RC circuit of the IS, soma and DO.

Simulating human motoneurons 49
A
12.a.s EI FR
1
Current Step2Amplitude (nA) 3
Figure 7. Behaviour of the two model motoneurons. A. Response of the two motoneurons to 50 ms hyperpolarizing currents of 1 .O, 2.0, 3.0 nA. The maximum change in membrane potential was plotted with respect to the amplitude of the current input for the two motoneurons. Linear regression analysis of the data was used to estimate the input resistance of the motoneurons. The equation of the line fit to the data from the S-type motoneuron was DV = 3.91-0.33, and that fit to the data from the FR-type motoneuron was DV = 2.01-0.033. B: An action potential was elicited by a 0.5 ms 10 nA current pulse injected into the initial segment. The resulting AHPs for the two motoneurons are shown after the models have been set with AHP parameters according to the cat literature.
in R, = 3.9 and 2.0 MM for the S and FR type motoneurons, respectively. The time constants, t,, for the two motoneurons were obtained by injecting 20 nA, 0.2 ms hyperpolarizing pulses into the soma compartments. The resulting voltage transient was plotted on a semilogarithmic plot and t, was computed by curve fitting with the equation:
“(t) = ,Icxp(‘) (2)
[17]. The equation was fit to the transient record over a 5 ms period centered at 1.5 times the experimental value of t, reported in Fleshman et al. [17]. The t, values computed in this manner were 16.4 and 8.8 ms for the S and FR type motoneurons respectively.
For the firing behaviour of the motoneuron, the following equation was solved for membrane poten- tial, V,,,,, at the soma:
( “M,X, - Eion > +
(3)
where the subscript [x] refers to the soma compartment and [y] to the compartments linked to [xl. Equation 3 is represented by the electrical equivalent circuit in figure 6. The total somatic resistance is given by:
R lxl =7cD2 R, 51 (4)
with D = 50.9 and 48.8 mm for the S and FR type motoneurons respectively. R,,, is taken to be the
inverse of the passive leak conductance g, in our model. The first term in equation 3 represents the leak current, the next term represents the sum of the ionic currents located in the soma compartment. The contri- bution of currents from other compartments is repre- sented by the third term and the injected current is represented by the final term. To obtain VmLx, as a function of time, equation 3 was integrated by using the forward Euler method [31] with a variable time step according to the equation:
a”0 V,,, = V,, + At -
at (5)
where V, is the initial value of membrane voltage
a”0 and dt is the initial slope. The time step was varied
so that the change in membrane voltage in a single time step was never greater than 0.2 mV. With this method time steps ranged between 0.04-0.08 ms in the simulations reported.
A single action potential was elicited by injecting a 0.5 ms, 10 nA depolarizing current pulse into the initial segment and the resulting AHP recorded from the soma is plotted in$gure 7B for each motoneuron. The parameters describing the AHP of the two motoneu- rons are reported in table I. The depth and duration of the AHPs was adjusted to match the values reported by Zengel et al. [49] for type identified motoneurons in the cat by adjusting parameters of the ‘slow’ potassium conductance. Depth of the AHP was adjusted by changing the density of the slow potassium conduc-

50 Jones and Bawa
Table I. Summary of AHP parameters for the two motoneu- ron models.
s FR
AHP depth, mV 4.8 4.1 AHP duration, ms 160 90 AHP half-decay time, ms 48 23 Time-to-peak AHP, ms 16.5 12.2
tance on the soma and duration was adjusted by changing the numerator in the backward rate func- tion [23].
4.5. Membrane voltage trajectories during rhythmic jiring at di$erent firing rates
In cat motoneurons, an increase in firing rate is accompanied by a decrease in the depth of the mem- brane voltage trajectories between spikes [2, 3,411. To examine whether the models showed similar changes in membrane voltage trajectories, each of the models was fired at a number of different firing rates; the trajectories for the type S model are illustrated in Jigure 8. The figure shows changes in the membrane potential trajectories which are similar to those re- ported in cat motoneurons, namely the maximum depth of the AHP decreases as firing rates increase [2, 3,411. In the S motoneuron, the maximum depth of the
18 14
w J
Er= 0 mV+
AHP decreased from 10.8 mV at a firing rate of 5.6 imp/s to 8.8 mV at the faster firing rate of 18 imp/s. Similarly, in the FR motoneuron, AHP depth changed from 8.3 mV at a firing rate of 10.2 imp/s to 7.4 mV at 24.4 imp/s. Figure 8 also reveals changes in the latter part of the AHPs as the firing rates increased. Initially at the minimal rhythmic firing rate, 5.6 imp/s for the S motoneuron and 10.2 imp/s for the FR motoneuron, the recovery of the membrane potential towards threshold showed an asymptotic region as has previ- ously been discussed by Piotrkiewicz et al. [36]. At the faster firing rates this asymptotic region gradually decreased and the membrane potential returned to threshold in a more ramp-like fashion.
4.6. Synaptic and current impulse inputs to the motoneurons
Synaptic conductances were added to the equivalent dendrites of the two motoneurons according to Segev et al. [44] (their jigure 4, Step Model). Instead of assigning 300 individual synapses of the same peak conductance to the motoneuron models [44], the num- ber of synapses in a particular compartment was determined and modelled as a single equivalent syn- apse with a peak conductance, g,,, equal to:
g max = wpeakcss) (61
10 a 5.6 imp/s
I
i
/
_/‘I-:
x
59%
Figure 8. Membrane voltage trajectories during repetitive firing of S motoneuron model. Five different levels of current steps were injected into the soma compartment of each the motoneurons to elicit repetitive firing. The membrane voltage trajectories between spikes at the different rates are shown following initial adaptation. As the firing rate increases the maximum depth of the AHP decreases, although at these rates this effect is more striking in the S motoneuron. At the slowest firing rate as the membrane voltage returns toward threshold, the models exhibit an asymptotic region which gradually decreases at the faster firing rates. The trajectories are illustrated for voltages up to an absolute value of 10 mV positive to the resting potential of 0 mV. The firing level at all rates was 10.0 mV for the S motoneuron and 11.3 mV for the FR motoneuron.

Simulating human motoneurons 51
where &3k(ss) is the peak conductance of a single synapse (5 nS; [16]) and II is the total number of synapses assigned to that compartment. Each equiva- lent synapse was modelled as a synaptic conductance transient defined by an alpha function with a time to peak conductance of 0.2 ms. The distribution of synaptic input on the equivalent dendrites is shown in jigure 5. Both motoneurons were assigned 300 syn- apses, however, these were represented by 12 or 10 equivalent synaptic conductances in the S and FR type motoneurons respectively. The synaptic conductances were activated synchronously to produce a composite EPSP which was larger and slower in the S type motoneuron. As a means of reducing the size of the composite EPSP, to prevent the motoneurons from firing an action potential in response to an EPSP, the
value of gpeak(ss) was reduced to 1 nS for each synapse. This had the advantage of maintaining the same relative distribution of synaptic input over the equiva- lent dendrite.
As a means of speeding up the simulations it was explored whether current pulses of 1.0 ms duration could be injected into the dendrite to produce pulse potentials (PPs) in the soma that resembled the EPSPs produced by synchronous synaptic activation. This was pursued based on the successful results of Walms- ley and Stuklis [52]. Current pulses were injected into sequential dendritic compartments starting with the compartment connected to the soma. The criteria used match the PPs to the synaptically produced EPSPs was that they should match as closely as possible in amplitude and rise time, two critical factors affecting changes in motoneuron firing probability [ 151. A good match was found when current impulse inputs were given to the third dendritic compartments in both models.
The PP resulting from a 9 nA current pulse input to the S motoneuron had an amplitude of 3.4 mV, a time to peak of 1.6 and a time to half relaxation of 3.0 ms. In the FR motoneuron the PP resulting from a 10 nA current pulse input had an amplitude of 2.5 mV, a time to peak of 1.3 ms, and a half relaxation time of 2.7 ms. At rest, the composite EPSP resulting from the syn- chronous activation of all synaptic conductances in the S motoneuron model (gpeakos) = 1 nS) had an ampli- tude of 3.7 mV and a time to peak of 1.2 ms and a time to half relaxation of 3.4 ms; for the FR motoneuron the amplitude was 2.4 mV, time to peak of 1 .O ms and half relaxation time of 3.4 ms. These EPSPs and PPs were used for all the simulation results reported.
4.7. Noisy membrane simulations
During voluntary isometric contractions in which human subjects are asked to maintain a constant firing rate, the motor unit fires, not with a constant ISI, but
exhibits some level of variability [9,35]. The source of this variability is the ongoing bombardment of the motoneuron by post-synaptic conductances resulting in fluctuation of the motoneuron membrane poten- tial [S]. Variability in the ISIS was incorporated into the simulations in order to determine whether the behaviour of the model motoneurons approximated the human experimental data [23]. This was accomplished by injecting noisy current into various compartments of the motoneuron models. White noise current with a Gaussian distribution of amplitudes was used which had a mean of 0.0 nA and a standard deviation of 20 nA. Injection of this noisy current into dl resulted in membrane potential fluctuations in the soma compart- ment that were similar to those seen in cat motoneu- rons during muscle stretch [6, 8, 11, 181.
4.8. Experimental simulations
The model motoneurons were made to fire rhyth- mically at physiological rates observed in human motoneurons (range 5-20 impulses/s) while synaptic EPSPs or PPs perturbed the firing of the motoneuron yigure 9, top). The protocol used during the simula- tions was similar to that used during human experi- ments [23]. Stimuli, either a current pulse input or synchronous synaptic input, were given randomly with respect to motoneuron spikes with an interstimulus interval between 0.5 and 2 s. Model data, equivalent to 4 min of human data, were simulated in as much as 30 h of computation depending on the model, type of input (synaptic or current pulse) and the presence of noisy current injection.
Spike train data resulting from the simulations were analysed using the same software as used for the real human experiments. In short, PSTHs were constructed between the stimulus (current pulse giving rise to PPs or EPSPs) and the spikes of the model motoneuron (figure 9, bottom). The onset and offset of an excita- tory peak in a PSTH were identified as the first and last bins of a consecutive series of bins in which the number of counts was greater than the mean baseline counts per bin plus 2 SD. The effect of the input on the firing of the motoneuron was quantified in terms of response probability, P, = number of counts in the peak per stimulus above the background [50].
5. Results
In the first section the relationship between EPSPs, membrane voltage trajectories and response probabili- ties are considered for a noiseless membrane. Simula- tions in the absence of membrane noise made it easier to quantify the contributions of membrane voltage and net conductance to motoneuron response, in addition to making computations faster. Later simulations de-

52 Jones and Bawa
Motoneuron Spikes
Excitatory Peak
Figure 9. Random stimulation technique. The top part of the figure illustrates the arrival of current pulses randomly with respect to the timing of the spikes of the motoneuron. The bottom part shows the PSTH constructed between the current pulse placed at time zero and the resulting response of the cell at the time of the peak.
scribe the effects of adding noisy current to generate the stochastic firing characteristic of human motoneu- ron data.
5. I. Noiseless membrane: comparison between EPSPs and PPs and their relationship to changes in jiring probability
5.1. I. EPSPs compared to PPs Current pulses of 9 and 10 nA injected into the third
dendritic compartment of the S and FR motoneurons respectively, resulted in PPs that qualitatively re- sembled the EPSPs. Although the PP resulting from a current pulse injection into the dendrite did not exactly match the EPSP resulting from the synaptic input, the PP input altered the firing probability of the model motoneurons during rhythmic firing in a similar fash- ion to the EPSP input. To a first approximation, the PP input produced similar changes in response probability as that produced by EPSP input which suggested that PPs might be used to simulate changes in firing probability caused by EPSPs.
5.2. Noiseless membrane: Relation between backgroundfiring rate and response probability
To assess the effect of background firing rate on the response probability of a motoneuron to PPs, each model motoneuron was fired at different rates. The
membrane voltage trajectories for S motoneuron at different rates are shown infigure 8 during steady state firing. During rhythmic firing at different rates, current impulses were applied to the motoneurons to generate PPs. If the PP brought the motoneuron to firing threshold, the IS1 was shortened and the subsequent IS1 was typically longer. Otherwise, simulations in the absence of noise exhibited a constant ISI. Figure 10 illustrates the PSTHs computed from simulations in which the S model motoneuron was fired at two different rates in response to the PP input. The excita- tory peak in the PSTHs decreased as the firing rates increased. In the S motoneuron the excitatory peak had an average onset of 1.1 ms and width of 1.2 ms at the two different rates. In the FR motoneuron the excita- tory peak had an average onset and width of 1.0 and 1.3 ms respectively.
The feature of particular interest from the PSTHs in figure IO is the response probability measured from the short latency excitatory peak. As the firing rate of the motoneurons was increased, the response probability to a constant PP input decreased.
5.3. Noiseless membrane: factors contributing to the effect of firing rate on response probability
The advantage of using a noiseless motoneuron in the initial simulations was the ability to examine some deterministic values of membrane voltage during the
Simulating human motoneurons 53
20
1
5.6 imp/s
15 0.6 ns
0 Ir. -50
Peri-Stir&s Time (ms) 5o 5 Filirpg Rate (7&/s) ‘O
Figure 10. Effect of background firing rate on response probability in a noiseless membrane. The figure illustrates PSTHs from the S motoneuron in response to a constant current pulse input when the models are fired at three different firing rates. In each case 175 - 187 stimuli were given randomly with respect to the occurrence of motoneuron spikes over a period of 4 minutes of simulation time. As firing rates increased the peak in the PSTH decreased. S motoneuron (from top to bottom), IS1 = 180 ms, P = 0.57; ISI = 97 ms, P = 0.33; IS1 = 55 ms, P = 0.23. The results for the two model motoneurons are shown graphically on the right.
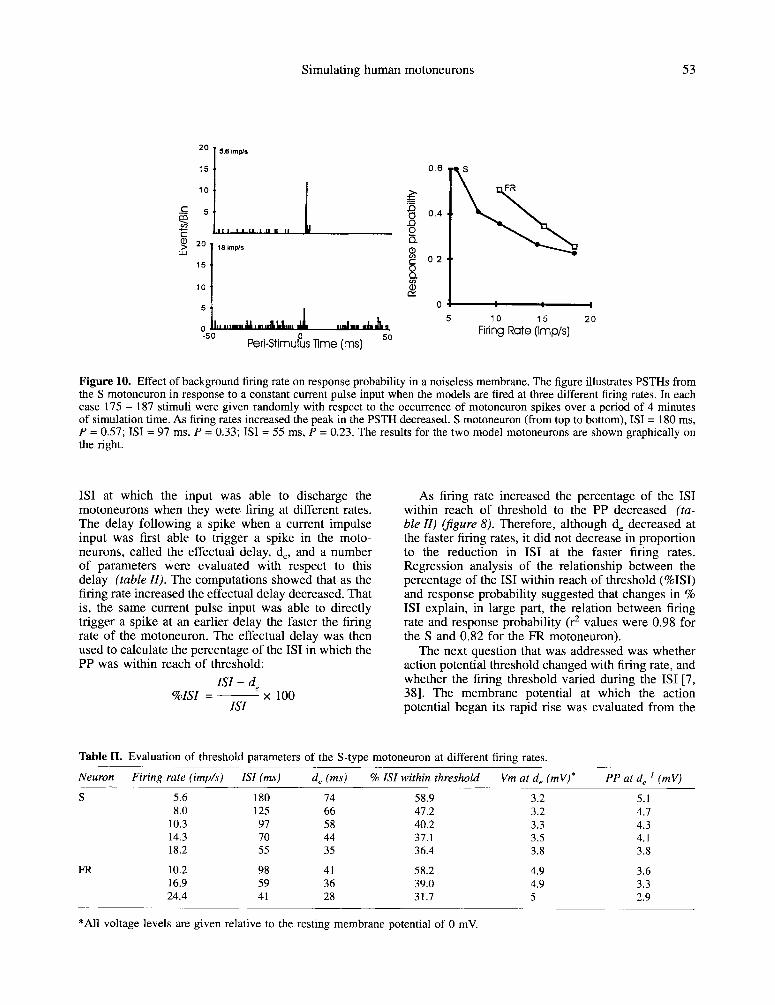
IS1 at which the input was able to discharge the motoneurons when they were firing at different rates. The delay following a spike when a current impulse input was first able to trigger a spike in the moto- neurons, called the effectual delay, d,, and a number of parameters were evaluated with respect to this delay (table ZZ). The computations showed that as the firing rate increased the effectual delay decreased. That is, the same current pulse input was able to directly trigger a spike at an earlier delay the faster the firing rate of the motoneuron. The effectual delay was then used to calculate the percentage of the IS1 in which the PP was within reach of threshold:
ISI - d %ZSZ = i eX 100
ISZ
As firing rate increased the percentage of the IS1 within reach of threshold to the PP decreased (tu- ble ZZ) (jgure 8). Therefore, although d, decreased at the faster firing rates, it did not decrease in proportion to the reduction in IS1 at the faster firing rates. Regression analysis of the relationship between the percentage of the IS1 within reach of threshold (%ISI) and response probability suggested that changes in % IS1 explain, in large part, the relation between firing rate and response probability (r2 values were 0.98 for the S and 0.82 for the FR motoneuron).
The next question that was addressed was whether action potential threshold changed with firing rate, and whether the firing threshold varied during the IS1 [7, 381. The membrane potential at which the action potential began its rapid rise was evaluated from the
Table II. Evaluation of threshold parameters of the S-type motoneuron at different firing rates.
Neuron Firing rate (imp/s) ISI (ms) d, (ms) % ISI within threshold Vm at d, (mV)* PP at d,-’ (mV)
s 5.6 180 74 58.9 3.2 5.1 8.0 125 66 47.2 3.2 4.7
10.3 97 58 40.2 3.3 4.3 14.3 70 44 37.1 3.5 4.1 18.2 55 35 36.4 3.8 3.8
FR 10.2 98 41 58.2 4.9 3.6 16.9 59 36 39.0 4.9 3.3 24.4 41 28 31.7 5 2.9
*All voltage levels are given relative to the resting membrane potential of 0 mV.

54 Jones and Bawa
derivative of the voltage record at the different firing rates, and defined as the firing level [38]. Simulation data showed that the firing level over the range of firing rates tested did not vary much and had a mean value of 10.0 + 0.04 mV (?z SD) in the S motoneuron and 11.3 f 0.10 mV in the FR motoneuron. The membrane potential at the effectual delay was mea- sured at the different firing rates to estimate the distance between membrane voltage and the firing level (table ZZ). In the S motoneuron the average membrane potential at d, was 3.4 f 0.25 mV. However, there was a tendency for the membrane potential at the effectual delay to increase with increasing firing rates. In the FR motoneuron the average membrane potential was 4.9 f 0.06 mV at d,. When the peak amplitude of the PP measured at rest (3.4 and 2.5 mV for the S and FR motoneuron respectively) is added to the mem- brane potential at the effectual delay the sum falls short of the firing level by 3.2 mV in the S motoneuron and 3.9 mV in the FR motoneuron. This would imply that either the PP amplitude was significantly greater dur- ing rhythmic firing or that the threshold for an action potential decreased during the ISI.
To investigate whether the amplitude of the PP elicited by a constant current pulse input varied during rhythmic firing, the size of the PP was measured at sequential times during the ISI at different firing rates. This was done for both model motoneurons with similar results and the results from the S motoneuron are illustrated in jgure Il. The motoneuron was fired repetitively at 10.3 imp/s and a PP was induced at sequential 10 ms delays beginning with a delay of 10 ms following the spike (figure II, top). At a post-spike delay of 10 ms the amplitude of the PP was reduced with respect to that at rest and progressively increased in size at longer delays following the motoneuron spike until a post-spike delay of 50 ms at which the amplitude of the PP had returned to resting values. At a delay of 60 ms the PP was of sufficient magnitude to bring the motoneuron to threshold eliciting an action potential. This same pattern of increasing amplitude of the PP was found in the FR motoneuron during rhythmic firing.
The amplitude of the PP at different post-spike delays was evaluated during rhythmic firing at a number of different firing rates using the same current pulse input to the S motoneuron. The data are plotted in jigure ZZ (bottom) where the ordinate scale is a measure of the PP amplitude with respect to that obtained at rest. The figure shows that PP amplitude is approximately equal for all firing rates at the shortest delay evaluated (10 ms) and reduced considerably as compared to that at rest. As the post-spike delay increased, the rate of change of PP amplitude varied with firing rate in such a way that the faster the firing rate of the motoneuron, the earlier the PP amplitude
0 20 40 60 80
Post-spike Delay (ms)
Figure 11. Change in amplitude of the PP during repetitive firing compared to that at rest. Top, IS1 membrane voltage trajectory when the S motoneuron was firing at approxima- tely 10 imp/s and the PP was induced at various post-spike delays. At short post-spike delays the amplitude of the PP was reduced with respect to that at rest. As the post-spike delay was increased the amplitude of the PP increased until the effectual delay at which the PP triggered a spike. Bottom. The change in PP amplitude with respect to that measured at rest as a function of post-spike delay at five different firing rates. At a post-spike delay of 10 ms the PP is the same size at all firing rates. The rate of change of PP amplitude varies with firing rate as does the maximum value of the PP 1 ms prior to the effectual delay which is represented by the data point at the longest post-spike delay for each firing rate.
returned to resting values. The final values for relative PP amplitude were evaluated at a post-spike delay 1 ms prior to the effectual delay (the absolute values for both the S and FR motoneurons are given in table ZZ). The slower the firing rate the greater the relative

Simulating human motoneurons 55
amplitude of the PP prior to the effectual delay. Two points may be made here: firstly, at the same post- spike delay, PP is larger at the faster firing rate; secondly, at d, the PP is larger at the slower firing rate. These observations are useful for interpreting the results from human motoneurons.
The results from the FR motoneuron were similar to those from the S motoneuron, that is, at a post-spike delay of 10 ms the amplitude of the PP with respect to rest was similar at all rates tested. However the decrease in amplitude at a post-spike delay of 10 ms was significantly greater for the S motoneurons, 0.62 f 0.02, then for the FR motoneuron, 0.78 f 0.02 (r-test, P < 0.001). Adding the amplitude of the PP immedi- ately prior to the effectual delay to the membrane potential at the effectual delay gave an average value of 7.8 f 0.3 mV for the S motoneuron and 8.2 f 0.3 mV for the FR motoneuron. These values are still, on the average, more than 2-3 mV shy of the control firing levels of 10.0 and 11.3 mV for the S and FR motoneurons respectively. This result implies that the firing level varied with time during the ISI.
5.4. Effects of noisy membrane on rhythmic jring and response probability at diRerent jiring rates
Interspike interval histograms were constructed when noisy current with a constant standard deviation off 20 nA was added to the current necessary to elicit repetitive firing at different rates. For each of the two models as the IS1 decreased, or firing rate increased, variability in IS1 decreased as is typical of the human data. However, there were differences between the two neurons. Variability in IS1 did not depend on the IS1 but rather on the values of the single spike AHP (table I), i.e., on the intrinsic property of each moto-
neuron. At the fastest firing rate shown for the two neurons, the coefficient of variation (c.v.) of IS1 was 0.08 for both when ISIS were 45% of respective AHP durations (721160 for S and 41/90 for FR). On the other hand, when IS1 was the same for S and FR (72 ms), C.V. was greater for the FR (right middle panel) compared to that for the S (left bottom panel).
The effects of firing rate on response probability for a noisy membrane were simulated. The results are very similar to their noiseless counterparts (jgure 10). In the S motoneuron the excitatory peak had an average onset of 1.2 ms and width of 1.8 ms at the three different firing rates. In the FR motoneuron the exci- tatory peak had an average onset and width of 1.2 and 1.4 ms respectively. These values for peak onset and width are slightly larger than those reported for the models in the absence of noise input. Another differ- ence between PSTHs computed in the presence and absence of noise is exhibited in the period of decreased firing probability following the peak. The PSTHs
showed sporadic counts following the peak which is more typical of PSTHs from human motoneurons. As with the noiseless simulations, the main feature of interest was response probability which was greatest when the motoneurons were firing at the slowest rates, and in this case, with the greatest IS1 variability. As the firing rates increased there was a tendency for the response probability to decrease. The inverse relation- ship between response probability and firing rate seen in jigure 10 (right) was qualitatively similar in the presence of noise. At faster firing rates the response probability to a constant input decreased in both motoneurons in the presence or absence of noise. However, at a given firing rate, the response probabil- ity to the same input was lower in the presence of noise.
6. Discussion
Human experiments on both the slow and the fast motoneurons produced conflicting results. The excit- ability was higher at the faster firing rates with triggered mode of stimulation while it was lower at the faster firing rates with random mode of stimulation. The results were explained by simulating the human experiments on computer models based on actual properties of cat motoneurons. Even though the initial model is simple, the results of simulations are encour- aging.
6.1. Validity of the models
The first question that must be asked, and answered, is whether the models realistically simulate the prop- erties of cat motoneurons? The underlying philosophy behind these models was that they should be simple, and yet retain the some of the essential input/output characteristics of motoneurons [43]. The models suc- ceeded in doing this by incorporating some of the morphological, electrotonic, synaptic and single spike AHP features of adult cat spinal motoneurons [12, 17, 44, 491. Following the tuning of the models to repro- duce single spike AHPs, the models were able to simulate flI curves with steady state characteristics similar to cat motoneurons. Furthermore, the relative differences between the two models in minimal rhyth- mic firing rates, thresholds to current step injection and slopes of the f/I curves were appropriate relative to S and FR-type cat motoneurons (figure 2; [26]). The trajectories of the AHPs during repetitive firing showed similar stereotypical changes to those de- scribed for cat motoneurons with increasing firing rates (jigure 8). That is, increased firing rates were accompanied by a decrease in the depth of the AHP [2, 3, 411. However, the asymptotic nature of the AHP trajectories at very low firing rates have not always

56 Jones and Bawa
been observed in the cat. Either the noise masked the shape, or the lowest rhythmic firing rates at which the asymptotes are very obvious, were rarely recorded. The asymptotic shapes are essential in producing the rate effects observed with random stimulation. The models also demonstrated variation in voltage thresh- old along the IS1 that has been reported in cat motoneurons [7] and has also received previous theo- retical attention [37].
6.1. I. ISI variability at different jiring rates Another important feature of the models was the
successful simulation of IS1 variability. The injection of white noise current into the dendritic compartment, dl, of the motoneuron models resulted in variation of the ISIS to a constant depolarizing step current injected into the soma. The relative variations in the ISIS at different firing rates, measured by the coefficient of variation, is compared for the models and human soleus and FCR motoneurons in table Ill. The changes in the coefficient of variation with firing rate were similar for human soleus motoneurons and the S-type model, and for FCR motoneurons and the FR-type model. However, the coefftcients of variation at any one firing rate, were notably different between the slow (model S or human soleus) and the fast (model FR or human FCR) motoneurons. This has been recently pointed out in human experiments ex- amining the variation of interspike intervals [29].
The difference between the coefficients of variation at different firing rates is most likely due to differences in the asymptotic regions of the AHP trajectories reflected by their minimal rhythmic firing rates. For example, the minimal rhythmic firing rate of the S-type model was 5.3 imp/s while that for human FCR motoneurons was between 7-8 imp/s. At the minimal rhythmic firing rate the coefficients of variation are relatively high and decrease as rates increase. The relatively high coefficient of variation at minimal rhythmic firing rate is most likely due to an asymptotic portion of the membrane potential later in the ISI (jigure 8). This asymptotic region with low input conductance (jigure II), is very sensitive to fluctua- tions in membrane potential. In the model motoneu- rons, as firing rates increased the asymptotic region gradually decreased making the cells less sensitive to membrane noise, and hence, less variability in the ISIS [29].
6.2. Limitations of the models
While the models simulated many features of mo- toneurons that were of interest, there were other details of motoneuron response properties that were not incorporated in the models. The main point of diver- gence between the active properties of the models and real motoneurons lies in the simulation of the conduc-
Table III. Comparison of the coefficients of variation between the model and human data at different firing rates.
Firing rate Coe$rcient of variation (imp/s)
S-type Soleus FR-type FCR model model
5 0.27 0.27 _ _ 8 0.14 0.15 0.37 0.30
11 0.09 _ 0.22 0.16 20 _ _ 0.1 _
tances responsible for the afterhyperpolarization (AHP). This process is likely mediated by a Ca2+-activated K+ channel(s) in motoneurons [28, 481 as in many other neurons [40]. However, there is very little experimental data available to realistically model this current and the associated Ca” currents in adult cat spinal motoneurons. Previous modelling studies have been able to reproduce many of the characteris- tics of motoneuron firing by using simple time- dependent [2, 31 or voltage- and time-dependent [37, 461 slow K+ conductances similar to that used in the present simulations.
Also, the models failed to reproduce in full detail the dynamic discharge behaviour of motoneurons. While there was some degree of adaptation present in the models to step current inputs, the first interval f/I relations in the models were lower than those obtained in real motoneurons [25, 261. This may, in part, be due to the higher than average slope of the steady-state fYI relation in the models (figure 3; cf. 1261). As pointed out by Powers [37], a model’s early time course of the AHP trajectory may play a role in the discharge characteristics of motoneurons. This early phase of the AHP in the present models is controlled primarily by the outward currents generated by the fast and slow K+ channels. This phase of the AHP in real cat motoneu- rons may also depend on inward currents producing the delayed depolarization [32] which has been impli- cated in doublet discharges [7]. We did not attempt to model these parameters of motoneuron behaviour in the present simulations as they did not seem critical to the questions addressed, however, this certainly is an area for improvement in future models.
6.3. Simulation of human results
Once the models were able to simulate many of the features of cat motoneurons, they were used to simu- late experiments done on human motoneurons. It was important to determine whether the results obtained in the human motoneurons studies could be confidently attributed to the properties of the motoneuron, or, if not, whether a different motoneuron model [l], or some other spinal mechanisms such as presynaptic

Simulating human motoneurons 57
inhibition or Renshaw inhibition would help explain the effects seen with voluntary changes in background firing rate [23].
6.3.1. Inverse relation between background firing rate and response probability
The motoneuron models showed an inverse rela- tionship between background firing rate and response probability to a randomly elicited transient input. Similar predictions have been made with the model proposed by Piotrkiewicz et al. [36]. The faster the firing rate of the model neurons the lower the response probability to a constant input. This effect of firing rate on response probability, or ‘rate effect’, was present in the models in the presence and absence of noise.
In the noiseless motoneuron, it is clear that both the membrane voltage and the membrane conductance determined the excitability of the cell. With the same input, the PP increased monotonically during the IS1 starting with a relatively small value near the spike. At the same post-spike delay, the PP was smaller at the slower firing rate. The smaller PP added to the lower membrane potential at a specific post-spike delay would result in a lower response probability at the slower firing rate. However, during random stimula- tion the motoneuron is responsive for a larger percent- age of the IS1 when it is firing at a slow rate than when it is firing at a faster rate leading to a higher response probability at the slow rate. This higher response probability at slow firing rates may be attributed to the asymptotic nature of the membrane voltage trajectory and low values of conductance in the latter part of the ISI. We submit that this reasoning on the origin of the ‘rate effect’ also holds for simulations in the presence of noise.
Important factors which determine the magnitude of the rate effect are the depth and duration of the asymptotic region of the AHP during repetitive firing. The lack of rate effect reported by Ashby and Zilm [I] for tibialis anterior motoneurons may be due to the firing rates used, but most probably is due to very low P values as a result of weak peripheral stimuli. When higher P values were used with corticospinal volleys, results from the same laboratory [51] reported the inverse relationship seen in the present modeling and previous human results [23, 341.
Another difference between the human results re- porting lack of rate effect [ 1, 301 and results from our laboratory [23, 341 (present results) is the difference in quantification of response probability. The original work by Ashby and Zilm [l] did not account for differences in background probability levels when quantifying the short latency excitatory peak. Simi- larly, the normalization procedure used by Miles and coworkers [30] is questionable (see Jones and Bawa [23] for discussion). Similar studies done on cat
motoneurons [15] would suggest that the relative size of the peak above baseline should be further normal- ized for background firing rate. That is, response probability as calculated in the present study should be normalized by dividing by firing rate. However, it should be said that such normalization would enhance the inverse relationship between firing rate and re- sponse probability seen in the human data and the present results.
63.2. Results of triggered stimulation When stimuli were applied randomly with respect
to motoneuron spikes, Jones and Bawa [23] and Olivier et al. [34] reported the inverse relationship between response probability and firing rate with composite la EPSPs and complex corticospinal EPSPs, respectively. However, when stimuli were applied at a fixed time with respect to the motoneuron spike, response probability was higher at the faster firing rate. As mentioned above, two factors contribute to this. Firstly, at a fixed time following the spike, the membrane voltage trajectory of the AHP is always lower at the slower rate which would lead to a lower P value. Secondly, at a fixed time following the spike, the same synaptic current would produce a smaller EPSP at the slower rate. When comparing excitability of the motoneuron at the same post-spike time at two different firing rate, the two factors, the depth of AHP and EPSP size, both favor a higher response probabil- ity at the faster firing rate.
6.4. Signzjicance
These simulations support the idea that the repeti- tive firing behaviour of human motoneurons may be represented by biophysical processes which are similar to those that underlie repetitive firing in cat motoneu- rons. Thus the need for a model of human motoneu- rons that is different from cat motoneurons is sup- planted. The results of this study also have implications for the estimation of EPSP size in human studies [33]. This is usually done by measuring the excitatory peak of a PSTH. The amplitude of this peak is not only dependent on the size of the EPSP, but will also be affected by the background firing rate of the motoneuron and perhaps the type of motoneuron being recorded. For example, in the present study a smaller EPSP was generated in the FR motoneuron by the equivalent of 300 la synapses compared to that pro- duced in the S motoneuron. Yet, at a similar firing rate, the response probability was greater in the FR moto- neuron. This would imply that in order to compare responses to a given input in different motoneurons one would have to account for the underlying post- spike afterhyperpolarization [29].

58 Jones and Bawa
That the rate effect previously described for human motoneurons is likely to be mediated by the intrinsic properties of the motoneuron is supported by these simulations. However, the contribution of spinal inter- neuronal circuits cannot be dismissed as having no influence on the human results.
Acknowledgments
This work was supported by grants from the British Columbia Health Research Council (BCHRF) and the Natu- ral Sciences and Engineering Research Council of Canada (NSERC) to P. Bawa and a NSERC postgraduate scholarship to K.E. Jones.
References
L11
121
[31
[41
[51
[61
[71
WI
[91
LlOl
[Ill
[121
[I31
u41
Ashby P., Zilm D., Characteristics of postsynaptic potentials produced in single human motoneurons by homonymous group I volleys, Exp. Brain Res. 47 (1982) 4148.
Baldissera F., Gustafsson B., Firing behaviour of a neurone model based on the afterhyperpolarization conductance time course. First interval firing, Acta Physiol. Stand. 91 (1974) 528-544.
Baldissera E. Gustafsson B., Firing behaviour of a neuron model based on the afterhyperpolarization conductance time course and algebraic summation. Adaptation and steady state firing, Acta Physiol. Stand. 92 (1974) 2747.
Barrett E.F., Barrett J.N., Crill W.E., Voltage-sensitive out- ward currents in cat motoneurones, J. Physiol. (Land.) 304 (1980) 251-276.
Barrett J.N., Crill W.E., Voltage clamp of cat motoneurone soma: properties of the fast inward current. J. Physiol. (Land.) 304 (1980) 231-249.
Calvin W.H., Motoneuron Input-Output Mechanisms: Analy- sis by Intracellular Recording, Ph.D. Thesis, University of Washington, Seattle, WS, USA, 1966.
Calvin W.H., modes of repetitive firing and the role of threshold time course between spikes, Brain Res. 69 (1974) 341-346.
Calvin W.H., Stevens CF., Synaptic noise and other sources of randomness in motoneuron interspike intervals, J. Neuro- physiol. 31 (1968) 574-587.
Clamann H.P., Statistical analysis of motor unit firing patterns in a human skeletal muscle, Biophys. J. 9 (1969) 1233-125 1.
Clements J.D., Redman S.J., Cable properties of cat spinal motoneurones measured by combining voltage clamp, current clamp and intracellular staining, J. Physiol. (Land.) 409 (1989) 63-87.
Cope T.C., Fetz E.E., Matsumura M., Cross-correlation as- sessment of synaptic strength of single fiber connections with triceps surae motoneurones in cats, J. Physiol. (Land.) 390 (1987) 161-188.
Cullheim S., Fleshman J.W., Glenn L.L., Burke R.E., Mem- brane area and dendritic structure in type-identified triceps surae alpha motoneurons, J. Comp. Neural. 255 (1987) 68-81.
DeSchutter E., Computer software for development and simu- lation of compartmental models of neurons, Comp. Biol. Med. 19 (1989) 71-81.
Dodge F.A.. Cooley J.W., Action potential of the motomeu- ron, IBM J. Res. Dev. 17 (1973) 219-229.
Ll51
[I61
[I71
[I81
1191
WI
1211
WI
1231
1241
P51
WI
~271
1281
~291
[301
1311
[321
[331
[341
(351
Fetz E.E., Gustafsson B., Relation between shapes of post- synaptic potentials and changes in firing probability of cat motoneurons, J. Physiol. (Lond.) 341 (1983) 387410.
Finkel A.S.. Redman S.J., The synaptic current evoked in cat spinal motoneurones by impulses in single group la axons, J. Physiol. (Lond.) 342 (1983) 615432.
Fleshman J.W.. Segev I., Burke R.E., Electrotonic architecture of type-identified a-motoneurons in the cat spinal cord, J. Neurophysiol. 60 (1988) 60-85.
Gustafsson B., McCrea D., Influence of stretch-evoked syn- aptic potentials on firing probability of cat spinal motoneu- rones, J. Physiol. (Lond.) 347 (1984) 431451.
Hodgkin A.L., Huxley A.F., A quantitative description of membrane current and its application to conduction and excitation in nerve, J. Physiol. (Lond.) 117 (1952) 500-544.
Jones K.E., The Physiology and Simulation of a-Motoneurons in the Human Spinal Cord, Ph.D. Thesis. Simon Fraser University, Bumaby, B, 1995.
Jones K.E., Bawa I?, Active membrane models of type- identified cat spinal motoneurons, Can. J. Physiol. Pharmacol 74 (1996) Axvi.
Jones K.E., Bawa P., Simulating human data with a motoneu- ron model, Can. J. Physiol. Pharmacol. 74 (1996) Axvii.
Jones K.E., Bawa P., Responses of human motoneurons to Ia inputs: effects of background firing rate, Can. J. Physiol. Pharmacol. 73 (1995) 1224-1234.
Jones K.E., Calancie B., Hall A., Bawa P., Time course of excitability changes of human a-motoneurones following single spikes and doublets, in: Taylor A., Gladden M.. Durbaba R. (Eds.), Alpha and Gamma Motor Systems, Ple- num Press, New York, NY, 1995, pp. 103-105.
Jones K.E., Bawa P., Computer simulation of the responses of human motoneurons to composite Ia EPSPs: Effects of back- ground firing rate, J. Neurophysiol. 77 (1997) 405420.
Kernel1 D.. High-frequency repetitive firing of cat lumbosac- ral motoneurones stimulated by long-lasting injected currents, Acta Physiol. Stand. 65 (1965) 74-86.
Kernel1 D.. The limits of firing frequency in cat lumbosacral motoneurones possessing different time course of afterhyper- polarization, Acta Physiol. Stand. 65 (1965) 87-100.
Krnjevic K., Puil E., Werman R.. EGTA and motoneuronal after potentials, J. Physiol. (Land.) 275 (1978) 199-223.
Matthews P.B.C., Relationship of firing intervals of human motor units to the trajectory of post-spike afterhyperpolariza- tion, J. Physiol. (Lond.) 492 (1996) 5977628.
Miles TX, Turker KS., Le T.H., Ia reflexes and EPSPs in human soleus motor neurons, Exp. Brain Res. 77 (1989) 628-636.
Moore J.W., Ramon F., On numerical integration of the Hodgkin and Huxley equations for a membrane action poten- tial, J. Theor. Biol. 45 (1974) 249-273.
Nelson P.G., Burke R.E., Delayed depolarization in cat spinal motoneurons, Exp. Neural. 17 (1967) 16-26.
Olivier E., Bawa P., Lemon R.N., Excitability of human upper limb motoneurones during rhytmic discharge tested with transcranial magnetic stimulation, J. Physiol. (Land.) 485 (1995) 257-269.
Palmer E., Ashby P., Corticospinal projections to upper limb motoneurones in humans, J. Physiol. (Land.) 448 (1992) 397412.
Person R.S., Kudina L.P., Discharge frequency and discharge pattern of human motor units during voluntary contraction of muscle, EEG Clin. Neurophysiol. 32 (1972) 471-483.

Simulating human motoneurons 59
1361
1371
1381
[391
[401
[411
[421
[431
r441
Piotrkiewicz M., Churikova L., Person R., Excitability of single firing human motoneurons to single and repetitive stimulation (experiment and model), Biol. Cyber. 66 (1992) 253-259.
Powers R.K., A variable-threshold motoneuron model that incorporates time- and voltage-dependant potassium and cal- cium conductances, J. Neurophysiol. 70 (1993) 246-262.
Reyes A.D., Fetz E.E., Two modes of interspike interval shortening by brief transient depolarizations in cat neocortical neurons, .I. Neurophysiol. 69 (1993) 1661-1672.
Rall W., Core conductor theory and cable properties of neurons, in: Kandel E.R., Brookhart J.M., Mountcastle V.B. (Eds.), The Handbook of Physiology, The Nervous System, Bethesda, MD, American Physiological Society, I 1981, pp. 39-97.
Sah P, Caz+-activated K+ currents in neurones: types, physio- logical roles and modualtion, TINS 19 (1996) 150-154.
Schwindt P.C., Calvin W.H., Membrane-potential traiectories between spikes underlying motoneuron tiring rates, f Neuro- physiol. 35 (1972) 31 l-325.
Schwindt PC., Calvin W.H., Nature of conductances under- lying the rhythmic firing in cat spinal motoneurons, J. Neu- rophysiol. 36 (1973) 955-973.
Segev I., Single neuron models: oversimple, complex and reduced, TINS 15 (1992) 414-421.
Segev I., Fleshman J.W., Burke R.E., Computer simulation of group la EPSPs using morphologically realistic models of cat a-motoneurons, J. Neurophysiol. 64 (1990) 648660.
[451
[461
[471
[481
[491
[501
[511
~521
Segev I., Fleshman J.W., Miller J.P., Bunow B., Modeling the electrical behavior of anatomically complex neurons using a network analysis program: passive membrane, Biol. Cybem. 53 (1985) 27-40.
Traub R.D., Motoneurons of different geometry and the size principle, Biol. Cybem. 25 (1977) 163-176.
Traub R.D., Llinls R., The spatial distribution of ionic conductances in normal and axotomized motomeurons, Neu- roscience 2 (1977) 829-849.
Zhang L., Kmjevic K., Apamin depresses selectively the after-hyperpolarization of cat spinal motoneurones, Neurosci. Lett. 74 (1987) 58-62.
Zengel J.E., Reid S.A., Sypert G.W., Munson J.B., Membrane electrical properties and prediction of motor-unit type of medial gastrocnemius motoneurons in the cat. J. Neuro- physiol. 53 (1985) 1323-1344.
Bawa P., Lemon R.N., Recruitment of motor units in response to transcranial magnetic stimulation in man, J. Physiol. (Land.) 471 (1993) 445-464.
Brouwer B., Ashby P., Midroni G., Excitability of corticospi- nal neurons during tonic muscle contractions in man, Exp. Brain Res. 74 (1989) 649-652.
Walmsley B., Stuklis R., Effects of spatial and temporal dispersion of synaptic input on the time course of synaptic potentials, J. Neurophysiol. 61 (1989) 681687.