Embed Size (px)
Citation preview

A Comparison of Flexural Strength of Reinforced Concrete Beams by Different Design Codes
1st Leonardus Setia Budi Wibowo Civil Engineering
Universitas Widya Kartika Surabaya, Indonesia
2nd Agustinus Angkoso Civil Engineering
Universitas Widya Kartika Surabaya, Indonesia
Abstract—Design building codes are primary book for structural design engineers to calculate flexural strength. In the design building codes, concrete has important parts. Those are rectangular stress block model and compression strain. This paper evaluates flexural strength of the reinforced concrete beams using six different design approaches like ACI 318-14, AS3600-2009, CAN-A23.3-04, fib Model Code 2010, JSCE 2010 and NZS 3101:2006. Thirty-five test of reinforced concrete beam specimens in this database were tested under four-point monotonic loading. Compressive strength of the concrete is in the range of 18 - 55 MPa and shear span-to-depth ratio is in the range 3 - 5. Based on limited database, the rectangular stress block and compressive strain proposed by fib Model Code 2010 resulted in a mean ratio of the predicted nominal flexural strengths to measure flexural strengths close to 1.0 with a small standard deviation and coefficient of variation. In other hand, the model proposed by CAN-A23.3-04 provides the most conservative estimation.
Keywords—flexural, strength, beams, stress, strain
I. INTRODUCTION
Reinforced concrete is one of the most popular building materials used in the construction. Many structures and infrastructures use reinforced concrete as the main material for low-rise buildings, high-rise buildings, bridges, high-ways and U-ditch. According to the database from the Council on Tall Buildings and Urban Habit (CTBUH) [1], as presented in Fig. 1 showed the percentages of different construction materials that have been used in the world for building with more than 150 m height in two different years. There are six types of construction materials shown in Figure 1, including steel, concrete, composite, precast, concrete/steel and steel/concrete. Based on definition given by CTBUH, concrete refers to building whose the main structural elements are constructed by reinforced concrete (RC). It can be noted that the percentage of RC structures has increased from 39% to 68% in the past two decades.
(a) 1999 (b) 2019
Fig.1. Percentages of different structural materialsused in building with more than 150 m height [1]
Design codes are primary book for structural design engineers to estimates flexural strength. One of the parts of the flexural strength is concrete strength. In the design codes, concrete has important parts, namely compression zone stress block model and compression strain. Different country has different equation to calculate flexural capacity. The objectives of this research are to review the building codes and compare the flexural strength in six different building codes: ACI318-14 [2], AS3600-2009 [3], CAN-A23.3-04 [4], fib Model Code 2010 [5], JSCE 2010 [6], and NZS 3101:2006 [7]. The motivation of this paper is not only to find the closest result based on different design codes, but also the ratio (experiment vs. design) for each test specimen with the results of conservative beam level is flexural strength for each code which can be seen clearly. The direction of this research is to suggest flexural strength capacity equation for normal-strength concrete to be use by engineers in practice to design reinforced concrete members with compressive strength less than 55 MPa, especially for Indonesian building code.
II. LITERATURE REVIEW
The concept of using the equivalent rectangular stress distribution was first suggested by Emperger [8] and then modified by Whitney [9] for application to ultimate strength design and later experimentally verified by Hognestad et al. [10] and Mattock et al. [11]. The ultimate flexural strength is assumed to occur at a particular value of extreme fiber concrete strain, cu. The rectangular stress block (illustrated in Fig. 2) is defined by two parameters, 1 is ratio between the stress of the rectangular block and the maximum stress and 1 is factor related to the depth of equivalent rectangular compressive stress block to neutral axis depth. Ultimate concrete compressive strength is another significant variable in the ultimate strength design. Mattock et al. [11] concluded that the value of 0.003 is a reasonably conservative value for ultimate strain of concrete. Some design codes (NZS 3101:2016, ACI318-14 and AS3600-2009) accepted this value.
Fig. 2. Equivalent Rectangular Stress Block
f c'
EquivalentStress Block
c c
f c'
Neutral Axis
Beam Section Stress Distribution
f s
Third International Conference on Sustainable Innovation 2019 – Technology and Engineering (IcoSITE 2019)
Copyright © 2019, the Authors. Published by Atlantis Press. This is an open access article under the CC BY-NC license (http://creativecommons.org/licenses/by-nc/4.0/).
Advances in Engineering Research, volume 187
62

Table I summary of various recommendations for the stress block parameters (1 and 1) and cu from various international design building codes.
TABLE I. SUMMARY OF STRESS BLOCK MODELS FROM BUILDING CODES
Building Code
α1 (��
� in MPa) b
1
(��� in MPa)
εcu
ACI318-14 [2]
0.85
0.85, fc' ≤ 28
0.85-0.05 (fc' -28/7)
≥ 0.65
0.0030
AS3600-2009 [3]
1.0-0.003fc’ ,
0.67 ≤ α1 ≤ 0.85
1.05-0.007fc’ ,
0.67 ≤ 1 ≤ 0.85
0.0030
CAN-A23.3-04 [4]
0.85-
0.0015fc' ≥ 0.67
0.97-0.0025fc' ≥ 0.67 0.0035
fib Model Code 2010
[5]
1.00, fc' ≤ 50
1.00- (fc' -50)/200,
50 < fc' ≤ 90
0.8, fc' ≤ 50
0.8- (fc' -50)/400
50 < fc' ≤ 90
0.0035, fc' ≤ 50
0.0026+
0.035 �90 − fc
'
100�
4
JSCE 2010 [6]
1-0.003fc' ≤ 0.85 0.52 − 80εcu
�155-f
c'
30000�
0.0025 ≤ εcu ≤ 0.0035
NZS 3101: 2006 [7]
0.85, fc' ≤ 55
0.85-0.004 (fc' -55)
≥ 0.75
0.85, fc' ≤ 30
0.85-0.008 (fc' -30)
≥ 0.65
0.003
Metwally [12] evaluated 53 singly-reinforced concrete beams tested by Pam et al. [13], Bernardo and Lopes [14], Sarkar et al. [15] and Ashour [16]. These beams have been compared to the predictions by seven different codes. Based on 53 beam specimens, CEB/FIP Model MC 90 code [17] present the best prediction with the smallest scatter.
III. METHODOLOGY
A total of 35 reinforced concrete beam specimens with rectangular cross section were collected, using conventional-strength concrete and had two layers of longitudinal reinforcement, compression and tension longitudinal reinforcement. All specimens were tested under a four-point loading experimental setup, as shown in Fig. 3. The two concentrated loads were applied symmetrically from the midspan.
Fig. 3. Typical experimental setup
The range of material properties for the collected beam specimens are listed as follows: shear span-depth ratio (a/d): 3.00 – 4.96; concrete cylinder strength (fc’): 18 – 55 MPa; tension longitudinal reinforcement yield strength (fy): 377 – 540 MPa; transverse reinforcement yield strength (fyt): 250 – 541 MPa; minimum diameter of transverse reinforcement: D10; and Vn,ACI.a/Mn,ACI 1, where Vn,ACI is specimen nominal shear strength using tested material properties based on
ACI318-14, Mn,ACI is specimen nominal moment capacity using tested material properties based on ACI318-14, P is load, a is shear span and d is effective depth. Material properties to determine the yield of flexural strength used elastic-plastic behavior for steel. Detail of beam specimen is presented in Table II.
TABLE II. TABLE OF SPECIMENS DETAIL
Beam name fc
' b d fy tens. (%)
fyt a/d
(MPa) (mm) (mm) (MPa) (MPa) B1 [18] 22.6 270 340.7 484 0.97 507 3.82
Control [19] 55.2 152 198.5 419 1.32 419 4.23 5 F-C [20] 45.4 203 252.7 489 0.74 469 3.32
Monotonic 3 m [21]
37.0 150 260.3 511 1.79 411 4.23
B-U [22] 21.0 300 395.7 506 0.67 518 4.30 ALII [23] 27.0 250 352.5 528 0.68 533 4.26 AMI [23] 34.0 250 354.1 525 0.43 533 4.24 AMII [23] 34.0 250 352.5 528 0.68 533 4.26 AMIII [23] 34.0 250 350.9 512 0.98 533 4.27 Control [24] 31.3 200 255.7 426 0.42 426 4.11
ST-4 [25] 40.8 200 222.4 460 0.90 460 3.93 N0-0.5 [26] 38.6 135 230.7 377 0.46 377 3.90 N0-1.0 [26] 38.6 135 229.1 408 0.82 377 3.93 N0-1.5 [26] 38.6 135 227.5 389 1.29 377 3.96 N0-1.8 [26] 38.6 135 225.9 411 1.88 377 3.98 CB1 [27] 20.7 150 178.3 415 0.85 415 3.08
CONTR [28] 31.9 150 209.1 531 0.81 443 4.16 A111 [29] 42.8 250 357.9 460 1.23 541 3.35 R2C [30] 18.0 150 215.7 435 0.78 435 3.71 R3C [30] 18.0 150 215.7 435 1.17 435 3.71 ST [31] 45.5 165 200.0 430 1.07 430 4.25 RB [32] 48.6 200 262.0 490 0.76 490 4.96 B1 [33] 48.6 304.8 400.1 438 0.70 432 4.57
AN24-0.3 [34]
32.4 200 260.0 483 1.02 482 4.00
AN24-0.5 [34]
32.4 200 260.0 477 1.46 482 4.00
F-AN [35] 31.7 200 300.5 430 1.27 453 3.99 C1 [36] 32.9 300 400.0 484 2.16 414 4.00 C2 [36] 33.2 300 400.0 484 2.16 414 4.00
4B4-0.7(C0.2)
[37] 41.0 140 206.9 450 2.67 395 4.06
4B4-0.7(C0.3)
[37] 41.0 140 206.9 450 2.67 395 4.06
Reference [38]
42.3 200 260.5 540 1.21 250 4.61
CTRL [39] 35.4 200 305.5 390 1.54 295 3.93 CTRL [40] 52.5 200 300.0 477 1.05 452 3.00
A [41] 35.0 300 501.1 500 0.87 450 3.99 Ref [42] 50.6 200 262.5 496 0.76 496 4.95
IV. RESULTS AND ANALYSIS
In this section, the Vexp/Vmn ratio of 35 test results of reinforced concrete beams with normal strength concrete are presented and compared with the predictions of the above code equations. Table III shows the value of the ratio between experimental and theoretical results.
l
L
aa
P PBeamspecimen
Advances in Engineering Research, volume 187
63
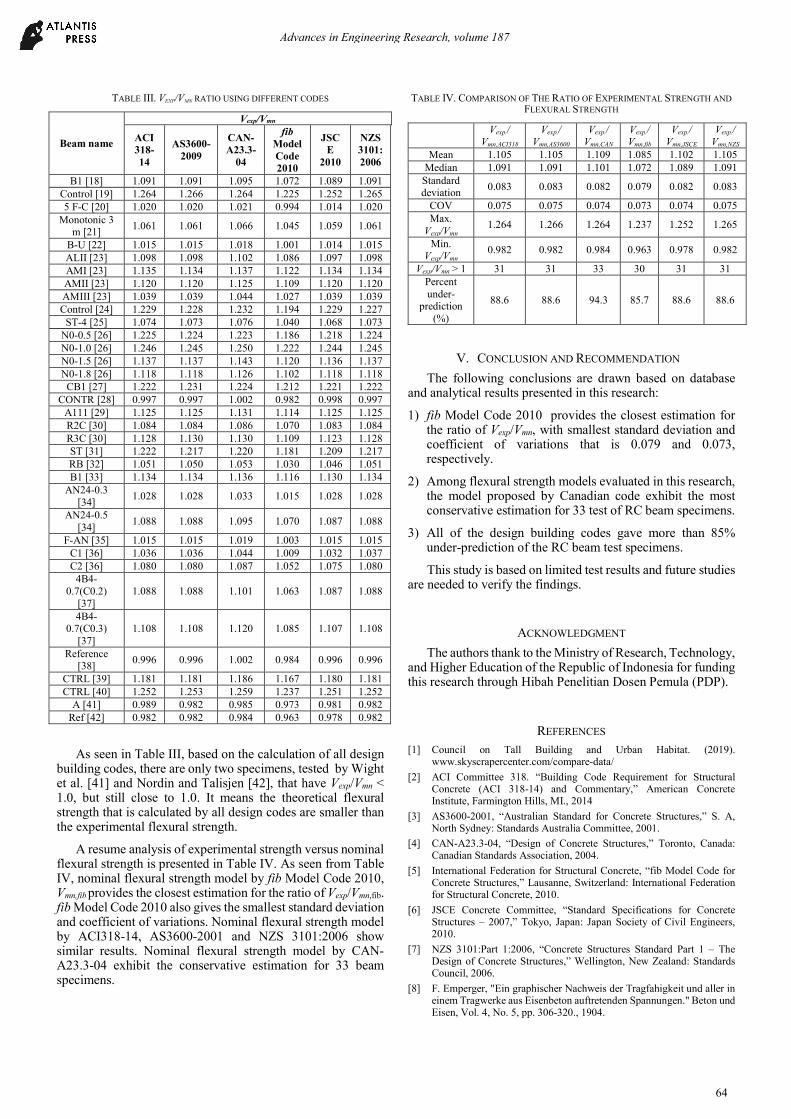
TABLE III. VEXP/VMN RATIO USING DIFFERENT CODES
Beam name
Vexp/Vmn
ACI 318-14
AS3600-2009
CAN-A23.3-
04
fib Model Code 2010
JSCE
2010
NZS 3101:2006
B1 [18] 1.091 1.091 1.095 1.072 1.089 1.091 Control [19] 1.264 1.266 1.264 1.225 1.252 1.265 5 F-C [20] 1.020 1.020 1.021 0.994 1.014 1.020
Monotonic 3 m [21]
1.061 1.061 1.066 1.045 1.059 1.061
B-U [22] 1.015 1.015 1.018 1.001 1.014 1.015 ALII [23] 1.098 1.098 1.102 1.086 1.097 1.098 AMI [23] 1.135 1.134 1.137 1.122 1.134 1.134 AMII [23] 1.120 1.120 1.125 1.109 1.120 1.120 AMIII [23] 1.039 1.039 1.044 1.027 1.039 1.039 Control [24] 1.229 1.228 1.232 1.194 1.229 1.227
ST-4 [25] 1.074 1.073 1.076 1.040 1.068 1.073 N0-0.5 [26] 1.225 1.224 1.223 1.186 1.218 1.224 N0-1.0 [26] 1.246 1.245 1.250 1.222 1.244 1.245 N0-1.5 [26] 1.137 1.137 1.143 1.120 1.136 1.137 N0-1.8 [26] 1.118 1.118 1.126 1.102 1.118 1.118 CB1 [27] 1.222 1.231 1.224 1.212 1.221 1.222
CONTR [28] 0.997 0.997 1.002 0.982 0.998 0.997 A111 [29] 1.125 1.125 1.131 1.114 1.125 1.125 R2C [30] 1.084 1.084 1.086 1.070 1.083 1.084 R3C [30] 1.128 1.130 1.130 1.109 1.123 1.128 ST [31] 1.222 1.217 1.220 1.181 1.209 1.217 RB [32] 1.051 1.050 1.053 1.030 1.046 1.051 B1 [33] 1.134 1.134 1.136 1.116 1.130 1.134
AN24-0.3 [34]
1.028 1.028 1.033 1.015 1.028 1.028
AN24-0.5 [34]
1.088 1.088 1.095 1.070 1.087 1.088
F-AN [35] 1.015 1.015 1.019 1.003 1.015 1.015 C1 [36] 1.036 1.036 1.044 1.009 1.032 1.037 C2 [36] 1.080 1.080 1.087 1.052 1.075 1.080
4B4-0.7(C0.2)
[37] 1.088 1.088 1.101 1.063 1.087 1.088
4B4-0.7(C0.3)
[37] 1.108 1.108 1.120 1.085 1.107 1.108
Reference [38]
0.996 0.996 1.002 0.984 0.996 0.996
CTRL [39] 1.181 1.181 1.186 1.167 1.180 1.181 CTRL [40] 1.252 1.253 1.259 1.237 1.251 1.252
A [41] 0.989 0.982 0.985 0.973 0.981 0.982 Ref [42] 0.982 0.982 0.984 0.963 0.978 0.982
As seen in Table III, based on the calculation of all design building codes, there are only two specimens, tested by Wight et al. [41] and Nordin and Talisjen [42], that have Vexp/Vmn < 1.0, but still close to 1.0. It means the theoretical flexural strength that is calculated by all design codes are smaller than the experimental flexural strength.
A resume analysis of experimental strength versus nominal flexural strength is presented in Table IV. As seen from Table IV, nominal flexural strength model by fib Model Code 2010, Vmn,fib provides the closest estimation for the ratio of Vexp/Vmn,fib. fib Model Code 2010 also gives the smallest standard deviation and coefficient of variations. Nominal flexural strength model by ACI318-14, AS3600-2001 and NZS 3101:2006 show similar results. Nominal flexural strength model by CAN-A23.3-04 exhibit the conservative estimation for 33 beam specimens.
TABLE IV. COMPARISON OF THE RATIO OF EXPERIMENTAL STRENGTH AND
FLEXURAL STRENGTH
Vexp./
Vmn,ACI318 Vexp./
Vmn,AS3600 Vexp./
Vmn,CAN Vexp./ Vmn,fib
Vexp./ Vmn,JSCE
Vexp./ Vmn,NZS
Mean 1.105 1.105 1.109 1.085 1.102 1.105 Median 1.091 1.091 1.101 1.072 1.089 1.091
Standard deviation
0.083 0.083 0.082 0.079 0.082 0.083
COV 0.075 0.075 0.074 0.073 0.074 0.075 Max.
Vexp/Vmn 1.264 1.266 1.264 1.237 1.252 1.265
Min. Vexp/Vmn
0.982 0.982 0.984 0.963 0.978 0.982
Vexp/Vmn > 1 31 31 33 30 31 31 Percent under-
prediction (%)
88.6 88.6 94.3 85.7 88.6 88.6
V. CONCLUSION AND RECOMMENDATION
The following conclusions are drawn based on database and analytical results presented in this research:
1) fib Model Code 2010 provides the closest estimation for the ratio of Vexp/Vmn, with smallest standard deviation and coefficient of variations that is 0.079 and 0.073, respectively.
2) Among flexural strength models evaluated in this research, the model proposed by Canadian code exhibit the most conservative estimation for 33 test of RC beam specimens.
3) All of the design building codes gave more than 85% under-prediction of the RC beam test specimens.
This study is based on limited test results and future studies are needed to verify the findings.
ACKNOWLEDGMENT
The authors thank to the Ministry of Research, Technology, and Higher Education of the Republic of Indonesia for funding this research through Hibah Penelitian Dosen Pemula (PDP).
REFERENCES
[1] Council on Tall Building and Urban Habitat. (2019). www.skyscrapercenter.com/compare-data/
[2] ACI Committee 318. “Building Code Requirement for Structural Concrete (ACI 318-14) and Commentary,” American Concrete Institute, Farmington Hills, MI., 2014
[3] AS3600-2001, “Australian Standard for Concrete Structures,” S. A, North Sydney: Standards Australia Committee, 2001.
[4] CAN-A23.3-04, “Design of Concrete Structures,” Toronto, Canada: Canadian Standards Association, 2004.
[5] International Federation for Structural Concrete, “fib Model Code for Concrete Structures,” Lausanne, Switzerland: International Federation for Structural Concrete, 2010.
[6] JSCE Concrete Committee, “Standard Specifications for Concrete Structures – 2007,” Tokyo, Japan: Japan Society of Civil Engineers, 2010.
[7] NZS 3101:Part 1:2006, “Concrete Structures Standard Part 1 – The Design of Concrete Structures,” Wellington, New Zealand: Standards Council, 2006.
[8] F. Emperger, "Ein graphischer Nachweis der Tragfahigkeit und aller in einem Tragwerke aus Eisenbeton auftretenden Spannungen." Beton und Eisen, Vol. 4, No. 5, pp. 306-320., 1904.
Advances in Engineering Research, volume 187
64

[9] C. S. Whitney, “Design of Reinforced Concrete Members under Flexure or Combined Flexural and Direct Compression,” Journal of the American Concrete Institute, Proceedings 33(3), pp. 483-498., 1937.
[10] E. Hognestad, N. W. Hanson and D. McHenry, “Concrete stress distribution in ultimate strength design,” ACI Journal, V. 52, No.6, , pp. 455-480. December 1955
[11] A. Mattock, L. Kriz & E. Hognestad, “Rectangular concrete stress distribution in ultimate strength design,” ACI Journal, 57(2): 875-928, 1961.
[12] I. M. Metwally, “Can Different Design Codes give the Accurate Prediction of Moment Capacities of High-Strength Concrete Members?” International Conference on Sustainable Design and Construction (ICSDC), March, 23-25, pp. 497-506., 2011.
[13] H. J. Pam, A. K. Kwan and M. S. Islam, " Flexural Strength and Ductility of reinforced Normal and High-Strength Concrete Beams", Structure & Buildings, Volume 146, Issue 4, pp. 381-389, 2001.
[14] L. F. A. Bernardo and S. M. R. Lopes, "Neutral Axis Depth versus Flexural Ductility in High-Strength Concrete Beams", ASCE Journal of Structural Engineering, Volume 130, issue 3, pp.425-459, 2004.
[15] S. Sarkar, O. Adwan and J. G. Munday, High Strength Concrete: An Investigation of the flexural Behavior of High Strength RC Beams", The Structural Engineer, Volume 75, Issue 7, pp.115-121, 1997.
[16] S. A. Ashour, "Effect of Compressive Strength and Tensile Reinforcement Ratio on Flexural Behavior of High-Strength Concrete Beams", Engineering Structures, Volume 22, pp. 413-423, 2000.
[17] CEB/FIP Model MC90."Committee Euro International de Beton, Bulletin d' Information Nos. 195 and 196, Lausanne, 348pp., 1990.
[18] J. F. Bonacci and M. Maalej, “Externally Bonded Fiber-Reinforced Polymer for Rehabilitation of Corrosion Damaged Concrete Beams,” ACI Structural Journal, Vol. 97, No. 5, pp. 703-711, Sep.-Oct. 2000.
[19] N. F. Grace, G. Abdel-Sayed and W. F. Ragheb, “ Strengthening of Concrete Beams Using Innovative Ductile Fiber-Reinforced Polymer Fabric,” ACI Structural Journal, Vol. 99, No. 5, pp. 692-700, Sep.-Oct. 2002.
[20] C. E. Greene and J. J. F. Myers, “Flexural and Shear Behavior of Reinforced Concrete Members Strengthened with a Discrete Fiber-Reinforced Polyurea System,” ASCE Journal of Composites for Construction, Vol. 17, No. 1, pp. 108-116, Jan. – Feb. 2013.
[21] P. J. Heffernan and M. A. Erki, “Fatigue Behavior of Reinforced Concrete Beams Strengthened with Carbon Fiber Reinforced Plastic Laminates,” ASCE Journal of Composites for Construction, Vol. 8, No. 2, pp. 132-140, Mar.-Apr. 2004.
[22] K. -N. Hong, B. -H. Lee, J. -H. Kim, I. -Y. Jang and S. -H. Han, “Flexural Behavior of RC Beams Strengthened with Composite Beam. International Journal of the Physical Sciences,” Vol. 6, No. 9, pp. 2205-2218, May 2011a.
[23] K. -N. Hong, J. -W. Lee, D. -W. Seo and S. -H. Han, “Flexural Response of Reinforced Concrete Members Strengthened With Near-Surfaced-Mounted CFRP Strips. International Journal of the Physical Sciences, Vol. 6, No. 5, pp. 948-961, March 2011b
[24] W.-T. Jung, Y.-H. Park, J.-S. Park, J.-Y. Kang and Y.-J. You, “Experimental Investigation on Flexural Behavior of RC Beams Strengthened by NSM CFRP Reinforcements,” ACI Special Publication, Vol. 230, No. 46, pp. 795-806, 2005.
[25] C. Kassem, A. S. Farghaly and B. Benmokrane, “ Evaluation of flexural Behavior and Serviceability Performance of Concrete Beams Reinforced with FRP Bars,” ASCE Journal of Composites for Construction, Vol. 15, No. 5, pp. 682-695, Sep. – Oct. 2011.
[26] T. H.-K. Kang, W. S. Kim, Y.-K. Kwak and S. G. Hong, “Flexural Testing of Reinforced Concrete Beams with Recycled Concrete Aggregates,” ACI Structural Journal, Vol. 111, No. 1, pp. 1-10, Jan. – Dec. 2014.
[27] A. R. Khan, “Role of U-shaped Anchorages on Performance of RC Beams Strengthened by CFRP Plates,” Concrete Repair, Rehabilitation and Retrofitting II, ISBN 978-0-415-46850-3, pp. 1249-1252, July 2009.
[28] S. H. Kim and Y. S. Shin, “Flexural Behavior of Reinforced Concrete (RC) Beams Retrofitted with Hybrid Fiber Reinforced Polymers (FRPs) Under Sustaining Loads,” Composite Structures, Vol. 93, pp. 802-811, Aug. 2011.
[29] M. A. Rashid and M. A. Mansur, “Reinforced High-Strength Concrete Beams in Flexure,” ACI Structural Journal, Vol. 102, No. 3, pp. 462-471, May – June 2005.
[30] Y.-S. Shin and C. Lee, “Flexural Behavior of Reinforced Concrete Beams Strengthened with Carbon Fiber-Reinforced Polymer Laminates at Different Levels of Sustaining Load,” ACI Structural Journal, Vol. 100, No. 2, pp. 231–240, Mar. – Apr. 2003.
[31] D. Svecova and A. G. Razaqpur, “Flexural Behavior of Concrete Beams Reinforced with Carbon Fiber-Reinforced Polymer (CFRP) Prestressed Prisms,” ACI Structural Journal, Vol. 97, No. 5, pp. 731-738, Sep. – Oct. 2000.
[32] B. Täljsten, “CFRP – Strengthening, Concrete Structures Strengthened with Near Surface Mounted CFRP Laminates. Fibre reinforced plastics for reinforced concrete structures,” FRP RCS-5 Conference., 12 pp., 2001.
[33] P. Yotakhong, “Flexural Performance of MMFX Reinforcing Rebars in Concrete Structures,” Master’s thesis, North Carolina State University, Raleigh, NC, 162 pp., Nov. 2003.
[34] S.-W. Kim, Y.-J. Lee, Y.-H. Lee and K.-H. Kim, “Flexural Performance of Reinforced High-Strength Concrete Beams with EAF Oxidizing Slag Aggregates,” Journal of Asian Architecture and Building Engineering, Vol. 15, No. 3, pp. 589-596, Sept. 2016.
[35] S.-W. Kim, Y.-J. Lee and K.-H. Kim, “Flexural Behavior of Reinforced Concrete Beams with Electric Arc Furnace Slag Aggregates,” Journal of Asian Architecture and Building Engineering, Vol. 11, No. 1, pp. 133-138, May 2012.
[36] M. B. Giduquio, M.-Y. Cheng, and L. S. B. Wibowo, “High-Strength Flexural Reinforcement in Reinforced Concrete Flexural Members under Monotonic Loading,” ACI Structural Journal, Vol. 112, No. 6, pp. 793-804, Nov. – Dec. 2015.
[37] I.- Y. Jang, H.- G. Park, S.- S. Kim, J.- H. Kim and Y.- G. Kim, “On the Ductility of High-Strength Concrete Beams,” International Journal of Concrete Structures and Materials, Vol. 2, No. 2, pp. 115-122, Dec. 2008.
[38] M. N. S. Hadi, M. M. Sarhan and L. H. The, “Behavior of Concrete Beams Reinforced with Stel Plates,” ACI Structural Journal, Vol. 115, No. 5, pp. 1307-1315, Sept. 2018.
[39] L.-Z. Li, X. Liu, Y. Luo, M.-N. Su, and J.-H. Zhu, “Flexural Performance of Bolted-Side-Plated Reinforced Concrete Beams with Buckling Restraining,” ACI Structural Journal, Vol. 116, No. 2, pp. 77-87, March 2019.
[40] L.-Z. Li, C.-J. Jiang, J.- T. Yu, X. Wang, and Z.-D. Lu, “Flexural Performance of Fire-Damaged Rreinforced Concrete Bbeams Repaired by Bolted Side-Plating,” ACI Structural Journal, Vol. 116, No. 3, pp. 183-194, May 2019.
[41] R. G. Wight, M. F. Green and M. A. Erki, “Prestressed FRP Sheets For Poststrengthening Reinforced Concrete Beams,” ASCE Journal of Composites for Construction, Vol. 5, No. 4, pp. 214-220, Nov., 2001.
[42] H. Nordin and B. Täljsten, “Concrete Beams Strengthened with Prestressed Near Surface Mounted CFRP,” ASCE Journal of Composites for Construction, Vol. 10, No. 1, pp. 60-68, Jan. – Feb. 2006.
Advances in Engineering Research, volume 187
65