Embed Size (px)
Citation preview

Forum NIL
Nachhaltigkeit im Lebensmittelhandel
Sustainability in Food Retailing
A Comparison of Fair Trade
in Selected European Countries
Jasmin Baumgartl
Ann-Kathrin Boderius
Manfred Kiy
Wiltrud Terlau
Jana Voth
Cologne University of Applied Sciences
Faculty of Business, Economics and Law
NIL Research Paper 1/2014

II
Table of Contents
Table of Contents .................................................................................................................... II
Authors and Contact Persons ................................................................................................. III
List of Figures ......................................................................................................................... IV
List of Tables .......................................................................................................................... IV
List of Abbreviations ................................................................................................................ V
Abstract ................................................................................................................................. VII
1 Introduction .................................................................................................. 1
2 The Food Retail Industry in Europe ........................................................... 2
3 The Fair Trade System .............................................................................. 10
4 Development of Fair Trade Sales ............................................................. 19
5 Activities of Fair Trade Organizations ..................................................... 27
6 Conclusion ................................................................................................. 34
List of References ............................................................................................ 37
III
Authors and Contact Persons
This paper is part of the Forum Nachhaltigkeit im Lebensmittelhandel (NIL; Sustainability in
Food Retailing) which is a collection of scientific papers dealing with various aspects of
sustainability in the area of food retail trade. For further information on the Forum NIL the
publishers, Prof. Dr. Manfred Kiy (Cologne University of Applied Sciences) and
Prof. Dr. Wiltrud Terlau (Bonn-Rhein-Sieg University of Applied Sciences), can be contacted.
The respective authors are responsible for the content of their own texts.
Authors
Jasmin Baumgartl, Cologne University of Applied Sciences
Ann-Kathrin Boderius, Cologne University of Applied Sciences
Manfred Kiy, Cologne University of Applied Sciences
Wiltrud Terlau, Bonn-Rhein-Sieg University of Applied Sciences
Jana Voth, Cologne University of Applied Sciences
Contact Persons
Prof. Dr. Manfred Kiy
Cologne University of Applied Sciences
Faculty of Business, Economics and Law
Tel.: +49 221 8275 3432
E-Mail: [email protected]
Prof. Dr. Wiltrud Terlau
Bonn-Rhein-Sieg University of Applied Sciences International Centre for Sustainable Development - IZNE
Tel.: +49 2241 865 410
E-Mail: [email protected]

IV
List of Figures
Figure 1: Certification Systems along the Supply Chain in the Fair Trade System ..................14
List of Tables
Table 1: Food and Non-Alcoholic Beverages Consumption Expenditures of Private Households in 6 European Countries 2008-2012 ..................................... 2
Table 2: Sales of Food and Near-Food Products in Retail and Wholesale Trade in 2012 ...... 4
Table 3: Market Share of Top Ten Food Retailers in 6 European Countries in 2012 .............. 6
Table 4: Number of Stores of Food Retailers in 6 European Countries in 2012 ..................... 8
Table 5: Shares of Total Sales Volume of Various Sales Channels in the Food Retail Industry in 6 European Countries in 2011 ............................................ 9
Table 6: Overview of Major Fair Trade Organizations and Participants in Selected European Countries.................................................................................17
Table 7: Fair Trade Retail Sales in 6 European Countries 2008-2012 ..................................20
Table 8: Per Capita Fair Trade Retail Sales in 6 European Countries 2008-2012 .................21
Table 9: Fair Trade Sales of Coffee in 6 European Countries 2008-2012 .............................22
Table 10: Fair Trade Sales of Tea in 6 European Countries 2008-2012 ..................................23
Table 11: Fair Trade Sales of Bananas in 6 European Countries 2008-2012 ..........................24
Table 12: Fair Trade Sales of Fruit Juice in 6 European Countries 2008-2012........................25
Table 13: Fair Trade Sales of Sugar in 6 European Countries 2008-2012 ..............................25
Table 14: Share of Fair Trade Products on the Per Capita Consumption of Food and Non-Alcoholic Beverages .......................................................................26
Table 15: License Fees by Labeling Initiatives in 6 European Countries in 2012 ....................28
Table 16: Key Indicators of National Labeling Initiatives in 2012 .............................................30
Table 17: Trust and Recognition of Fair Trade in 2011 ...........................................................32

V
List of Abbreviations
£ British Pound
€ Euro
ACP African, Caribbean and Pacific Group of States
ADDF Au-delà des Frontières
AG Aktiengesellschaft
ARGE Arbeitsgemeinschaft zur Förderung der Weltläden
ASRO Association Romande des Magasins du Monde
BAFTS British Association of Fair Trade Shops and Suppliers
BV Besloten vennootschap
e.V. eingetragener Verein
EESC European Economic and Social Committee
EFTA European Fair Trade Association
EU European Union
FLO Fairtrade Labelling Organizations
FLO-CERT Fairtrade Labelling Organizations for Social Certification
FTUSA Fair Trade USA
g gram
GbR Gesellschaft bürgerlichen Rechts
GEPA Gesellschaft zur Förderung der Partnerschaft mit der Dritten Welt mbH
GmbH Gesellschaft mit beschränkter Haftung
IFAT International Federation of Alternative Trade
IFOAM International Federation of Agricultural Movements
Inc Incorporated
ISO International Organization for Standardization
kg kilogram
KG Kommanditgesellschaft
Ltd Limited Company
M million
n.d. no date
NEWS Network of European Worldshops

VI
OHG offene Handelsgesellschaft
PFCE Plate-Forme pour le Commerce Equitable
plc Public Limited Company
SAS Société par Actions Simplifiée
sqm square meters
UK United Kingdom
V.O.F. vennootschap onder firma
WFTO World Fair Trade Organization
WL-DV Weltladen-Dachverband
VII
Abstract
This paper gives an overview of the development of Fair Trade in six European countries:
Austria, France, Germany, the Netherlands, Switzerland and the United Kingdom. After the
description of the food retail industry and its market structures in these countries, the main
European Fair Trade organizations are analyzed regarding their role within the Fair Trade
system. The following part deals with the development of Fair Trade sales in general and with
respect to the products coffee, tea, bananas, fruit juice and sugar. An overview of the main
activities of national Fair Trade organizations, e.g. public relation activities, completes the
analysis.
This study shows the enormous upswing of Fair Trade during the last decade and the reasons
for this development. Nevertheless, it comes to the conclusion that Fair Trade is still far away
from being an essential part of the food retail industry in Europe.

1
1 Introduction
The Fair Trade movement realized a remarkable development during the last decade. The
degree of recognition of the Fair Trade idea and the FAIRTRADE certification mark increased
enormously as well as the sales of Fair Trade products. However, the strong growth of Fair
Trade is not documented well, providing a major barrier for potential new market entrants. This
paper attempts to shed some light on this dynamic sector of the global economy.
In this study, the Fair Trade organizations and performance within six European countries will
be compared. The United Kingdom and the Netherlands are the countries with the longest
European tradition of Fair Trade. Furthermore, Germany and France will be analyzed, as they
are the largest economies on the European continent. The analysis is completed by Austria
and Switzerland, countries with a relatively small population but a high per capita consumption
of Fair Trade products.
The analysis refers to the years 2008 to 2012. For this period, (more or less) comparable data
for all six countries was available. Unfortunately, the data quality was not always satisfying. On
the one hand, there are no official – internationally comparable – statistics of Fair Trade. The
published data is mostly based on annual reports of Fairtrade Labelling Organizations (FLO)
International and their national partners. On the other hand, calculations of the national figures
(sometimes) refer to different methods. Insofar, comparisons of the activities in the six
European countries are not always directly possible.
This study consists of four parts. At first, the food retail industry of the six countries is analyzed
under the aspects sales volumes, market leaders and structure of the markets. In the second
part, the organization of Fair Trade worldwide and on the national level is described. Part three
deals with the sales and consumption of main Fair Trade food products in the considered
countries: coffee, tea, bananas, fruit juice and sugar. The last part focuses on the national
labeling organizations and their activities. The analysis concludes with a discussion of the level
of trust and recognition of Fair Trade across the considered countries.

2
2 The Food Retail Industry in Europe
The food retail industry is characterized by retailers with a product assortment predominantly
consisting of food. The retail industry is the interface between producer or wholesaler and
consumer by selling food directly to the end consumer.
This paper deals with the comparison of the Fair Trade sector in different European countries.
Food products make up the major part of the total turnover of Fair Trade products. Therefore,
this chapter focuses on the European food retail industry providing key data and insights into
its structure and main actors. Within Europe, the sales volume of Fair Trade products is the
highest in the following six countries: Germany, the United Kingdom (UK), Switzerland, the
Netherlands, Austria1 and France (FLO International, 2014). For that reason, this chapter
mainly concentrates on the food retail industry of these specific European countries.
To get a general idea of the importance of the food retail industry in the selected countries,
Table 1 indicates the yearly consumption expenditures of private households on food and non-
alcoholic beverages from 2008 to 2012.
Food and Non-Alcoholic Beverages Consumption Expenditures (in billion €)
2008 2009 2010 2011 2012
Germany 149.1 151.3 155.4 162.9 169.9
United Kingdom 98.1 89.6 96.7 99.8 112.2
Switzerland 18.6 19.8 21.4 23.8 24.2
Netherlands 30.1 30.3 30.8 31.5 32.3
Austria 15.7 15.7 16.0 16.6 17.1
France 143.4 143.6 146.8 150.6 156.3
Table 1: Food and Non-Alcoholic Beverages Consumption Expenditures of Private Households in 6 European Countries 2008-2012, at current prices Source: Eurostat, 2014a; Bundesamt für Statistik, 2014
Household expenditures for food and non-alcoholic beverages in the selected countries
ranked third in terms of total consumption expenditure of households. Households only spent
more for “housing, water, energy” and “transportation”. In 2012, households in the five
countries (excluding Switzerland) spent an average of 11.3% of their consumption expenditure
on food and non-alcoholic beverages. This share was slightly lower than the European
average of 13.0% in the same year. In Germany, the household spending on food and non-
1 The sales volume of Fair Trade products in Austria was lower than that of Sweden, Ireland and Finland in 2012.
Yet, due to difficulties with finding appropriate and detailed information in English, Austria was preferred to those countries. With Germany, Switzerland and Austria all German-speaking countries of Europe are covered in this paper.

3
alcoholic beverages in nominal terms increased by 3.3% from 2008 to 2012 annually, while the
consumer prices for this product group increased by 1.6% on average per year. In the United
Kingdom, the corresponding consumption expenditure increased by 3.4% on annual average
from 2008 to 2012. Yet, the average annual growth rate of consumer prices for food and non-
alcoholic beverages was 4.4%, leading to a negative real growth of the consumption
expenditures. In the Netherlands, Austria and France the average annual growth rate of the
food and non-alcoholic beverages consumption ranged from 1.8% to 2.2%. The price increase
for those products was lower than the growth rates in these three countries. This indicates a
real growth of the consumption expenditure for this product group (Eurostat, 2014a; Eurostat,
2014b).
In 2012, the total consumption expenditures on food and non-alcoholic beverages of all
selected countries amounted to €512.0 billion. German and French household expenditures
made up the largest share with 33.2% and 30.5%, respectively. The final consumption
expenditures of households in the United Kingdom on food and non-alcoholic drinks
accounted for 21.9%. The corresponding household spending in the Netherlands made up
6.3%. By far the lowest share made up the household spending in Switzerland and Austria,
accounting for 4.7% and 3.3%. The different shares mostly result from the number of
inhabitants of each country. Yet, in 2012 the British pound significantly appreciated against the
euro. For that reason, the final consumption expenditures in the United Kingdom converted
into euro increased from 2011 to 2012. The consumption expenditures per capita on food and
non-alcoholic beverages was the highest in Switzerland with €3,075 per capita in 2012,
followed by France with €2,405 per capita. The high figure for Switzerland is mainly a result of
changes in the exchange rate, with the Swiss franc appreciating against the euro. The
corresponding consumption per capita in Austria was €2,035, in Germany it amounted to
€2,078 and in the Netherlands to €1,939 per capita. With €1,780 per capita the final
consumption expenditures on food and non-alcoholic beverages in the United Kingdom seems
to be comparably low. However, this can again be explained by the exchange rate movements
(Eurostat, 2014a; Bundesamt für Statistik, 2014).
In Table 2 the most important retailers are ranked according to their turnover realized in 2012.
These sales figures do not include food service and are based on turnover figures according to
Planet Retail, an organization providing global retail data (Deutscher Fachverlag, n.d). The
ranking of the food retailers in Germany is based on figures of the Nielsen Company Germany
(Trade Dimensions, 2012), arraying the retailers according to their food turnover including
drugstore products.

4
Top Ten Wholesalers and Retailers (in billion €)
Rank Germany United
Kingdom Switzerland Netherlands
1 Austria France
1 Edeka-Group
(44.6) Tesco (43.1)
Migros (12.5)
Ahold (10.1)
Rewe-Group (6.5) Carrefour
(32.6)
2 Rewe-Group
(26.2) Sainsbury‘s
(23.7) Coop Schweiz
(10.0) C1000 (3.7)
Spar Österreichische Warenhandels
AG (4.5)
E. Leclerc (27.3)
3 Schwarz-
Group (24.1)
Morrisons (22.3)
Aldi Süd (1.4)
Jumbo Supermarkten
(2.9)
Aldi-Group (3.1)
Intermarché (24.2)
4 Aldi-Group
(20.9) Asda (20.7)
Spar Schweiz (0.8)
Lekkerland (2.6)
Schwarz-Group (1.0)
Casino (20.2)
5 Metro-Group
(11.3)
Co-operative Group Ltd
(10.2)
Schwarz-Group (0.6)
Aldi Nord (2.5)
Metro-Group (0.6) Système U
(19.0)
6 Lekkerland
(8.2)
Alliance Boots (8.8)
Manor (0.6)
Sperwer (2.4)
Pfeiffer (0.6)
Auchan (14.3)
7 dm
(4.6) Bestway
(6.1) Lekkerland
(0.4) Schwarz-Group
(2.0) MPreis (0.6)
Schwarz-Group (7.1)
8 Rossmann
(4.0) John Lewis
(6.0) Casino (0.1)
Sligro (1.7)
Zielpunkt (0.5)
Louis Delhaize (5.3)
9
Bartels-Langness
Group (2.8)
Marks & Spencer
(6.0)
Müller Ltd & Co. KG
(0.1)
AS Watson (1.4)
dm (0.5)
Aldi-Group (3.0)
10 Trans-
gourmet (2.6)
Booker (5.3)
Fressnapf (0.1)
Metro-Group (0.9)
BP (0.2)
Metro-Group (2.9)
1 Data refers to 2011
Table 2: Sales of Food and Near-Food Products in Retail and Wholesale Trade in 2012 Source: Deutscher Fachverlag, n.d.; Trade Dimensions, 2012
With a turnover of €44.6 billion in 2012, Edeka-Group is the most important company in the
German food retail industry. The Rewe-Group, the second largest food retailer in Germany,
includes among others supermarkets (REWE), discounters (Penny) and hypermarkets (REWE
Center, toom Markt) (REWE Group, 2013). The following two retailers, Schwarz- and Aldi-
Group, are mainly operating discount stores. Yet, the Schwarz-Group additionally owns the
hypermarket Kaufland besides the discount supermarket chain Lidl. Most of the Top Ten food
retailers in Germany have private labels carrying the FAIRTRADE certification mark. Only
Lekkerland, dm-drogerie markt (dm) and Transgourmet are not licensed to use the
FAIRTRADE mark on their own products (TransFair, n.d.(a)).
Among the Top Ten of the British ranking of food retailing companies, there are only retailers
headquartered in the UK. The main foreign actor in terms of turnover is Lidl, ranked 12

5
(Deutscher Fachverlag, n.d.). The British trader Tesco with a turnover of €43.1 billion in 2012
is not only the grocery market leader in the United Kingdom, but also one of the largest food
retailers in the world. There are multiple formats of Tesco in the UK including hypermarkets,
superstores, supermarkets and convenience stores (Tesco, 2012). Sainsbury's as well as
Morrisons, being the second and third largest food retailers, operate supermarkets and
convenience stores (Wm Morrison Supermarkets, 2013; J Sainsbury, 2012).
With Migros and Coop Schweiz two Swiss food retailers are heading the ranking in
Switzerland. Both traders operate various formats from small supermarkets up to large
hypermarkets with a sales area of over 8,500 square meters (Migros, 2013; Coop, 2013). The
subsequent retail and wholesale traders in the Swiss ranking have a turnover of food and
near-food products significantly lower than that of Migros and Coop Schweiz. The sales of
Aldi, for example, taking up the third position in the ranking, only represent about one tenth of
the sales of Migros. With Migros, Coop Schweiz, Spar Schweiz, Manor and Lekkerland half of
the food retailing companies in Switzerland in Table 2 are registered licensees of the Max
Havelaar-Stiftung (Schweiz) and are allowed to label some of their products with the
FAIRTRADE certification mark (Max Havelaar-Stiftung, n.d.(a)).
Ahold is the unchallenged market leader in the Netherlands with a turnover of €10.1 billion in
2011. Supermarkets represent its core business, but Ahold also operates other formats such
as convenience stores. The supermarket chain C1000 ranking second in 2011 was mostly
taken over by the retailer Jumbo Supermarkten the following year (Ahold, 2013; Deutscher
Fachverlag, n.d.). Surprisingly, out of the Top Ten food retailers in the Netherlands only Ahold
is a certified trade partner of Stichting Max Havelaar (Stichting Max Havelaar, 2013a).
In Austria, food retailing is mainly dominated by German traders. The primary sales channels
of the market leader Rewe-Group are supermarkets (Billa), consumer markets (Merkur)
besides discounters (Penny) and the ADEG-merchants2 mostly operating in wholesale trade.
The second largest Austrian food retailer, Spar Österreichische Warenhandels AG, has
various formats ranging from small supermarkets to Interspar hypermarkets. The subsequent
positions in the ranking are held by the two German discounters Aldi-Group and Schwarz-
Group (Deutscher Fachverlag, n.d.; REWE Group, n.d.). Among the food retailing companies
in Austria in Table 2 five actively participate in Fair Trade and are official partners of Fairtrade
Österreich which allows them to use the FAIRTRADE certification mark on selected products.
Those retailers are Rewe-Group, Spar Österreichische Warenhandels AG, Aldi-Group,
Schwarz-Group and Pfeiffer (Fairtrade Österreich, n.d.).
With €32.6 billion, Carrefour is the food retailer with the highest sales in France and also
Europe’s largest trader in terms of turnover. Its main formats are hypermarkets, supermarkets
2 Arbeitsgemeinschaft der Einkaufsgenossenschaften

6
and convenience stores. Carrefour is followed by the hypermarket chain E. Leclerc and
Intermarché, which operate hypermarkets and supermarkets. The German food retailers
Schwarz-Group, Aldi-Group and Metro-Group are also represented in the Top 10 of the
French ranking (Carrefour, n.d; Deutscher Fachverlag, n.d.; E. Leclerc, n.d; Intermarché, n.d).
Ranking of Top Ten Food Retailers according to Market Share (in %)
Rank Germany United
Kingdom Switzerland Netherlands Austria France
1 Edeka-Group
(20.1) Tesco (16.9)
Migros (29.0)
Ahold (23.1)
Rewe-Group (24.1)
Carrefour (14.0)
2 Rewe-Group
(15.6) Sainsbury’s
(9.3)
Coop Schweiz (20.6)
C1000 (8.3)
Spar Österreichische Warenhandels
AG (17.3)
E. Leclerc (12.0)
3 Metro-Group
(13.0) Morrisons
(8.7) Aldi Süd
(3.3)
Jumbo Supermarkten
(6.6)
Aldi-Group (12.0)
Intermarché (10.6)
4 Schwarz-
Group (12.4)
Asda (8.1)
Schwarz-Group (1.5)
Aldi Nord (5.8)
Schwarz-Group (3.8)
Casino (8.9)
5 Aldi-Group
(10.7)
Co-operative Group Ltd
(4.0)
Manor (1.4)
Sperwer (5.6)
MPreis (2.2)
Système U (8.4)
6 Lekkerland
(3.5)
Alliance Boots (3.5)
Spar Schweiz
(1.1)
Schwarz-Group (4.5)
Zielpunkt (1.9)
Auchan (6.3)
7 Tengelmann-
Group (3.2)
John Lewis (2.4)
Casino (0.3)
AS Watson (3.2)
dm (1.8)
Schwarz-Group (3.1)
8 dm
(1.9)
Marks & Spencer
(2.4)
Fressnapf (0.2)
Sligro (2.0)
Pfeiffer (0.9)
Louis Delhaize
(2.3)
9 Globus (1.9)
Bestway (1.8)
Müller Ltd & Co. KG
(0.1)
Metro-Group (0.2)
BP (0.7)
Aldi-Group (1.3)
10
Schlecker (1.7) /
Rossmann (1.7)
Booker (0.7)
Metro-Group (0.2)
Metro-Group (0.1)
Table 3: Market Share of Top Ten Food Retailers in 6 European Countries in 2012 Source: Deutscher Fachverlag, n.d.; Trade Dimensions, 2012
Table 3 ranks the food retailers in the selected countries according to their market share in
2012. This ranking does not conform to the previous one in Table 2, because the market share
was calculated as a share of national consumer expenditures for food, drinks and tobacco and
is not based on total turnover of the retailers. The data is extracted from Planet Retail, except
for Germany. The German figures refer to 2011 and come from Trade Dimensions where the
7
market share is based on turnover of the retailers in that industry (retail and wholesale). There
was no data available for Lekkerland in Switzerland and the Netherlands, resulting in only nine
food retailers in the ranking of those two countries.
The food retail industry is increasingly concentrated in the selected countries, although no
single retailer is officially defined as holding a dominant position. In the six countries, the
market share of the top three retailers ranges from 30% to 50%. Most of these large retailers
currently controlling the food retail market are multinational corporations. German and Austrian
multinationals such as Schwarz-Group, Aldi-Group or Metro-Group, the French companies
Auchan and Carrefour, the British retailer Tesco and the Dutch company Ahold are operating
in various countries throughout the world. Many have already gained significant market share
abroad (European Economic and Social Committee, 2013).
The three largest food retailers in Germany control 48.7% of the market, while 71.8% of the
food retailing market is controlled by the top five companies, revealing a dominant position in
the market. In the British, Dutch and French food retail market, the three largest firms control
between 34.9% and 38.0% of the market. The five-firm concentration ratio ranges from 47.0%
to 53.9%. These combined market shares of the three, respectively five largest retailers, do
not reveal a highly dominant position, although showing a concentrated food retail industry.
The food retail sector in Switzerland and Austria is highly concentrated with a concentration
ratio of the three largest firms of over 50%. Other food retailers in these two countries have
market shares below 4%. In Switzerland, the food retailers Migros and Coop Schweiz
dominate the market with a combined market share of 49.6%.
The European Economic and Social Committee (EESC), a consultative body at European
Union level giving Europe’s interest groups a “formal and institutionalized say on draft EU
legislation”, blamed the large food retailers in Europe for holding a real oligopoly (European
Union, n.d.). The Commission published an own-initiative opinion in 2013 on “The current state
of commercial relations between food suppliers and the large retail sector”. One basic
statement is quoted below:
“This oligopolistic position gives its member companies an enormous amount of bargaining
power over their suppliers. As a result, they are able to impose trading terms on their suppliers
which are far from balanced. [...] In other words, the suppliers must make a huge effort and
accept many concessions if they wish to deliver their products; the buyers [retailers],
meanwhile select those suppliers who are the most "flexible" about their terms and conditions.”
(European Economic and Social Committee, 2013, pp. 1 and 4)
Table 4 depicts the amount of stores of the different food retailers in each country in 2012. The
table is based on information from Planet Retail. Only the German figures originate from Trade
Dimensions and refer to 2011. Trade Dimensions includes hypermarkets, supermarkets,

8
discounter, drugstores, others and cash and carry stores in the category food retailers. For
Lekkerland in Switzerland and the Netherlands, no numbers were available.
In most of the six countries the retailers with the highest sales (see Table 2) and the highest
market share (see Table 3) also operate the largest amount of stores. On the contrary, Tesco
(UK), although being the largest retailer in terms of market share and sales only represents the
third position in the ranking of Table 4. The food retail companies Bestway and Co-operative
Group Ltd with significantly less market share and a lower sales volume than Tesco have both
more stores in the United Kingdom. This also occurs in France, where the retailer Casino
operates the largest amount of stores, although not belonging to the Top Three considering
sales and market share.
Ranking of Top Ten Food Retailers according to Amount of Stores
Rank Germany United
Kingdom Switzerland Netherlands Austria France
1 Edeka-Group
(7,980) Bestway (3,613)
Migros (1,672)
Ahold (1,946)
Rewe-Group (2,484)
Casino (8,336)
2 Rewe-Group
(4,685)
Co-operative Group Ltd
(3,597)
Coop Schweiz (1,202)
AS Watson (1,069)
Spar Österreichische Warenhandels
AG (1,531)
Carrefour (4,677)
3 Aldi-Group
(4,315) Tesco (3,141)
Spar Schweiz (225)
Sperwer (634)
Aldi-Group (442)
Intermarché (2,636)
4 Schwarz-Group
(3,906) Booker (3,002)
Aldi Süd (162)
Aldi Nord (493)
dm (377)
Schwarz-Group (1,617)
5 Rossmann
(1,773)
Alliance Boots
(2,487)
Schwarz-Group (89)
C1000 (430)
BP (340)
Système U (1,504)
6 dm
(1,323) Sainsbury’s
(1,106) Manor (64)
Schwarz-Group (360)
Zielpunkt (283)
E. Leclerc (999)
7 Norma (1,279)
Marks & Spencer
(597)
Müller Ltd Co. & KG (45)
Jumbo Super-markten
(299)
MPreis (203)
Aldi-Group (924)
8 Kaiser's
Tengelmann (514)
Asda (564)
Fressnapf (44)
Sligro (184)
Schwarz-Group (202)
Auchan (628)
9 Metro-Group
(421) Morrisons
(498) Casino
(11) Metro-Group
(17) Pfeiffer (127)
Louis Delhaize (309)
10 Netto Nord
(342) John Lewis
(346) Metro-Group
(12) Metro-Group
(93)
Table 4: Number of Stores of Food Retailers in 6 European Countries in 2012 Source: Deutscher Fachverlag n.d.; Trade Dimensions, 2012
Table 5 indicates the percentage of sales of different distribution channels of food retailing in
the selected European countries. The sales channels are classified according to sales area
and discount stores are included in the category of supermarkets.

9
In general, there were no significant changes in the shares of the different types of stores in
Europe during the last 10 years. In 2011, hypermarkets had a share of sales of 36% followed
by supermarkets with a share of sales of 28%. Consumer markets held a percentage of 25%,
the remaining 11% of total sales in the retail industry were generated by other sales channels.
Yet, the share of sales of discount stores, here included in the category supermarkets,
increased by almost 10% from 1991 to 2011 (The Nielsen Company (Germany), 2013).
Sales Channels in the Food Retail Market
Hypermarkets (≥ 2500 sqm)
Consumer Markets (1000-2499 sqm)
Supermarkets (400-999 sqm)
Others
Germany 28% 16% 52% 3%
United Kingdom 59% 20% 10% 11%
Switzerland 25% 31% 22% 22%
Netherlands 4% 51% 40% 5%
Austria 10% 66% 15% 10%
France 56% 21% 18% 4%
Table 5: Shares of Total Sales Volume of Various Sales Channels in the Food Retail Industry in 6 European Countries in 2011 Source: The Nielsen Company (Germany), 2013
Germany is the only country, where supermarkets have the largest share of sales. Taking into
account discount stores only, they have a share of sales of over 35%. In the United Kingdom
and in France hypermarkets with a sales area larger than 2,500 square meters have the lion’s
share, contributing nearly 60% to total sales turnover in the respected food retail industry. The
total turnover of the Swiss food retail industry is relatively equally apportioned to each sales
channel. All types of retail stores had a share between 22% and 31%. In the Netherlands,
consumer markets and supermarkets have the highest sales volume in relative terms with a
combined market share of 91%. Hypermarkets only have a very small share of total sales
accounting for less than 5%. In the Austrian food retailing, consumer markets have the highest
share of total sales and the shares of the three remaining categories are all significantly lower
(The Nielsen Company (Germany), 2013).
This chapter gave an overview of the retail industry for the selected European countries in this
paper, as the sale of Fair Trade products via conventional wholesale and retail trade has
contributed to the exponential growth of Fair Trade sales within Europe over the past years. It
was also shown that major retailers in the selected European countries offer Fair Trade
products carrying the FAIRTRADE certification mark. The following chapter explains the Fair
Trade system in more detail in order to complete the background information needed for
comparing Fair Trade in the selected European countries.

10
3 The Fair Trade System
Fair Trade or Fairtrade3 has been defined by FINE4 in the following way:
“Fair Trade is a trading partnership, based on dialogue, transparency and respect, that seeks
greater equity in international trade. It contributes to sustainable development by offering
better trading conditions to, and securing the rights of, marginalized producers and workers –
especially in the South. Fair Trade organisations (backed by consumers) are engaged actively
in supporting producers, awareness raising and in campaigning for changes in the rules and
practice of conventional international trade.” (Fair Trade Advocacy Office, 2001)
As can be seen in the definition of Fair Trade, certain principles and goals underlie the idea of
a trading partnership. These are:
equity in international trade
sustainable development
securing the rights of marginalized producers and workers in the South
These principles and goals should be realized via Fair Trade organizations that support
producers and engage in awareness rising and campaigning.
How does the Fair Trade system work? How are responsibilities distributed among actors and
which organizations are active in Fair Trade? This chapter briefly answers these questions,
providing the basic knowledge about the functioning of Fair Trade. It is important to note that
on an international level two broad Fair Trade systems can be distinguished. One is operated
by Fairtrade Labelling Organizations (FLO) International and the other one by the World Fair
Trade Organization (WFTO).
Several principles are common to both Fair Trade systems and shall further ensure the
achievement of the set goals. These principles were determined by FINE and include
(Cremona and Durán, 2013; Fair Trade Advocacy Office, 2001; Voth, 2013):
Payment of a “fair price” to permit socially just and environmentally thorough production
as well as providing fair remuneration to allow for a living wage.
Provision of credit when needed.
3 Fairtrade is used by Fairtrade Labelling Organizations (FLO) International and refers exclusively to the Fairtrade
system established by FLO. In this article the term Fair Trade will be used, which refers to the Fair Trade movement in general. Products which are produced in line with the Fair Trade principles under the FLO and the WFTO Fair Trade system are considered (FLO International, 2011c; Cremona and Durán, 2013). 4 The name is derived from the starting letters of the four Fair Trade organizations: FLO (Fairtrade Labelling
Organizations) International, IFAT (International Federation of Alternative Trade) (now: WFTO (World Fair Trade Organization), NEWS! (Network of European Worldshops), and EFTA (European Fair Trade Association) (Nicholls
and Opal, 2005).

11
Commitment to long-term trading partnerships and co-operative dealings that allow
producers to plan ahead and with a consistent income. It also includes the provision of
market information to strengthen producers in negotiating their prices with non-Fair
Trade buyers.
Practicing sustainable production and thus promoting sustainable development with
regard to improving the social, economic, and environmental conditions of production.
Safeguarding Human Rights for producers and implementing core labor standards,
including the prohibition of labor abuses.
Strengthening producers’ organizations and participation in the decision-making
process.
International trade under the Fair Trade system is based on these principles and all
participants of the Fair Trade system, i.e. small-scale farmers, farm workers, importers,
processors, distributors, wholesalers, retailers, and Fair Trade organizations, are in one way or
the other affected by these principles.
Furthermore, several standards have to be fulfilled when participating in the Fair Trade
system. These standards either refer to products or organizations. FLO International, the
umbrella organization for labeling Fair Trade products, follows the product-certification route
of Fair Trade products. This means that FLO International sets standards for products that
must be fulfilled to gain certification for this product. The certification is granted by FLO-CERT
Certification of Social Development GmbH, a separate certification company, being ISO 65
accredited. FLO International is the owner of FLO-CERT (FLO International, 2011b; 2011g;
Cremona and Durán, 2013; FLO-CERT, n.d.(a)). WFTO, on the other hand, uses the approach
of an integrated supply route for Fair Trade products. This means that products produced
under this system are Fair Trade, because they were sourced and produced in a manner that
adheres to the Fair Trade principles and practices set by the WFTO. Since 2013, Fair Trade
organizations that comply with the set standards can use the WFTO product label on their
products and the WFTO logo on their publications (WFTO, 2013d).
Due to the prevalent information asymmetry between producers and consumers, Fair Trade
products are credence goods and thus establishing a certification and labeling system for Fair
Trade products has become indispensable. To gain a deeper insight, certification conducted
by FLO International and by the WFTO as well as the corresponding supply chain routes will
be explained in more detail. Fair Trade participants of the product-certification route
employed by FLO International will be examined first, before describing certification adopted
by the WFTO.
Fair Trade producers: Producers can either be small-scale farmers or farm workers. They
are located in the Global South and produce the product (FLO International, 2011e).

12
Producers wanting to certify their produce as Fair Trade apply at FLO-CERT for certification.
Once they fulfill the applicable compliance criteria, which are the translation of the Fair Trade
standards into provable control points, they can certify their produce as Fair Trade5 (FLO-
CERT, 2013a; 2013b).
Fair Trade traders: They are participants that want to manufacture, process, purchase, and
sell their products as Fair Trade. This includes importers, processors, manufacturers,
distributors and wholesalers (Fairtrade Österreich, 2013a). These operators can be located in
the Global South or North. They need a certification issued by FLO-CERT for their produce, as
long as they do not trade already labeled and packaged products for the end consumer (FLO-
CERT, 2013a).6 Thereafter, they can sell their products to other Fair Trade traders, Fair Trade
licensees or retailers.
Fair Trade licensees: All enterprises that sell Fair Trade products under their private label
brand, need a license and pay license fees. The national labeling initiatives are responsible for
issuing the license, which allows using the FAIRTRADE certification mark on the final product,
demonstrating to the end consumer that it has been produced under Fair Trade conditions.
The national labeling initiatives are situated in the consumer countries in the Global North.7
Products carrying the FAIRTRADE certification mark can either be bought from an external
provider or produced by the enterprise itself. Retailers or importers can, for example, be Fair
Trade licensees (Transfair, n.d.(a)). If the enterprise itself produces the product, it also needs
to have a certificate issued by FLO-CERT (Max Havelaar Stiftung, n.d.(b)).
Fair Trade consumers: People who want to buy Fair Trade products can find them in
supermarkets, drugstores, convenience shops, online and in Worldshops8 (Transfair, n.d. (b)).
In 2012, global Fair Trade sales amounted to €4.8 billion and Fair Trade products are now
being sold in over 125 countries worldwide (FLO International, 2014).
In the following, the integrated supply route will be analyzed and compared to the product-
certification route. Under the WFTO Guarantee System9, organizations rather than products
5 Further information on the certification process of FLO-CERT can be found on their website: http://www.flo-
cert.net/flo-cert/certification.html. 6 A list of all operators certified by FLO-CERT is available on their website: http://www.flo-cert.net/flo-cert/29.html.
7 If producers or traders want to use the FAIRTRADE mark for promotional purposes or if companies located in a
country without a national labeling initiative want to use it, then FLO International is responsible and should be contacted (FLO International, 2011f). 8 Worldshops are shops that have Fair Trade at the core of their activities. They mainly offer products that have
been sourced via the integrated supply route, but some products carrying the FAIRTRADE certification mark can also be purchased there (Cremona and Durán, 2013). 9 The system has been put into place in 2013 and the aim is that a third party will control the implementation of the
WFTO Guarantee System by Fair Trade organizations (WFTO, 2013d, Chapter 2).

13
are certified and the WFTO product label is rewarded once an organization fulfills the Fair
Trade standards set by the WFTO (WFTO, 2013d, Introduction10).
All members of the WFTO, whether they are trading or non-trading members, have to fulfill
a certain set of requirement, so called compliance criteria, and are regularly assessed. The
requirements differ depending on the type of member and are generally less strict for non-
trading members. For trading members, all activities referring to sourcing, producing,
manufacturing and trading are part of the Guarantee System and so are all activities between
an organization and its suppliers (WFTO, 2013d, Chapter 2). Trading members are composed
of Producer Fair Trade organizations, such as producer cooperatives or producer
associations and Marketing Fair Trade organizations that trade and market Fair Trade
products. This category includes, amongst others, exporters, importers, retailers and
wholesalers. Non-trading members are, for example, Fair Trade support or network
organizations and they can use the WFTO product label only if they opt to fulfill the
requirements of the Guarantee System (WFTO, 2013d, Glossary and Chapter 5).
Three types of assessment are practiced to ensure compliance with the WFTO Fair Trade
standards: self-assessment, monitoring audits and peer visits. In the case of non-trading
members, a self-assessment report, an initial monitoring audit and a peer visit is only
conducted once. After having qualified as a WFTO member, no further assessments are
undertaken, but handing in of audited accounts and annual reports is mandatory (WFTO,
2013d, Chapter 5). For trading members assessments are conducted on a regular basis and
include the above mentioned assessment types11 (WFTO, 2013d, Chapter 7). Retailers can
purchase various food and non-food products online via the wholesale marketplace of the
WFTO, where certified members offer their products. Consumers can also find these products
in Worldshops (Cremona and Durán, 2013).
Figure 1 shows the product certification route and the integrated supply route, practiced by
FLO International and the WFTO, respectively. The middle part shows a simplified version of
the supply chain in the Fair Trade system12, whereas the upper part shows certification applied
by FLO International and the lower part of the Figure, depicts certification related to the WFTO
system.
10
The website provides the links to the various sections of the WFTO Guarantee System Handbook which can be downloaded as pdf files. To find the information given in the text easily, the according part of the Handbook is given behind the source. 11
For detailed information on the WFTO certification process, please refer to the website of the WFTO: http://www.wfto.com. 12
The final consumer would be the last step in the supply chain following the retailer, but since they are not directly affected by certification, they have not been depicted in Figure 1.

14
Figure 1: Certification Systems along the Supply Chain in the Fair Trade System Source: Adapted from WFTO, 2013d; FLO-CERT, 2013a; 2013b; n.d.(b)
Producer Processor Exporter/
Importer Manufacturer/
Distributor Wholesaler Retailer
Products
certified by
FLO-CERT
and/or national
labeling initiative
Products certified by FLO-CERT Products certified by
national labeling initiative
Producer Fair
Trade
Organizations:
Assessed under
Guarantee
System, certified
by WFTO as
WFTO member
Marketing Fair Trade Organizations:
Assessed under Guarantee System, certified by WFTO, or by Fair Trade Organization via the Internal Monitoring System in
case of an unverified supplier. Only those that have been certified by WFTO become WFTO members and can trade their
products as Fair Trade.
Product-certification route applied by FLO International: Rewards products with the FAIRTRADE certification mark (product label).
Integrated supply route applied by the WFTO: Allows organizations to use the WFTO product label on their products and the WFTO logo on their
publications (organizational label).

15
The major difference between the two systems is that via the product-certification route
products are certified, whereas via the integrated supply route, organizations are certified. It is
thus also possible that organizations and companies belong to both systems and use both
labels - the FAIRTRADE certification mark and the WFTO product label. A retailer can also
receive the WFTO logo, whereas the FAIRTRADE certification mark gives no statement about
an organization or company that sells Fair Trade products. A further difference is the way in
which certification, as outlined above, is conducted. The product-certification route stresses
external, third-party inspection, whereas in the integrated supply route self-assessment and
peer reviews are of greater importance. Both organizations, FLO International and the WFTO,
are membership-based organizations. In case of FLO International, however, the membership
is narrower and consists mainly of the national labeling initiatives situated in the Global
North.13 The WFTO counts over 400 members in 70 countries in 2014. Yet, in both systems,
the Fair Trade principles described at the beginning of the chapter are of central concern
(Cremona and Durán, 2013; WFTO, 2013b).
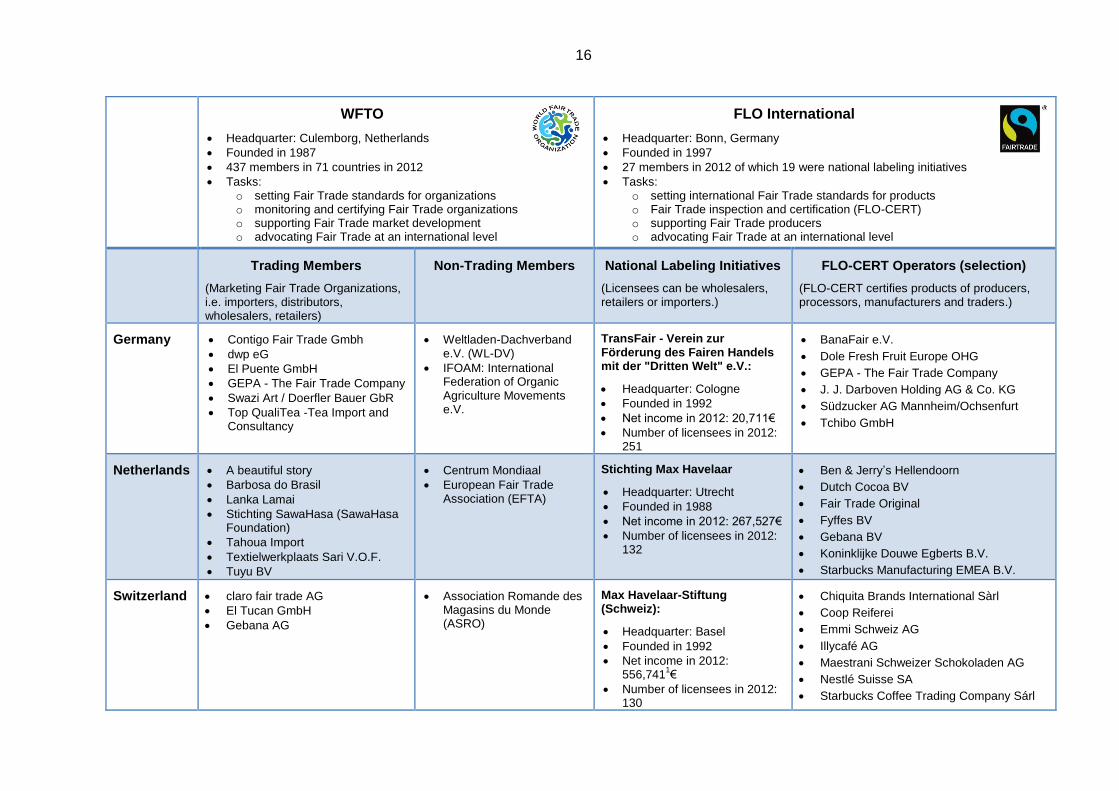
Fair Trade organizations take a crucial role in the Fair Trade system. Table 6 thus gives an
overview of the major organizations and their members in the selected European countries. It
also lists some companies being active in selling Fair Trade products and provides a summary
of the topics discussed in this chapter.
FLO International and the WFTO are both umbrella organizations uniting many institutions that
are linked to Fair Trade. The WFTO had a total income of nearly €0.4 million in 2012. FLO
International’s total income amounted to €15.0 million in 2012. The higher income of FLO
International compared to the WFTO is mainly due to higher membership fees on behalf of
FLO, calculated as a percentage of license fee income of the national labeling initiatives. FLO
further received approx. €6 million via grants (FLO International, 2014; WFTO, 2013c).
13
Further members include three producer networks and five Fair Trade marketing organizations.
16
WFTO
Headquarter: Culemborg, Netherlands
Founded in 1987
437 members in 71 countries in 2012
Tasks: o setting Fair Trade standards for organizations o monitoring and certifying Fair Trade organizations o supporting Fair Trade market development o advocating Fair Trade at an international level
FLO International
Headquarter: Bonn, Germany
Founded in 1997
27 members in 2012 of which 19 were national labeling initiatives
Tasks: o setting international Fair Trade standards for products o Fair Trade inspection and certification (FLO-CERT) o supporting Fair Trade producers o advocating Fair Trade at an international level
Trading Members
(Marketing Fair Trade Organizations, i.e. importers, distributors, wholesalers, retailers)
Non-Trading Members National Labeling Initiatives
(Licensees can be wholesalers, retailers or importers.)
FLO-CERT Operators (selection)
(FLO-CERT certifies products of producers, processors, manufacturers and traders.)
Germany Contigo Fair Trade Gmbh
dwp eG
El Puente GmbH
GEPA - The Fair Trade Company
Swazi Art / Doerfler Bauer GbR
Top QualiTea -Tea Import and Consultancy
Weltladen-Dachverband e.V. (WL-DV)
IFOAM: International Federation of Organic Agriculture Movements e.V.
TransFair - Verein zur Förderung des Fairen Handels mit der "Dritten Welt" e.V.:
Headquarter: Cologne
Founded in 1992
Net income in 2012: 20,711€
Number of licensees in 2012: 251
BanaFair e.V.
Dole Fresh Fruit Europe OHG
GEPA - The Fair Trade Company
J. J. Darboven Holding AG & Co. KG
Südzucker AG Mannheim/Ochsenfurt
Tchibo GmbH
Netherlands A beautiful story
Barbosa do Brasil
Lanka Lamai
Stichting SawaHasa (SawaHasa Foundation)
Tahoua Import
Textielwerkplaats Sari V.O.F.
Tuyu BV
Centrum Mondiaal
European Fair Trade Association (EFTA)
Stichting Max Havelaar
Headquarter: Utrecht
Founded in 1988
Net income in 2012: 267,527€
Number of licensees in 2012: 132
Ben & Jerry’s Hellendoorn
Dutch Cocoa BV
Fair Trade Original
Fyffes BV
Gebana BV
Koninklijke Douwe Egberts B.V.
Starbucks Manufacturing EMEA B.V.
Switzerland claro fair trade AG
El Tucan GmbH
Gebana AG
Association Romande des Magasins du Monde (ASRO)
Max Havelaar-Stiftung (Schweiz):
Headquarter: Basel
Founded in 1992
Net income in 2012: 556,741
1€
Number of licensees in 2012: 130
Chiquita Brands International Sàrl
Coop Reiferei
Emmi Schweiz AG
Illycafé AG
Maestrani Schweizer Schokoladen AG
Nestlé Suisse SA
Starbucks Coffee Trading Company Sárl

17
Trading Members Non-Trading Members National Labeling Initiatives FLO-CERT Operators (selection)
Austria EZA Fairer Handel GmbH Arbeitsgemeinschaft zur Förderung der Weltläden (ARGE)
FAIRTRADE Österreich - Verein zur Förderung des fairen Handels mit den Ländern des Südens
Headquarter: Vienna
Founded in 1993
Net income in 2012: 10,268€
Number of licencees in 2012: 75
AGRANA Fruit Austria GmbH
C+C Pfeiffer GmbH
Lemberona HandelsgmbH
SPAR Österreichische Warenhandels-AG
Regio Kaffeerösterei
UNIVEG Austria GmbH
zotter Schokoladen Manufaktur GmbH
France Artisanat Sel
Au-delà des Frontières (ADDF)
BeadforLife Europe
Boutic Ethic
Solidar'Monde
Fédération Artisans du Monde
Plate-Forme pour le Commerce Equitable (PFCE)
Association Max Havelaar France
Headquarter: Montreuil
Founded in 1992
Net income in 2012: 150,953€
Number of licensees in 2012: 215
Dole France SAS
Ethiquable
Nestlé France
ProNatura SA
Sageco
Segafredo Zanetti France SAS
Unilever France
Univeg Katope France
United Kingdom
Created Distribution
Ecoffins
Global Crafts Europe Ltd
Pachacuti Ltd
People Tree Ltd
Re-wrap association
The Fair Trade Furniture Co Ltd
The India Shop / New Overseas Traders
Wayfairer Ltd
Shared Interest Society Ltd
Traidcraft Exchange
BAFTS - British Association of Fair Trade Shops and Suppliers
Fairtrade Foundation:
Headquarter: London
Founded in 1992
Net income in 2012: 931,690
2€
Number of licensees in 2012: 354
British Sugar plc
Lush Manufacturing Ltd
MARS Inc.
Nestlé UK Ltd
Traidcraft plc
Twin Trading Ltd
1 Data in € is calculated with the average exchange rate of 1.2053CHF/€ (Source: Deutsche Bundesbank, 2014).
2 Data in € is calculated with the average exchange rate of 0.81087£/€ (Source: Deutsche Bundesbank, 2014).
Table 6: Overview of Major Fair Trade Organizations and Participants in Selected European Countries Source: Adapted from FLO International, 2014; WFTO, 2013a; 2013d; FLO-CERT, n.d.(b); Stichting Max Havelaar, 2013b; Transfair, 2014; Association Max Havelaar France, 2012b; 2014; Fairtrade Österreich, 2014; Max Havelaar Stiftung, 2013; The Fairtrade Foundation 2013a; 2013b; Cremona and Durán, 2013

18
The second column in Table 6 displays members of the WFTO. They have Fair Trade at the
core of their activities and can be separated into trading and non-trading members. Under
trading members important trading organizations of Fair Trade products can be found, for
example:
GEPA - The Fair Trade Company (Germany)
claro fair trade AG (Switzerland)
EZA Fairer Handel GmbH (Austria)
Solidar’Monde (France)
Not all important trading organizations of Fair Trade products, however, are trading members
of the WFTO. Traidcraft plc, for example, listed in the last column, is a major Fair Trade
importing organization in the UK and works very closely with Traidcraft Exchange, listed under
non-trading members in Table 6. They both belong to the Traidcraft Foundation (Traidcraft,
2014a; 2014b). Fair Trade Original is no longer a trading member of the WFTO. It ended its
membership in 2011, yet it is a major importer of Fair Trade products and an important Fair
Trade organization in the Netherlands. But it is listed in the last column of Table 6 as some of
its products are certified by FLO-CERT. Thus, the major Fair Trade organizations are either
connected to the WFTO, FLO International or both.
In the column of non-trading members, organizations that unify the Worldshops in the selected
countries are listed, e.g. Weltladen-Dachverband. Also, further non-profit organizations that
support Fair Trade via networking and campaigning can be found there.
Organizations belonging to FLO International are the national labeling initiatives (listed in the
third column of Table 6) that provide the license for using the FAIRTRADE certification mark,
as well as FLO-CERT, being responsible for certifying products of producers, processors,
manufacturers and traders. Whether an organization is certified by FLO-CERT and/or if it is a
licensee of the national labeling initiative, does not provide any information about the practices
of that organization with regard to Fair Trade. It simply allows them to sell all or part of their
products as Fair Trade under the system operated by FLO International (Cremona and Durán,
2013). The third column gives the number of all licensees regarding the national labeling
initiatives. Some licensees are also traders listed in column four, such as GEPA - The Fair
Trade Company (Transfair, n.d.(a)). The last column shows a selection of traders being
certified by FLO-CERT, thus allowing them to sell some of their products as Fair Trade (FLO-
CERT, n.d.(b)). As can be seen, an organization can be a member of the WFTO and sell its
products under the system operated by FLO International.

19
4 Development of Fair Trade Sales
The sales of Fair Trade products showed a remarkable development during the last decade.
The global sales volume nearly quintupled since 2005. Moreover, Germany realized an
enormous growth up to more than €500 million in 2012 after a period of constant sales in the
beginning of this century (approximately €50 million per year). Over the same period three
main events characterized the Fair Trade development:
The association and improved cooperation of different national and international Fair
Trade organizations. An example is the publication of a common definition of Fair Trade
by the international organizations “EFTA, FLO, IFAT and NEWS!” in 2001 (see
Chapter 3).
The incorporation of national labeling initiatives under the roof of FLO International in
1997, the introduction of an international Fair Trade seal (FAIRTRADE certification mark)
in 2002 and the split of FLO into two independent organizations “Fairtrade standards and
producer support” as well as “Inspections and Certification” (FLO-CERT) in 2004 (FLO
International, 2011d).
The entry of Fair Trade products into the conventional wholesale and retail trade.
The last-mentioned point showed a paradigm change in the sales and distribution of Fair
Trade products. In the beginning of the Fair Trade development most of the Fair Trade
products were sold in Worldshops; but during the last decade the leading Fair Trade initiatives
started co-operations with conventional trade chains. “The fairtrade movement diverged into
two discrete paths: an idealist orientation toward trade and justice, structural change, and
human solidarity; and an instrumentalist focus on certification and market expansion.“ (Dolan,
2008). In Chapter 2, one could see that most of the analyzed European wholesalers and retail
traders cooperate with the national labeling initiatives, selling some of their own-branded
products as Fair Trade.
More than 50% of the Fair Trade retail sales, realized by FLO during the years 2008 to 2012,
are represented by the six considered European countries. This share increased to above two-
thirds in 2012, because Fair Trade USA (FTUSA) announced resignation of its membership
from the international Fair Trade system in September 2011. Insofar, Table 7 does not include
the annual growth rate of total Fair Trade sales.
All considered countries (except France) realized two digit growth rates of Fair Trade sales.
Especially the over proportional growth rates in Germany, the United Kingdom and the
Netherlands are outstanding. The Fairtrade Foundation was able to realize this growth on the
background of an already existing high sales volume.

20
Development of Fair Trade Retail Sales (in million €)
2008 2009 2010 2011 2012 Annual
Growth Rate 2008-2012
Germany 212.8 267.5 340.0 400.5 533.1 25.81%
United Kingdom 880.6 897.3 1,344.0 1,531.5 1,904.9 21.28%
Switzerland 168.8 180.2 219.9 264.8 311.6 16.56%
Netherlands 60.9 85.8 119.0 147.3 186.1 32.22%
Austria 65.2 72.0 87.0 100.0 107.0 13.18%
France 255.6 287.7 303.3 315.4 345.8 7.85%
Total 1,643.9 1,790.5 2,413.2 2,726.2 3,388.5 19.82%
FLO total 2,954.4 3,394.2 4,360.9 4,916.4 4,802.41 1 Without sales in the United States of America
Table 7: Fair Trade Retail Sales in 6 European Countries 2008-2012 Source: Adapted from FLO International, 2011a; 2013; 2014
It should be mentioned that these sales volumes are still very small with respect to the total
consumption expenditures of private households. In the period considered, the German
consumption expenditure for food and non-alcoholic beverages added up to €149.1 billion in
2008 and €169.9 billion in 2012 (see Table 1 in Chapter 2).
The volume of Fair Trade sales represents less than 0.5% of these expenditures. Two
restrictions should be mentioned. The Fair Trade sales published by national labeling
initiatives include non-food products like flowers and textiles. Insofar the calculated share of
0.5% is overestimated. On the other hand, an important part of the consumption expenditures
for food and nonalcoholic beverages has no direct relation to Fair Trade. As an example the
total German expenditures for coffee, tea and cacao had a value of €5.36 billion (in 2010),
whereas the sales of meat products reached a value of more than €30 billion. In contrast to
coffee and tea, meat is no Fair Trade product (Statista, 2014b; 2014c).
Possible future developments can be estimated with the help of an analysis of the per capita
expenditures for Fair Trade products. Table 8 shows enormous differences in the considered
countries.

21
Per Capita Expenditures for Fair Trade Products (in €/person)
2008 2009 2010 2011 2012 Annual
Growth Rate 2008-2012
Germany 2.59 3.26 4.16 4.9 6.51 25.91%
United Kingdom 14.31 14.47 21.51 24.30 30.00 20.33%
Switzerland 22.23 23.39 28.25 33.64 39.17 15.21%
Netherlands 3.71 5.21 7.18 8.84 11.12 31.58%
Austria 7.84 8.62 10.39 11.9 12.73 12.88%
France 3.99 4.47 4.69 4.85 5.29 7.31%
Table 8: Per Capita Fair Trade Retail Sales in 6 European Countries 2008-2012 Source: Adapted from Eurostat, 2014c; FLO International, 2011a; 2013; 2014
Switzerland showed the highest per capita consumption during the considered period. In 2012,
a Swiss consumer spent €39.17 per year on Fair Trade products. Germany realized annual
average growth rates of more than 25% during the same period, but the result in 2012
represents less than one sixth of the Swiss per capita consumption. Switzerland had a
population of 7.9 million persons whereas the German population amounted to 81.9 million in
2012 (Eurostat, 2014c). If Germany was able to realize a per capita consumption comparable
to Switzerland, the German sales of Fair Trade products would increase up to €3.2 billion per
year.
Unfortunately, a complete comparison of the consumption of specific products in the
considered countries is not possible. Germany, the Netherlands, Switzerland and France
publish the sales of Fair Trade products in volumes (tons or liters), whereas publications of
Fair Trade organizations in the United Kingdom and Austria present values (in the respective
currency). For that reason the figures of these countries, shown in Tables 9 to 13, are
presented in shaded areas. Before the data of the six countries are compared, it is helpful to
consider their different populations in 2012 (Eurostat, 2014c):
Germany: 81.918 million
Switzerland: 7.930 million
Netherlands: 16.752 million
France: 65.433 million
United Kingdom: 63.244 million
Austria: 8.458 million

22
Fair Trade Retail Sales by Products – Coffee
2008 2012
Annual Growth Rate 2008-2012
Germany (in tons) 4,962 9,322 17.1%
Switzerland (in tons) 1,459 2,630 15.9%
Netherlands (in tons) 3,091 4,052 7.0%
France (in tons) no data 9,308 no data
United Kingdom (in million €) (in tons)
172.4 (9,666)
237.3 (no data)
8.3% (no data)
Austria (in million €) 12.4 19.3 11.7%
Table 9: Fair Trade Sales of Coffee in 6 European Countries 2008-2012 Source: Adapted from Transfair 2010; 2014; Stichting Max Havelaar, 2009; 2013b; Association Max Havelaar France, 2014; Fairtrade Österreich, 2010; 2014; The Fairtrade Foundation, 2011; Max Havelaar Stiftung 2009; 2013
Coffee is the top-selling Fair Trade product in Germany. Its share of the total German Fair
Trade revenues was 47.1% in 2012 (Statista, 2014a). The average annual growth rate of
coffee consumption was 17.1% and thus the highest of all reviewed countries. However, the
9,322 tons of Fair Trade coffee represent not more than 1.59% of the 584,950 tons total
consumption of raw coffee in 2012 (Deutscher Kaffeeverband, n.d.). The German per capita
consumption of Fair Trade coffee was 0.11 kg (roasted coffee), whereas the total per capita
consumption amounted to 7.27 kg per year (raw coffee)14. Insofar the sales values are
remarkable, but they still represent a very small market share.
Switzerland holds the highest per capita Fair Trade coffee consumption. In 2012, an average
Swiss consumer purchased 0.33 kg of Fair Trade coffee. But this figure is again relatively
small compared to the total per capita consumption of 7.85 kg.
In 2012, consumers in the United Kingdom spent more than €3.00 on Fair Trade coffee on
average. This is an astonishing result for a country with the lowest per capita coffee
consumption (2.79 kg in 2012) of all analyzed countries. On the contrary, Austrian consumers
spent €2.28 on Fair Trade coffee. This result seems to be relatively low, as the Austrian coffee
consumption per capita amounted to 9.00 kg in 2012 (Deutscher Kaffeeverband, n.d.).
14
During the process of coffee roasting, raw coffee loses approx. 20% of its volume.

23
Fair Trade Retail Sales by Products - Tea
2008 2012 Annual Growth Rate
2008-2012
Germany (in tons) 202 200 -0.2%
Switzerland (in tons) 36 45 3.6%
Netherlands (in tons) 77 638 69.8%
France (in tons) no data 418 no data
United Kingdom (in million €) 81.4 98.3 4.8%
Austria (in million €) no data no data no data
Table 10: Fair Trade Sales of Tea in 6 European Countries 2008-2012 Source: Adapted from Transfair 2010; 2014; Stichting Max Havelaar, 2009; 2013b; Association Max Havelaar France, 2014; Fairtrade Österreich, 2010; 2014; The Fairtrade Foundation, 2011; Max Havelaar Stiftung 2009; 2013
In comparison to the other considered countries, the United Kingdom has by far the highest
per capita tea consumption (2.1 kg in 2011). The other countries realized an annual
consumption per person of less than one kilogram. France shows the lowest per capita
consumption (0.3 kg), whereas German and Dutch consumers purchase between 0.5 kg and
1.0 kg (Food and Agricultural Organizations of the United Nations, 2014). The Fair Trade sales
of tea illustrate very different consumer behaviors in the countries. Dividing the sales in the
United Kingdom (€98.3 million in 2012) by an assumed price of 40.00 €/kg, sales amount to
2,500 tons per year. This result reflects the British preference for tea, when compared to the
other countries. However, it is astonishing that the British sales volume of Fair Trade coffee
accounts for more than twice the sales volume of Fair Trade tea.
The sale of fairly traded tea seems to play no substantial role in Germany. The market share
of tea accounted for 1.5% of total Fair Trade sales in 2012 compared to the market share of
coffee of 47,1% (Statista, 2014a). Furthermore, there was no growth of sales volumes
between 2008 and 2012. The development in Switzerland is comparable with regard to the
level of growth of tea consumption. German consumers purchase 2.5 g of Fair Trade tea on
average, Swiss consumers 5 g.
On the other hand, the Netherlands realized an extraordinary increase in sales of fairly traded
tea. The annual growth rate reached approximately 70% (!). As a result, the Dutch
consumption of Fair Trade tea was three times higher than the German purchases in 2012.
Nevertheless, the per capita consumption of Fair Trade tea is still quite low (38 g).

24
Fair Trade Retail Sales by Products - Bananas
2008 2012 Annual Growth Rate
2008-2012
Germany (in tons) 12,000 21,139 15.2%
Switzerland (in tons) 28,019 27,958 -0.1%
Netherlands (in tons) 4,634 21,771 47.2%
France (in tons) no data 9,308 no data
United Kingdom (in million €) 231.8 299.1 6.6%
Austria (in million €) 20.9 26.8 11.7%
Table 11: Fair Trade Sales of Bananas in 6 European Countries 2008-2012 Source: Adapted from Transfair 2010; 2014; Stichting Max Havelaar, 2009; 2013b; Association Max Havelaar France, 2014; Fairtrade Österreich, 2010; 2014; The Fairtrade Foundation, 2011; Max Havelaar Stiftung 2009; 2013
In contrast to coffee and tea, ad valorem taxes are imposed on the imports of bananas from
non EU/ACP-countries to the European Union. The production of bananas in Italy, Spain and
so called ACP-countries (former colonies of France and the United Kingdom in Africa, the
Caribbean and the Pacific) is protected in this way. Switzerland imposes no ad valorem taxes
on bananas (European Commission, 2011; World Trade Organization, 2014).
The worldwide production of bananas amounts to 100 million tons. The biggest part is
consumed in the producing countries. Only one fifth of the production is provided for exports.
German consumers purchase approximately 800,000 tons of bananas every year
(Bundesministerium für Ernährung und Landwirtschaft, 2014). Insofar, the German
consumption of Fair Trade bananas represented nearly 2.5% of the total banana consumption
in 2012. However, the growth rates were relatively high during the last years. On the other
hand, the development and level of the Dutch and Swiss Fair Trade sales of bananas are
remarkably high. The average annual growth rates of the Netherlands were 47.2%. As a result
the levels of sales in Germany and the Netherlands are nearly equal, although the populations
differ by a factor of five. The level of consumption in Switzerland is even more impressive. The
per capita consumption of Fair Trade bananas amounts to 3.5 kg (Germany 250 g) per capita.
According to Max Havelaar Stiftung, Swiss Fair Trade bananas represent more than 50% of
the total banana sales. For example, 95% of bananas sold by Coop Schweiz, the second
largest retailer in Switzerland, are Fair Trade certified.
Even more notable are the absolute values for the United Kingdom. The consumption of Fair
Trade bananas amounted to approximately 190,000 tons in 2008, thereof 170,000 tons
conventional and 20,000 tons organic bananas (Smith, 2010). The corresponding sales
volume increased by 7% annually until 2012.

25
Fair Trade Retail Sales by Products - Fruit Juice
2008 2012 Annual Growth Rate
2008-2012
Germany (in 1,000 liters) 4,465 6,108 8.1%
Switzerland (in 1,000 liters) 9,558 10,520 2.4%
Netherlands (in 1,000 liters) 1,377 1,749 6.2%
France (in tons) no data 4,689 no data
United Kingdom (in million €) 26.5 17.9 -9.4%
Austria (in million €) 5.9 8.6 9.9%
Table 12: Fair Trade Sales of Fruit Juice in 6 European Countries 2008-2012 Source: Adapted from Transfair 2010; 2014; Stichting Max Havelaar, 2009; 2013b; Association Max Havelaar France, 2014; Fairtrade Österreich, 2010; 2014; The Fairtrade Foundation, 2011; Max Havelaar Stiftung 2009; 2013
The consumption of Fair Trade juice seems to have no importance in most of the countries.
German sales of fruit juice represented nearly 1.9% of the total Fair Trade sales in 2012. The
German per capita consumption of Fair Trade fruit juice was 0.07 liters, whereas the total per
capita consumption of juice amounted to 33.9 liters (Statista, 2014d). The growth rates of Fair
Trade juice consumption are relatively low in comparison to the other considered products.
Fair Trade Retail Sales by Products - Sugar
2008 2012 Annual Growth Rate 2008-2012
Germany (in tons) 1,250 2,335 15.6%
Switzerland (in tons) 429 493 3.5%
Netherlands (in tons) 94 844 73.0%
France (in tons) no data 4,322 no data
United Kingdom (in million €) 135.3 677.2 49.6%
Austria (in million €) no data no data no data
Table 13: Fair Trade Sales of Sugar in 6 European Countries 2008-2012 Source: Adapted from Transfair 2010; 2014; Stichting Max Havelaar, 2009; 2013b; Association Max Havelaar France, 2014; Fairtrade Österreich, 2010; 2014; The Fairtrade Foundation, 2011; Max Havelaar Stiftung 2009; 2013
The sales of sugar and sugar products showed very high growth rates in the Netherlands and
the United Kingdom. The British consumption increased to €677.2 million in 2012. The share
of all Fair Trade sales was 25%, in contrast to Germany with a share of 1.9% (Statista, 2014a).
The development in the United Kingdom is influenced by the activities of market leaders like
Cadbury and Nestlé. Examples are the introduction of Fair Trade chocolate by Cadbury and
the “KitKat four finger” by Nestlé. Furthermore, the British data includes the sales of sugar
products, e.g. chocolate, whereas the German data represents the consumption of raw sugar.
26
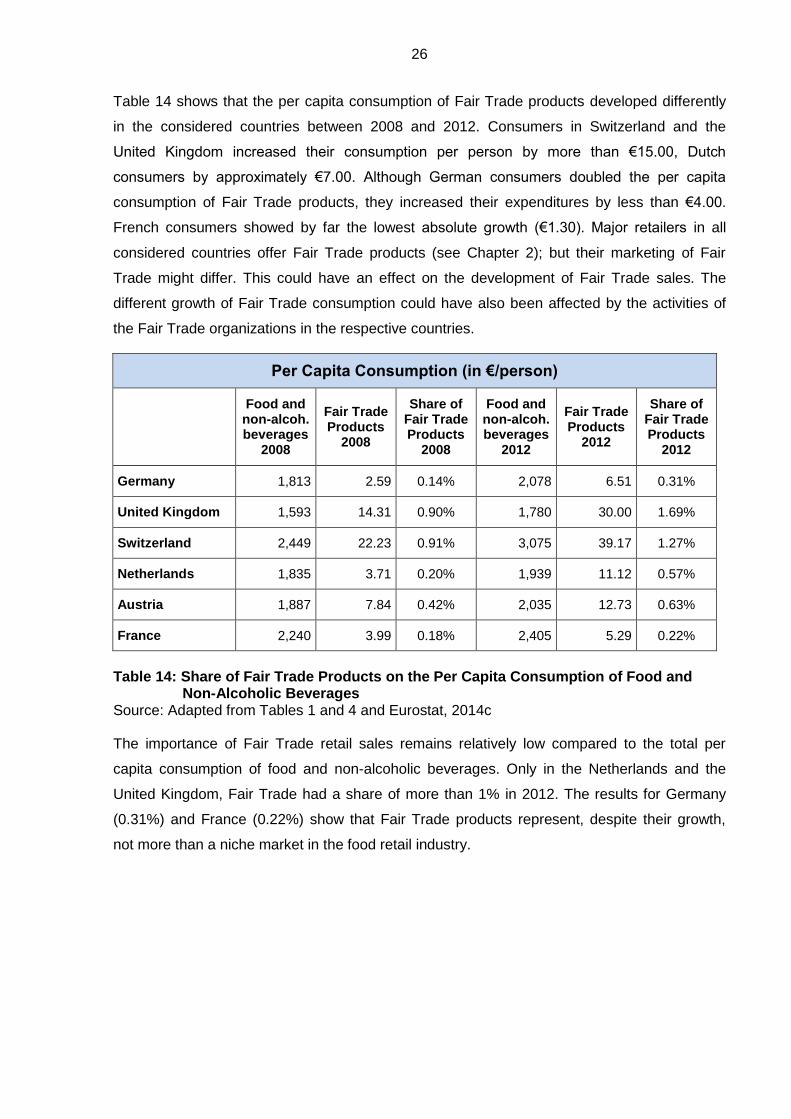
Table 14 shows that the per capita consumption of Fair Trade products developed differently
in the considered countries between 2008 and 2012. Consumers in Switzerland and the
United Kingdom increased their consumption per person by more than €15.00, Dutch
consumers by approximately €7.00. Although German consumers doubled the per capita
consumption of Fair Trade products, they increased their expenditures by less than €4.00.
French consumers showed by far the lowest absolute growth (€1.30). Major retailers in all
considered countries offer Fair Trade products (see Chapter 2); but their marketing of Fair
Trade might differ. This could have an effect on the development of Fair Trade sales. The
different growth of Fair Trade consumption could have also been affected by the activities of
the Fair Trade organizations in the respective countries.
Per Capita Consumption (in €/person)
Food and non-alcoh. beverages
2008
Fair Trade Products
2008
Share of Fair Trade Products
2008
Food and non-alcoh. beverages
2012
Fair Trade Products
2012
Share of Fair Trade Products
2012
Germany 1,813 2.59 0.14% 2,078 6.51 0.31%
United Kingdom 1,593 14.31 0.90% 1,780 30.00 1.69%
Switzerland 2,449 22.23 0.91% 3,075 39.17 1.27%
Netherlands 1,835 3.71 0.20% 1,939 11.12 0.57%
Austria 1,887 7.84 0.42% 2,035 12.73 0.63%
France 2,240 3.99 0.18% 2,405 5.29 0.22%
Table 14: Share of Fair Trade Products on the Per Capita Consumption of Food and Non-Alcoholic Beverages Source: Adapted from Tables 1 and 4 and Eurostat, 2014c
The importance of Fair Trade retail sales remains relatively low compared to the total per
capita consumption of food and non-alcoholic beverages. Only in the Netherlands and the
United Kingdom, Fair Trade had a share of more than 1% in 2012. The results for Germany
(0.31%) and France (0.22%) show that Fair Trade products represent, despite their growth,
not more than a niche market in the food retail industry.

27
5 Activities of Fair Trade Organizations
In this chapter, the activities of the national labeling initiatives in the selected countries will be
described in more detail, as they can play an important role for Fair Trade development within
the retail industries. Since the national labeling initiatives are mainly financed by license fees
paid by Fair Trade licensees, these fees will be examined in the following. Furthermore, this
chapter deals with specific activities of the national labeling initiatives and the trust in and the
recognition of the FAIRTRADE certification mark in the six selected European countries.
Table 15 shows the license fees for selected products or product categories in the six
European countries that are issued by the corresponding national labeling initiative. The
license fees for Germany, Austria, France and the Netherlands are mostly calculated in
volume terms and generally comparable. In the Netherlands, however, the license fee for
juice, cacao/drinking chocolate and chocolate, biscuits and confectionary are calculated
differently. It is a value-based license fee levied on the purchase value of the product. The
national labeling initiatives of Switzerland and the United Kingdom charge value-based license
fees, which will be explained later in more detail. Furthermore, the classification of the product
groups differs among some of the countries, e.g. the license fee for fresh tropical fruit includes
vegetables in the Netherlands, but excludes bananas in Austria.15 The national labeling
initiative of France, Association Max Havelaar, issues various license fees for different fruits
(Fairtrade Österreich 2013a; Association Max Havelaar France, 2012a; Stichting Max
Havelaar, 2013c).
In every country, the license fee refers to the net value, meaning either the weight of the
product without packaging or the net invoice value, wholesale value or purchase value in the
respective currency. An exception to this is Switzerland, where the national labeling initiative,
Max Havelaar Stiftung, charges a fee of 2% on the final sales price (Max Havelaar Stiftung,
n.d.(c)).
The Fairtrade Foundation, the national labeling initiative of the United Kingdom, issues a
value-based license fee that depends on the annual sales volume of the licensee. For the first
£5 million of annual sales, a 1.7% license fee is charged. If the annual sales volume is
between £5 and £10 million, the license fee is 1.7% for the first £5 million and 1.6% on the
amount exceeding the £5 million. Thus, the higher the sales, the lower the percentage license
fee on incremental annual sales16 (The Fairtrade Foundation, n.d.(a)).
15
The license fee for bananas amounts to 0.03€/kg in Austria. 16
License fees: 1.3% on incremental annual sales between £10 million and £20 million; 0.9% on incremental annual sales between £20 million and £40 million; 0.6% on incremental annual sales between £40 million and £80 million; 0.4% on incremental annual sales £80 million and £160 million and 0.2% on incremental annual sales over £160 million.

28
License Fees of Selected Product Categories
Germany
(€/kg) United
Kingdom2
Switzerland2
Netherlands
Austria (€/kg)
France (€/kg)
€/kg value
based2
Coffee 0.22 value based value based 0.22 - 0.22 0.18
Juice1 0.03 value based value based - 2.5% 0.03 0.04
Rice 0.08 value based value based 0.08 - 0.08 0.12
Cacao/ Drinking
Chocolate 0.16 value based value based - 2.5% 0.16 0.18
Honey 0.18 value based value based 0.16 - 0.18 0.15
Chocolate 0.22 value based value based - 2.5% 0.22 0.40
Fresh Tropical
Fruit 0.03 value based value based 0.04 - 0.06 0.03
3
Tea 0.42 value based value based 0.42 - 0.42 0.55
Sugar 0.08 value based value based 0.06 - 0.07 0.09
1 Data for juice is given in €/liter.
2 License fees are calculated on the basis of sales.
3 Number refers to fresh bananas.
Table 15: License Fees by Labeling Initiatives in 6 European Countries in 2012 Source: Adapted from TransFair, n.d.(c); The Fairtrade Foundation, n.d.(a); Max Havelaar Stiftung, n.d.(c); Stichting Max Havelaar, 2013c; Fairtrade Österreich 2013a; Association Max Havelaar France, 2012a
Germany, Austria, France and the Netherlands are comparable concerning the levied license
fees, as can be seen in Table 15. The highest fees apply to tea with 0.42 €/kg to 0.55 €/kg,
followed by chocolate with 0.22 €/kg to 0.40 €/kg and coffee with 0.18 €/kg to 0.22 €/kg. The
relatively big gap between the fees for chocolate in Germany or Austria compared to France is
noticeable here. Low license fees, in contrast, account for groceries like sugar with around
0.07 €/kg, as well as for fresh tropical fruit with 0.03 €/kg to 0.06 €/kg and juice with 0.03 €/kg
or 0.04 €/kg.
There are further similarities regarding license fees in the selected countries concerning
minimum fees and reductions or discounts. A minimum license fee is issued for all licensees
and varies across the countries. This minimum fee is usually used to cover the administrative
costs of the national labeling initiative. Normally, licensees pay a minimum license fee

29
between €12317 (in the United Kingdom) and €2,000 (in the Netherlands and France) per year,
which can be paid quarterly. Besides, most national labeling initiatives grant reductions of or
give discounts on the license fees. These discounts or reductions offered to the licensee
depend on the type of the licensee and its activities. Reductions are granted e.g. for
companies that count as small licensees or do not manufacture or process the products
themselves. Discounts are, among other things, granted if the licensee has achieved a high
sales volume during the year. The granted discounts and reductions are additionally linked to
certain conditions, like strict obedience to the Fair Trade regulations and punctual payments of
the license fees (TransFair, n.d.(c); The Fairtrade Foundation, n.d.(a); Max Havelaar Stiftung,
n.d.(c); Stichting Max Havelaar, 2013c; Fairtrade Österreich 2013a; Association Max Havelaar
France, 2012a).
License fees are the major income source of the national labeling initiatives. Further important
sources of income are grants and donations. Table 16 gives an overview of the income and
expenditures incurred by the national labeling initiatives in the selected countries. The number
of licensees and employees gives further information regarding the national labeling initiatives
and indicates the presence of Fair Trade in general in the chosen countries. Of course, the
level of income of the organizations is mainly affected by the level of license fees, which is
linked to the number of licensees. The amount of expenditures and the workforce of the
national labeling initiatives are related to the activities of every organization. The expenditures
are composed of administrative and staff costs, costs for licensing and market development,
support for products and producers and public relations, public education and awareness
rising (The Fairtrade Foundation, 2013a; TransFair, 2014; Fairtrade Österreich, 2014; Stichting
Max Havelaar, 2013b; Association Max Havelaar France, 2014; Max Havelaar Stiftung, 2013).
With a total income of approximately €17.8 million and total expenditures of €16.0 million
realized by The Fairtrade Foundation, 354 licensees and 101 employees, the national
labeling initiative in the United Kingdom is the biggest one of the compared organizations.
Fairtrade Österreich is the smallest organization in terms of size, with a total income of €1.7
million and total expenditures of €1.6 million, 15 employees and 75 licensees. The income and
expenditures of the other four labeling initiatives amounted to around €5 million in 2012.
Moreover, the number of licensees and employees in every country seems to be related to the
amount of total income and expenditures incurred by the national labeling initiatives. In
Germany, Switzerland and Austria, part of the employees in the national Fair Trade
organizations work part-time, resulting in a higher headcount. In Germany, 36 employees work
for 32 full-time positions. In Austria, 15 employees share 11 full-time positions and in
17
Data in € is calculated with the average exchange rate of 0.81087£/€ for 2012 (Source: Deutsche Bundesbank, 2014).

30
Switzerland 28 employees are distributed to 21.25 full-time jobs (TransFair, 2014; Max
Havelaar Stiftung, 2013; Fairtrade Österreich, 2013b).
Key Data of National Labeling Initiatives
Total Income (in million €)
Number of Licensees
Total Expenditures (in million €)
Number of Employees
TransFair (Germany)
5.6 251 5.5 36
The Fairtrade Foundation (United Kingdom)1
17.8 354 16.0 101
Max Havelaar Stiftung (Schweiz)2
6.1 130 5.8 28
Stichting Max Havelaar (Netherlands)
3.9 132 3.7 18
Fairtrade Österreich (Austria)
1.7 75 1.6 15
Association Max Havelaar (France)
4.3 215 4.1 23
1 Data in € is calculated with an average exchange rate of 0.81087£/€ for 2012.
2 Data in € is calculated with an average exchange rate of 1.2053CHF/€ for 2012.
(Source: Deutsche Bundesbank, 2014)
Table 16: Key Indicators of National Labeling Initiatives in 2012 Source: Adapted from TransFair, 2014; Trans Fair, n.d.(a); The Fairtrade Foundation, 2013a; The Fairtrade Foundation, 2013b; Max Havelaar Stiftung, 2013; Stichting Max Havelaar, 2013b; Fairtrade Österreich, 2014; Fairtrade Österreich, 2013b; Association Max Havelaar France, 2012b; 2012c; 2014
One of the major tasks of the national labeling initiatives, besides issuing licenses for using the
FAIRTRADE certification mark on products, is the awareness rising for Fair Trade in their
countries. An important way for doing so is the organization of various campaigns. In
Germany, Transfair has established regularly occurring campaigns like the Fairtrade-Coffee-
Day, Fairtrade Chocolate-Day, Banana Day, Fairtrade-Juiceday, Coffee.Break.Fair!, Fair
Week or the annual Fairtrade Breakfast (TransFair, n.d.(d)). Thus, Germany is, besides the
United Kingdom, one of the countries with the highest number of national and international
campaigns. In the United Kingdom, The Fairtrade Foundation initiated the Fairtrade
Fortnight, which is an annual campaign with changing topics. During these two weeks,
31
different events are taking place with the possibility to donate or sign petitions for the
respective topic (The Fairtrade Foundation, 2014). The aim of these campaigns is to remind
consumers of their responsibility and influence via their buying decisions and to encourage
them to purchase Fair Trade products. Such campaigns are established in most of the
countries that participate in Fair Trade. The World Fair Trade Day, initiated by the World Fair
Trade Organization (WFTO), is a globally celebrated day that takes place on the second
Saturday of May each year to promote Fair Trade worldwide (WFTO, 2014).
Besides, there are campaigns that focus on different institutions and they are not restricted to
a certain time, but aim at permanently reminding people about Fair Trade. Institutions can
qualify as being Fair Trade by fulfilling certain requirements, set by the national labeling
initiatives. If all requirements are fulfilled, they can call themselves: Fairtrade University,
Fairtrade College, Fairtrade School, Fairtrade Workplace, Fairtrade Congregation or Fairtrade
Town (The Fairtrade Foundation, n.d.(b)). The applicable criteria can differ depending on the
kind of community they refer to, but are mostly the same for all participating countries.
Recently, more and more Fairtrade Towns have been established in the European countries
compared in this paper. Since Fairtrade Towns are the most common form of Fairtrade
communities, this concept will be explained in more detail. This also gives a general idea on
how the concept of a Fairtrade community, referring to the above mentioned types of
communities, should work.
A Fairtrade Town is by definition:
“[…] any community in which people and organisations use their everyday choices to increase
sales of Fairtrade products and bring about positive change for farmers and workers in
developing countries. […] Becoming a Fairtrade Town is a shared achievement and an
opportunity for local government, schools, businesses, community organisations and activists
to work together. Through doing so, each individual action adds up to make even more of a
difference to farmers in developing countries.” (The Fairtrade Foundation et. al., n.d.(a))
A Fairtrade Town can be initiated by a group of individuals like activists or local companies or
by the administration of a community. The first step is to meet “The Five Goals”:
The local council has to pass a resolution seeking the title “Fairtrade Town”.
Consequently, it will support any activity that promotes Fair Trade and consents to use
Fair Trade products during meetings, in offices or canteens.
Consumers have access to a range of Fair Trade products in local shops, cafés and
restaurants. The target of the amount of offered products can vary among the different
participating countries.

32
Public institutions, like schools, churches, workplaces or other community organizations,
try to use and provide Fair Trade products whenever possible.
Local media has to comment on all activities relating to Fair Trade to increase the
awareness within the community.
A local steering group has to be formed to control, coordinate and develop the steps
towards a Fairtrade Town.
The first community to become a Fairtrade Town was Garstang in Lancashire, England, in
2000. Since then, over 1,000 towns in more than 20 countries have achieved to acquire the
title “Fairtrade Town” (The Fairtrade Foundation et. al., n.d.(b)). The initial approach of
Fairtrade Towns was originated in the United Kingdom, which has the highest number of
Fairtrade Towns, namely 572. Germany follows with 232 towns and Austria comes fourth with
117 communities after Belgium (163 towns) in 2013. The Netherlands and France have 41 and
36 participating Fairtrade Towns, respectively (The Fairtrade Foundation et. al., n.d.(c)).
Switzerland has no Fairtrade Town so far, but it has launched an official website and with
Zurich, Lugano, Grindelwald, Fribourg and Saanen, the first communities have registered to
become the first Swiss “Fairtrade Town” in 2014 (Swiss Fair Trade, 2014).
Such campaigns can contribute to build trust and increase the awareness for Fair Trade. In
2011, FLO International and the international opinion research institute GlobeScan
conducted an online survey on trust and recognition of Fair Trade among 17,000 consumers in
24 countries. It showed that the FAIRTRADE certification mark is the most widely
established ethical label worldwide.
Trust and Recognition of Fair Trade
Recognition of FAIRTRADE
Certification Mark (in %)
Level of Trust in Fair Trade (in %)
Germany 69 72
United Kingdom 96 90
Switzerland 90 87
Netherlands 86 85
Austria 86 81
France 58 61
24-country average 57 64
1 Consumers have seen the mark “often” or “occasionally”.
2 Trust is indicated as 3 or 4 on a scale from 1 to 4, where 1 is “No trust at all” and 4 is “A lot of trust”.
Table 17: Trust and Recognition of Fair Trade in 2011 Source: Adapted from FLO International and GlobeScan Incorporated, 2011

33
The 24-country average exhibits that 64% of all interviewed consumers trust Fairtrade and that
57% recognize the FAIRTRADE certification mark (see Table 17). Recognition is, in this case,
defined by a relatively high frequency (“often” or “occasionally”), with which consumers have
seen the certification mark in everyday life. Furthermore, the survey revealed that nine out of
ten consumers, who have seen the label, also regard it as a trusted label.18 The highest level
of recognition is given in the United Kingdom: 90% of consumers know and trust the
FAIRTRADE certification mark and 96% regularly take notice of the mark. Austria, the
Netherlands and Switzerland follow with 81% to 87% of trust. Germany and France are
countries with less recognition of Fair Trade. In Germany, 69% of consumers have seen the
mark on an occasional or frequent basis and 72% of all surveyed consumers trust in Fair
Trade. In France, the numbers are 58% and 61%, respectively. Of all the 24 surveyed
countries, Italy shows the lowest trust for Fair Trade with only 21% (FLO International and
GlobeScan Inc, 2011).
18 Trust is indicated as 3 or 4 on a scale from 1 to 4, where 1 is “No trust at all” and 4 is “A lot of trust”.
34
6 Conclusion
This paper reveals the noteworthy development of Fair Trade in six European countries:
Austria, France, Germany, the Netherlands, Switzerland and the United Kingdom. One reason
for this development may be the availability of Fair Trade products to a larger consumer base
by including the common food retail industry in the sales channels for FAIRTRADE certified
products. The analysis of the market structure of retailing in the respective countries reveals
that the food retail business is increasingly concentrated and in many cases dominated by the
three to five largest retailers of the respective national market, giving them a remarkable
bargaining power, especially over their suppliers. Fair Trade products have been introduced to
the product assortment of many but not all major food retailing companies. Many of the main
actors in the food retail industry in the six European countries actively participate in Fair Trade
and are licensees of the corresponding national labeling initiatives, which allow them to use
the FAIRTRADE certification mark on selected products.
The Fair Trade system can be split between the product-certification route, operated by FLO
International, and the integrated supply route, run by the WFTO. Both organizations have
developed a label and employ certification. They are also umbrella organizations uniting
various institutions linked to Fair Trade. Yet, the type of label, the way of certification and the
size of the organizations differ. FLO International issues the FAIRTRADE certification mark – a
product label that does not state anything about the practices of the company selling products
carrying this label. The WFTO, on the other hand, awards organizations with the WFTO
product label – an organizational label stating that Fair Trade is at the core of the activities of
organizations selling products with this label. It is further interesting to see that the income of
FLO International was about 27 times higher in 2012 than that of the WFTO. This is partly due
to varying accounting systems, but also to the differing levels of membership fees. Even
though the WFTO has about 15 times more members than FLO International, the membership
fees at FLO International are higher, as they are calculated as a percentage of license fee
income of the national labeling initiatives. The license fees are obtained by companies selling
products carrying the FAIRTRADE certification mark, mainly via the conventional wholesale
and retail trade. FLO International further introduced its label about 10 years earlier than the
WFTO and major retailers are indirectly connected to FLO International as licensees, but not
to the WFTO as trading members. It thus seems that offering products via the conventional
wholesale and retail trade and the introduction of a label, giving consumers information about
a Fair Trade product, have contributed in a positive way to the success of Fair Trade.
The retail sales of Fair Trade products in the analyzed countries more than doubled from 2008
to 2012. Especially the Netherlands, Germany and the United Kingdom realized growth rates
of more than 20%. The sales in the United Kingdom are in so far remarkable as the starting

35
level of sales in 2008 was already very high. The possible further development of Fair Trade
retail sales could be estimated by multiplying the highest per capita consumption of
Switzerland (nearly €40 per person and year, not considering the different purchasing power)
with the population of the six countries (more than 250 million persons). It would lead to a
sales volume of €10 billion per year. Nevertheless, this figure would still be very low in
comparison to the total consumption expenditures in the considered countries. The five most
important Fair Trade food products are coffee, tea, fruit juice, bananas and sugar (products).
In the United Kingdom, they represent more than two-thirds of total Fair Trade retail sales.
Within these products, tea and fruit juice play a minor role, whereas coffee and bananas show
high and increasing sales shares. Sales of sugar increased enormously in the United Kingdom
and the Netherlands. One reason is the introduction of sugar products (e.g. chocolate) by the
market leaders of the food retail industry. But it should be mentioned that the figures for sugar
products can be misleading. A sugar product can be sold as Fair Trade when it partly contains
fairly traded ingredients. Insofar, the figures for the six countries are not completely
comparable.
The last chapter deals with different aspects and activities related to the national Fair Trade
organizations. Sources of income for the national labeling initiatives are, besides grants and
donations, license fees. Generally speaking, a distinction can be made between two different
procedures for charging license fees. In Germany, Austria, France and the Netherlands they
are mostly calculated in volume terms and in the United Kingdom and Switzerland they are
value-based. The highest license fees apply to tea, chocolate and coffee and the lowest to
sugar, fresh tropical fruit and juice. One of the major tasks of the national labeling initiatives,
besides issuing licenses, is the awareness rising for Fair Trade in their countries via organizing
national and international campaigns. Germany is, besides the United Kingdom, one of the
countries with the most national and international Fair Trade promotions. The establishment of
Fair Trade towns is another way of raising the awareness for Fair Trade in a country. With the
help of campaigns the level of trust for and recognition of Fair Trade should be raised. In 2011,
a corresponding online survey, conducted by FLO International and GlobeScan, asked around
17,000 consumers in 24 countries about their perception of Fair Trade. The study revealed
that the level of trust and recognition in the six considered European countries seems to be
very high. Even the relatively low level in France was above the average of the 24 countries.
Yet, comparing the shares of Fair Trade in the retail industry (e.g. 1.53% in the UK in 2011)
with the level of trust (e.g. 90% in the UK in 2011), the attitude consumers have towards Fair
Trade is not reflected in the actual buying behavior.
This paper tried to explain the remarkable growth of Fair Trade sales in European countries.
The entry of Fair Trade products in the conventional wholesale and retail trade during the last

36
decade seems to be one of the main reasons for this development. Market leaders like Rewe,
Edeka, Tesco and Coop Schweiz started to sell Fair Trade products under their private label.
Nevertheless, Fair Trade retail sales increased with different intensities in the six considered
countries. Enormous growth rates were realized in the United Kingdom and Switzerland,
whereas Fair Trade in France faced a moderate positive development. The analyzed data of
the food retail industry and of the Fair Trade labeling organizations gave no explicit
explanations for these differences. For example, it was found that the structure of the food
retail market seems to have little influence on the success of Fair Trade. In the United
Kingdom the highest sales volume is generated via hypermarkets. Furthermore, Tesco
achieved the highest turnover in 2012 compared to other retailers of the UK, but it has a
comparably lower amount of stores (see Chapter 2). Fair Trade retail sales in the UK were the
highest in 2012 in the six European countries compared in this paper. The food retail industry
in France shows a similar structure to the one in the UK, but Fair Trade retail sales in France
were even lower than in Germany in 2012 (see Chapter 4). Therefore, the structure of the
respective food retail industries seems to have no impact on the retail sales of Fair Trade.
Based on the findings of this paper, it is advisable to consider major retailers and their
engagement in Fair Trade in order to evaluate the past and future development of Fair Trade
within Europe.

37
List of References
Ahold, 2013. Annual Report 2012. [pdf] Available at: http://2012yearreview.ahold.com/downloads/pdf/Ahold-Full-AR-2012.pdf [Accessed 05 April 2014].
Association Max Havelaar France, 2012a. Comment concrétiser son engagement dans le système Fairtrade / Max Havelaar? [pdf] Available at: http://www.maxhavelaarfrance.org/images/pdf/documents/entreprises/comment%20concrtiser%20son%20engagement%20dans%20le%20systme%20mhf%202012%20-%202013.pdf [Accessed 2 April 2014].
Association Max Havelaar France, 2012b. Le commerce équitable en chiffres. [online] Available at: http://www.maxhavelaarfrance.org/le-commerce-equitable/le-commerce-equitable/en-chiffres.html [Accessed 20 April 2014].
Association Max Havelaar France, 2012c. Qui sommes nous? L’équipe. [online] Available at: http://www.maxhavelaarfrance.org/qui-sommes-nous/18-qui-sommes-nous/l-equipe.html [Accessed 2 April 2014].
Association Max Havelaar France, 2014. Rapport annuel 2012-2013. [pdf] Available at: http://www.maxhavelaarfrance.org/images/pdf/documents/presse/Rapport%20annuel%202012_2013.pdf [Accessed 2 April 2014].
Bundesamt für Statistik, 2014. Gesamtwirtschaftliche Ausgaben der Haushalte für den Endkonsum. [online] Available at: http://www.bfs.admin.ch/bfs/portal/de/index/themen/04/02/01/key/verbrauch_der_haushalte.html [Accessed 30 September 2014].
Bundesministerium für Ernährung und Landwirtschaft, 2014. Statistik und Berichte des Bundesminsteriums für Ernährung und Landwirtschaft [online] Available at: http://www.bmelv-statistik.de/index.php?id=139 BLE (422), BMELV (123) [Accessed 05 Mai 2014].
Carrefour, n.d. Our Stores. [online] Available at: http://www.carrefour.com/content/our-stores [Accessed 05 April 2014].
Coop, 2013. Coop-Gruppe Geschäftsbericht 2012. [online] Available at: http://www.coop.ch/pb/site/uebercoop/node/75524576/Lde/index.html [Accessed 05 April 2014].
Cremona, M. and Durán, G. M., 2013. The international fair trade movement: Actors and regulatory approaches. In: Granville, B. and Dine, J., eds., 2013. The Processes and Practices of Fair Trade: Trust, Ethics, and Governance. Oxon: Routledge. pp. 100 -119.
Deutsche Bundesbank, 2014. Monatsbericht Mai 2014. [pdf] Available at: http://www.bundesbank.de/Redaktion/DE/Downloads/Veroeffentlichungen/Monatsberichte/2014/2014_05_monatsbericht.pdf?__blob=publicationFile [Accessed 22 May 2014].
Deutscher Fachverlag, n.d. Lebensmittelzeitung.net – Daten& Fakten Rankings. [online] Available at: http://www.lebensmittelzeitung.net/business/daten-fakten/rankings/ [Accessed 06 April 2014].
Deutscher Kaffeeverband e.V., n.d.: Kaffeemarkt 2013. [pdf] Available at: http://www.kaffeeverband.de/images/dkv_pdf/geschuetzt/Jahresbericht/Kaffeemarkt2013.pdf [Accessed 01 August 2014].
Dolan, C.S., 2008. Virtual Moralities: The Mainstreaming of Fairtrade in Keynian tea fields. Geoforum, 41(1), pp. 33-43.

38
E. Leclerc, n.d. Histoire et Archives. [online] Available at: http://www.e-leclerc-histoireetarchives.com/chronologie [Accessed 05 April 2014].
European Commission, 2011. Taxation and Customs Union. [online] Available at: http://ec.europa.eu/taxation_customs/dds2/taric/measures.jsp?Taric=0803&Lang=en&GoodsText=&Domain=TARIC&MeasText=&Offset=0&Area=&ExpandAll=&callbackuri=CBU-6&LangDescr=de&SimDate=20140909 [Accessed 09 September 2014].
European Economic and Social Committee, 2013. Opinion of the Section for Agriculture, Rural Development and the Environment on the Current State of Commercial Relations Between Food Suppliers and the Large Retail Sector. [doc] Available at: http://eescopinions.eesc.europa.eu/viewdoc.aspx?doc=ces/nat/nat571/en/ces1887-2012_00_00_tra_as_en.doc [Accessed 06 April 2014].
European Union, n.d. The European Economic and Social Committee: Frequently Asked Questions. [online] Available at: http://www.eesc.europa.eu/?i=portal.en.faq [Accessed 06 May 2014].
Eurostat, 2014a. Konsumausgaben der privaten Haushalte nach Verwendungszwecken - COICOP-Dreisteller - zu jeweiligen Preisen. [online] Available at: http://appsso.eurostat.ec.europa.eu/nui/show.do?dataset=nama_co3_c&lang=de [Accessed 28 April 2014].
Eurostat, 2014b. HICP (2005 = 100) - annual data (average index and rate of change). [online] Available at: http://appsso.eurostat.ec.europa.eu/nui/show.do?dataset=prc_hicp_aind&lang=en [Accessed 04 April 2014].
Eurostat, 2014c. Population on 1 January by age and sex. [online] Available at: http://appsso.eurostat.ec.europa.eu/nui/show.do?dataset=demo_pjan&lang=en [Accessed 22 April 2014].
Fair Trade Advocacy Office, 2001. Fair Trade Definition and Principles. [pdf] Available at: http://www.fair-trade-hub.com/support-files/fair-trade-definition.pdf [Accessed 21 April 2014].
Fairtrade Österreich, 2010. Fairtrade Österreich Jahresbericht 2008/09. [pdf] Available at: http://www.fairtrade.at/fileadmin/user_upload/PDFs/Download/FAIRTRADE_Jahresberichte/FAIRTRADE_JB_2008.pdf [Accessed 10 July 2014].
Fairtrade Österreich 2013a. Wegweiser für interessierte Unternehmen. [pdf] Available at: http://www.fairtrade.at/fileadmin/user_upload/PDFs/Unternehmen/Wegweiser_fuer_interessierte_Unternehmen_01.pdf [Accessed 10 May 2014].
Fairtrade Österreich, 2013b. Steckbrief Gütesiegel-Initiative Fairtrade Österreich. [pdf] Available at: http://www.fairtrade.at/fileadmin/user_upload/PDFs/Download/Sonstige_Infomaterialien/FAIRTRADEOesterreich_Steckbrief.pdf [Accessed 2 April 2014].
Fairtrade Österreich, 2014. Fairtrade Österreich Jahresbericht 2012/13. [pdf] Available at: http://www.fairtrade.at/fileadmin/user_upload/PDFs/Download/FAIRTRADE_Jahresberichte/FT_JB1213_web.pdf [Accessed 2 April 2014].
Fairtrade Österreich, n.d. FAIRTRADE-Lizenzpartner in Österreich. [online] Available at: http://www.fairtrade.at/unternehmen/partner-firma-werden/partner-firmen/ [Accessed 01 April 2014].
FLO International, 2011a. Annual report 2009-2010: Growing stronger together. [pdf] Available at: http://www.fairtrade.net/fileadmin/user_upload/content/2009/resources/FLO_Annual-Report-2009_komplett_double_web.pdf [Accessed 21 April 2014].

39
FLO International, 2011b. Certifying Fairtrade. [online] Available at: http://www.fairtrade.net/certifying-fairtrade.html [Accessed 03 May 2014].
FLO International, 2011c. Fair Trade Glossary. [pdf]. Available at: http://www.fairtrade.net/fileadmin/user_upload/content/2009/about_fairtrade/2011-06-28_fair-trade-glossary_WFTO-FLO-FLOCERT.pdf [Accessed 17 May 2014].
FLO International, 2011d. History of Fairtrade.[online]. Available at: http://www.fairtrade.net/history-of-fairtrade.html [Accessed 09 September 2014].
FLO International, 2011e. Meet the producers. [online] Available at: http://www.fairtrade.net/meet-the-producers.html [Accessed 17 May 2014].
FLO International, 2011f. Using the FAIRTRADE Mark. [online] Available at: http://www.fairtrade.net/using-the-fairtrade-mark.html [Accessed 17 May 2014].
FLO International, 2011g. What we do. [online] Available at: http://www.fairtrade.net/what-we-do.html?&L=title [Accessed 16 May 2014].
FLO International, 2013. Annual report 2011-12: For Producers, With Producers. [pdf] Available at: http://www.fairtrade.net/fileadmin/user_upload/content/2009/resources/2011-12_AnnualReport_web_version_small_FairtradeInternational.pdf [Accessed 21 April 2014].
FLO International, 2014. Annual report 2012-13: Unlocking the Power. [pdf] Available at: http://www.fairtrade.net/fileadmin/user_upload/content/2009/resources/2012-13_AnnualReport_FairtradeIntl_web.pdf [Accessed 06 May 2014].
FLO International and GlobeScan Incorporated, 2011. Shopping Choices Can Make a Positive Difference to Farmers and Workers in Developing Countries: Global Poll. [pdf] Available at: http://3blmedia.com/sites/default/files/pdf/2011_Consumer_Media_Release_Fairtrade_Consumer_Survey-1%5B1%5D.pdf [Accessed 09 May 2014].
FLO-CERT, 2013a. Application for Fairtrade Certification – Standard Operating Procedure. [pdf]. Available at: http://www.flo-cert.net/flo-cert/fileadmin/user_upload/certification/processes/application/CERT_Application_SOP_13_en_webversion_01.pdf [Accessed 17 April 2014].
FLO-CERT, 2013b. Certification – Standard Operating Procedure [pdf] Available at: http://www.flo-cert.net/flo-cert/fileadmin/user_upload/quality/SOP_documents/CERT_Certification_SOP_26_en.pdf [Accessed 17 April 2014].
FLO-CERT, n.d.(a). ISO 65 Accreditation. [online] Available at: http://www.flo-cert.net/flo-cert/40.html [Accessed 03 May 2014].
FLO-CERT, n.d.(b). Operators [online] Available at: http://www.flo-cert.net/flo-cert/29.html [Accessed 17 April 2014].
Food and Agricultural Organization of the United Nations, 2014. Food Balance Sheets. [online] Available at: http://faostat3.fao.org/faostat-gateway/go/to/download/FB/FBS/E [Accessed 01 April 2014].
Intermarché, n.d. Intermarché hypermarchés et supermarchés. [online] Available at: http://www.intermarche.com/ [Accessed 05 May 2014].
J Sainsbury plc, 2012. Annual Reports and Financial Statements 2012. [pdf] Available at: http://www.j-sainsbury.co.uk/media/649393/j_sainsbury_ara_2012.pdf [Accessed 05 May 2014].
40
Max Havelaar Stiftung, 2009. Max Havelaar Stiftung (Schweiz) – Jahresbericht 2008. [pdf] Available at: http://www.maxhavelaar.ch/fileadmin/user_upload/publikationen/mh08_06_GB08_d_web.pdf [Accessed 10 July 2014].
Max Havelaar Stiftung, 2013. Wir sind Fairtrade – Die Max Havelaar Stiftung (Schweiz) mit Jahresbericht 2012. [pdf] Available at: http://www.maxhavelaar.ch/fileadmin/user_upload/publikationen/mh_JB2012_d_low.pdf [Accessed 20 April 2014].
Max Havelaar Stiftung, n.d.(a). Handelspartner. [online] Available at: http://www.maxhavelaar.ch/de/fairtrade/ueber-max-havelaar/handelspartner-und-kooperationen/ [Accessed 01 April 2014].
Max Havelaar Stiftung, n.d.(b). Handelspartner und Produktzertifizierung. [online]. Available at: http://www.maxhavelaar.ch/de/partner/handelspartner-und-lizenznehmer/ [Accessed 17 May 2014].
Max Havelaar Stiftung, n.d.(c). Fairtrade und die Geldflüsse - Lizenzgebühren. [pdf] Available at: http://www.maxhavelaar.ch/fileadmin/user_upload/verlinktedokumente/lizenzgebuehren.pdf [Accessed 10 May 2014].
Migros, 2013. MIGROS Geschäftsbericht 2012. [online] Available at: http://m12.migros.ch/ [Accessed 05 May 2014].
Nicholls, A. and Opal, C., 2005. Fair Trade: Market-driven ethical consumption. London: Sage Publications Ltd.
REWE Group, 2013. Summa Summarum- REWE Group Geschäftsbericht 2012 [online] Available at: http://www.rewe-group-geschaeftsbericht.de/2012/slider.html#0 [Accessed 05 June 2014].
REWE Group, n.d. Divisions. [online] Available at: http://www.rewe-group.com/en/divisions/ [Accessed 05 June 2014].
Smith, S., 2010. Fair Trade Bananas: A Global Assessment of Impact. [pdf] Brighton: Institute of Development Studies. Available at: http://www.fairtrade.net/fileadmin/user_upload/content/2009/resources/2010_Fairtrade_bananas_a_global_assessment_of_impact_.pdf [Accessed 09 September 2014].
Statista, 2014a. Fair Trade in Deutschland - Statista-Dossier 2014 [online]. Available at: http://de.statista.com/statistik/studie/id/9879/dokument/fair-trade-statista-dossier-2014 [Accessed 01 April 2014].
Statista, 2014b. Konsumausgaben der privaten Haushalte in Deutschland für Fleisch und Fleischwaren in den Jahren 1991 bis 2010 [online]. Available at: http://de.statista.com/statistik/daten/studie/296861/umfrage/konsumausgaben-in-deutschland-fuer-fleisch/ [Accessed 30 September 2014].
Statista, 2014c. Konsumausgaben der privaten Haushalte in Deutschland für Kaffee, Tee und Kakao in den Jahren 1991 bis 2010 [online] Available at: http://de.statista.com/statistik/daten/studie/296914/umfrage/konsumausgaben-in-deutschland-fuer-kaffee-tee-und-kakao/ [Accessed 30 September 2014].
Statista, 2014d. Pro-Kopf-Verbrauch von verschiedenen Fruchtsäften und Fruchtnektaren in Deutschland in den Jahren 2008 bis 2012 [online]. Available at: http://de.statista.com/statistik/daten/studie/167152/umfrage/pro-kopf-verbrauch-von-fruchtsaeften-und-fruchtnektaren-seit-2008/ [Accessed 01 August 2014].

41
Stichting Max Havelaar, 2009. Jaarverslage 2008. [pdf] Available at: http://s3-eu-west-1.amazonaws.com/maxhavelaar.nl/keplarcms/items/imagevalues/000/000/774/original/SMH_Jaarverslag_2008.pdf?1383919251 [Accessed 10 July 2014].
Stichting Max Havelaar, 2013a. Commerciële partners. [online] Available at: http://business.maxhavelaar.nl/commercieel_partner [Accessed 01 April 2014].
Stichting Max Havelaar, 2013b. Jaarverslage 2012. [pdf] Available at: http://s3-eu-west-1.amazonaws.com/maxhavelaar.nl/keplarcms/items/imagevalues/000/000/659/original/MH_jaarverslag2012_digitaal_A4_lowres.pdf?1383918845 [Accessed 2 April 2014].
Stichting Max Havelaar, 2013c. Appendix 4: Licence fee 2013 [pdf] Available at: http://business.maxhavelaar.nl/downloads/appendix4.pdf [Accessed 10 May 2014].
Swiss Fair Trade, 2014. Fair Trade Town - Eine ausgezeichnete Idee. [online] Available at: http://www.fairtradetown.ch/de [Accessed 05 June 2014].
Tesco plc, 2012. Annual Review and Summary Financial Statement 2012. [pdf] Available at: http://www.tescoplc.com/files/reports/ar2012/files/pdf/tesco_annual_review_2012.pdf [Accessed 05 May 2014].
The Fairtrade Foundation, 2011. Facts, Figures & Resources. [online] Available at: http://www.fairtrade.org.uk/press_office/facts_figures.aspx [Accessed 22 April 2014].
The Fairtrade Foundation, 2013a. Annual Review 2012/2013. [pdf] Available at: http://www.fairtrade.org.uk/includes/documents/cm_docs/2013/C/CS0193_Annual_Review_LR2.pdf [Accessed 2 April 2014].
The Fairtrade Foundation, 2013b. Annual Report and Financial Statements. [pdf] Available at: http://www.fairtrade.org.uk/~/media/fairtradeuk/what%20is%20fairtrade/documents/policy%20and%20research%20documents/general%20briefing%20papers/annual%20reports/2013%20annual%20report%20and%20financial%20statements%202013.ashx [Accessed 09 September 2014].
The Fairtrade Foundation, 2014. Stick with Foncho - General. [online] Available at: http://foncho.fairtrade.org.uk/about/faqs/general/ [Accessed 20 April 2014].
The Fairtrade Foundation, n.d.(a). For Business - Licensing. [online] Available at: http://www.fairtrade.org.uk/for_business/fairtrade_requirements/licensing.aspx [Accessed 10 May 2014].
The Fairtrade Foundation, n.d.(b). Get involved - Campaigns. [online] Available at: http://www.fairtrade.org.uk/get_involved/campaigns/default.aspx [Accessed 20 April 2014].
The Fairtrade Foundation et. al., n.d.(a). What is a Fairtrade Town? [online] Available at: http://www.fairtradetowns.org/about/what-is-a-fairtrade-town/ [Accessed 04 April 2014].
The Fairtrade Foundation et. al., n.d.(b). The Five Goals. [online] Available at: http://www.fairtradetowns.org/about/the-five-goals/ [Accessed 04 April 2014].
The Fairtrade Foundation et. al., n.d.(c). About [online] Available at: http://www.fairtradetowns.org/about/ Available through: https://spreadsheets.google.com/pub?key=tpVc-rN3plsE_QoaOUpqRjw&single=true&gid=0&output=html [Accessed 05 April 2014].
The Nielsen Company (Germany) GmbH, 2013. Deutschland 2013: Handel, Verbraucher, Werbung. [pdf] Available at: http://nielsen.com/content/corporate/de/de/insights/reports-downloads/_jcr_content/par/download_0/file.res/Nielsen_Universen_D_Internet.pdf [Accessed 05 June 2014].

42
Trade Dimensions, 2012. Top-Firmen 2013 – Der Lebensmittelhandel in Deutschland Food/Nonfood. Frankfurt am Main: The Nielsen Company (Germany).
Traidcraft, 2014a. How Traidcraft works. [online]. Available at: http://www.traidcraft.co.uk/about_traidcraft/how_traidcraft_works [Accessed 23 June 2014].
Traidcraft, 2014b. Traidcraft’s structure. [online] Available at: http://www.traidcraft.co.uk/about_traidcraft/how_traidcraft_works/structure [Accessed 23 June 2014].
TransFair, 2010. Jahresbericht 2008 - Ausblick 2009. [pdf] Available at: http://www.fairtrade-deutschland.de/fileadmin/user_upload/materialien/download/download_jahresbericht0809.pdf [Accessed 10 July 2014].
TransFair, 2014. TransFair Jahresbericht 2012/13. [pdf] Available at: http://www.fairtrade-deutschland.de/fileadmin/user_upload/presse/presse_2013/Pressemappe_Jahresbericht/2013_Jahresbericht_2012_2013.pdf [Accessed 2 April 2014].
TransFair, n.d.(a). Fairtrade-Partner-Firmen. [online] Available at: http://www.fairtrade-deutschland.de/fuer-unternehmen/partner-firmen/ [Accessed 14 April 2014].
TransFair, n.d.(b). Fair einkaufen! [online] Available at: http://www.fairtrade-deutschland.de/produkte/fair-einkaufen/ [Accessed 17 May 2014].
TransFair, n.d. (c). Lizenzgebühren. [online] Available at: http://www.fairtrade-deutschland.de/fuer-unternehmen/fairtrade-partner-firma-werden/wie-viel-kostet-eine-lizenz/ [Accessed 10 April 2014].
TransFair, n.d.(d). Gelungene Kampagnen. [online] Available at: http://www.fairtrade-deutschland.de/mitmachen/kampagnen-von-transfair/gelungene-kampagnen/ [Accessed 05 April 2014].
Voth, J., 2013. Corporate social responsibility in practice - REWE and Fairtrade. Forum NIL [e-publications] 1(2013). Available through: http://epb.bibl.fh-koeln.de/frontdoor/index/index/docId/375 [Accessed 21 July 2014].
WFTO, 2013a. Find Members. [online] Available at: http://www.wfto.com/index.php?option=com_content&task=view&id=6&Itemid=37 [Accessed 20 June 2014].
WFTO, 2013b. The World Fair Trade Organization. [online] Available at: http://www.wfto.com/index.php?option=com_content&task=view&id=890&Itemid=292 [Accessed 21 June 2014].
WFTO, 2013c. WFTO Annual Report 2012 [online] Available at: http://www.wfto.com/index.php?option=com_content&task=view&id=26&Itemid=109 [Accessed 20 June 2014].
WFTO, 2013d. WFTO Guarantee System Handbook. [online] Available at: http://www.wfto.com/index.php?option=com_content&task=view&id=1944&Itemid=391 [Accessed 16 June 2014].
WFTO, 2014. PRESS RELEASE: World Fair Trade Day, 10 May 2014. [online] Available at: http://www.wfto.com/index.php?option=com_content&task=view&id=2031&Itemid=332 [Accessed 20 April 2014].
World Trade Organization, 2014. World Tariff Database. [online]. Available at: http://tariffdata.wto.org/ [Accessed 09 September 2014].

43
Wm Morrison Supermarkets plc, 2013. Annual report and financial statements 2012/13. [pdf] Available at: http://www.morrisons-corporate.com/2013/annualreport/downloads/Morrisons_Performance_and_strategy_review_2013.pdf [Accessed 05 May 2014].