Embed Size (px)
Citation preview

University of ConnecticutOpenCommons@UConn
SoDM Masters Theses School of Dental Medicine
6-1-2007
A Comparison of Debonding Strengths of FourMetal-Ceramic Systems With and WithoutOpaque PorcelainMargorie C. Wood
Follow this and additional works at: https://opencommons.uconn.edu/sodm_masters
Recommended CitationWood, Margorie C., "A Comparison of Debonding Strengths of Four Metal-Ceramic Systems With and Without Opaque Porcelain"(2007). SoDM Masters Theses. 157.https://opencommons.uconn.edu/sodm_masters/157

A comparison of debonding strengths of four metal-ceramic systems with and without opaque porcelain.
Marjorie C. Wood
D.M.D., University of Pennsylvania, 2002 B.A., University of Vermont, 1993
A Thesis Submitted in Partial Fulfillment of the
Requirements for the Degree of Master of Dental Science
at the University of Connecticut
2007

APPROVAL PAGE
Master of Dental Science Thesis
A Comparison of Debonding Strengths of Four Metal-Ceramic Systems with and without Opaque Porcelain.
Major Advisor
Presented by
Marjorie C. Wood, D.M.D.
John R. Agar, D.D.S., M.A
~r-r~ C/' /l IlL ~ [->"" rJ Associate Advisor L
------------~/~C~o~I-.G=-eo-ff=r-e-y=T~ho-m--ps-o-n-,~D-.M~.o~.-,M~.S~.------
A~ociateAd~wr _______ -_·~ ___ -_-_~_~_·~_._· __ -_~ ___ -_~~~_:~~=. ___ ._-______________ ~ Thomas Taylor, ~.~.S., M.S.o
University of Connecticut
2007
ii

Acknowledgements
First and foremost I would like to thank my best friend and husband Peter Barndt for his patience with me, and his never-ending help with all things scientific and technical. I
know it's not even close to a repayment, but this Masters Thesis is dedicated to you. I want to be as smart as you are someday.
There are so many people that contributed to the completion of this Masters Thesis. Without a single one of them, it would not be complete. I am forever indebted and grateful to al/ of you.
Dr. Agar, Thank you for your generosity, time, patience, and diligence. I ~ would have done this without your persistence and kindness.
Col Thompson, Thank you for your expertise, the use of your magnificent laboratory! equipment and home, time, and consistent efforts. You make Masters happen.
Dr. Taylor, Thank you for being available and supportive to help fledgling residents like me.
Dr. Rungruanganunt, Thank you for your unwavering friendship and expertise. You have helped me through many difficult times, and not just with this Masters.
My family, Thank you all for your confidence and patience with me when I was frustrated and grumpy during this process. I realize how lucky I am to have your unfailing support and love.
The Laboratory at UConn: Frank, Donna, Denise, Gail, Erik. Thank you for your time and help throughout the three years of residency. I truly know your patience is endless, like Dr. Agar says.
Thank you for all the time and efforts to make this an actual paper: Eileen Chmura and Cindy Phoenix. The many trips aI/ over the Health Center Campus solely for my benefit did not go unnoticed. (Nor did all the faxing of paperwork and letters to Japan.)
Thank you to Dentsply, specifically Tom Cameron and AI MacDonald who provided the alloy specimens and answered many questions at the beginning of this project.
Thank you to the statisticians Dr. Steve Walsh and Mrs. Deb Dauser. I know my ignorance with statistics was trying at times, but you kept helping me despite it.
Thank you to aI/ the UConn residents present during the years 2003 to 2005: Sangeetha Raghavendra, Elena Nazarova, Peter Barndt, Jin Ha Joung, Sergio Ortegon, Fei Uu, Cornell Lee, Nancy Dubois, Sureeporn Charudilaka, and Carlos Velez. Sorry for all the extra time in the conference room reviewing and helping me with the presentations, variations, and ideas of this Masters ... and I didn't even bring food or beer to the defense!
iii

Table of Contents
I. Introduction ................................................................................. 1
II. Objectives ................................................................. , ................. 5
Specific aims ................................. '" ............................ '" ... 5
Hypothesis ............................. , ........................ '" ................ 5
III. Literature Review ........................................ _ ................................. 7
Basic principles ................................ " ................................. 7
Residual stress gradients ...................... _ ................................ 8
Interfacial chemistry ........................................... '" .......... '" .10
I nterfacial morphology ......................................................... 13
IV. Materials and Methods ................................................................. 15
Castings ........................................................................... 15
Surface preparation ........................................... " ............... 15
Surface analysis ................................................................. 17
Opaque porcelain addition ...... " .................................... , ....... 17
Dentin (Body) porcelain addition ............................................ 19
Bond strength determination ................................................. 20
Debonding analysis ............................................................. 22
Data analysis ............................................................ , ........ 22
V. Results ..................................................................................... 24
VI. Discussion ...................................................................... , ... , ...... 26
VII. Conclusions ......... '" ....... , .......... '" '" .......... , ................................ 32
VIII. Future research .......................................................................... 33
IX. Bibliography ............................................................................... 34
X. List of Figures .............................................................................. 39
XI. List of Tables .............................................................................. 40
XII. List of Graphs ................. , ................. , ............... '" ......... '" ........... 41
XIII. Figures .................................................................................. , .. 42
XIV. Tables ...................................................................................... 61
XV. Graphs .......................................................... ,. '" ........ , ............. 69
iv

1
I. INTRODUCTION
Despite substantial advances in ceramic core technology, Dentistry continues to
see metal copings with porcelain veneers used in crown restorations. The strength of all
ceramic systems varies considerably and all fall short of metal-ceramic restorations. 1,2
Metal-ceramic restorations are the standard by which all alternative, esthetic restorations
are measured, and continue to be the best choice for anterior fixed partial dentures with
limited inter-arch distance.3 They are often required for short, tipped and structurally
compromised teeth needing auxiliary retention such as grooves, boxes, or pins.2•4
In 1956 Brecker and Johnston et al were among the first to describe the dental
metal-ceramic restoration with similar technology to that presently in use. Following in
1962, Weinstein patented the metal-ceramic or "porcelain-fused-to-metal" (PFM)
restoration. 5-7 That same year Shell and Nielsen published a paper which described the
chemical nature of the porcelain-to-metal bond. 8 Metal-ceramic bonding theories, in
dentistry, found its background in industrial research of the enamel-steel bond, dating
back to 1936 in a paper by Kautz entitled "Further data on enamel adherence". 9
However, even today, the exact bonding mechanisms of metal-ceramics are still not
finitely established. Numerous authors credit bonding theories to include chemical,
mechanical and van der Waals forces. 7. 8. 10-15 Also, a slight mismatch in coefficients of
thermal expansion between the porcelain and the aUoy is credited with placing the
porcelain in compression and thereby raiSing the porcelain resistance to fracture. 16-19
Unfired dental porcelain appears to the naked eye as a powder. However, with
microscopic aid the powder appears as a "heap of broken glass".20 The fundamental
components of dental porcelains are quartz, feldspar, kaolin, and metal oxides.13, 20. 21
Regardless of manufacturers' specific formulations, to fabricate dental porcelain these
four basic constituent materials are heated together to a high temperature to form a
glassy phase, rapidly quenched in cold water, and pulverized into a "frW. This frit is

2
milled into what can be used as the many different forms of dental porcelains including
opaque, dentin (body), and enamel. The variations in milling (particle size), original raw
components, added components, and firing temperatures permit proprietary differences
between the many commercially available porcelain systems.
Porcelain used in metal-ceramic restorations has included opaque porcelain,
which contains a larger portion of insoluble metal oxides than "body" porcelain.3, 20
Opaque porcelain is the first ceramic layer added to the alloy substructure. As the name
may imply, metal oxides present in opaque porcelain intercept and scatter light
transmission and mask the metal substructure color.7,20-22 It is assumed that these metal
oxides within opaque porcelains are both partly responsible and necessary for the metal-. ceramic bond. 5, 12,22-24 There is considerable discussion in the literature about the oxides
of the metal alloy being responsible for the metal ceramic bond, however less attention
has focused on the necessity of the corresponding oxides in opaque porcelain. That is,
whether or not opaque porcelain is specifically required for the metal-ceramic bond has
not been adequately proven. In fact, one study indicates that body porcelains may bond
to alloys as well as opaque porcelains bond to alloys.22
Excessive, abrasive wear of the mandibular anterior dentition opposing maxillary
teeth restored with metal-ceramic restorations is a problem in the clinical practice of
fixed prosthodontics.25-31 (Figure one). Abrasion of mandibular canines can result in the
loss of mutually protected occlusion. Small, worn mandibular incisors are difficult to
restore. Wear of these teeth can be accompanied by super-eruption, or alveolar growth
and eruption, both of which can further complicate the restoration of these short and
narrow teeth. 27, 30, 321n addition, most anterior occlusal configurations do not allow for the
design of a maxillary, Iinguo-occlusal surface in meta/.4
Where restorative space is limited, it is difficult to arrange metal, opaque, and
body porcelain to mechanically sound dimensions. In these situations, during delivery of

3
restorations and clinical adjustment, opaque porcelain repeatedly becomes exposed with
removal of the thin body porcelain on the lingual surfaces of maxillary anterior teeth.
Most situations would require a polish of the adjusted area prior to final insertion of the
restorations. Although there is compelling literature33-35 which states chair-side porcelain
polishing produces a similar, if not better, surface finish of porcelain than glazing, it has
yet to be determined if opaque porcelain can be polished to a satisfactory, non
destructive level. Nevertheless it seems unlikely that polishing could be effectively done
at all because of the composition of opaque porcelain.
In spite of the inconsistency and difficulty in constructing universally accepted
wear tests 34, 36 there is significant research describing increased wear of teeth opposing
porcelain-occlusal restorations.25,27,37-39 Several authors have stated that exposed
opaque porcelain may significantly increase the abrasiveness of a metal-ceramic
restoration. 22,32 Opaque porcelains are not fired to the same vitrification temperatures as
body porcelains, and after the opaque firing process, a large percentage of incompletely
molten material is present within the opaque porcelain.2o In addition, the added oxides,
which are crystallized, have a hard surface when exposed.2o.22.25 Kelly et ai, in a review
of ceramics in dentistry, report that the size and shape of abrasive features developed
on a dental ceramic surface during contact appear critical for determining enamel
wear.34 This potentially increased abrasiveness of exposed opaque porcelain may be
witnessed by clinicians. However, there does not appear to be any supporting evidence,
in vitro or in vivo studies, to scientifically support greater wear caused by opaque as
compared to body porcelains.
The primary aim of this study was to determine whether there is a significant
difference in bond strength between opaque and body porcelains bonded to metal
alloys. The question of whether opaque porcelain is truly necessary for an acceptable
metal-ceramic bond was asked. The goal was to determine if body porcelain alone can

4
be used on the maxillary lingual surfaces of metal-ceramic restorations. The clinical
significance is that body porcelain used exclusively on the lingual surfaces of maxillary
copings may reduce the excessive, destructive abrasion observed when natural teeth
oppose exposed opaque porcelain.

5
II. OBJECTIVES
The clinical observation of excessively worn teeth opposing over-adjusted,
unpolished metal-ceramic restorations is a recurring problem in Prosthodontics. The
primary objective of this study was to determine if bond strengths are similar between
two different metal alloys and two different ceramic systems with and without the use of
opaque porcelain.
1. SpecifiC Aims
A. To analyze bonding strength results and to determine if opaque porcelain is
necessary for clinically adequate bond strength of porcelain to metal within the four
systems used and according to requirements established by ISO 9396: 1999 (E)
Metal-Ceramic Dental Restorative Systems.
B. To promote further testing, of specific metals and porcelains employed together, to
determine if opaque porcelain can be removed and if the system retains adequate
metal-ceramic bond strength.
C. To reconcile acoustic measurements in conjunction with load-versus-displacement
plots.
O. To analyze surface roughness (Ra) and correlate with porcelain to metal bond
strength.

6
2. Hypothesis
The Null Hypothesis tested was:
There is no significant difference in the debonding strength/crack initiation strength of
metal-ceramic flexure bars made with and without opaque porcelain.

7
III. LITERATURE REVIEW
1. Basic Principles
The success of a metal-ceramic restoration depends on the strength of the
metal-ceramic bond. The most common mechanical failure of these restorations is
porcelain debonding from the metal. 13 Several important concepts relate to the metal
ceramic bond. It should be realized that these two materials individually have completely
different properties, however are expected to act as a composite when used in dentistry.
The two basic forms of chemical bonding are covalent and ionic. Covalent
bonding happens when the valence electrons of two atoms are shared. Ionic bonding
happens when valence electrons are removed and are attached to another atom
creating positive and negative ions that can attract each other.
Ceramics are compounds of metallic and non-metallic elements. 15 Chemically,
metal atoms usually combine their valence electrons with other metal and/or non-metal
atoms in what is termed a metallic bond, a form of ionic bonding. Metallic bonding has
been referred to as a sea of electrons surrounding positive ions.4O "Ceramics, however
do not contain a large number of free electrons. Their electrons are either shared
covalently with adjacent atoms, or they are transferred from one atom to another to
produce an ionic bond. Ionic bonds produce ceramic materials of relative stability. "15 It is
this stability (and lack of free electrons) which allows ceramics to be labeled "good
insulators" (poor conductors.) Other ceramic properties are brittleness, low fracture
toughness, poor plastic deformation, and increased resistance to chemical alteration-all
characteristics resulting from a lack of free electrons. Metals on the other hand, transfer
thermal energy through their "electron sea" of shared electrons, which are free to travel
everywhere in a metallic bond.40 The properties of metals, converse to ceramics, are
good electrical conductivity, malleability, ductility, and a reaction to chemical
modification. In addition, metals can be combined to form compounds called alloys, and

8
in doing so, the final properties of the new alloy are changed as compared to the initial,
individual constituents. Metallurgists design alloys to enhance certain metal properties
and diminish others, aiming to produce a final compound that exhibits desired functional
qualities. The metal-ceramic restoration, a combination of both ceramic and metal
materials, "combines the esthetic beauty of porcelain and the strength and accurate fit of
the cast (alloy) metal substrate.,,41
So then, how are these two unlike materials bonded together to act as a
composite for use in dentistry? According to Wagner, there are three main factors that
determine the success of the ceramic-metal bond: residual stress gradients, interfacial
chemistry, and interfacial morphology.42 These three factors are interdependent and are
difficult to evaluate individually.8.12.15,24,42,43
2. Residual Stress Gradients
Ceramic powders are bonded to metal alloys by placing them together in a
furnace and firing to high temperatures to sinter the porcelain to the alloy. The fired
porcelain is influenced not only by the maximum temperature attained but also the pre
drying time, rate of climb, holding time at the final temperature, and cooling method.
20,44,45
All materials have a coefficient of thermal expansion. The coefficient of thermal
expansion (CTE) is generally defined as the fractional increase in length per unit rise in
temperature. The exact definition varies, depending on whether it is speCified at a
precise temperature (true coefficient of thermal expansion) or over a temperature range
(mean coefficient of thermal expansion). Graphically, the former is defined by the slope
of a tangent line to the length-temperature plot, while the latter is governed by the slope
of the chord between two points on this curve. Considerable variation in the value of a
material's CTE may occur according to the definition employed. Usually there is an

9
increase in CTE with temperature.46 It is important to note the terms "thermal expansion"
and "thermal contraction" are acceptably interchanged in the dental literature. 16
Knowledge of CTEs of alloys and porcelains used for PFM restorations is
imperative. The CTE of the porcelain/alloy pair should be below the glass transition
temperature of the porcelain so that the ceramic does not undergo viscous flow to
relieve thermal incompatibility stresses that develop during firing21. The gap in
temperature from when porcelain is viscous enough to behave as a rigid body, until
room temperature, is when the interfacial stress will develop in a metal-ceramic
restoration. 47
Invariably, interfacial stresses will exist after porcelain is fired onto a metal
alloy. 16-19,41,44,45,48 These residual, interfacial stresses caused by two independent CTEs
can cause crazing or cracking or complete debonding of the porcelain veneer if not
controlled. iS. 1S Residual stress gradients have been the focus of much of the basic
research in metal-ceramics.42 Stress at the interface between the alloy and the porcelain
can be described by Timoshenko's bimaterial stress equation. i6
a=K~a~T
K, a constant based on geometric factors
~ a, the difference in thermal expansion coefficients
ll. T, the temperature range through which the metal-ceramic system is cooled.
This equation can be used only as an approximation, as a and the glass
transition temperature (Tg) vary with the thermal history of the ceramic. 16 This formula
may be used to initially determine interfacial stress levels.
Relatively high transient and residual stresses may develop in metat-ceramic
systems due to differences in thermal contraction coefficients. Transient tensile stresses
may cause cracks to form during cooling, but if no cracks develop (which form to

10
alleviate stress), the residual stress becomes the principal variable that can enhance or
reduce the bond strength of a metal-ceramic system.
It is generally believed the alloy should have a higher CTE than the ceramic
(termed positive coefficient mismatch) to produce axial and hoop compressive stress in
the porcelain after cooling to room temperature. The radial tensile stresses that develop
are assumed to be negligible. Since dental ceramics are much stronger under
compression than tension, this residual compressive stress can effectively increase the
bond strength. 16,17
Thermal expansion data from room temperature to above the glass-transition
temperature range are important for thermal expansion of the porcelain to be matched to
the atloy, so that stress levels in the porcelain veneer will be minimized.44 ,47 Tuccillo and
Nielsen asserted that maximum bond strength can only be achieved if "weakening
factors such as thermal stresses [are] absent".47 Since complete eradication of all
thermal stresses is impossible, knowledge of Tg and a for a dental porcelain is of
primary importance for determination of the level of stress introduced at the metal
porcelain interface when a restoration is being cooled.44 In dental laboratory practice,
porcelains used for metal-ceramic restorations are fired several hundred degrees above
the glass transition temperature, removed from the furnace and allowed to air-cool at
rates approaching 600°C/min through the glass-transition temperature range.44 The
choice of alloy and ceramic pair should be made with attempts to control both a positive
coefficient mismatch and the cooling rates of both the porcelain and alloy.
3. Interfacial Chemistry
It is generally believed that there are four types of inter-atomic bonds involved in
the junction of ceramic to metal (dental porcelain to metal alloy substructure.) Ionic,
covalent, metallic, and van der Waals forces form the bonds between oxides in both the

11
porcelain and alloy.7,12,15,49,50 However the question remains as to how the oxide layer
functions in the porcelain-metal bond.49
Theories to explain the bonding of dental porcelain to metal alloys have been
built largely upon the work carried out in industry, specifically the field of porcelain
enameling of steel. The first metal-ceramic bonding theory in literature, the "oxide layer
theory", was credited to Kautz in 1936. Yet, according to Mackert "nearly all of the
discussion of the mechanism of bonding of dental porcelain to metal in the dental
literature is based upon the theories of King et al (1959) and Pask and Fulrath (1962).,,49
Kautz's general, non-dental theory clarified that a layer of oxide, adherent to the
metal, is wetted by the porcelain and becomes the transition zone between the metal
and glass, and that the layer of metal oxide is considered to be tightly bonded both to the
metal and to the porcelain. Thus an intermediate layer is formed which is responsible for
the porcelain-metal bond. It was proposed that the layer of ceramic nearest the metal
dissolves the oxide on the surface of the metal and that a layer of oxide-saturated glass
(ceramic) bonds directly wI the metal surface.49
In 1959, King et al proposed a slight change to Kautz's oxide bonding theory.
They renamed it as the "interface saturation theory" and proposed the bond was formed
directly between the substrate metal and "a layer of glassy phase comprising a saturated
solution of the lowest oxide of the substrate metaL" In this theory, the adherence of the
original oxide layer to the alloy substrate is deemed irrelevant, because this oxide layer
is believed to be completely dissolved during the fusing of the enamel. 51
Three years later, Pask and Fulrath theorized there is a direct chemical bonding
between the porcelain and metal. However, they allowed the previously suggested
possibility of a discrete oxide layer at the interface and stated that, if it is present, it must
be adherent to the metaf. They offered a variation of the "interface saturation theory"
which was that a mono-molecular layer of oxide stays present between the oxide-

12
saturated glassy phase and the metal. 52 Thus, introductory theories have changed from
the oxide layer on the alloy completely dissolving into the porcelain (bonding between
"oxide-saturated glass" and metal) to the oxide layer on the metal lending ions to the
ceramic while maintaining itself as a discrete layer which is strongly adherent to the
alloy.
Several authors have furthered this initial, industrial research with various
experimental findings specific to dental materials. In 1962 Shell and Nielsen's landmark
paper excited the dental world. The authors designed an experiment to test the strength
of the porcelain-alloy bond and then used collected numerical data to describe the
nature of the bond. 1t was their conclusion that the most important factor determining the
strength of the bond is the inter-atomic bonding, specifically "a mixture of ionic, covalent,
and metallic". Additionally, the importance of reducing the amount of residual stress
gradients created by the differing thermal contraction coefficients to allow "freedom from
shear stresses" was addressed. 8
Furthering the oxide layer research and analysis, Szantho von Radnoth and
Lautenschlager43 proposed that a particular oxide, solely responsible for bonding, was
formed during the firing of the porcelain with the alloy. This suggested that the oxide
layer, which is formed during the degassing process of the alloy, might not be the oxide
layer that is entirely responsible for the bond.
Vickery and Badinelli,50 determined to identify the individual component forces
contributing to a porcelain-gold bond, found that the effect of compressive bonding
forces--exerted by the differences in thermal expansion of the two phases--was much
more Significant than the van der Waal's bonding forces.
Mackert et al determined in 1984 that "the fusing porcelain comes in contact with
the oxide rather than the metal surface". 50 This experimental group further determined
that if the oxide is not adherent to the metal substrate, the resultant porcelain-metal bond

13
will be weak. They postulated two requirements for the porcelain to metal bond: first an
oxide layer must be present at the interface and second, the oxide layer must be
adherent to the metal. 49
Oxide layers can be analyzed and designed with knowledge of the Pilling
Bedworth ratio (R) that correlates the porosity of a metal oxide with the specific density
of the alloy. It is defined as the ratio of the volume of the metal oxide to the consumed
metal volume.
V metal oxide produced R=
------------------------------V metal consumed
Pilling and Bedworth discovered that when R was less than 1 the oxide layer tended to
be porous and did not cover the entire metal surface. 53
The quality and quantity of the oxide layer on the dental alloy surface can
influence the bonding strength between the metal and the porcelain. Today, it is
commonly known that an oxide layer which is too thick results in a poor metal-ceramic
bond.8,9,43,49,54-56 The thickness of an oxide layer is dependent on the degree of oxidation
( both amount and diffusion rate) of metal elements within the alloys.40
The precise conformation of the chemical bond of porcelain to metal has yet to
be determined, other than targeting oxides shared between the porcelain and metal as
culprits responsible for the bond. It is known that differing oxide properties and layers
influence the bond. However the modeling of each element, present in both porcelain
and alloy, and its specific contribution to the interface has not been determined.
4. Interfacial Morphology
Interestingly, Shell and Nielsen8 concluded that a mechanical bond did not "play
an important role in the bond strength proper", stating that "roughening per se did not
add to the shear resistance at the bond." There have been several, conflicting theories

14
regarding the effects of interfacial morphology and its contribution to the bond strength of
ceramic and metaI.3,14,42,56-58 Roughness, on the surface of the metal, has been
speculated to weaken the porcelain-metal interface by causing stress concentrators
which initiate (brittle) ceramic fracture. 12,57 In addition, irregularity might cause
incomplete contact between the metal and the ceramic, and trap gasses, reducing bond
strength. 8 ,13,56 Alternatively, it is postulated surface morphology can amplify bond
strength with added mechanical attachment or increased area for chemical
bonding.23,42,58,59
Wagner in a definitive, thorough experiment in 1993 tested a range of interfacial
treatments in two aspects: modification of both chemistry and morphology of the
interface. He concluded succinctly that none of the "maladies reported in the literature,
either stress raisers caused by rough interface or trapped gases in the valleys, caused
lowered bond strengths", adding that, "it appears that roughness is entirely beneficial to
porcelain"metal bonding. ,,42

15
IV. MATERIAL AND METHODS
ISO 9693: 1999(E) Metal Ceramic Dental Restorative Systems 60 specifies
requirements and testing methods for dental metallic materials and ceramic materials
used in combination as a composite structure. The material requirements and testing
methods were followed for this investigation. (Figure 2)
1. Castings
TWo metal alloys were used: a base-metal alloy, Duceranium U (DU) (Oentsply
International, York. PA) and a high noble alloy Encore (E) (Dentsply International, York.
PA). The composition of each alloy is found in weight percent in Table 1. Wax patterns
made from 22-guage casting wax (Green Casting wax; Corning Rubber Co., Brooklyn.
NY) were cut into nominally flat strips 25mm x 3mm x 0.5mm (I x w x h.) The patterns
were sprued and invested in a carbon-free phosphate-bonded investment (Fujivest II;
GC America, Alsip, IL). Seventy-five castings of each alloy were made using a natural
gas and oxygen blowpipe (Harris 50-10; Harris Calorific Inc., Gainesville, GA). with a
centrifugal casting machine (Centrifico Casting Machine; KerrLab Corp., Orange, CA).
Castings were allowed to cool at room temperature, were divested and cleaned by
airborne particle abrasion using 50-lJm aluminum oxide (Williams Blasting Compound,
Ivoclar Vivadent Inc., Amherst, NY) with 4-bar air pressure. The sprue and sprue-buttons
were cut off the alloy strips for proper finishing and refining to desired, final dimensions.
All specimens were subjected to ultrasonic cleaning with distilled water for 10 minutes.
2. Surface preparation
Manufacturer recommendations were followed for finishing and surface
preparation procedures. Alloy specimens were adjusted to ISO 9693 standard
dimensions (25mm length X 3mm width X O.5mm height) with aluminum oxide barrel

16
burs (Shofu Corporation, San Marcos, CA) and a laboratory handpiece (Synchro
Torque; Handler Mfg., Westfield, NJ). Separate burs were used with each alloy, while
wearing nitrile gloves and changing gloves for each alloy group. Dimensions were
verified using a Boley gauge (Hu-Friedy, Chicago, IL). Specimens were engraved with a
number using a quarter-round cutting instrument (SS White Surrs Inc., Lakewood, NJ) in
a high-speed laboratory handpiece (K-AIRplus; KaVo Dental Corp., Lake Zurich, IL), on
the side opposite to where porcelain would be applied, for future identification purposes.
On the side receiving porcelain, bars were lightly marked with two lines perpendicular to
the long axis of the bar and B.Smm from each end using a sharp blade (No. 11; SO
Surgical Products, Franklin Lakes, NJ). These lines delineated the extent of the
porcelain application that would be made. (Figure 3)
Three ceramic furnaces were used (Ceramco Phoenix Quick Cool; Oentsply
International York, PAl and were calibrated according to manufacturer's
recommendations. (Figure 4) All specimens were suspended on a firing platform to
simulate the standard level of a crown framework within the oven muffle during the
oxidization procedure. (Figure 5) The oxidation cycle for the Ouceranium U alloy
required heating specimens with a rate of 55°C/min from 650°C to 101 O°C under
vacuum and holding the temperature for 5 minutes. The oxidation cycle for the Encore
alloy required heating specimens with a rate of 55°C/min from 650°C to 1038°C with no
vacuum for 5 minutes. (Table II)
The Duceranium U specimens were steam-cleaned (Triton SLA Wet and Dry
Steam Cleaner; Bego, Bremen, Germany) with distilled water, oxidized, and then air
abraded (50J,J aluminum oxide with 4 bar air pressure). Thus, the oxide layer was
partially removed by passing the nozzle over the surface twice at a distance of 5cm for
less than one second until the specimens had a uniform appearance.

17
Encore specimens were steam-cleaned with distilled water, air abraded
(following air abrasion procedure described previously) on the side for porcelain
application only (to avoid re-etching specimen numbers and potential contamination) and
then oxidized. Fifty-six specimens with sufficient dimensions from each alloy group were
protectively wrapped and underwent surface analysis at a later date.
3. Surface analysis
The American National Standards Institute describes surface texture as "the
repetitive or random deviation from the normal surface that forms the three dimensional
topography of a surface". Average roughness (Ra) is used to detect general variations in
overall profile height and Rq (root mean-square average) measures roughness profile
from the mean line. Ra measures peaks and valleys and Rq detects differences in
spacing and distribution of the peaks and valleys.64 Specimen surfaces to which
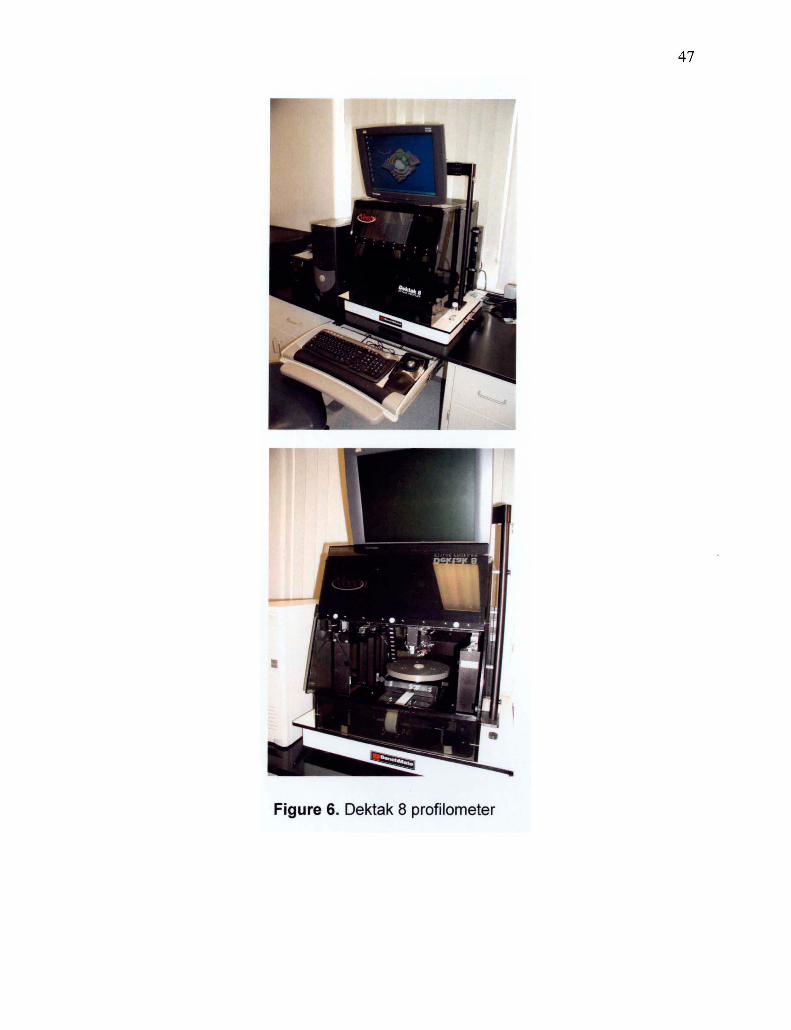
porcelain would be added were analyzed using a surface profilometer (DekTak 8; Veeco
Instruments Inc. Woodbury, New York) to determine roughness of Duceranium U and
Encore specimens to be used. The DekTak8 profiJer includes both Ra and Rq functions.
(Figure 6)
4. Opaque porcelain application
The profiled specimens were re-measured in multiple spots with a Boley gauge
to select specimens which best corresponded with ISO 9693 specifications. Twenty
eight specimens of each alloy group were determined acceptable for porcelain
application.
One-half of the Duceranium U (n=14) and one-half of the Encore specimens
(n=14) received an opaque layer, whereas the other half did' not. The remaining
specimens were kept dry and under vacuum until denUn porcelain application. Ceramco
3 powder opaque (Dentsply Ceramco, Burlington, NJ) and Vita 900 paste opaque

18
(Vident, Brea, CA) were used with half (n=7) of both Duceranium U and Encore
specimens. (Figure 7) The CTE of both porcelains were given as a range from the
manufacturer. Ceramco 3 is "to be used with alloys with a CTE of 13.9 to 14.9 x lO-6rc" ,
and Vita 14.0 to 14.4 x 10⁻⁶rC. (Personal communication with Laboratory Technicians at
Dentsply Ceramco and Vident.) The CTE of both Duceranium U and Encore alloys is
14.1 x 10⁻⁶/ ·C.
Vita 900 paste opaque was added with a clean glass rod. The Ceramco 3
opaque powder was mixed with distilled water to make a paste. This paste was added to
the strip with a small, clean flat brush. Thin even coats were applied to specimens, which
were then dried in front of the porcelain oven for approximately 10 minutes. All
specimens were suspended on a firing platform to simulate the standard level of a crown
framework within the oven muffle during the opaque firings. (Figure 8) The Vita 900
specimens were fired at 500°C and held for 6 minutes. Following this, during another six
minutes, the temperature increased to 900°C and was held for 3 minutes followed by 6
minutes under vacuum. The Ceramco 3 opaque specimens were fired at 500°C under
continuous vacuum to 975°C for 5 minutes. All specimens were not completely masked
with this first layer of opaque, therefore an additional layer of opaque was added to each
specimen. Second layers were added after specimens cooled. The Ceramco 3-second
opaque firing schedule was unchanged from the first layer firing. The second Vita 900
opaque firing was the same as the first firing, however it was held at the high
temperature for 2 minutes prior to the 6-minute vacuum. (Table III) After two opaque
layers, the metal alloy strips were successfully masked with opaque porcelain. This
opaque application was aimed to mimic the average thickness of opaque porcelain when
added at the dental laboratory for crown frameworks.
19
5. Dentin (Body) porcelain application
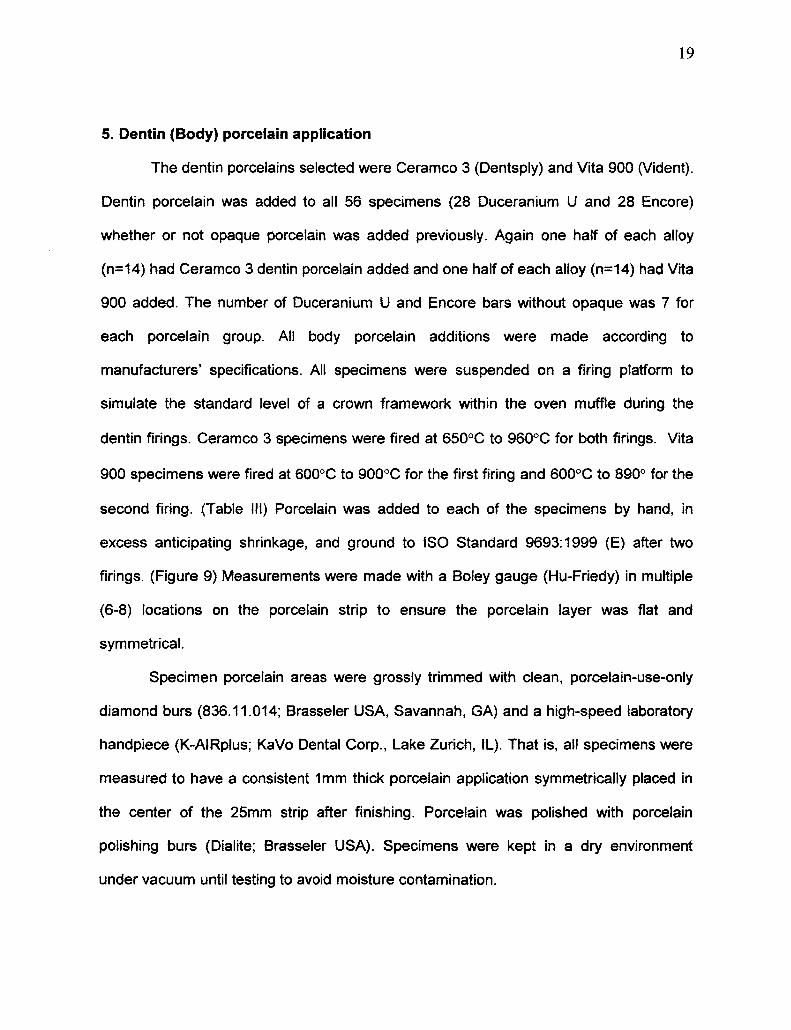
The dentin porcelains selected were Ceramco 3 (Dentsply) and Vita 900 (Vident).
Dentin porcelain was added to all 56 specimens (28 Duceranium U and 28 Encore)
whether or not opaque porcelain was added previously. Again one half of each alloy
(n=14) had Ceramco 3 dentin porcelain added and one half of each alloy (n=14) had Vita
900 added. The number of Duceranium U and Encore bars without opaque was 7 for
each porcelain group. All body porcelain additions were made according to
manufacturers' specifications. All specimens were suspended on a firing platform to
simulate the standard level of a crown framework within the oven muffle during the
dentin firings. Ceramco 3 specimens were fired at 650°C to 96O"C for both firings. Vita
900 specimens were fired at 600°C to 900°C for the first firing and 600°C to 890° for the
second firing. (Table III) Porcelain was added to each of the specimens by hand, in
excess anticipating shrinkage, and ground to ISO Standard 9693:1999 (E) after two
firings. (Figure 9) Measurements were made with a Boley gauge (Hu-Friedy) in multiple
(6-8) locations on the porcelain strip to ensure the porcelain layer was flat and
symmetrical.
Specimen porcelain areas were grossly trimmed with clean, porcelain-use-only
diamond burs (836.11.014; Brasseler USA, Savannah, GA) and a high-speed laboratory
handpiece (K-AIRplus; KaVo Dental Corp., Lake Zurich, IL). That is, all specimens were
measured to have a consistent 1mm thick porcelain application symmetrically placed in
the center of the 25mm strip after finishing. Porcelain was polished with porcelain
polishing burs (Dialite; Brasseler USA). Specimens were kept in a dry environment
under vacuum until testing to avoid moisture contamination.

20
6. Bond Strength Determination
Codes used for describing the structure of metal-ceramic flexure bars were
Duceranium U (D), Encore (E), Ceramco 3 (C), Vita 900 (V), Opaque (0), non-Opaque
(N). Metal-ceramic specimens evaluated were EOC (Encore -Opaque-Ceramco 3),
DOC (Duceranium U-Opaque-Ceramco 3), ENC (Encore-non-Opaque-Ceramco 3),
ONC (Duceranium U-non-Opaque-Ceramco 3), EOV (Encore-Opaque-Vita 900), DOV
(Duceranium U-Opaque-Vita 900), ENV (Encore-non-Opaque-Vita 900), DNV
(Ouceranium U-non-Opaque-Vita 900). (Figure 10)
Metal-ceramic bond characterization was determined using the Schwickerath
crack initiation test a method described in ISO 9693: 1999 (E).60 The debonding
strength/crack initiation strength for materials loaded in a 3-point flexure test
configuration is determined by the equation:
Tb=k'Ffall
where Tb is the debonding strength/crack initiation strength in MPa. The coefficient k is a
function of both the thickness of the metal and the elastic modulus of the alloy. It is
determined from a table contained in ISO 9693:1999 (E).60 (Graph 1) The Young's
(elastic) modulus for the Encore alloy is 178 GPa and for Duceranium U is 153 GPa. F'ail
is the measurement of load (in Newtons) applied to the specimen at that point in time
when the ceramic debonded from the metal alloy (load at failure). The ISO 9693:1999
(E) standard for acceptable porcelain-alloy bond strength is 25 MPa.
Eight groups containing at least 6 flexure bars were tested in a mechanical
testing device (Model 5581; Instron Corporation, Canton, MA). The three-point bending
apparatus had a support span of 20.0 mm. A center load was applied at a crosshead
speed of 1.50mm/min-1• A 50-N load cell was used for all testing (Instron Corp.) All

21
specimens were placed in the mechanical testing device so that the porcelain layer was
opposite the applied load, and testing was halted following a 5% drop in load. (Figure
11) Load-versus-displacement curves were generated for each specimen. (Figure 12)
Pilot studies suggested that it would be difficult to determine, from load-versus
crosshead extension curves, the precise point at which initial metal-ceramic failure
occurred. Many studies 9,17,61-63 in the literature record "load at catastrophic failure" to
determine bond strength. However, there are two problems associated with that
method: first, the load-versus-extension curves do not maintain linearity, and second,
metal-ceramic bond failure generally occurs prior to catastrophic failure.
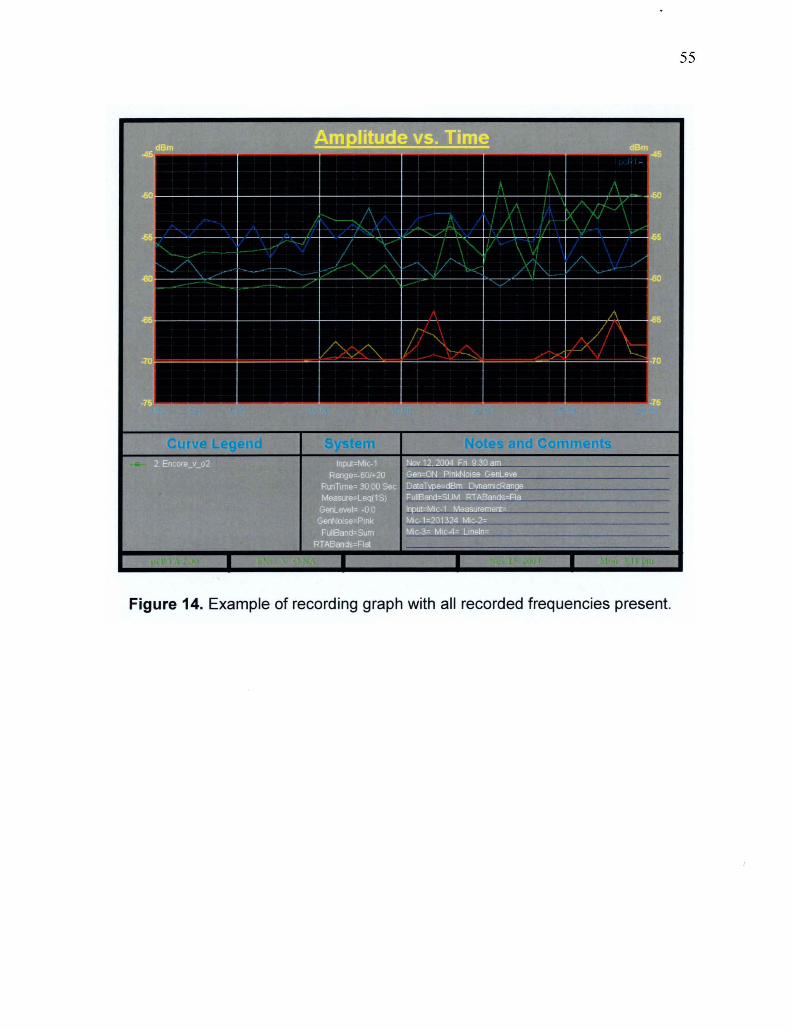
To help determine a defined initial metal-porcelain failure, a precision
measurement microphone (Model M53, UnearX Systems Inc., Tualatin, OR) was placed
in close approximation to the test specimen (Figure 13) and amplitude versus time
graphs were generated using noise analysis software (pcRTA, Version 2.30; UnearX
Systems Inc.). (Figure 14) The pilot study suggested that initial metal-porcelain failure
was best simultaneously observed and recorded at 5- and 10-kHz. In the noise analysis
control panel the pink noise generator was selected and an American National
Standards Institute-A (ANSI-A) weighted filter was used with the dynamic range fixed
between -60 and +20 dBm. Pink noise is the most common noise source used during
noise analysis. It also produces a flat line during noise analysis, since pink noise is
energy versus log frequency, and the noise analysis software displays log frequency.
The selection of the ANSJ-A weighted filter helped attenuate low frequencies while
allowing higher frequencies to pass relatively unattenuated. Noise analysis was started
at the same time as the flexure test so that there would be a time correspondence
between the amplitude versus time curves and the load-versus-displacement curves.

(Figure 15) Load at initial failure was determined from the load-versus-crosshead
extension curves and confirmed with the noise analysis curves.
7. Debonding analysis
22
Two failure modes can be encountered using a 3-point flexure test using flexure
bars with geometry described by Fig. 2. Cracks forming between the ends of the ceramic
layer and on the tensile surface indicate that the porcelain's flexural strength has been
exceeded. However, cracks forming on one end of the porcelain layer indicate that the
combined shear and normal stresses at the metal-ceramic junction were responsible for
debonding.67 In this study, the latter mode constituted a valid test. Therefore, following
testing each specimen was observed using light microscopy (Wild M8, Heerbrugg,
SWitzerland) at x20 to x80 magnification to determine whether or not a satisfactory test
was completed. Basic fuchsin dye penetrant (Medical Chemical Corp., Torrance, CA)
was applied to the debonded bar to assist with visualization of the failure origin. In
addition, three flexure bars from each group were polished to 600 grit on one side using
a metal/ographic polisher (Metaserv 2000; Buehler Ltd., Lake Bluff, IL) and then
evaluated by scanning electron microscopy (SEM) (LEO 1450VP SEM System; Carl
Zeiss Micro Imaging Inc.; Thornwood, NY) to determine the mode of failure. None of the
specimens failed with cracks occurring in the middle of the ceramic layer, which would
have indicated an inappropriate failure mode according to Schwickerath test standards.
(Figure 16)
8. Data analysis
Data included three variables: porcelain, opaque, and metal. A covariate was the
surface roughness of the metal bars. Overall results can be found in Table IV. Data were
statistically analyzed using a 3-way analysis of variance (ANOVA), and the Tukey HSO
test was used for all pairwise multiple comparisons (a=.05) using statistical software

23
(Sigma Stat for Windows Version 2; Jandel Corp., San Rafael, CA). (Table V) In
addition, Spearman's correlation was used to determine the relationship between Ra
values and bond strength. (Table VI)

24
V.RESULTS
The use of a precision measurement microphone resulted in the selection of load
values that were lower than the peak (catastrophic) load recorded on the load-versus
displacement curves during testing. The 3-way ANOVA indicated a statistically
significant difference (P= .028) between the debonding strength/crack initiation strength
of opaqued and non-opaqued specimens metal-ceramic bars. In addition, the interaction
between opaque and metal was statistically significant (P=.048) No other interaction or
their effects were significant. (Table V)
The mean values of the debonding strength/crack initiation strengths of the
metal-ceramic systems are listed in Table VII. The differences in debonding
strength/crack initiation strength were not statistically significant. The alloy-opaque
porcelain system with the greatest bond strength was EOG; alternatively, the system
with the lowest bond strength was ONV. All bars receiving opaque prior to body
porcelain application achieved a bond strength greater than 25 MPa and therefore met
requirements set forth by ISO 9693: 1999 (E) for metal-ceramic systems. For flexure bars
without opaque, ONG and ENV achieved a debonding strength/crack initiation strength
exceeding 25 MPa thus meeting ISO 9693: 1999(E) requirements, however groups ONV
and ENG did not achieve 25MPa. That is, 6 of the 8 metal-ceramic groups tested had
debonding strengths/crack initiation strengths which would pass the ISO 9693: 1999 (E)
standard for bond strength of acceptable metal-ceramic pairs. (Graph 2)
Addition of opaque to the Encore alloy (EO) resulted in a significantly higher
debonding strength/crack initiation strength than Encore without opaque (EN) P=.0019):
There was no significant difference between debonding strength/crack initiation strength
for Ouceranium U with opaque (~O) and without opaque (ON). (Table VIII)
None of the flexure bars failed from cracks initiating on the tensile surface, rather
each failed at the metal-ceramic junction at one end of the porcelain veneer addition.
25
Flexure bars with Vita 900 porcelain with and without opaque and Ceramco 3 porcelain
with opaque exhibited adhesive failure modes. Adhesive failures occurred between the
metal oxide and opaque or between the metal oxide and the body porcelain when no
opaque was used, but not between the body porcelain and opaque porcelain. (Figure
17) It is interesting to note two groups contained cohesive failures, the Ouceranium U
with Ceramco 3 porcelain system without opaque (ONC) and the Encore with Ceramco 3
porcelain system without opaque (ENC). (Figure 18) The Ceramco 3 range of CTE was
significantly larger than that of Vita porcelains. However there was no significant
difference in bonding strengths one porcelain system to the other.
Only 5 individual specimens (3 Ouceranium U and 2 Encore metal-ceramic
flexure bars) exhibited linear-elastic behavior on the load-versus-displacement curves
regardless of the system evaluated; all other metar-ceramic specimens demonstrated
non-elastic behavior during flexure testing. Furthermore, the noise analysis peaks at the
5- and 10-kHz coincided with the point on the load-versus-displacement curves where
there was no longer a straight-line relationship. (Figure 15)
There was no correlation found between alloy Ra values and bond strength.
(Graph 3)
26
VI. DISCUSSION
It is known that metal-ceramic bonding depends on chemical interaction between
the porcelain and the metal alloy. The alloys and porcelains chosen for this study were
aimed to represent popular choices made for metal-ceramic crown restorations in the
United States.
In this study it was found that there is a statistically Significant difference in
debonding strength/crack initiation values with the addition of opaque porcelain. The null
hypothesis, which stated that there is no difference, must therefore be rejected and the
alternative selected.
While it is understood that debonding occurs when the relationship between load
and crosshead displacement is no longer a straight line, the ISO 9693: 1999 (E) is
unclear regarding what specific load point corresponds to initial debonding of a metal
ceramic system. The speCification states stop the test at a 5% load drop, and this was
where the metal bar exhibited elastic elongation. The porcelain can not stay adherent
along the entire surface of the bar at this time. There is a certain ambiguity as to the
exact stopping point of this test, and as such, the specific determination of debonding
strength/crack initiation becomes complicated.
Initial debonding can and should not be determined as the equivalent of the
maximum-recorded load. This maximum load is most likely correlated to debonding and
eventual delamination of the porcelain veneer. For this test it was determined initial
debonding/crack initiation was defined by the coincidence of three analyses:
1. The point on the load-versus-displacement curves where plastic deformation
occurred (stray from a straight line)
2. Peaks in the 5- and 10- kHz frequencies recorded
3. Analysis of porcelain delamination with SEM

27
For this study, the point of initial metal-ceramic debonding was lower than the
peak load point on load-versus-displacement curves. It should be noted that if the peak
load value were used all of the specimens tested would pass the minimum bonding
strength requirement (25MPa) set in ISO 9693:1999 (E). The question thus may arise,
that previous studies using this ISO standard, to determine metal-ceramic bonding
strengths, could have been overestimated if those systems tested behaved similarly to
those in this study and the peak-load value was used as Ffail• Regardless, this study
found that two metal-ceramic systems tested were not within the ISO standard of
25MPa, and both did not have an opaque layer.
The test was stopped at a 5% load drop, with minimum damage accumulated,
and SEM images demonstrating debonding had occurred at one end (with a crack
propagating toward the intact end). The mode of failure for the specimens was stated to
be both adhesive and cohesive through SEM analysis. However the true failure mode
would be best determined after the removal of the cracked porcelain veneer and
analysis performed with an energy dispersive spectrometer, because it may be difficult
to distinguish between body and opaque porcelain remnants on the metal bar. In this
study it was determined that testing should be halted prior to complete debonding of
porcelain so that a failure sequence could be evaluated.
Clinically, "ideal" metal-ceramic failure would be cohesive in nature (within
porcelain). That is, the bond between metal and porcelain should be greater than the
cohesive strength of the porcelain. If this were the case, we would not have questions
regarding the integrity of the metal-ceramic bond and/or the materials employed. For this
study, the predominant failure mode was adhesive (6 out of 8 groups). It is interesting to
note that the two more "ideal" failure modes (cohesive) were within specimens with no
opaque used. A similar result was found for Lehner and Holtan22 using specimens
without opaque.

28
Many bonding strength tests exist in dental materials science, each focusing on a
different fracture mechanism of the porcelain.65-66 The decision to use the Schwickerath
test (the ISO standard) was made for several reasons. Besides being the industry
standard, the three-point flexure test has several advantages. Fabrication of specimens
has been said to be "easy .. 67 and was determined to be relatively straight-forward,
however as Quinn states, "the test appears deceptively easy but requires some care in
specimen preparation and test execution to obtain results with low error and consistency
between laboratories".68 Specimen dimensions can mimic clinical situations fairly closely
in regards to metal and porcelain thickness and flexure of a Fixed Partial Denture
connector. The stress values generated are mean values over a certain range and for
most material combinations, the 3-point flexure test yields the same relative rating in
bond strengths as measured in other experiments.67
Critics of the test state that because maximal tensile stresses are created at the
surface of the porcelain, predictable tensile failures result. 65,66 However our initial pilot
study included FEM analysis and disputes this statement; the peak stresses in the
composite strip occur at the end of the porcelain. (Figure 19)
A second criticism comes from the questionable analysiS of stress states present
at the interface.69 However, Lenz et aI, agreeing that the stress states at the porcelain
metal junction-edge were complex, analyzed the junction stresses with FEM and
mathematical formulae. These authors used a method that allowed the calculation of
mean stress values, along the porcelain-metal junction of the strip, independent of the
precise distribution of stresses at the edge of the specimen.
The question can be asked, does the ceramic breakage depend too much on the
elastic modulus (Em) of the metal tested? 66 According to Lenz et al when the initial
testing was done proposing the Schwickerath test as the ISO standard for metal-ceramic
bond strength, several alloys were used with varying Ems (80GPa to 240 GPa) and

29
there was no significant difference between bonding strengths as based on Em. "The
ratio of mean shear stress to mean tensile stress [thus] amounts to = 1 for all possible
material combinations ... for all material combinations the zone of tensile normal stress
has the same extension, [it is] clear that in these experiments the bond strength is
always tested under similar stress conditions ... 67 Furthermore, the Em of the alloy is
taken into consideration in the coefficient k value in the equation to determine bond
strength.
Anusavice et al completed a comparative analysis of eleven metal-ceramic~metal
bond tests using FEM in 1980.65 The authors analyzed only the shear stress states
distribution along each theoretical metal-porcelain interface. They found that 3 tests (the
3- and 4-point flexure tests and the rectangular parallel shear test) were least likely to
exhibit failure in porcelain only. However the two bending tests indicated high stress
concentration values which may cause bond failures at lower average stresses than
would be required to cause bond failures in other systems. It was also acknowledged
that the FEM calculations were based on a perfect bond between metal and porcelain,
and stress disturbance effects were assumed to be negligible. It was concluded that due
to stress concentrations, "average bond strength values calculated from laboratory tests
[are} expected to be generally lower in magnitude than the stresses which would result in
the absence of stress risers."
While bond strengths of the majority of groups tested here were above the ISO
standard of 25 MPa, it is obvious that the base metal specimens have the most
significant results regarding the absence of opaque. Debonding failures occurred in
anticipated areas. It can be assumed the porcelain surface finish must have been
consistent, with no flaws present to initiate an unwanted fracture in the middle of the
specimen. Also, attempts were made to maintain integrity of specimens by keeping
specimens under dry vacuum until testing, to avoi.d moisture contamination and the

30
potential problems with ceramic crack propagation.70-71 During fabrication of specimens
however, four base-metal specimens failed prematurely. There were three specimens
lacking opaque in which the ceramic completely broke free of the metal strip during
finishing of the porcelain. These specimens were numbers 20, 49, 5 and the alloy strips
were steam cleaned with distilled water and porcelain re-added.
The mode of failure for Duceranium U specimens was both cohesive and
adhesive. For all specimens tested, the ceramic was not allowed to wholly fracture off of
the alloy strip. Recording of the initial crack (failure) was important to register the precise
failure timelload values. It was for this reason that two separate recording methods were
used to determine the exact time of failure. It is important to not allow the test to continue
(increased load on specimen) to avoid incorrect load values and subsequent erroneous
bond strength values. The load-to-failure results are considerably lower with this
acoustic assistance, than those results expected with the load-versus-displacement
curves alone. (Figure 15)
Duceranium U demonstrated a modest difference between debonding
strength/crack initiation strength with and without opaque, as compared to Encore with
and without opaque. It could be reasoned that the Duceranium U specimens had
adequate bonding between body porcelain and the alloy because of additional oxide
elements present in the alloy. CIA major difference in the bonding behavior between
precious and non-precious alloys stems from the difference in availability of readily
oxidizable base metal elements.,,72 In 1977 Anusavice et al studied the bonding
mechanism between ceramic and non-precious alloys with x-ray energy analysis.24
Elemental couples were analyzed. Authors found a Cr-O-AI complex was formed
between the alloy and the ceramic and credited Cr (from the alloy) for connecting with
the ceramic layer. Murakami and Schulman 12 state the positive characteristics of non
precious alloys include: A low specific gravity that is one-half that of gold alloys, an Em

31
over two times that of gold alloys, a high-yield strength, and a sag resistance that is nine
times greater (than gold) because of high melting temperature. These characteristics
may also have contributed to the Duceranium U metal-ceramic specimens having high
bond strength values. The Encore alloy used may not have had a mature, useful oxide
layer to achieve bond strengths comparable to the use of opaque. Application of body
porcelain directly to Duceranium U and Encore metal alloys can, in some circumstances,
produce an acceptable bond according to ISO 9693: 1999 (E). (Table VIII)
The significance of interfacial morphology as a variable could not determined in
this study. Further testing is needed with more adequate variation of specimen Ra and
Rq to determine if there may be a statistically significant effect.

VII. CONCLUSIONS
The following conclusions were made:
1. Presence of opaque porcelain generally increased the debonding strength/crack
initiation strength for metal-ceramic systems, however magnitude varies with the
particular alloy and porcelain combination.
2. Opaque porcelain may not be necessary for a clinically adequate metal-ceramic
bond for some metal-ceramic systems.
32
3. Initial failure during debonding strength/crack initiation strength testing corresponds
to the point on the load-versus-displacement curves where there is no longer a
straight line.
4. Acoustic measurements in coordination with load-versus-displacement curves allow
more precise determination of initial failure during three-point metal-ceramic flexure
testing.

33
VIII. FUTURE RESEARCH
The findings of this study provide the following future research opportunities:
1. Further evaluation of the exact materials limited to this study with other, established
metal-ceramic bond tests (such as the pull-shear test, oxide adherence test, thermal
expansion testing. and thermal shock testing.)
2. To determine future metal-ceramic working pairs which do not require opaque
porcelain for satisfactory bond strengths.
3. Specific oxide analysis to characterize exact elemental, working pairs responsible for
bond in order to:
a. further define exact chemical nature of metal-ceramic bond.
b. to coat to high noble alloys for future metal-ceramic bond tests.
4. Wear testing to determine wear rates of enamel opposing both polished or glazed
opaque porcelain.
S. Wear testing to determine difference in wear rates of exposed opaque porcelain
alone versus an exposed margin of metal and opaque porcelain.

IX. BIBLIOGRAPHY
1. O'Brien WJ Strengthening mechanisms of current dental porcelains. Compend Contin Educ Dent 2000;21 :625-30.
34
2. Cornell OF, Kois JC, Rifkin LR. Advances in ceramic restorations. Com pend Contin Educ Dent 2002;25:450-62.
3. McLean J. Evolution of dental ceramics in the twentieth century. J Prosthet Dent 2001 ;85:61-66.
4. Preston JD. Rational approach to tooth preparation for ceramo-metal restorations. Dent elin North Am 1977;21: 683-698.
5. Brecker SC. Porcelain baked to gOld-a new medium in prosthodontics. J Prosthet Dent 1956;6:801-10.
6. Johnston JF, Dykema RW, Cunningham OM. The use and construction of gold crowns with a fused porcelain veneer-a progress report. J Prosthet Dent 1956;6:811-21.
7. Naylor WP. Metal Ceramic Technology. Quintessence Publ Co. Chicago, IL 1992.
8. Shell JS, Nielsen JP. Study of the bond between gold alloys and porcelain. J Dent Res 1962;41:1424-143.
9. Mackert JR, Parry EE, Hashinger DT, Fairhurst CWo Measurement of oxide adherence to PFM alloys. J Dent Res 1984;63: 1335-40.
10. Lacy AM Ceramometal restorations. In: Eissmann et ai, eds. Dental Laboratory Procedures. Fixed Partial Dentures. Volume II Chapter 13CV Mosby Co. St. Louis, IL: 1980.
11. McLean JW, Sced IR. Bonding of dental porcelain to metal II. The base-metal alloy/porcelain bond. Trans Sr Ceram Soc 1973;5:235-8.
12. Murakami I, Schulman A. Aspects of metal-ceramic bonding. Dent Clin North Am 1987;31 :333-46.
13. Craig RG, Ward ML Restorative Dental Materials 10th ed. Chapter 18 Mosby-Year Book St. Louis, MO 1997.
14. Wight TA, Bauman JC, Pellen GB. An evaluation of four variables affecting the bond strength of porcelain to non-precious alloys. J Pros Dent 1977;37: 570-7.
15. Knap F, Ryge, G. Study of bond strength of dental porcelain fused to metal. J Dent Res 1966;45:1047-51.
16. Lund PS, Goodkind RJ, Swanson S. Residual stress in several ceramometal systems. J Prosthet Dent 1989;62: 278-83.

17. Coffey JP, Anusavice KJ, Dehoff PH, Lee RB, HOjjatie B. Influence of contraction mismatch and cooling rate on flexural failure of PFM systems. J Dent Res 1988;67:61-5.
18. Fairhurst CW Anusavice KJ, Ringle RD, Twiggs SW. Porcelain-metal thermal compatibility. J Dent Res. 1981;60:815-9.
19. Asaoka K, Tesk JA. Transient and residual stress in a porcelain-metal strip. J Dent Res 1990;69: 463-469.
20. Claus H. The structure and microstructure of dental porcelain in relation to firing conditions. Int J Prosthodont 1989;2:376-84.
21. Rosensteil SF, Land MF, Fujimoto J. Contemporary Fixed Prosthodontics 3rd ed. p. 617, C.v. Mosby Co. St. Louis, IL 2001.
35
22. Lehner C, Holtan J. A comparison of the bond strength of opaque and body porcelains on different types of ceramo-metal alloys. Schweiz Monatsschr Zahnmed 1988;98: 937-943.
23. al Mutawa NJ, Sato T, Shiozawa I, Hasegawa S, Miura H. A study of the bond strength and color of ultralow-fusing porcelain. Int J Prosthodont. 2000 MarApr; 13(2): 159-65.
24. Anusavice KJ, Ringle RD, Fairhurst CWo Bonding mechanism evidence in a ceramicnon precious alloy system. J Biomed Mater Res 1977; 11: 701-709.
25. Monasky GE, Taylor OF. Studies on the wear of porcelain, enamel, and gold. J Prosthet Dent 1971;25:299-306.
26. Verrett, RG. Analyzing the etiology of an extremely worn dentition. J Prosthet Dent 2001; 1 0:224-233.
27. DeLong R, Sasik C, Pintado MR, Douglas WHo The wear of enamel when opposed by ceramic systems. Dent Mater 1989;5:266-71.
28. Mair LH. Understanding wear in dentistry. Compend Contin Educ Dent 1999; 20:19-32.
29. Hattab FN. Othman MY. Etiology and diagnosis of tooth wear: a literature review and presentation of selected cases. Int J Prosthodont 2000;13:101-107.
30. Turner KA, Missirlian OM. Restoration of the extremely worn dentition. J Prosthet Dent 1984;52: 467-74.
31. MahaJick JA, Knap FJ, Weiter EJ. Occlusal Wear in Prosthodontics. J Am Dent Assoc 1971 ;82: 154-158.
32. Oh WS, Delong R, Anusavice KJ. Factors affecting enamel and ceramic wear: a literature review. J Prosthet Dent 2002;87:451-9.

36
33. Magne P, Oh WS, Pintado MR, DeLong R. Wear of enamel and veneering ceramics after laboratory and chairside finishing procedures. J Prosthet Dent. 1999;82:669-79.
34. Kelly JR, Nishimura I, Campbell SD. Ceramics in dentistry: historical roots and current perspectives. J Prosthet Dent 1996;75:18-32.
35. Ward et al. Surface roughness of opalescent porcelain after polishing. Oper Dent. 1995 20: 1 06-1 0
36. Ramp MH, Ramp LC, Suzuki S. Vertical height loss: an investigation of four restorative materials opposing enamel. J Prosthodont 1999;8:252-7.
37. Sulong MZ, Aziz RAWear of materials used in dentistry: a literature review. J Prosthet Dent 1990;63:342-9.
38. Seghi RR, Rosenstiel SF, Bauer P. Abrasion of human enamel by different dental ceramics in vitro. J Dent Res 1991;70:221-5.
39. Clelland NL, Agarwala V, Knobloch LA, Seghi RR. Relative wear of enamel oppposing low-fusing dental porcelain. J Prosthodont 2003; 12: 168-75.
40. Ebbing, DD. General Chemistry, 4th edition. Chapters, 2, 9, 21: Boston, MA, Houghton Mifflin, 1993.
41. Fairhurst CW, Anusavice KJ, Hashinger DT, Ringle RD, Twigg SW. Thermal expansion of dental alloys and porcelain. J Biomed Mater Res 1980;14: 435-446.
42. Wagner WC, Asgar K, Bigelow WC, Flinn RA. Effect of interfacial variables on metalporcelain bonding. J Biomed Mater Res. 1993;27:531-7.
43. Szantho von Radnoth M, Lautenschlager EP. Metal surface changes during porcelain firing. J Dent Res 1969;48: 321-4 .
44. Fairhurst CW, Hashinger DT, Twiggs SW. The effect of thermal history on porcelain expansion behavior. J Dent Res 1989;68: 1313-15.
45. DeHoff PH, Anusavice KJ. Tempering stresses in feldspathic porcelain. J Dent Res 1989;68: 134-38.
46. http://www.webelements.com/webelements/properties/textldefinitions/coeff-thermalexpansion.html
47. Nielsen JP, Tuccillo JJ. Interfacial stress in porcelain bodies bonded to metal prosthetic restorations. J Biomed Mat Res 1972;6:395-404.
48. Lenz J, Kessel S. Thermal stresses in metal-ceramic specimens for the ISO crack initiation test (three-point flexure bond test). Dent Mater 1998;14:277-80.
49. Mackert JR, Ringle RD, Parry EE, Evans AL, Fairhurst CWo The relationship between oxide adherence and porcelain-metal bonding. J Dent Res 1988;67:474-8.

50. Vickery RC, Badinelli LA. Nature of attachment forces in porcelain-gold systems. J Dent Res 1968;47:683-9.
51. King BW, Tripp HP, Duckworth WHo Nature of Adherence of Porcelain Enamels to Metals. J Am Ceram Soc 1959;42:504-525.
52. Pask JA, Fulrath RM, Fundamentals of glass-to-metal bonding: VIII, Nature of Wetting and Adherence. J Am Ceram Soc 1962;45:592-596.
53. http://www. corrosion-doctors. org/HotCorrosion/Piliing. htmsiondectors. erg
54. Huang HH, Lin MC, Lee TH, Yang HW, Chen FL, Wu SC. Effect of chemical composition of Ni-Cr dental casting alloys on the bonding characterization between porcelain and metal. J Oral Rehab 2005;32:206-12.
55. Warpeha WS, Goodkind RJ. Design and technique variables affectIng fracture resistance of metal-ceramic restorations. J Prosthet Dent 1976;55: 291-8.
37
56. Graham JD, Johnson A, Wildgoose DG, Sharef MY, Cannanria G. The effect of surface treatment on the bond strength of anon-precious alloy-ceramic interface. Int J Prosthodont 1999;12:330-334.
57. Carpenter MA, Goodkind RJ. Effect of varying surface texture on bond strength of one semiprecious and one nonprecious ceramo-alloy. J Prosthet Dent 1979;42: 86-95.
58. Jochen DG, Caputo AA, Matyas J. Effect of metal surface treatment on ceramic bond strength. J Prosthet Dent 1986;55:186-188.
59. Cai Z, Bunce N, Nunn ME, Okabe T. Porcelain adherence to dental cast CP titanium: effects of surface modifications. Biomaterials 2001 ;22:979-986.
60. International Organization for Standardisaziton: ISO standard no.9693: Dental porcelain fused to metal restorations, Geneva, Switzerland 1999.
61. Jochen DG, Caputo AA, Matyas J. Effect of opaque porcelain application on strength of bond to silver-palladium alloys. J Prosthet Dent 1990;63:414-41.
62. Caputo AA, Dunn B, Reisbick MH. A flexural method for evaluation of metal-ceramic bond strengths. J Dent Res 1977;56:1501-06.
63. Lorenzana RE, Chambless LA, Marker VA, Staffanou RS. Bond strengths of highpalladium content alloys. J Prosthet Dent. 1990;64:677-80.
64. Chi T, Ballinger T, Olds R, Zecchino M Surface texture analysis using dektak stylus profilers. www.veeco.com 2004
65. Anusavice KJ, Dehoff PH, Fairhurst CWo Comparative evaluation of ceramic-metal bond tests using finite element stress analysis. J Dent Res 1980; 59:608-13.

38
66. Hammad lA, Talic YF. Designs of bond strength tests for metal-ceramic complexes: review of the literature. J Prosthet Dent 1996;75:602-8.
67. Lenz J, Schwarz S, Schwickerath H, Sperner F, Schafer A. Bond strength of metalceramic systems in three-point flexure bond test. J Appl Biomat 1995; 6:55-64.
68. Quinn GO, Morrell R Design Data for Engineering Ceramics: A review of the flexure test. JAm Ceram Soc 1991;74: 2037-66.
69. Personal Communication
70. Rosensteil SF, Denry IL, Zhu W, Gupta PK, Van der Sluys RA. Fluoroalkylethyl silane coating as a moisture barrier for dental ceramics. J Biomed Mater Res 1993;27:415-417.
71. McLean JW. High Stress Ceramics. Quintessence Int. 1987;18:97-106.
72. Bertolotti RL. Porcelain to metal bonding and compatability. In McLean(ed) Dent Ceramics: Proceedings of the First International Symposium on Ceramics. Chicago, IL Quintessence Pub Co. 1983 P 415.

Fig. 1
Fig. 2
Fig. 3
Fig. 4
Fig. 5
Fig. 6
Fig. 7
Fig. 8
Fig. 9
Fig. 10
Fig. 11
Fig. 12
Fig. 13
Fig. 14
Fig. 15
Fig. 16
Fig. 17
Fig. 18
Fig. 19
List of Figures
Worn Dentition opposing exposed opaque porcelain. a, b, c.
Diagram of specimen geometry
Measuring strips for porcelain application
Calibration of porcelain furnaces
Oxidation firing of specimens
Dektak 8 profilometer
Porcelains used for specimen fabrication. a, b
Opaque firing of specimens
Firing of dentin (body) specimens
Flow Chart of specimen preparation
Specimen placed in mechanical testing apparatus
Example of load-versus-displacement curve generated
Microphone adjacent to testing apparatus
Example of recording graph with all recorded noise amplitudes present
Correspondence of noise amplitude versus time with flexure loadversus-displacement curve
Various SEM images of failure modes
Example of metal and body porcelain adhesive failure SEM
Example of cohesive failure within porcelain SEM
FEM used in pilot study
39

Table I
Table 1\
Table III
Table IV
Table V
Table VI
Table VII
Table VIII
40
List of Tables
Alloy composition
Oxidation firing schedules for alloys
Firing schedule for Porcelains
Overall results
3-way ANOVA results for debonding/crack initiation strength
Ra (A) values and debonding strength/crack initiation strength values (MPa) for each alloy system
Mean (SO) debonding strength/crack initiation strength values (MPa) for each metal-ceramic system
Mean (SO) debonding strength/crack initiation strength values (MPa) for each metal and opaque system, irrespective of porcelain type

Graph 1
Graph 2
Graph 3
List of Graphs
K-value determinant rom ISO 9693: 1999 (E)
Mean (SO) debonding strength/crack initiation strength values for each metal ceramic system
Dispersion of specimen values, bonding strength (MPa) by Ra (A)
41

42
Figure 1. Worn dentition opposing exposed opaque porcelain . A, Exposed opaque porcelain on maxillary metal-ceramic restorations. B, Occlusal view of opposing mandibular dentition. C, Facial view of dentition in occlusion .

43
1 14 8 ± 0.1 --+1_1 J.l ± 0.1
~ (..-----,:.-r/====C?!-----,;~~ f .... /4------- 25 ± I --------7--
Figure 2. Diagram of specimen geometry.

44
Figure 3. Measuring strips for porcelain application.

45
Figure 4. Calibration of porcelain furnaces

46
Figure 5. Oxidation firing of specimens on suspended platform
47
Figure 6. Oektak 8 profilometer

'11' .
8
Figure 7. Porcelains used for specimen fabrication . A, Ceramco 3 body and opaque powder. 8, Vita 900 body and paste opaque.
48

49
Figure 8. Opaque firing of specimens.

50
Figure 9. Firing of dentin (body) porcelain on specimens.

51
28 D 28 E
14 V 14 C 14 V 14 C
70 7N 70 7N 70 7N 70 7N
Figure 10. Flow chart of specimen preparation. D, Duceranium U alloy. E, Encore alloy. V, Vita 900 porcelain system. C, Ceramco 3 porcelain system. 0,
Opaque added. N, No opaque added

52
Figure 11 . Specimen placed in mechanical testing device.

Time (sec)
0 5
8
--z --- 6 "'C ns .2 Cl)
4 L-:::l >< Cl)
u::: 2
o
0.0 0.1 0.2 0.3 0.4 Flexure extension (mm)
Figure 12. Example of load-versus-displacement curve generated . Blue tangential line represents departure from linearity.
53

54
Figure 13. Microphone adjacent to testing apparatus.
55
Figure 14. Example of recording graph with all recorded frequencies present.

A dBm
-50
-55
-60
-65
-70
-75 0.00
B
Sec 5.00
0
8
2
o
0.0
56
Amplitude VS. Time dBm
·50 peRTA
A
/\ / \
\
J \
\ /::::
·55
-60
-65
·70
·75 10.00 15.00 20.00
Time (sec)
5 10 15
PL/1
DL~
0.1 0.2 0.3 0.4 Flexure extension (mm)
Figure 15. Correspondence of noise amplitude versus time with flexure loadversus-displacement curve. A, 5 kHz (brown) and 10kHz (red) frequencies were measured over time, and peak was observed in both curves at 13 seconds. B, Departure from linearity (DL) for flexure load-versus-displacement curve occurred at 13 seconds and at a load of 7.05N. Peak load (PL) recorded during testing was 9.05N.
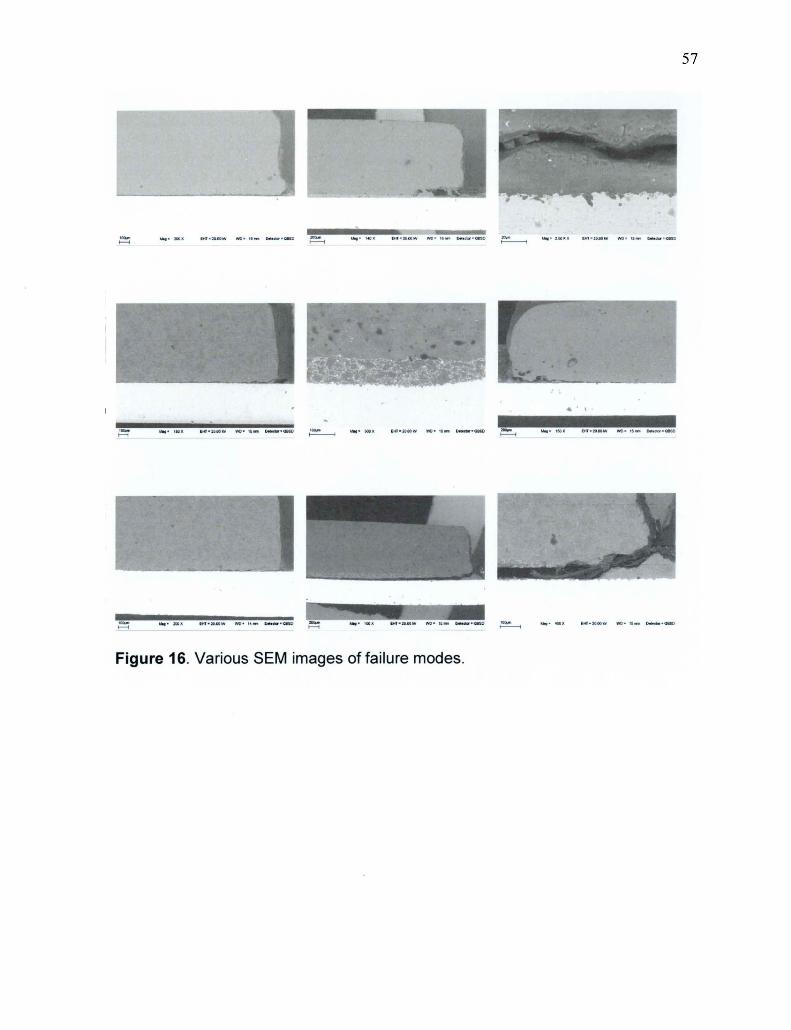
,t-i
-
~ . \ .
• I' _".
+- , ••
~~!C~ ~.
,t---------1
""t o l OCI .
Figure 16. Various SEM images of failure modes.
57
~ ""t - 150 " . lHf _ZO IllOW 'l'\1li 0 11_ o..oaor . oeso
.. ' I

58
Duceranium U
100IJm 1---1
Mag = 200 X EHT = 20 .00 kV WD = 16 mm Detector = aaSD
Figure 17. Example of metal and body porcelain adhesive failure. Original magnification x 200.

59
Duceranium U
200j.Jm Mag = 140 X EHT = 20.00 kV WD = 10 mm Detector = aBSD
I I
Figure 18. Example of cohesive failure within porcelain. Original magnification x 140.

60
Figure 19. FEM used in pilot study

61
Table I. Alloy Composition (Wt. %)
Duceranium U Encore
Ni 59.0 Au 48.0 Cr 21.5 Pd 40.0 Mo 4.5 Zn 4.35 W 5.0 Re 0.05 Mn 0.4 In 3.75 Fe 3.5 Sn 3.85 Co 0.5 Cu 1.5 Si 0.8 Nb 3.2 C 0.1

62
Table II. Oxidation firing schedules for Alloys (OC)
Procedure Duceranium U Encore
Entry temp 650 650 High temp 1010 1038 Heat Rate 55/min 55/min High Temp Hold 5 min vacuum Omin vacuum

63
Table III. a. Firing schedule for Vita 900 and b. Ceramco 3 Porcelains (OC)
a.
Vita 900 Pre-Drying Hold Increase Temp. Hold Vac Temp (min) Approx. (min)
1 st Opaque Firing 500 6 6 900 3 6 2nd Opaque Firing 500 6 6 900 2 6 Dentin Firing 600 6 6 900 1 6 2nd Dentin Firing 600 6 6 890 1 6 3rd Dentin Firing 600 6 6 890 1 6
b.
Vae Ceramco 3 Dry Pre- Vae HiT" Hold C set Idle High Vae Vae Rate
heat hold hold 0 point T" Start Stop C"min 01 (Hg)
Opaque 5 3 0 0 0 0 29 650 970 650 970 70 Dentin 5 5 0 0 0 0 29 650 960 650 960 55

64
Table IV. Overall results for each metal-ceramic bar tested.
Metal Porcelain Opaque FfailN K EmGpa Trial No. Spec. No MPa Ra (A)
0 V 0 8.05 4.05 178 1 56 32.6025 32655 0 V 0 7.43 4.05 178 2 41 30.0915 33730 0 V 0 6.65 4.05 178 3 27 26.9325 62512 0 V 0 6.66 4.05 178 4 15 26.973 41322 0 V 0 5.86 4.05 178 5 9 23.733 43991 0 V 0 5.19 4.05 178 6 24 21.0195 50857 0 V 0 5.36 4.05 178 7 3 21.708 40646 0 C 0 7.16 4.05 178 1 51 28.998 62769 0 C 0 5.79 4.05 178 2 30 23.4495 39674 0 C 0 7.33 4.05 178 3 13 29.6865 67325 0 C 0 4.29 4.05 178 4 31 17.3745 12244 0 C 0 6.6 4.05 178 5 33 26.73 86366 0 C 0 8.09 4.05 178 6 1 32.7645 100480 0 C 0 6.74 4.05 178 7 45 27.297 124498 0 V N 4.93 4.05 178 1 49 19.9665 58953 0 V N 3.32 4.05 178 2 14 13.446 22954 0 V N 6.63 4.05 178 3 52 26.8515 39552 0 V N 4.92 4.05 178 4 23 19.926 35473 0 V N 7.37 4.05 178 5 20 29.8485 69757 0 V N 6.72 4.05 178 6 5 27.216 126784 0 V N 4.05 178 7 0 V N 8.68 4.05 178 1 54 35.154 31133 0 C N 7.92 4.05 178 2 8 32.076 75952 0 C N 4.85 4.05 178 3 22 19.6425 54216 0 C N 6.95 4.05 178 4 16 28.1475 721126 0 C N 5.64 4.05 178 5 42 22.842 28045 0 C N 9.22 4.05 178 6 11 37.341 22954 0 C N 4.05 178 7 E V 0 7.76 4.3 153 1 21 33.368 21597 E V 0 7.93 4.3 153 2 43 34.099 62731 E V 0 5.67 4.3 153 3 31 24.381 60304 E V 0 7.22 4.3 153 4 25 31.046 72464 E V 0 6.79 4.3 153 5 41 29.197 162176 E V 0 6.77 4.3 153 6 45 29.111 63037 E V 0 7.3 4.3 153 7 49 31.39 79817 E C 0 7.09 4.3 153 1 33 30.487 77422 E C 0 7.07 4.3 153 2 5 30.401 34058 E C 0 4.3 153 3 18 E C 0 5.15 4.3 153 4 52 22.145 107075 E C 0 8 4.3 153 5 7 34.4 52616 E C 0 6.56 4.3 153 6 1 28.208 216722 E C 0 9.98 4.3 153 7 4 42.914 46260 E V 0 5.99 4.3 153 1 27 25.757 100416 E V 0 4.3 153 2 24 E V 0 5.18 4.3 153 3 51 22.274 58488 E V 0 6.83 4.3 153 4 32 29.369 32453 E V 0 4.85 4.3 153 5 40 20.855 91652 E V 0 5.45 4.3 153 6 13 23.435 43711 E V 0 7.21 4.3 153 7 37 31.003 21647 E C 0 4.26 4.3 153 1 11 18.318 56346 E C 0 6.33 4.3 153 2 19 27.219 28135 E C 0 49 4.3 153 3 53 21.07 36214 E C 0 5.7 4.3 153 4 54 24.51 162742 E C 0 7.15 4.3 153 5 34 30.745 150908 E C 0 5.63 4.3 153 6 23 24.209 89609 E C 0 5.03 4.3 153 7 50 21.629 173652

65
Table V. Three-way ANOVA results for debonding strength/crack initiation strength.
Source of variation Df SS MS F P
Type of Metal 1 32.67 32.67 1.22 .275 Type of Ceramic 1 32.58 32.58 1.22 .276 Opaque/non-opaque 1 138.18 138.18 5.16 .028 Type of Metal x Type of Ceramic 1 42.15 42.15 11.57 .216 Type of Metal x Opaque/non-opaque 1 110.59 110.58 4.13 .048 Type of Ceramic x Opaque/non-opaque 1 8.87 8.87 0.33 .568 Type of Metal x Opaque/non-opaque x 1 57.12 57.12 2.13 .151 Type of Ceramic Residual 44 1178.05 26.77 Total 51 1591.52 31.21 Of, Degree of freedom; SS, sum of squares; MS. mean square.

66
Table VI. Ra Values (A) and debonding strength/crack initiation strength values (MPa) for each alloy and system
Specimen Ra (A) System Debond. Specimen Ra (A) System Debond. no. Str. no. Str
(MPa) (MPa)
1 100480 DOC 32.7645 1 216722 EOC 28.208 3 40646 DOV 21.708 4 46260 EOC 42.914 5 126784 DNV 27.216 5 34058 EOC 30.401 8 75972 DNC 32.076 7 52616 EOC 34.4 9 43991 DOV 23.733 11 56346 ENC 18.318 11 22954 DNC 37.341 13 43711 ENV 23.435 13 67325 DOC 29.6865 18 92100 EOC 14 22954 DNV 13.446 19 28135 ENC 27.219 15 41322 DOV 26.973 21 21597 EOV 33.368 16 72126 DCN 28.1475 23 89609 ENC 24.209 19 66137 DCN 24 121336 ENV 20 69757 DNV 29.8485 25 72464 EOV 31.046 22 54216 DCN 19.6425 27 100416 ENV 25.757 23 35473 DNV 19.926 31 60304 EOV 24.381 24 50857 DOV 21.0195 32 32453 ENV 29.369 26 47342 DNV 33 77422 EOC 30.487 27 62512 DOV 26.9325 34 150908 ENC 30.745 30 39674 DOC 23.4495 37 21647 ENV 31.003 31 112244 DOC 17.3745 40 91652 ENV 20.855 33 86366 DOC 26.73 41 162176 EOV 29.197 41 33730 DOV 30.0915 43 62731 EOV 34.099 42 28045 DCN 22.842 45 63037 EOV 29.111 45 124498 DOC 27.297 49 79817 EOV 31.39 49 58953 DNV 19.9665 50 173652 ENC 21.629 51 62769 DOC 28.998 51 58488 ENV 22.274 52 39552 DNV 26.8515 52 107075 EOC 22.145 54 31133 DNC 35.154 53 36214 ENC 21.07 56 32655 DOV 36.6025 54 162742 ENC 24.51
AVG. 27446.21 AVG. 40626.10

67
Table VII. Mean (SO) debonding strength/crack initiation strength values (MPa) for each metal-ceramic system.
System Mean Values Statistical Comparison*
EOC 31.43 (6.92) A EOV 30.37 (3.25) A ONC 29.20 (6.97) A OOC 26.61 (4.98) A DOV 26.15 (4.29) A ENV 25.45 (4.04) A ENC 23.96 (4.14) A DNV 22.88 (6.15) A Identical upper-case letters denote no significant differences in metal-ceramic system (P> .05). *Statistical comparisons made using the Tukey HSO test.

68
Table VIII. Mean (SO) debonding strength/crack initiation strength values (MPa) for each metal and opaque/non-opaque system, irrespective of type of porcelain.
System Mean Value Statistical Comparison*
EO 30.89 (5.19) A DO 26.38 (5.17) AS ON 26.04 (5.17) AS EN 24.79 (5.19) S Identical upper-case letters denote no significant differences among metal and opaque/nonopaque systems (P>.05). *Statistical comparison made using Tukey HSD test.

Graph 1. K value determinant from ISO 9693: 1999 (E)
N I
E E 8
..::c-
EM (GPa)
1 60
80 100
6 120 140 160
5 180 200 220 240
4
3
2 ~--~--~------~--~--------~--0,44 0,46 0,48 0,52 0,54 0,56
dM• mm
69

-co Q.
:e -
Graph 2. Mean (SO) debonding strength/crack initiation strength values for each metal-ceramic system.
Bond Strength Values
351-------------------------~ 30+-----~~--------r-~
25 ......--'--20 15 10 5 o -t'--..J..-
Duceranium U
Encore
Alloys
10 Vita with Opaque
o Vita no opaque
• Ceramc03 with Opaque
• Ceramco 3 no Opaque
70

71
Graph 3. Dispersion of Specimen Values, Bonding Strength (MPa) by Ra (A)
40.0000
-5 tJ)
i 30.0000 .b (J)
tJ)
c =0 c o
OJ
::0.0000
10.0000
o
o
0
0
0 00
0 °0 o§ 0 0 of$)
-0 as! 0
dj 0 o 0
0° 0
o
o cP o
50000
0
0
0
0
0 <0> 0
o o
o o
o
100000 150000
Ra
o
0
i' f I I I
R ::;q lin,..,ar '" 0 .oos !
I ~
200000 250000