Embed Size (px)
Citation preview

A comparison between the methods of apportionment
using power indices: the case of the U.S. presidential election
Fabrice BARTHELEMY and Mathieu MARTIN
THEMA
University of Cergy Pontoise
33 boulevard du Port
95011 Cergy Pontoise Cedex
December 10, 2007
Summary: In this paper, we compare the five more famous methods of apportionment,
the methods of Adams, Dean, Hill, Webster and Jefferson. The criteria used for this com-
parison is the minimization of a distance between a power vector and a population vector.
The power is measured with the well-known Banzhaf power index. The populations are
the ones of the different States of the U.S. We then compare the apportionment methods
in terms of their ability to bring closer the power of the States to their relative population:
this ensures that every citizen in the country gets the same power. The U.S. presidential
election by Electors is studied through 22 censuses since 1790. Our analysis is largely based
on the book written by Balinski and Young (2001). The empirical findings are linked with
theoretical results.
JEL classification: C7, D7
Keywords: Banzhaf index, methods of apportionment, distances, balance population-
power.
1

1 Introduction
The president of the United States of America is elected by an electoral college, the Electors,
who have only one function, vote in this election. The direct election by citizens was
excluded (to avoid tumult and disorder) as the election by the Congress (to avoid that the
President should be too dependent of this powerful institution).
There are two steps in the U.S. presidential election. Firstly, the citizens of every
state choose the Electors. Secondly, the Electors vote for the President. Actually, if a
candidate obtains a majority in a State, he takes all of the electoral votes of this State (this
“winner-take-all” method is generally true except for two States, Maine and Nebraska1).
The winner of the U.S. presidential election is the candidate who receives a majority of votes
from the Electors (in 2000, there was 538 Electors divided into 50 States and the District
of Columbia). The number of Electors for each State is the sum of two components: a
fixed one and a proportional one. The fixed one is the number of U.S. Senators which is
always 2 for every State. The proportional component corresponds to the number of seats
in the House of Representatives allocated to each State. For instance, in 2000, the State of
California had 54 seats in the House of Representatives and 2 Senators, which leads to 56
Electors for the presidential election.
An important part of this paper is based on the proportional component. Even if the
number of representatives depends on the population of the State, the Constitution does
not specify any exact rule to apportion the number of Electors to the different States. The
crucial problem comes from the choice of this rule, because different apportionments can
be obtained by using different methods. For example, consider the 1980 census, where
the Colorado population represents 1.279% of the whole U.S. population. The total num-
ber of seats is equal to 435. By considering an egalitarian apportionment, which should
be as close as possible to the ideal one man-one vote, implies that Colorado gets 5.564
seats. Unfortunately, we can not divide a seat. Hence, should the Colorado receive 5 or 6
seats (or, eventually some other number)? As the same question arises for each State, the
apportionment issue becomes complex.
Moreover, many apportionment methods have been developed in the literature. Obvi-
ously, the choice of the method may have fundamental consequences. For instance, with the
1Maine and Nebraska both use the congressional district method. These two States give an Elector to
the winner in each congressional district and two Electors to the State wide vote.
2

1920 census, the State of New York can obtain 41 seats with one method and 45 with an-
other. This difference is significant because it may lead to the election of another President.
As an illustration, President Hayes obtained 185 votes in 1876, and his opponent, Tilden,
obtained 184 votes. This example underlines clearly the importance of the apportionment
issue.
Every 10 years, since 1790, there is a census in U.S. which gives the number of inhabitants
in every State. Since 1790, the proportional repartition of seats is made according to the
most recent census and according to an apportionment method (chosen in an ad hoc way).
Each State obtains at least one seat (according to the Constitution), which leads to at least
three Electors in every State.
The names of the methods of apportionment are generally associated to famous Ameri-
can politicians (John Quincy Adams, Thomas Jefferson, Alexander Hamilton, Daniel Web-
ster), which underlines the importance of the problem. The statesmen have proposed differ-
ent methods to reflect the evolution of the society: the number of States and also the whole
population increased over the period 1790-2000. The size of the House of Representatives
was 105 seats in 1790, while there are 435 seats in 2000. In the same way, the number of
States has increased from 15 in 1790 to 50 in 2000. Finally, the number of Electors which
was 538 in 20002, was only 135 in 1790.
If the politicians have used apportionment in an empirical sense, technical developments
have been made by scientists (several of them have proposed their own method, for instance
James Dean or Joseph A. Hill). The latter have conducted the normative analysis of those
methods. Clearly, the perfect method does not exist which is known since Webster at the
beginning of the nineteenth century. However, Balinski and Young (2001) argue that the
method of Webster, from a normative point of view, is better than the others. This method
belongs to the well-known category of the divisor methods. Obviously, other methods can
be found in the literature, but they are weak from a normative point of view.
The divisor methods are based on a particular number, called the ideal divisor. Keeping
in mind the ideal one man-one vote, each inhabitant of the U.S. should have the same
part of a seat whatever State he belongs to. In an other word, whatever the State, a
seat should be related to the same number of inhabitants. This number of inhabitants
corresponds to the ideal divisor. Hence, the sum of each State population divided by this
2The 435 seats plus the 100 senators and the 3 Electors of the District of Columbia (since 1961).
3
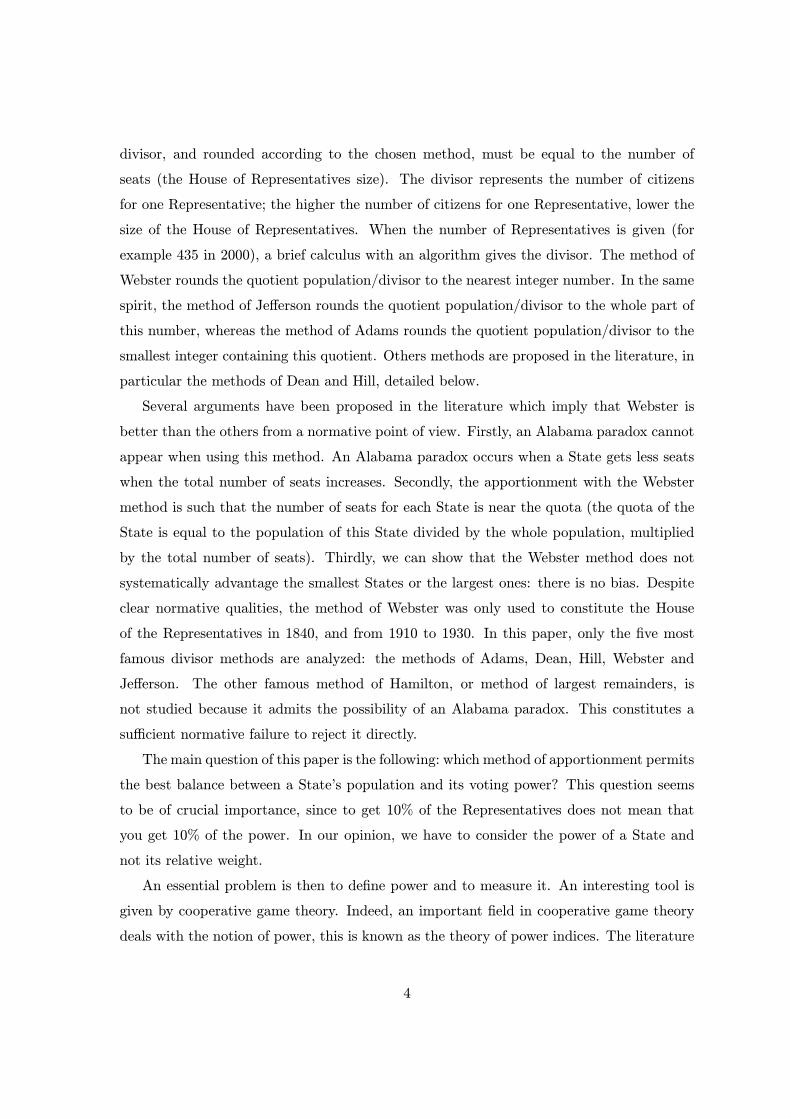
divisor, and rounded according to the chosen method, must be equal to the number of
seats (the House of Representatives size). The divisor represents the number of citizens
for one Representative; the higher the number of citizens for one Representative, lower the
size of the House of Representatives. When the number of Representatives is given (for
example 435 in 2000), a brief calculus with an algorithm gives the divisor. The method of
Webster rounds the quotient population/divisor to the nearest integer number. In the same
spirit, the method of Jefferson rounds the quotient population/divisor to the whole part of
this number, whereas the method of Adams rounds the quotient population/divisor to the
smallest integer containing this quotient. Others methods are proposed in the literature, in
particular the methods of Dean and Hill, detailed below.
Several arguments have been proposed in the literature which imply that Webster is
better than the others from a normative point of view. Firstly, an Alabama paradox cannot
appear when using this method. An Alabama paradox occurs when a State gets less seats
when the total number of seats increases. Secondly, the apportionment with the Webster
method is such that the number of seats for each State is near the quota (the quota of the
State is equal to the population of this State divided by the whole population, multiplied
by the total number of seats). Thirdly, we can show that the Webster method does not
systematically advantage the smallest States or the largest ones: there is no bias. Despite
clear normative qualities, the method of Webster was only used to constitute the House
of the Representatives in 1840, and from 1910 to 1930. In this paper, only the five most
famous divisor methods are analyzed: the methods of Adams, Dean, Hill, Webster and
Jefferson. The other famous method of Hamilton, or method of largest remainders, is
not studied because it admits the possibility of an Alabama paradox. This constitutes a
sufficient normative failure to reject it directly.
The main question of this paper is the following: which method of apportionment permits
the best balance between a State’s population and its voting power? This question seems
to be of crucial importance, since to get 10% of the Representatives does not mean that
you get 10% of the power. In our opinion, we have to consider the power of a State and
not its relative weight.
An essential problem is then to define power and to measure it. An interesting tool is
given by cooperative game theory. Indeed, an important field in cooperative game theory
deals with the notion of power, this is known as the theory of power indices. The literature
4

about power indices is abundant and we can not summarize it in this paper. An elegant
presentation is given in Felsenthal and Machover (1998) and Laruelle (1998), among others.
For theoretical reasons (developed below), we only use the power index introduced by
Banzhaf (1965). The power of a player is the probability that he should be a pivotal player,
that is to say a player such that when he belongs to a winning coalition (a group of players),
the coalition wins, otherwise the coalition loses. Consider the following simple example: in a
game such that a coalition wins if and only if it contains at least 6 players (and we suppose
that a player has only one vote), if we consider a coalition with 7 players, there is no pivotal
player. Indeed, if an individual leaves the coalition, it is again a winning coalition (with 6
members). However, in a coalition of 6 players, every player is pivotal since the coalition
loses when one player leaves the coalition.
A good balance between population and power implies that each individual gets the
same power. In other words, every individual should have the same probability of being
pivotal in their State and the State is pivotal in the whole country. Obviously, all the
individuals in a State have the same power but the States have different power since the
number of Representatives may be different for two States. The choice of the power index
is based on a probabilistic hypothesis that we impose on individual behavior, or on State
behavior.
Unfortunately, there are technical difficulties when we compare population and power.
Indeed, we have to use a notion of distance between two vectors. There exists an infinity
of possible distances, the most famous being the euclidian distance, or standard deviation,
which is particularly studied in this paper. All the Lk − norm, k ∈]0,∞[, are analyzedin this paper which is more general than the literature. Obviously, the results depend on
the choice of k. One purpose of the paper is to determine which method of apportionment
minimizes the distance between the population vector and the power vector.
An immediate question arises: why do not determine directly the apportionment which
minimizes such a distance, without using a method of apportionment? This approach, for
instance used by Leech (2002), and has not been examined in the literature from a normative
point of view. Furthermore, we show, in this paper, that such a method can produce an
Alabama paradox. This weakness is certainly a sufficient condition to exclude this method
as we do for the method of Hamilton.
In the second section, we present the tools used in this paper: the methods of apportion-
5

ment, the power indices and we explain why we only use the Banzhaf power index. In the
third section, for each of the 22 U.S. censuses, we calculate which method of apportionment
permits the best balance of population-power, in the classical majority case. The ranking
of the methods is also computed. For instance, we show that the method which has a bias
in favor of the largest States (Jefferson) is always ranked last. In section 4, we extend the
results analyzed in sections 2 and 3 to the other cases than the majority. Clearly, the choice
of the α − majority3 may influence the ranking of the methods. The main idea is thefollowing: the best method in a normative point of view is the one proposed by Webster.
But sections 2 and 3 underline that this method is not ranked first in general when the
majority game is considered. Hence, maybe there exists an α such that the method of Web-
ster is ranked first. Since α is not fixed, studying all the distances would be too tedious.
Hence, we focus on the standard euclidian distance. However, other distances are tested
briefly. In theses three sections, we focus our analysis on the House of Representatives, as
it corresponds to the proportional part of the apportionment (the other part corresponds
to the fixed number of 2 senators, whatever the State). Then, in section 5, we take into
account all the Electors and not only the ones obtained with the proportional part. This
implies a modification of all our results since an important weight is given, proportionally,
to the smallest States. In section 6, the direct distribution of seats by just minimizing a
distance between two vectors (population and power) is analyzed. We show that this ap-
proach admits the possibility of an Alabama paradox and so is not relevant, which justifies
our approach. Section 7 concludes.
2 Tools and methodology
Two concepts, rarely studied together, are briefly presented here: the theory of appor-
tionment and the power indices theory. The purpose of the theory of apportionment is to
distribute a fixed number of seats to several States proportionally to their population. From
a mathematical point of view, the main problem in this theory comes from the manipula-
tion of integer numbers, since a seat cannot be divided. The objective is clearly different
in the power indices theory. The goal is to measure the probability of an individual (or a
State) being a pivotal player in a coalition. Indeed, this is the metric used to measure the
3In the power indices literature, α is called the quota, that is the part of the total number of seats a
coalition must contain to be winning, but this vocabulary is used too in apportionment theory.
6

power with power indices. Our approach consist in minimizing, for a State, the difference
between its population and its power. For instance, if a State represents 25% of the whole
population, the apportionment should be such that it owns about 25% of power. The link
between population and power is not common in the literature: exceptions are Leech (2002),
Barthelemy, Martin and Merlin (2007) or Barthelemy and Martin (2007).
2.1 Apportionment
2.1.1 Preliminaries
This section comes from the very nice short presentation of apportionment by Balinski and
Young (1985). An apportionment method is given by a vector of population p = (p1, ..., pn)
of n States and a total number of seats a > 0, which has to distributed among these n
States. A vector a = (a1, ..., an) is an apportionment of a, with ai a positive integer. For
example, in 2000, there were a = 435 seats in the House of Representatives to be distributed
among n = 50 States. Moreover, constraints can be imposed on the apportionment. For
instance, every U.S. State has at least one seat.
The quota for State i is the part of its population relative to whole population, multiplied
by the total number of seats. Let qi the quota, with qi =pinj=1 pj
× a.For example, if a State has a population equal to 100 000 citizens in a country with
1 000 000 citizens, a number of seats equal to 100 implies a quota of 10, for this State.
However, in general, the quota is not an integer (suppose that the number of seats is equal
to 101 in our example) while the number of seats for a State has to be an integer. This
difficulty lies at the heart of the theory of apportionment.
2.1.2 The main methods of apportionment
Apportionment is of crucial importance since it plays an important role in the U.S. presiden-
tial election. There have been many debates since the 1787’s U.S Constitution and several
methods have been proposed, not by scientists, but by famous American politicians. We
do not develop here an historical presentation of the theory of apportionment, as this pre-
sentation is already made in the Balinski and Young monograph (2001). Only the methods
used in U.S. presidential elections are described in this section.
7

The method of Hamilton
The apportionment is made easily: compute the quota and give to each State its integer
part. Give any seat unapportioned to the States with the largest remainder. This method is
not really considered in this paper because of its normative weakness. However, it was used
in U.S. from 1850 to 1900, and so is important from a historical perspective. The method
proposed by Hamilton in 1792 seems to be natural and simple, but it is not the first method
proposed in U.S. Instead of considering the quota approach, as in the remainders methods,
the number of citizens for one seat was first considered which corresponds to the divisor
methods.
The divisor methods
Five of them are studied here (the most famous), the methods of Jefferson, Adams,
Webster, Hill and Dean.
The vector a is a Jefferson apportionment, if and only if
∀i = 1, . . . , n, ai =pix
with x a divisor such that ni=1 ai = a and y the integer part of y. In other words, once
a is fixed, we have to determine the divisor x such that the sum of the integer parts of
the rates population/power is equal to a. For instance, if pi/x = 3.22, then the States i
gets 3 seats. This method was used from 1790 to 1830 for the U.S. House of Representatives.
The vector a is an Adams apportionment, if and only if
∀i, . . . , n, ai =pix
with x a divisor such that ni=1 ai = a and y the smallest integer greater than or equal
to y. The construction of the method of Adams is identical to the one of Jefferson, the only
difference being the way of rounding an integer. For example, if pi/x = 4.28, then the State
i gets 5 seats while it would have get 4 seats with the method of Jefferson.
The vector a is a Webster apportionment, if and only if
∀i, . . . , n, ai = [pix]
8

with x a divisor such that ni=1 ai = a and [y] the nearest integer from y. For example,
if y = 0.51, then [y] = 1 and if y = 3.45, then [y] = 3. In the particular case where y
is an integer plus 0.5, there are two solutions. Thus if y = 8.5, then [y] = 8 or [y] = 9.
This method was used for the House of Representatives in 1840, 1910 and 19304. Let us
remark that between two successive integers, the value which changes the rounding is the
arithmetic mean:
∀y ∈ [n, n+ 1] , [y] = n, if y (n+ (n+ 1))/2
[y] = n+ 1, if y (n+ (n+ 1))/2
The two last methods, proposed by Dean and Hill, are similar to the method of Webster.
The difference comes from the way of computing the mean. Instead of using the arithmetic
mean, we use the harmonic mean for the method of Dean (the harmonic mean for 2 and 3
is equal to 2.4), and the geometric mean for the method of Hill (the geometric mean for 2
and 3 is equal to 2.45). The method of Hill has been used for the House of Representatives
since 1940.
Even if there are other methods proposed in the literature (with or without divisor),
there are not considered in this paper because they are too weak in a normative point of
view.
Remark that for the five divisor methods we have presented, the rounding depends on a
particular value between two successive integers as illustrated in table 1 where y corresponds
to rounded value of y5.
Table 1. Rounding with divisor methods
y = n if
Adams n− 1 < y n
Dean n < y 2/(n−1 + (n+ 1)−1)
Hill n < y (n× (n+ 1))0.5Webster n < y (n+ (n+ 1))/2
Jefferson n y < n+ 1
4Note that in 1920, there are two new States, two new seats but no new apportionment. The lack of
apportionment violates Constitution.5Theoretically, when the value of y corresponds to the arithmetic, geometric or harmonic mean, two
rounded values are possible, n and n+ 1. These cases are not mentioned here.
9

As n < 2/(n−1+ (n+1)−1) < (n× (n+1))0.5 < [n+ (n+1)]/2 < n+1, these methodscan be ranked on a left-right axis according to their particular value which determines the
rounding. The ranking is therefore Adams, Dean, Hill, Webster and Jefferson.
Comparison of the methods
Since the methods are different by construction, they do not satisfy the same proper-
ties. Hence, a normative approach is useful in order to compare them. Even if we do not
enumerate all the possible properties in this presentation (see Balinski and Young, 2001, for
more details), we present the main reasons that show that the method of Webster is said
to be better than the others.
Firstly, there does not exist a divisor method such that a State receives less seats than
the integer part of its quota and, at the same time, another State receives more seats than
the integer greater than its quota. For example, suppose that the quota of State i is 3.45
and the quota of State j is 8.25. It is not possible that State i receives 2 seats and State
j 10 seats. However, State i can receive 2 seats and not automatically 3 or 4 seats. We
say that this method does not satisfy the property called “staying with the quota”. There
is no divisor method which stays with the quota for every problem of apportionment. The
probability that Webster violates this property is negligible. Furthermore, the method of
Webster is the only divisor method which respects the property of being “near the quota”.
This property says that if a State gives one seat to another State, it is not possible that the
number of seats of these two States brings them nearer the quota.
The method of Hamilton satisfies the property “staying with the quota”, by construction.
Nevertheless, this method is not monotone when we consider an increase in the number of
seats. It seems to be legitimate that a State does not lose a seat when the total number
of seats increases (with constant population). The Alabama paradox shows that several
methods violate this principle, in particular the method of Hamilton. The 1880’s census,
with 299 seats, gives 8 seats to Alabama and 7 if the number of seats is 3006. With a divisor
method, this kind of problem can not occur.
Because of the Alabama paradox, we have to abandon Hamilton’s method. However,
we still have to choose a method among the divisor methods. An argument for the method
of Webster is that it is the only method “near the quota”. Another important property
6An elegant geometric presentation of Alabama paradox, among other paradoxes, is given by Bradberry
(1992).
10

satisfied by the method of Webster concerns a possible bias. It is certainly a negative
characteristic if a method has a persistent bias in favor either the small States or the large
States. There are several ways of measuring this bias, an absolute one (does a State receive
always more seats than its quota?) and a relative one (does a State receive always more seats
for one citizen than another State?). The only divisor method without bias is the method
of Webster. This is a theoretical and an empirical result: it is a fundamental property of
the Webster method.
2.2 Voting games and power indices theory
2.2.1 Voting games
Generally, the power in cooperative game theory is studied through voting games. A voting
game is a pair (N,W ) where N is the set of players (with |N | = n , where |A| means thenumber of elements in the set A) and W the set of winning coalitions, which is the set of
groups of players which can enforce their decision. In this paper, the players are the States.
Let a the number of seats and ai the number of seats of the State i. Thus we have
a = ni=1 ai. An α −majority game is [α; a1, ..., an], where α is an integer greater than
a/2. A winning coalition S (written S ∈W ) is a group of States such that
S ∈W ⇐⇒i∈S
ai α
The most famous voting game is the majority game, which perfectly corresponds to U.S.
presidential election, where α = a2 + 1 if a is even and α = a+1
2 if a is odd. Sometimes,
it is easier to consider α in proportion (for example 50% in the majority case) and this is
denoted α, with α = α/a.
2.2.2 Power indices theory
We present here the two most famous power indices in the literature, because of their
normative qualities and their historical importance. The construction of the two power
indices we present here is quite different but there is, in the two cases, a particular player
called the pivotal player which has a crucial role. Our presentation is concise but a complete
and clear description is given in Felsenthal and Machover (1998), in Laruelle (1998), or in
Straffin (1994) among others.
11

The Shapley-Shubik power index (1954) takes into account the formation of the coalition
N which contains all the players. The order of appearance in this coalition is important.
Assume that the player 1 belongs first to the coalition N . If a1 α, then this player is
pivotal. Otherwise, assume that player 2 joins the player 1 in the coalition N . If a1+a2 α,
then player 2 is pivotal, otherwise assume that the player 3 joins them in the coalitionN , and
so on. Since an empty set is not a winning coalition, while N is always a winning coalition,
there exists a pivotal player according to the chosen order of appearance in N . Obviously,
there is no reason to only consider one order of appearance: all orders are supposed to have
the same probability of occurring. The Shapley-Shubik power index of player i is then the
number of times it is pivotal divided by the number of possible orders of appearance in N ,
which is n!. Formally the Shapley-Shubik of player i is
φi =number of orders with i pivotal
n!
and we obtain
φi =S⊆N
(s− 1)!(n− s)!n!
[v(S)− v(S\{i})]
with s the number of players in S and v(S) = 1 if S is a winning coalition and v(S) = 0
otherwise. Remark that [v(S)− v(S\{i})] is different from 0 only if the player i is pivotal
in S.
Banzhaf (1965) proposes another power index where order in N is not important. Its
manipulation then becomes easier. Firstly, one has to determine all 2n−1 possible coalitions(non empty) and the number of times player i is pivotal. If this number is divided by 2n−1
(that is the number of coalitions containing the player i), we obtain the non-normalized
Banzhaf power index and if it is divided by the total numbers of pivotal players, we obtain
the normalized Banzhaf power index. The formula of the normalized Banzhaf power index
for the player i is
βi =number of times i is pivotal
total number of pivotal players
or
βi =S⊆N [v(S)− v(S\{i})]
j∈N S⊆N [v(S)− v(S\{j})]
12

2.2.3 Why do we use Shapley-Shubik and Banzhaf power indices?
The power of a player (a State, a citizen), can be interpreted as the probability he is pivotal,
a priori. The Banzhaf index corresponds to a probabilistic hypothesis called independence:
every player votes a priori for a candidate A or for a candidate B, independently of the
choices of the other players with a probability equals to 1/2. This hypothesis is a perfect
representation of electoral situations with floating voters, where the probability of tight
results is high (the higher the number of players, higher this probability, which is an appli-
cation of the central-limit theorem).
From a probabilistic point of view, the Shapley-Shubik index corresponds to an hypoth-
esis called homogeneity: instead of voting for A or B with a probability 1/2, the players
choose randomly a probability pi to vote for A in a uniform law in [0, 1]. In other words,
if pi = 0.8 is chosen, we obtain a clear result in favor of A or B. This situation is really
different from the repartition 50% in favor of A and 50% in favor of B mentioned previously
with the independence hypothesis. However, on average, there is no favored candidate. For
a clear application of the probabilistic presentation of power indices, see Straffin (1977) or
Berg (1999). As in this paper we measure the balance population-power with distances, we
have to present and clarify a theoretical point.
The power of a citizen must be distinguished from the power of a State. The citizens
and the States belong to different voting games which imply different pivotal players. A
first voting game, the Electors election, is defined at the level of the States. For a given
State, a citizen may be a pivotal player, all the players being the citizens of this State.
A second voting game corresponds to the vote for the president where the players are the
different States. In this game, a State may be a pivotal player, as defined previously. The
power of a citizen is the probability to be a pivotal player in his State multiplied by the
probability that the State he belongs to, is a pivotal player in the presidential election. The
choice of the index, for the citizens and for the States is obviously important.
Looking for the best balance population-power is similar to level out the power of every
citizen in the country wherever he lives. In other words, in a two-step game (election in the
State followed by a national election), every citizen should have the same probability to be
a pivotal player.
Theoretical results about States behavior are presented in the table 2 (B corresponds to
the Banzhaf non-normalized index while B corresponds to the Banzhaf normalized index).
13

Table 2. Theoretical results
Hypothesis on vote Hypothesis on vote Theoretical
of the citizens of the States recommendation
(index used) (index used)
Independence (B’) Independence (B’,B) Square root
Homogeneity (SS) Independence (B’,B) Proportionality
No model Homogeneity (SS) Unknown
When citizen behavior is represented by the independence hypothesis, Penrose (1946,
1952) proposes an apportionment. He shows that the power of a citizen, measured by
the non-normalized Banzhaf index, is proportional to the inverse of the square root of the
population of his State. As each State has a 1/2 probability to vote for A or B, its behavior
corresponds to the independence hypothesis. In other words, in this situation, the State’s
power is measured by the Banzhaf index. Of course, in this election, its power depends on
its weight ai. If the number of players is large enough and if their weights are allocated
randomly without the domination of one player (to avoid the existence of a too important
weight), Penrose observes that, by applying the law of large numbers, the Banzhaf power
index of this player is proportional to the number of seats he has7. Consequently, the
citizens power is the same in every State with an apportionment proportional to the square
root of the population, this result is the well-known Penrose square root law.
This law is often mentioned in the literature but recent research shows that the inde-
pendence hypothesis is not satisfied from an empirical point of view. In particular when it
is confronted to the electoral results over a long time period (see Gelman, Katz and Tuer-
linckx, 2002, for U.S. elections —(president, senators and governors) — since the 50’s). In
our opinion, this research permits to reject this law in our context.
If we admit that citizens vote according to the homogeneity hypothesis, then the appor-
tionment can be made with a proportional method instead of using the Penrose law. In this
case, the power of a citizen in a State is measured by the Shapley-Shubik index and it is
inversely proportional to the State population. Since the State’s behavior comes from inde-
pendence hypothesis, a proportional apportionment is reasonable from a theoretical point of
view. This model (independence of the votes for the States and homogeneity in the States)
is the more adapted to support theoretically the application of a proportional method and
7For a recent, clear and sharp presentation, see Gelman, Katz and Tuerlinckx, (2002), and Gelman, Katz
and Bafumi (2004).
14

thus an apportionment with a divisor method. We have then to use the Banzhaf index
when we compute the power of the States.
3 Apportionment in U.S. since 1790
In this section, we determine which divisor method of apportionment minimizes the distance
population-power when considering the 22 U.S. censuses from 1790 to 2000. The appor-
tionments and the populations can be found in Balinski and Young (2001). To measure the
differences between population and power, different distances can be used. Our goal is to
minimize
dk(x, y) =n
i=1
|xi − yi|k1k
, x ∈ Rn et y ∈ Rn
where x is the population vector and y the power vector. Note that we consider the Lk −norm, k ∈]0,+∞[, k = 2 corresponds to the well-known standard deviation and k = 1 tothe difference in absolute values. Of course, others distances exist but are rarely used in
the literature. Clearly our results depend on this choice, but the choice of k may be made
answering to the following question: do we want to impose an important weight to the
largest differences or not? If k tends to 0, it means that we impose a very important weight
to the possible equalities between population and power for a State, even if there exists some
large differences between the others. If k tends to infinity, an important weight is given to
the largest differences. In this point of view, k = 2 seems to be a good compromise. To
the best of our knowledge, there does not exist an axiomatic approach about the choice
of the distances, and k = 2 is often taken account for geometric reasons. Our results are
summarized in table 38.
This table may be interpreted as follows: in 1790, for any value of k between 0 and
2.125, the smallest distance is given by the methods of Adams, Dean and Hill (for these
three methods, the apportionment is the same in 1790). We obtain a different result with
k greater than or equal to 2.125. Indeed, for k > 2.125, the method of Webster gives the
smallest distance. In the same spirit, in 1830, the distance is minimal for k 1.5 with the
8As there is an infinity of distances, they can not be all analyzed. We use the following sequence with
a 0.125 step, k = {0.125, 0.250, . . . , 4}. Let us notice that higher values were analyzed to identify the
robustness of the results when k tends to infinity. The degree of precision could certainly be improved and
then the bound proposed in table 3 could be more precise.
15

Table 3. Values of k for which a method permits the best balance between population and power
Years Adams Dean Hill Webster Jefferson
1790 ]0;2.125] ]0;2.125] ]0;2.125] ]2.125;∞[1800 ]0;∞[1810 ]0;∞[1820 ]0.25;∞[ ]0;0.25]
1830 ]1.5;∞[ ]0;1.5]
1840 ]1.25;∞[ ]0;1.25] ]0;1.25] ]0;1.25]
1850 ]0.875;∞[ ]0;0.875] ]0;0.875]
1860 ]0.625;∞[ ]0;0.625]
1870 [0.75;∞[ ]0;0.75]
1880 ]1;∞[ ]0;1] ]0;1] ]0;1]
1890 ]2.25;∞[ ]0;2.25] ]0;2.25] ]0;2.25]
1900 ]1.75;∞[ ]0;1.75]
1910 ]0;∞[1920 ]1;∞[ ]0.75;1] ]0.75;1] ]0;0.75]
1930 ]1.125;∞[ ]0;1.125] ]0;1.125]
1940 ]1.25;∞[ ]0;1.25]
1950 ]1.5;∞[ ]0;1.5] ]0;1.5]
1960 ]1.875;∞[ ]0;1.875]
1970 ]2.25;∞[ ]0;2.25]
1980 ]1.75;∞[ ]0;1.75]
1990 ]1.5;∞[ ]0;1.5]
2000 ]1.25;∞[ ]0.5;1.25] ]0;0.5] ]0;0.5]
method of Dean. For a largest value of k, Adams always minimizes the distance.
If we consider the most important distance in the literature, k = 2, Adams is, in general,
the method which minimizes the difference between population and power. This remark
does not hold for the years 1890 and 1970.
In our exercise, the method of Adams seems to play an important role and not only
for the quadratic distance (k = 2). We can give an intuition to this result. This method
has a systematic bias in favor of the smallest States while the method of Jefferson has a
bias in favor of the largest States. With the method of Adams, the rounding is upward.
Hence, the smallest States receive relatively more seats with the rounding than the largest
States. This is the contrary to the method of Jefferson. Furthermore, in a majority game,
16

the Banzhaf index has a bias in favor of the largest States. This result is intuitive and even
if there does not exist a proof, in our knowledge, several studies show it. The first intuition
is given by Straffin (1994), in two examples and footnotes (pp 1133-1134). A confirmation
is given, for example, by Felsenthal and Machover (2001) or by Feix, Lepelley, Merlin and
Rouet (2007) for the European Union. Hence, the combination of the method of Adams
with the Banzhaf index tends to vanish this bias. This explains the good results obtained
with the method of Adams at least for a value of k sufficiently large. For the method of
Jefferson, its bias in favor of the largest States added to the bias of Banzhaf index, implies
that it never gives the best balance population-power. In the following section, we show
that this result does not hold for other voting games when we change α.
We present now the ranking of the methods in term of balance population-power which
will give a complementary piece of information. Indeed, if the method of Jefferson never
gives us the best adequacy, it maybe ranked second or third. Furthermore, if the method of
Webster, certainly the best method in a normative point of view, would be always ranked
last, it should be a clear argument against it. Not all the results will be reported here9. The
first important remark is that the method of Jefferson is almost always ranked last, except
in 1800 for k 3.25 and in 1960 for k 0.375. This is coherent in view of the intuition
described above.
For the other methods of apportionment, there is no remarkable trend, even if the
method of Webster is often ranked just behind the method of Adams. For the particular
case k = 2, the method of Webster is ranked 13 times first or second (there are 22 censuses):
it is clearly an argument in favor of this method.
Remark that the ranking is not monotone with k. For instance, in 1950, the method of
Webster is ranked third for k 1.375, fourth for k 2.5 and second for k 2.625. Other
similar cases exist, for example for the method of Dean in 1820, 1920 and 2000, for the
method of Hill in 1920 and again for the method of Webster in 1820 and 1870.
More intuitively, when ranking the methods in a natural left-right x axis (the order is
then Adams, Dean, Hill, Webster Jefferson), and if the y axis represents the ranking in
term of balance population-power, we may represent graphically the ranking. For instance,
figure 1 corresponds to k = 2 in 1820.
We obverse that the ranking is not single-peaked10. For k = 2, this phenomenon arises
9Results can be found in the file http:/www.u-cergy.fr/barthelemy/balanceUSCensus.pdf.10We use deliberately the same graph and the same vocabulary as Black (1958) in its description of single-
17

3
1
2
4
5
Adams Dean Hill Webster Jefferson
Figure 1. Non monotonicity of ranking
frequently (from 1850 to 70, in 1900, 1930, 1940, from 1960 to 1990).
4 The importance of α
It seems natural to use the majority rule in the U.S. presidential election since there are
only 2 main candidates, a Republican and a Democrat. However, if we admit that the
balance population-power is an important normative criterion, as the problem of bias or
the Alabama paradox, the following question occurs: is it really judicious to use the method
of Hill for the U.S. House of Representative? The Balinski and Young’s results clearly show
that Hill is not the best method and this reinforced by introducing the criteria of balance
population-power. We have shown above that the method of Adams often minimizes the
difference between population and power in majority games, but its systematic bias in favor
of the smallest States is an obvious weakness. Our purpose is now to show that if we change
α, the ranking of the methods, in term of distance, changes.
In the previous section, we study a great number of distances with a given α. Since α is
not fixed now, we have to specify a value for k, otherwise the number of possibilities would
become too large. With respect to the literature, the euclidian distance is considered (k =
preferences. Obviously, the connection of the points has no mathematical sense, the goal is only pedagogical,
even if the method can be ordered according to the way of rounding as seen previously.
18

2). Nevertheless, as this choice is arbitrary, some results with others values of k are studied.
Only one graph is presented here, the one corresponding to 182011: the apportionment is
different for the 5 methods, which is not the case in general.
Figure 2 is read as follows: the x axis corresponds to α in proportion (α = α/a) and the
y axis corresponds to the ranking, from 1 to 5.
Figure 2. Ranking of the methods according to α for year 1790
The results underline the fact that there always exists a α such that the method of
Jefferson minimizes the standard deviation. This α is between 0.63 and 0.67. In other
words, when α is about 65% or more, the method which admits a systematic bias in favor
of the largest States permits the best balance population-power. In the same spirit, in every
census, an α exists, around 60%, such that the method of Webster minimizes the standard
deviation. Thus, there exists a α such that the best method in a normative point of view
minimizes the standard deviation. This result is consistent with recent empirical studies. In
the previous section, we saw that empirical studies show a bias in favor of the largest States
when we use the Banzhaf power index in a majority game. In the same way, the intuition
11All the results can be consulted in the file cited above.
19

suggests that there exists α such that the Banzhaf power index has a bias in favor of the
smallest States and then, there exists α for which the Banzhaf index has no bias, and this
value is between 60 and 65%12. It is thus coherent that the best balance population-power
should be obtained with the method of Webster. When α increases, the Banzhaf index is
in favor of the smallest States. As the method of Jefferson balances this bias, we logically
find this method minimizes the distance between population and power.
Notice that there are some censuses for which the methods of Dean and Hill never
minimize the euclidian distance. For example, this is the case in 1960, a period when the
method of Hill has been used! Obviously, there always exists an α for which all the methods
minimizes the distance. Indeed, if α tends to 1, only one winning coalition arises (the great
coalition N), for which every State is pivotal. Then the power of the States does not depend
on the apportionment.
When k = 2, a general trend can be described even if strange situations may be observed.
The general trend maybe illustrated for instance in 1790, as represented in figure 3. As
α increases, the best method that minimizes the euclidian distance changes as follows,
Webster, then Adams, then Webster and so on: there is a particular sequence.
We present now briefly other results13, when the distance is different from the traditional
euclidian one. Two small values of k are studied, k = 0.25 and k = 1 (the latter being as
well quite used in the literature), and two large ones, k = 4 and k = 8.
When k = 0.25, the instability of the results is evident. There are a lot of variations
in the ranking and the curves are not as regular as seen for the euclidian distance case.
However, there always exists an α such that the method of Webster minimizes the distance.
Moreover, for all the quotas greater than this particular value, the method of Jefferson
minimizes the distance. When k = 1, the results are the same even if the curves look more
regular.
The results for k = 4 and k = 8, are similar to the results for k = 2. In this point of
view, considering k = 2 seems to be a relevant choice. The weight imposed to the large
differences is sufficient (since the results are almost identical with higher values of k) and
the curves are regular (there is a general simple trend).
12See Feix, Lepelley, Merlin and Rouet (2007).13As mentioned previously, see the file http:/www.u-cergy.fr/barthelemy/balanceUSCensus.pdf.
20

Figure 3. Ranking of the methods according to α for year 1820
5 The Electors
In this section, all the Electors are considered and not only the ones corresponding to the
House of Representatives, which are determined by a method of proportionality. We have
to add two seats to every State to the apportionments given by Balinski and Young (2001).
Furthermore, we have to add the District of Columbia and its 3 seats. Indeed, since 1961,
this new State has 3 Electors and this number does not depend on its population14.
Adding these non proportional seats is not neutral. In this situation, the smallest States
are overweight since their number of seats increases more in proportion. For instance, in
2000, adding 2 seats to Alaska corresponds to an increase of 200%, while the same two
seats corresponds to an increase of 3.8% for California. Thus, only the bias in favor of
the largest States induced by the method of Jefferson can balance the excess weight of the
smallest States. For 0.5 < α < 0.6, the method of Jefferson minimizes all the distances.
When increasing α, for instance α = 0.8, it is almost always the method of Jefferson which
14Note that Balinski and Young (2001) only consider the House of Representatives and thus do not give
the population of the District of Columbia. We then consider the population given on the official census
website http://www.census.gov/prod/www/abs/decennial/.
21

minimizes the distance (except for exceptional cases, when k is slightly less than 1, for which
the methods of Adams or of Webster minimize the distance. In other words, the bias in
favor of the smallest States implied by the two non proportional seats is only balanced by
the method of Jefferson, even if α is small (1/2). When adding only one seat to every State,
the results remain nearly the same, although the predominance of the method of Jefferson
is not so evident15. In other words, adding some seats to the proportional apportionment
change drastically the results. Obviously, this is particularly true in some situations where
the populations are really different.
6 Why do we use a method of apportionment?
In this paper, we have shown which are the best classical methods of apportionment in order
to minimize the difference between population and power. A natural question arises: why
do we use such a classical method of apportionment? Indeed, the optimal apportionment
could be determined directly such that the distance population-power would be minimal. If
we agree that this criteria of minimal distance is essential from a normative point of view,
like the Alabama paradox or the bias, then an apportionment is possible without using a
classical method as in the manner of Leech (2002).
We assume that the power vector should be equal to the population vector p. We
associate a power vector, denoted bz(a) = (bz1(a), ..., bzn(a)) to each apportionment a ∈Rn. We look for a∗, which minimizes a distance between p and bz(a∗). Like Leech (2002),
we consider the euclidian distance (k = 2). Thus we have:
a∗ = argminan
i=1
bz(a)i − pi2
Leech (2002), with an iterative procedure (but with real numbers and not with integers),
shows that it is not necessary to know every possible apportionment. The integer case is
studied here, as it corresponds to our empirical data. Is this approach relevant when
considering the normative properties mentioned before? We are going to answer to this
fundamental question using the following example: let a voting game with a = 6 and 3
players16 with populations in proportion equal to p = (0.46, 0.33, 0.21).
15See all the results on our web site.16We assume that a1 a2 a3, the populations are ranked in decreasing order, p1 p2 p3.
22

As the ai are integers, all the apportionments can be listed. And, for each one, the
corresponding values of the distances are computed. As shown in table 4, the optimal
apportionment in this case is a1 = a2 = a3 = 2.
Table 4. Apportionment and distance population-power
a1 a1 a3 Distance
6 0 0 0.4446
5 1 0 0.4446
4 2 0 0.4446
4 1 1 0.4446
3 3 0 0.0746
3 2 1 0.0366
2 2 2 0.0313
When we consider 7 seats (details are omitted), two solutions are possible, (3, 2, 2) and
(4, 2, 1), which which lead to the same result. Below, the arrow means that the optimal
solution (2, 2, 2) with 6 seats becomes (3, 2, 2) with 7 seats or (4, 2, 1). The States for which
the number of seats changes are in bold.
• (2, 2, 2) −→ (3, 2, 2)
• (2, 2, 2) −→ (4, 2,1)
When there are 8 seats instead of 7, we obtain again 2 different solutions, (4, 2, 2) et (5, 2, 1).
• (3, 2, 2) −→ (4, 2, 2)
• (4, 2, 1) −→ (4, 2,2)
• (4, 2, 1) −→ (5, 2, 1)
When there are 9 seats instead of 8, the State 1 loses at least 1 seat according to solution
used with 8 seats: (3, 3, 3).
• (4, 2, 2) −→ (3,3,3)
• (5, 2, 1) −→ (3,3,3)
Thus, with this method, an Alabama paradox can arise. Furthermore, the solution is not
necessarily unique. For these reasons, as for the method of Hamilton, this method of ap-
portionment should be rejected. This reinforces the approach we have proposed previously.
23

7 Conclusion
The number of Electors for each State of the U.S. is obtained principally via a proportional
method of apportionment. Since the 1790 census, various methods were used for the ap-
portionment. The purpose of the paper is to determine if one of them permits a better
balance between population and power. From a normative perspective, this criterion seems
important, as important as the bias or the Alabama paradox for instance. A good balance
between population and power means that every citizen in the country has the same power
whatever the State he belongs to, which seems to be a minimal condition of democracy.
Technical difficulties arise. Firstly, we have to measure the power. For that we use
the tools of cooperative game theory, specifically the power indices. We only consider the
Banzhaf index for technical and theoretical reasons. Secondly, since we want to balance
population-power as much as possible, we have to compare two vectors with a notion of
distance. We use the Lk − norm distances with a particular attention to the standard
euclidian distance, which is largely used in the literature.
When considering only the proportional part of the Electors and a majority game, the
method of Adams permits the best balance between population and power. If the different
methods are ranked, the method of Jefferson is almost always ranked last. This result is
intuitive since, for a majority game, Banzhaf has a bias for the largest States. The two
bias are balanced to obtain the best proportionality. If we do not consider only majority
games, the result changes drastically. Around a value of 62% (the majority being 50%), the
Banzhaf index has no bias and is then perfectly compatible with the method of Webster, the
only method of apportionment without bias. This positive result means that there exists α
such that the best method from a normative point of view permits the best balance between
population and power. If α 65%, the method of Jefferson always minimizes the distances.
If we consider all the Electors and not only its proportional part, the weight given to the
smallest States is too high and it could only be balanced using the method of Jefferson.
In this paper, we compare the 5 most famous methods of apportionment from an em-
pirical point of view. A theoretical study seems to be essential. But it is clear that it
will be very difficult to obtain exact results, since the methods of apportionment and the
Banzhaf index are technically awkward to manipulate. A possibility is certainly to obtain
these results with simulations even if it should be difficult to obtain general trend. Indeed,
the number of possibilities is huge: population, α and the number of seats are variables.
24

REFERENCES
Balinski M., Young P. [1985], The apportionment of representation. in: H.P. Young,
ed., Fair Allocation, Proceedings of Symposia in Applied Mathematics 33, Providence,
R.I., p. 1-29.
Balinski M., Young P. [2001], Fair Representation: meeting the ideal of one man, one
vote, Brookings Institution Press, Washington D.C, second edition.
Banzhaf J.F. [1965], “Weighted voting doesn’t work: A mathematical analysis”, Rutgers
Law Review, 19, p. 317− 343.Barthelemy F., Martin M. [2007], “Criteres pour une meilleure repartition des sieges du
Val d’Oise au sein des structures intercommunales: une application au cas du Val d’Oise”,
Revue Economique, 58, p. 399− 426.Barthelemy F., Martin M., Merlin V. [2007], “On the performance of the Shap-
ley Shubik and Banzhaf power indices for the allocations of mandates”, Working Paper,
THEMA.
Berg S. [1999], “On voting power indices and a class of probability distributions: With
Applications to EU Data”, Group Decision and Negotiation , 8, p. 17− 31.Bradberry B.A. [1992], “A geometric view of some apportionment paradoxes”, Mathe-
matics Magazine, 65, p. 3− 17.Black D. [1958], Theory of committees and elections , Cambridge U.K: Cambridge Uni-
versity Press.
Feix M.R., Lepelley D., Merlin V., Rouet J.L. [2007], “On the voting power of
an alliance and the subsequent power of its members”, Social Choice and Welfare, 28, p.
181− 207.Felsenthal D.S., Machover M. [1998], The measurement of voting power: theory and
practice, problems and paradoxes, Edward Elgar Publishers, London.
Felsenthal D.S., Machover M. [2001], “The treaty of Nice and qualified majority
voting”, Social Choice and Welfare, 18, p. 431− 464.Gelman A., Katz J.N., Bafumi J. [2004], “Standard voting power indexes do not work:
an empirical analysis”, British Journal of Political Science, 34, p. 657− 674.Gelman A., Katz J.N., Tuerlinckx F. [2002], “The mathematics and statistics of
voting power”, Statistical Science, 17, p. 420− 435.
25

Laruelle A. [1998], Game theoretical analysis of decision-making processes with applica-
tions to the European Union, PHD thesis, Universite Catholique de Louvain.
Leech D. [2002], “Designing the voting system for the Council of the European Union”,
Public Choice, 113, p. 437− 464.Penrose L.S. [1946], “The elementary statistics of majority voting”, Journal of the Royal
Statistical Society, 109, p. 53− 57.Penrose L.S. [1952], On the objective study of crowd behaviour, London H.K. Lewis.
Shapley L.S., Shubik M. [1954], “A method for evaluating the distribution of power in
a committee system”, American Political Science Review, 48, p. 787− 792.Straffin P.D. [1977], “Homogeneity, independence power indices”, Public Choice, 30, p.
107− 108.Straffin P.D. [1994], “Power and stability in politics”, in Handbook of Game Theory
with Economic Application, Volume 2 (Aumann. R.J and Hart. S, eds), Elsevier Science.
26