Embed Size (px)
Citation preview
ISEM2016, 3rd International Symposium on Environment and Morality, 4-6 November 2016, Alanya – Turkey
*Corresponding author: Address: Faculty of Engineering, Department of Geophysical Engineering Sakarya University, 54187, Sakarya TURKEY. E-mail address: [email protected], Phone: +902642955698
A comparative study on Soil Properties and Applications Review with EERA
and NERA in İstanbul-MARMARAY Project Between Kazlıçeşme to Sirkeci
Günay Beyhana , Ayhan Keskinsezera and Sunay Beyhanb
*aEngineering Faculty,Department of Geophysical Engineering, Sakarya University, Turkey aEngineering Faculty,Department of Geophysical Engineering, Sakarya University, Turkey bEngineering Faculty,Department of Mining Engineering, Dumlupinar University, Turkey
Abstract
Over the course of history Marmara region in North-western Turkey has been the site of numerous
destructive earthquakes. 76 km-long MARMARAY Project is an important project not only for Turkey
but also for the world because it joins the two continents through railway. In this paper, using average
wave velocities in layers, thickness, density and formation data based on the PS logs, 43 m and 65.5 m
depths ranging from 7 different boring logs in a ground-wise different geological regions in Istanbul,
ground response functions were obtained. Based on the soil profiles transferred to EERA and NERA
softwares, the rock soil record of August 17, 1999 Kocaeli earthquake in İstanbul – Beşiktaş Ministry of
Public Works and Settlement (IBMPWS), response and design spectrums that may be considered
crucial in case of an earthquake were obtained. The acceleration record was used as an input motion
having PGA value of 0,04287 g (east-west component) which was applied on sublayers (i.e. sand,
gravel, clay) using EERA and NERA programs. Also nonlinear analysis was compared with the linear
method of analysis. Stages involved in ground response analyses to develop site-specific response
spectra at a soil site are summarized.
Key Words: PS logging, MARMARAY, EERA, NERA, Earthquake Site Response Analysis, Seismic
Excitation.
1. Introduction
Site response analysis is usually the first step of any seismic soil-structure study. Evaluation of ground response is
one of the most crucial problems encountered in geotechnical earthquake analysis. Ground response analyses are
used to predict surface ground motions for development of design response spectra, to evaluate dynamic stresses and
strains for evaluation of liquefaction hazards, and to determine the earthquake-induced forces that can lead to
instability of earth and earth-retaining structures [8]. In this regard first quantitative studies have been conducted
129 www.i-sem.info
G. BEYHAN et al./ ISEM2016 Alanya – Turkey
*Corresponding author: Address: Faculty of Engineering, Department of Geophysical Engineering Sakarya University, 54187, Sakarya TURKEY. E-mail address: [email protected], Phone: +902642955698
using strong-motion data after 1970s. Several methods have been proposed for evaluating site effects by using
ground motion data, such as soil-to-rock spectral ratios [4], a generalized inversion (e.g., [7]; [3], and horizontal-to-
vertical spectral ratios (e.g., [11]; [10]; [5]; [14]; [1]; [2]; [9]. These methods are linear and nonlinear site response
analysis. In order to conduct one-dimensional site response analyses, EERA [1] and NERA [2] softwares are used.
2. The equivalent linear site response analysis (EERA)
The nonlinearity of soil behavior is known very well thus most reasonable approaches to provide reasonable
estimates of site response is very challenging area in geoscience. The theory of approximation of real nonlinear
dynamic soil behavior by equivalent linear approach was proposed firstly by [12].
Figure 1. One-dimensional layered soil deposit system (after [12]).
3. Nonlinear and Hysteretic Model (NERA)
As illustrated in Fig. 2a, [6] proposed to model nonlinear stress-strain curves using a series of n mechanical
elements, having different stiffness ki and sliding resistance Ri. Herafter, their model is referred to as the IM model.
The sliders have increasing resistance (i.e., R1 < R2 < ... < Rn). Initially the residual stresses in all sliders are equal to
zero. During a monotonic loading, slider i yields when the shear stress reaches Ri. After having yielded, slider i
retains a positive residual stress equal to Ri (Fig 2).
130 www.i-sem.info
G. BEYHAN et al./ ISEM2016 Alanya – Turkey
*Corresponding author: Address: Faculty of Engineering, Department of Geophysical Engineering Sakarya University, 54187, Sakarya TURKEY. E-mail address: [email protected], Phone: +902642955698
Figure 2. Backbone curve (left) during loading and hysteretic stress-strain loop (right) of IM model during loading-
unloading cycle [2].
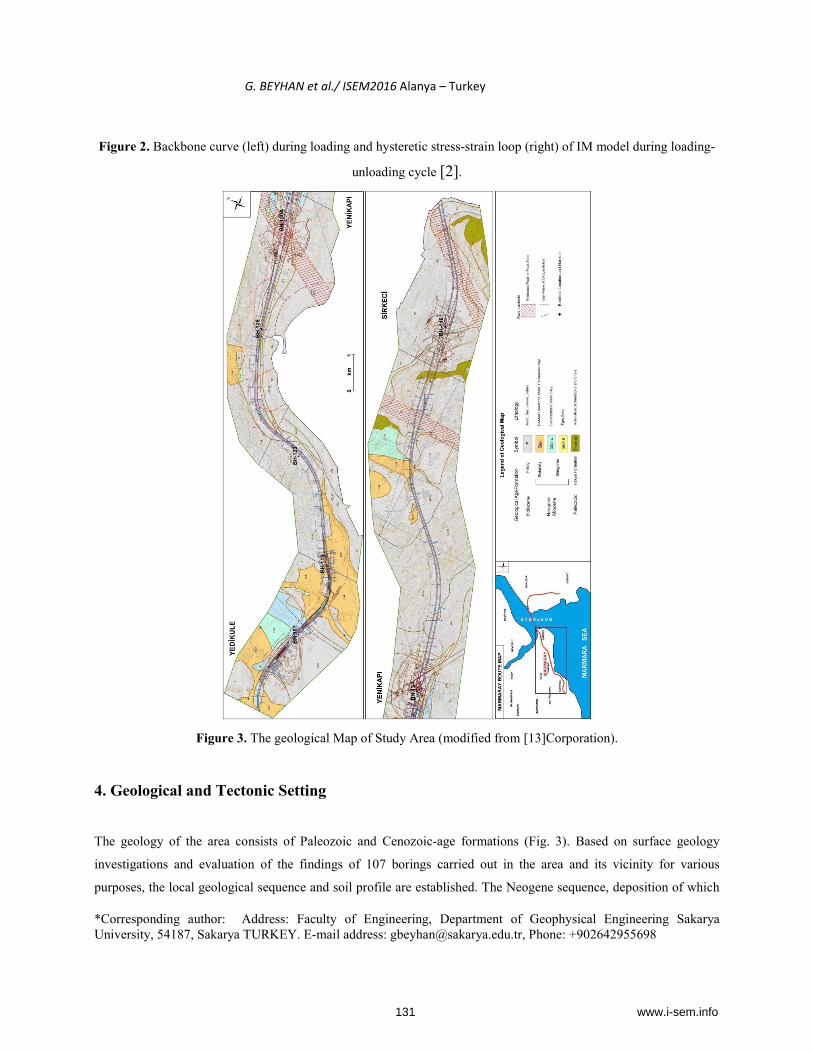
Figure 3. The geological Map of Study Area (modified from [13]Corporation).
4. Geological and Tectonic Setting
The geology of the area consists of Paleozoic and Cenozoic-age formations (Fig. 3). Based on surface geology
investigations and evaluation of the findings of 107 borings carried out in the area and its vicinity for various
purposes, the local geological sequence and soil profile are established. The Neogene sequence, deposition of which
131 www.i-sem.info
G. BEYHAN et al./ ISEM2016 Alanya – Turkey
*Corresponding author: Address: Faculty of Engineering, Department of Geophysical Engineering Sakarya University, 54187, Sakarya TURKEY. E-mail address: [email protected], Phone: +902642955698
started transgressively in Late Oligocene, is composed of from bottom to top, basal gravel and conglomerate,
interbedded green overconsolidated clay and sand, and in the upper zone, due to a lacustrine environment getting
shallower at the end of the Miocene, gray-green sand, organic clay, white/cream marl and fossiliferous limestone
interbedded with clay (Bakırköy fm.) as an uninterrupted sequence. MARMARAY line, from BH-119 borehole to
until BH-130A boreholes are located in Güngören formation also to The Marmara Sea from BH-130A borehole is
located in the Thrace formation. On the fault zone in the Thrace formation is clearly observed the intensity of
tectonic deformation in the region. Accordingly, BH-107, BH-119 and BH-123 boreholes are comprised from sand,
clay and gravel mixtures. BH-126, BH-130-A, BH-134 and BH-146 boreholes after deep the 30 m are composed of
mudstone, claystone and sandstone.
5. The Linear and Nonlinear Site Response Analyses of the Study Area
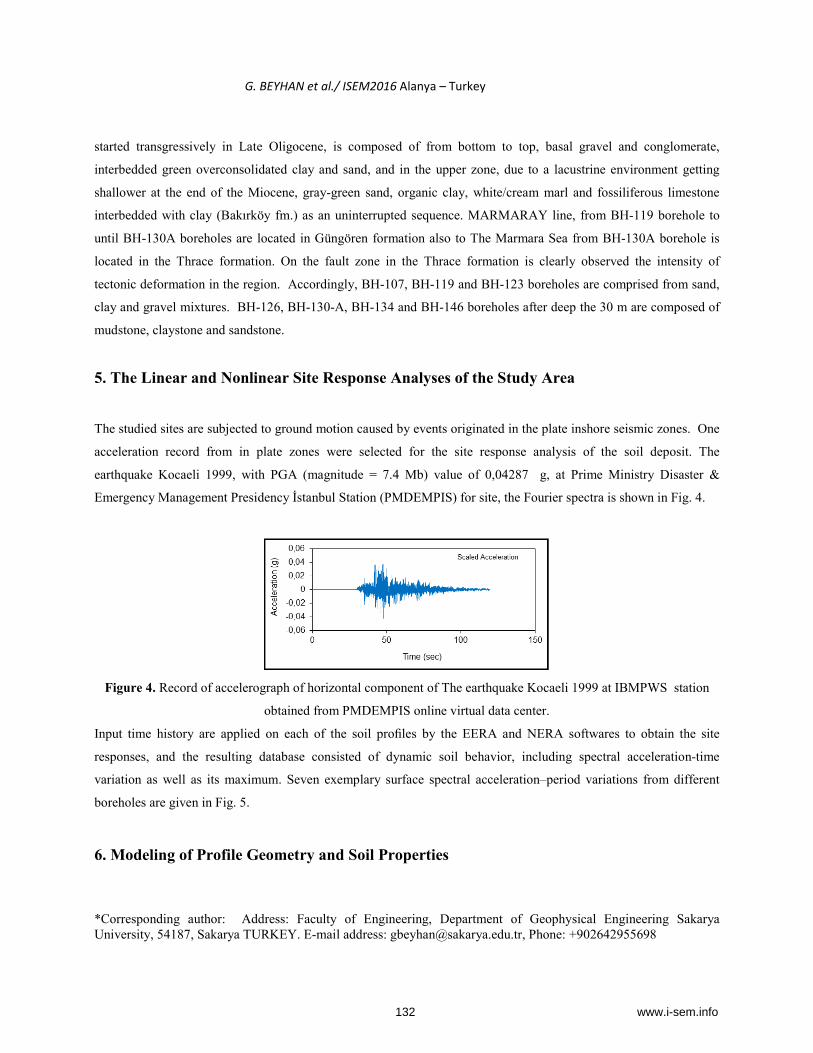
The studied sites are subjected to ground motion caused by events originated in the plate inshore seismic zones. One
acceleration record from in plate zones were selected for the site response analysis of the soil deposit. The
earthquake Kocaeli 1999, with PGA (magnitude = 7.4 Mb) value of 0,04287 g, at Prime Ministry Disaster &
Emergency Management Presidency İstanbul Station (PMDEMPIS) for site, the Fourier spectra is shown in Fig. 4.
Figure 4. Record of accelerograph of horizontal component of The earthquake Kocaeli 1999 at IBMPWS station
obtained from PMDEMPIS online virtual data center.
Input time history are applied on each of the soil profiles by the EERA and NERA softwares to obtain the site
responses, and the resulting database consisted of dynamic soil behavior, including spectral acceleration-time
variation as well as its maximum. Seven exemplary surface spectral acceleration–period variations from different
boreholes are given in Fig. 5.
6. Modeling of Profile Geometry and Soil Properties
132 www.i-sem.info

G. BEYHAN et al./ ISEM2016 Alanya – Turkey
*Corresponding author: Address: Faculty of Engineering, Department of Geophysical Engineering Sakarya University, 54187, Sakarya TURKEY. E-mail address: [email protected], Phone: +902642955698
Generalized soil profiles were established from the borehole drilled at BH-107, BH-119, BH-123 BH-126, BH-
130A, BH-134 and BH-146 boreholes. The wells are located along the MARMARAY line. All boreholes are located
in alluvial soil. Because of the lower shear-wave zone and the lower shear strengths values were measured in
boreholes. EERA and NERA programs obtained change of max shear stress with depth are shown in Fig. 6.
Figure 5. Exemplary surface spectral acceleration–period relationships belonging to various boreholes of the
investigation area and comparison of the earthquake Kocaeli 1999 elastic behavior acceleration spectrums with
Turkish Earthquake Regulation Spectrums.
Accordingly, the max shear stress-depth change in BH-126, BH-130A, BH-134 and BH-146 boreholes are seen in
the range of 25 kPA-50 kPA in EERA method. If the method of NERA, the max shear stress-depth change in BH-
123, BH-126, BH-130A, BH-134 and BH-146 boreholes are seen in the range of 20 kPA-40 kPA. Focusing on Fig.
7, it can be stressed that the alluvial region near The Marmara Sea, soils especially under Kazlıçeşme, Yenikapı and
Zeytinburnu district the lowest shear wave velocities, ranging between 0–100 m/s. The shear wave velocity (VS30)
variation of the soils given in Fig. 7 enlightens the reason of the low strength of the soils in the area, which is
dominancy of these soil classes. Shear wave velocities of upper 65 m are between 194–518 m/s at BH-107, BH-119
and BH-123 boreholes. Shear wave velocities for layers deeper than 20 meters are between 782–2173 m/s at BH-
126, BH-130A, BH-134 and BH-146 boreholes. According to the results of the EERA method solution; The
amplitude ratios (1.3-8 ratio) values of acceleration are seen to be different in boreholes. The amplitude ratios of the
BH-107, BH-119 and BH-123 are low. However, other boreholes, the amplitude ratios are high (3-8 ratio) (Fig.8).
Frequency of maximum amplification (Hz) and maximum amplification values are given in Table-1. Frequency of
maximum amplification (Hz) in BH-123 borehole is high (7.4 Hz), BH-126 borehole is low (2.0 Hz). Similarly,
maximum amplification in BH-130A borehole is high (7.83), BH-119 borehole is low (1.23).
133 www.i-sem.info

G. BEYHAN et al./ ISEM2016 Alanya – Turkey
*Corresponding author: Address: Faculty of Engineering, Department of Geophysical Engineering Sakarya University, 54187, Sakarya TURKEY. E-mail address: [email protected], Phone: +902642955698
Figure 6. Max shear stress variation with depth of the boreholes (Results of the 1D ground response analysis
performed with EERA and NERA)
Figure 7. Gmax- depth and shear stress - depth variation graphics of the boreholes.
According to the results of the NERA method solution; the amplitude ratios (1.4 - 8.5 ratio) values of acceleration
are seen to be different in boreholes. The amplitude ratios of the BH-107, BH-119, BH-130A and BH-134 are low.
However, other boreholes, the amplitude ratios are high (5.5 - 8 ratio) (Fig. 8). Frequency of maximum
134 www.i-sem.info

G. BEYHAN et al./ ISEM2016 Alanya – Turkey
*Corresponding author: Address: Faculty of Engineering, Department of Geophysical Engineering Sakarya University, 54187, Sakarya TURKEY. E-mail address: [email protected], Phone: +902642955698
amplification (Hz) and maximum amplification values are given in Table-1. Frequency of maximum amplification
(Hz) in BH-126 borehole is high (49.7 Hz), BH-126 borehole is low (8.05 Hz).
Figure 8. Amplitude ratio values of acceleration in boreholes (comparative EERA and NERA).
Similarly, maximum amplification in BH-123 borehole is high (36.27), BH-119 borehole is low (2.0). Therefore,
Fig. 9 demonstrates the variation of peak spectral acceleration values in the investigation area. Calculated surface
spectral accelerations in the area ascend to 0.80 g, and the observed lowest value is 0.15 g. with EERA method. If
the method of NERA, calculated surface spectral accelerations in the area ascend to 0.65 g, and the observed lowest
value is 0.16 g. Because, these wells are located in the area of marine sediments.
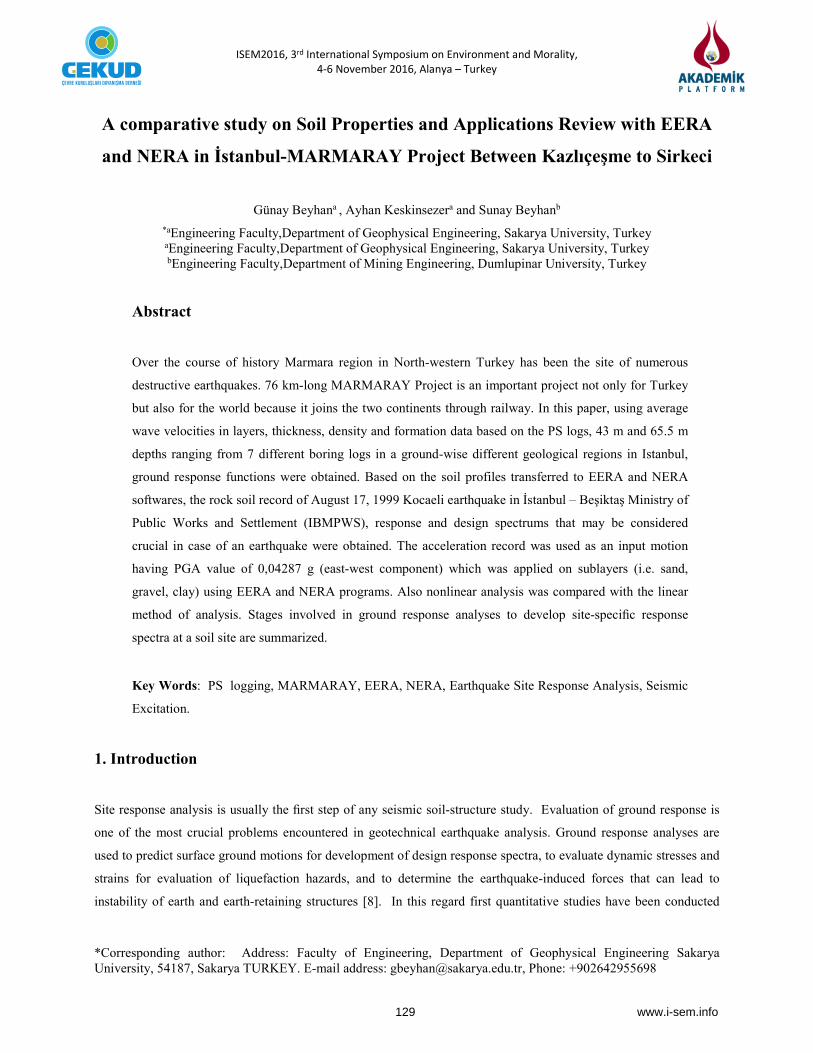
Table 1. Maximum amplification and frequency of maximum amplification (Hz) of boreholes
Boreholes BH-107 BH-119 BH-123 BH-126 BH-130A BH-134 BH-146
E N E N E N E N E N E N E N
Maximum
Amplification
1.58
2.88
1.23
2.00
1.73
36.27
2.87
11.01
7.83
2.96
6.05
2.58
5.16
5.26
Frequency of Maximum Amplification (Hz)
2.8 8.05 2.4 18.92 7.4 48.68 2.0 49.70 2.6 28.62 2.8 17.15 3.8 12.33
135 www.i-sem.info

G. BEYHAN et al./ ISEM2016 Alanya – Turkey
*Corresponding author: Address: Faculty of Engineering, Department of Geophysical Engineering Sakarya University, 54187, Sakarya TURKEY. E-mail address: [email protected], Phone: +902642955698
Analyzing the Table-1, it is seen that majority of BH-130A and BH-134 boreholes are in high acceleration category.
According to the EERA and NERA methods, they are understood that majority of BH-130A, BH-134 and BH-146
boreholes are under high ground shaking risk (Table 2).
Figure 9.Spectral acceleration and Period relationship of the boreholes.
Table 2. Max Period (s) and max spectral acceleration (g) of boreholes
Boreholes BH-107 BH-119 BH-123 BH-126 BH-130A BH-134 BH-146
E N E N E N E N E N E N E N
Max Period (s) 0.21 0.21 0.36 0.37 0.21 0.23 0.21 0.53 0.37 0.37 0.37 0.37 0.23 0.25
Max Spectral acceleration
(g)
0.22 0.24 0.15 0.16 0.21 0.24 0.25 0.22 0.80 0.65 0.66 0.64 0.44 0.45
Conclusions
According to spectral acceleration-period graphics, there is a difference 300 m/s velocity between down layer and
top layer in BH-130A borehole in EERA methods. Similarly, there is a difference 700 m/s velocity between down
layer and top layer in BH-134 borehole, there is a difference 1900 m/s velocity between down layer and top layer
136 www.i-sem.info
G. BEYHAN et al./ ISEM2016 Alanya – Turkey
*Corresponding author: Address: Faculty of Engineering, Department of Geophysical Engineering Sakarya University, 54187, Sakarya TURKEY. E-mail address: [email protected], Phone: +902642955698
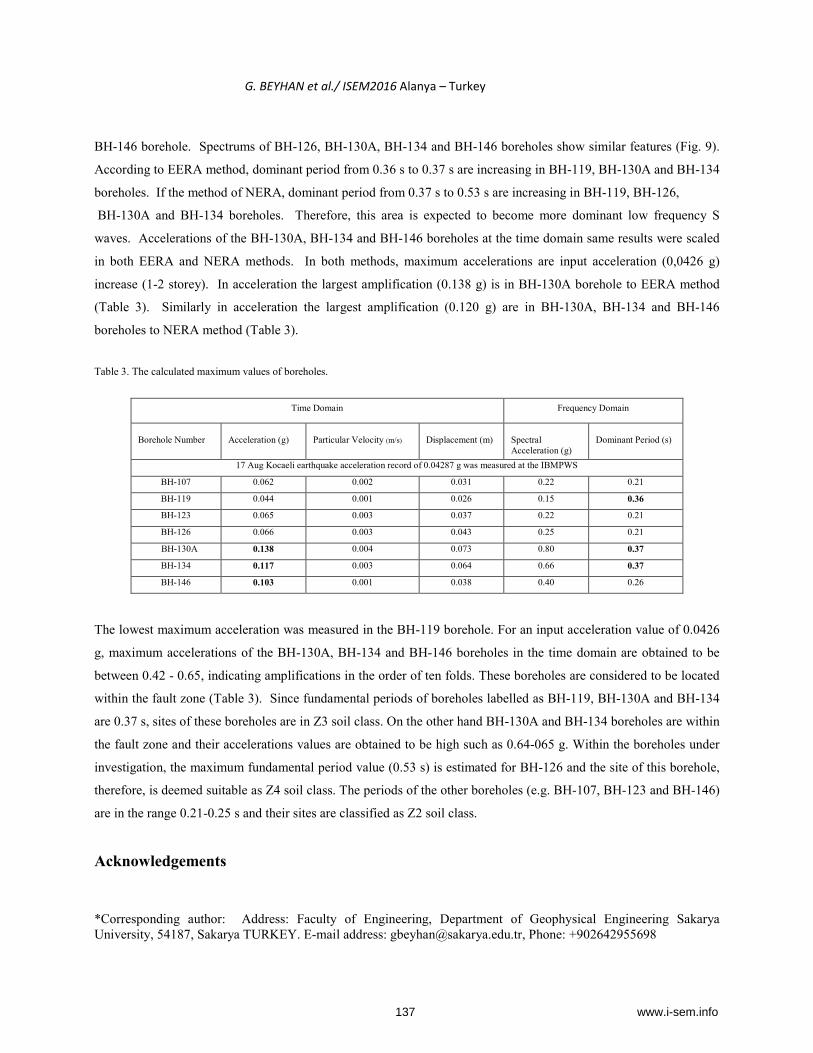
BH-146 borehole. Spectrums of BH-126, BH-130A, BH-134 and BH-146 boreholes show similar features (Fig. 9).
According to EERA method, dominant period from 0.36 s to 0.37 s are increasing in BH-119, BH-130A and BH-134
boreholes. If the method of NERA, dominant period from 0.37 s to 0.53 s are increasing in BH-119, BH-126,
BH-130A and BH-134 boreholes. Therefore, this area is expected to become more dominant low frequency S
waves. Accelerations of the BH-130A, BH-134 and BH-146 boreholes at the time domain same results were scaled
in both EERA and NERA methods. In both methods, maximum accelerations are input acceleration (0,0426 g)
increase (1-2 storey). In acceleration the largest amplification (0.138 g) is in BH-130A borehole to EERA method
(Table 3). Similarly in acceleration the largest amplification (0.120 g) are in BH-130A, BH-134 and BH-146
boreholes to NERA method (Table 3).
Table 3. The calculated maximum values of boreholes.
Time Domain Frequency Domain
Borehole Number
Acceleration (g)
Particular Velocity (m/s)
Displacement (m)
Spectral Acceleration (g)
Dominant Period (s)
17 Aug Kocaeli earthquake acceleration record of 0.04287 g was measured at the IBMPWS
BH-107 0.062 0.002 0.031 0.22 0.21
BH-119 0.044 0.001 0.026 0.15 0.36
BH-123 0.065 0.003 0.037 0.22 0.21
BH-126 0.066 0.003 0.043 0.25 0.21
BH-130A 0.138 0.004 0.073 0.80 0.37
BH-134 0.117 0.003 0.064 0.66 0.37
BH-146 0.103 0.001 0.038 0.40 0.26
The lowest maximum acceleration was measured in the BH-119 borehole. For an input acceleration value of 0.0426
g, maximum accelerations of the BH-130A, BH-134 and BH-146 boreholes in the time domain are obtained to be
between 0.42 - 0.65, indicating amplifications in the order of ten folds. These boreholes are considered to be located
within the fault zone (Table 3). Since fundamental periods of boreholes labelled as BH-119, BH-130A and BH-134
are 0.37 s, sites of these boreholes are in Z3 soil class. On the other hand BH-130A and BH-134 boreholes are within
the fault zone and their accelerations values are obtained to be high such as 0.64-065 g. Within the boreholes under
investigation, the maximum fundamental period value (0.53 s) is estimated for BH-126 and the site of this borehole,
therefore, is deemed suitable as Z4 soil class. The periods of the other boreholes (e.g. BH-107, BH-123 and BH-146)
are in the range 0.21-0.25 s and their sites are classified as Z2 soil class.
Acknowledgements
137 www.i-sem.info

G. BEYHAN et al./ ISEM2016 Alanya – Turkey
*Corresponding author: Address: Faculty of Engineering, Department of Geophysical Engineering Sakarya University, 54187, Sakarya TURKEY. E-mail address: [email protected], Phone: +902642955698
The authors would like to thanks MSc. Sercan ÖZTÜRK and TAISEI Corporation.
References
[1] Bardet JP, Ichii K, Lin CH (2000) EERA, A Computer Program for Equivalent Linear Earthquake Site Response Analysis of Layered Soils Deposits. University of Southern California, Los Angeles. [2] Bardet JP, Tobita T (2001) NERA: A computer program for nonlinear earthquake site
response analyses of layered soil deposits, Department of Civil Engineering, University of Southern California, Los Angeles, CA, 43 pp.
[3] Boatwright J, Fletcher JB, and Fumal TE (1991) A general inversion scheme for source, site and propagation characteristics using multiply recorded sets of moderate-sized earthquakes. Bull. Seism. Soc. Am., 81, 1754-1782
[4] Borcherdt RD (1970) Effects of local geology on ground notion near San Francisco Bay. Bull. Seismol. Soc. Am. 60: 29–81
[5] Field EH, Jacob KH (1995) A comparison and test of various site-response estimation techniques, including three that are not reference-site dependent. Bull. Seism. Soc. Am. 85: 1127–1143
[6] Iwan, WD (1967) On a class of models for the yielding behavior of continuous and composite systems, Journal of Applied Mechanics, ASME, Vol. 34, pp.612-617.
[7] Iwata T, Irikura K (1988) Source parameters of the 1983 Japan Sea earthquake sequence. J. Phys. Earth. 36:155–184
[8] Kramer SL (1996) Geotechnical Earthquake Engineering, 1st edn. Prentice-Hall, New Jersey [9] Lam I, Tsai CF, Martin GR (1978) Determination of site dependent spectra using nonlinear
analysis. In: 2nd international conference on microzonation, San Francisco, CA [10] Lermo J, Chavez-Garcia FJ (1993) Site effects evaluation using spectral ratios with only one
station. Bull Seismol. Soc. Am. 83: 1574–1594 [11] Nakamura Y (1988) On the urgent earthquake detection and alarm system (UrEDAS). In:
Proceedings of World. Conference in Earthquake Engineering [12] Schnabel PB, Lysmer J, Seed HB (1972) SHAKE: a computer program for earthquake
response analysis of horizontally layered sites. Report No. EERC72-12, University of California, Berkeley
[13] TAISEI (2011) Marmaray project map (unpublished). [14] Yamazaki F, Ansary MA (1997) Horizontal-to-vertical spectrum ratio of earthquake ground
motion for site characterization. Earthquake Eng. Struct. Dyn. 26: 671–689. JSSMFE: 14–31
138 www.i-sem.info