Embed Size (px)
Citation preview

1
A comparative study of SiC epitaxial growth in vertical hotwall CVD reactor using silane and dichlorosilane precursor gases
Tawhid Rana*, MVS Chandrashekhar, Haizheng Song, Tangali S. Sudarshan
Department of Electrical Engineering, University of South Carolina, Columbia, SC-29208, USA
*Corresponding author at: c/o Tangali S. Sudarshan, University of South Carolina,
Department of Electrical Engineering, 301 S Main St. Rm#3A80, Columbia, SC29208, USA.
Tel.: +18037778480; fax: +18037778045. E-mail: [email protected].
Keywords: A1. Computer simulation, A1. Growth models, A1. Doping, A3. Chemical vapor
deposition processes, B1. Silicon carbide, B1. Halides
Abstract
SiC epitaxial films grown in an inverted chimney CVD reactor are analyzed and
compared for growth rates, doping concentration and surface morphology using silane-propane-
hydrogen and dichlorosilane (DCS)-propane-hydrogen chemistry systems. A general 1-D
analytical model is presented to estimate the diffusivity of precursor gases, boundary layer
thickness and growth rates for both gas systems. Decomposition of precursor gases into Si
growth species is investigated by a commercial simulation tool, “Virtual Reactor (VR)”. DCS
suppresses the formation of elemental Si at lower pressures, reduces precursor losses, and leads
to increased growth rate. However, at higher pressures, even DCS decomposes into elemental Si,
which contributes to high Si depletion, limiting the maximum achievable growth rate. Reduction
of Si loss using DCS is verified by mass measurements of parasitic depositions in the injector
tube. The doping concentration of the epitaxial film is governed by the effective C/Si ratio at the
growth surface rather than the inlet C/Si ratio, which is examined at various growth pressures. In
addition to the widely known Si-depletion, C-depletion is also shown to exist and it plays a
critical role in determining the doping concentration at various growth conditions. Increased
roughness for the DCS growth at higher pressures is addressed and attributed to excessive HCl
etching at higher pressures.
1. Introduction
Homoepitaxial growth of SiC is one of the most important processes in the fabrication of
SiC devices. Although various methods such as molecular-beam epitaxy, liquid phase epitaxy,
sublimation epitaxy and vapor-liquid-solid method are attempted in SiC epitaxial growth,
chemical vapor deposition (CVD) is still the leading and the most attractive technique to grow
thick and high quality epitaxial SiC layers [1, 2]. With development of the SiC-CVD technique,
simulation and modeling become important for reactor design, growth optimization, prediction,
and better understanding of the growth process, particularly to achieve high growth rate, high
quality thick epi for electrical power applications [3, 4, 5].
2
The conventional SiC-CVD process uses silane as the Si-precursor, light hydrocarbons
e.g. propane (C3H8) or ethylene (C2H4) as the C-precursor, and hydrogen as the carrier gas. In
recent years, chloride precursors such as SiCl4 and/or HCl addition are induced to achieve high
growth rate and to reduce Si-droplet formation in 4H and 6H SiC-CVD process [6, 7, 8, 9].
Numerical simulations have been carried out for traditional precursors [4, 10] and some chloride
precursors [11, 12] for growth rate prediction.
An accurate growth rate calculation or model prediction is not possible without precise
calculation of precursor losses due to gas phase nucleation and parasitic deposition. Calculation
of gas phase nucleation requires prediction of number of molecular collisions, the nucleated
particle size estimation and their dynamics, which are very complex and different for different
chemistries under different growth conditions with the variability of reactor geometry etc. A
complete modeling tool, which considers all of the aforesaid issues to predict the growth rate
correctly for various chemistries and growth conditions, does not currently exist. Nevertheless,
despite the limitations, simulation is still a very important tool to understand the CVD growth
process, design experiments and to optimize growth conditions. On the other hand, simulation
can also be improved and supplemented by analyzing experimental data, comparing them with
the simulation results and optimizing the simulation for accurate predictability. Thus,
comparisons of simulation with experiments in relation to various growth conditions and gas
chemistries are essential to improve the simulation as well as optimize the experiment.
Dichlorosilane (SiH2Cl2, DCS) is a well known precursor in the silicon industry which
was first reported for thick silicon epitaxial growth in 1974 by P. H. Robinson and N. Goldsmith
[13] and patented by them in 1976 [14]. The low boiling point (8.3oC) of DCS ensures efficient
and convenient reactant delivery at room temperature, which is an advantage over SiCl4.
Recently, use of DCS in 4H-SiC epitaxial growth was reported by the author‟s group for high
growth rates [5]. Growth rate up to 100 µm/h was obtained from the SiH2Cl2-C3H8-H2 system.
In depth research of the behavior of DCS in the SiC-CVD process is necessary for further
optimization of the growth conditions to obtain high quality SiC epilayers, which is one of the
main objectives of the research presented in this paper.
Si contributing to SiC epi growth can be depleted due to gas phase nucleation, parasitic
deposition on the reactor walls and other losses. This is called Si-limited growth where the
growth is restricted by Si depletion. To overcome this impediment, chlorinated species are used
by either HCl addition or by using some chlorinated silanes as such as SiCl4, SiH3Cl, or SiH2Cl2.
With the addition of Cl, the amount of Si available for SiC growth increases due to suppression
of gas phase nucleation, thus increasing the growth rate proportionately, provided that C-
precursor flow is also increased. However, an increment in C-precursor flow may or may not
increase the growth rate, due to the losses of carbon in various forms. In this situation, the
growth is C-limited. Silicon carbide CVD epitaxy is primarily found to be Si-transport limited as
per the results by various researchers [15, 16, 5].
Kimoto et al. reported the activation energy for vicinal step controlled epitaxy, common
for SiC film growth, to be very low (~3 kcal/mol compared to ~20 kcal/mol for terrace nucleated
growth on on-axis SiC substrate). For typical temperatures (1100-1500°C), growth was not
found to be limited by surface reactions, but rather by mass transport. In step-controlled epitaxy,
at typical temperatures, the growth is mainly limited by the diffusion of growth species into the
stagnant boundary layer at the growth surface [17]. Increased growth rate at increased
temperatures is shown to be due to the increased diffusivity of the gas molecules in the boundary
layer at elevated temperatures, and not due to increased surface reaction [17]. Similar discussions

3
are available in [18]. Transport limited growth in a similar type CVD reactor was also reported
by Chowdhury et al. [5].
In a low growth rate environment with low inlet mass flow rate, gas phase nucleation is
insignificant and hence does not reduce the growth rate considerably. A low concentration of gas
molecules due to lower precursor flow rate inherently suppresses super saturation and gas phase
nucleation. A C-limited growth might be subtle at low growth rate conditions due to the
insignificant gas phase nucleation caused by reduced super saturation. However, later we will
present evidence of C-depletion, even for the low growth rates, from the results of doping
concentration variation with growth pressure.
In this paper, analytical calculation of diffusivity and growth rate is first carried out in
silane-C3H8-H2 and DCS-C3H8-H2 systems for understanding the transport process. This general
1-D analytical model provides a valuable tool for reactor design in CVD.
Virtual Reactor (VR), a commercial modeling software, is then employed to simulate the
SiC-CVD process in both systems. Clear indication of gas-phase nucleation is obtained from the
VR simulation results. In this study, parasitic deposition on gas injector wall is studied for both
precursors. Combining the simulation and experimental results with respect to growth rate,
doping, and morphology, the SiC-CVD process in DCS-C3H8-H2 system is analyzed and
compared with the traditional silane-C3H8-H2 precursor system. Further, in this study, we
provide clear evidence of carbon depletion which, in turn, influences the doping concentration of
the epitaxial films.
2. Analytical model
2.1 Diffusivity
The diffusivity of precursor gas molecules plays a very important role in the diffusional
mass transfer process during CVD epitaxial growth. Diffusivity of dilute gas A in carrier gas B
can be found from the Reid and Sherwood (1966) expression which is valid below 20 atm [19]
(1)
Where P is in atmospheric pressure (atm), T is temperature in Kelvin, MA and MB are molecular
masses of gas A and gas B, ζAB is the collision diameter, which is the average of the diameter of
two colliding molecules in Angstrom. A so called collision integral ΩD.AB includes the dynamics
of molecular interaction due to their speeds, masses and angles of collisions [20]. Collision
integrals for gas molecules based on Lennard-Jones potentials can be found from the
vs.
ΩD.AB table reported by J.O. Hirschfelder et al. (1954) [19, 21], where kB is Boltzmann‟s constant
and εAB is a Lenneard-Jones force constant in joules. Lennard-Jones force constants are found in
the Lennard-Jones potential function, which estimates the electric potential between molecules A
and B. The diffusivities of silane and propane in hydrogen gas at 1 atm and 273K is calculated to
be 0.51 and 0.37cm2/s, from Equation-1, respectively. However, relevant data for DCS are not
available to directly apply in Equation-1 to find the diffusivity of DCS.
As a general rule, diffusivity of molecules decreases for heavier gases [22]. Lower
diffusivity ensures lower activity of the associated gas molecules in terms of their participation in
growth. Diffusivity of a gas molecule can be extrapolated from the empirical molecular weight
versus diffusivity relation [23]. This is especially useful to estimate the diffusivity of gases for
4
which the required data are not readily available to apply in Equation-1. We calculate the
diffusivities of 72 gases found in [19] using Equation-1 and estimate the diffusivity of DCS
(molecular weight 100) in hydrogen at 1 atm and 273K, to be 0.38 from the power law trend line
in Fig. 1a.
The species primarily participating in growth depend on the gas decomposition at growth
conditions. Decomposition of silane, chloro-silane, and propane in a SiC-CVD process has been
extensively studied in previous publications [10, 24, 25]. Table-1 lists the main relevant
molecules for growth in silane and DCS systems and their diffusivities at 273K and 1 atm
extrapolated from Fig. 1a. We extrapolated diffusivities of these molecules from the empirical
molecular weight versus diffusivity relation from [23] and listed them as well in Table-1 for
comparison. The difference between them can be attributed to the inherent average (%) error of
the Equation-1 (Reid and Sherwood, 1966) which is approximately 7.5% [19].
It is seen in Table-1 that the different decomposed species from silane have similar
diffusivities because stripping off the hydrogen does not change the molecular mass
significantly. In the same way, for DCS, diffusivity of the DCS gas molecule (SiH2Cl2) does not
vary much compared to SiCl2, which has been shown to be stable, and to be the main growth-
participating specie decomposed from DCS. [26]. Using this consideration, later, we calculate
the growth rate by using the diffusivity of SiH4 molecule for silane and that of SiH2Cl2 molecule
for DCS assuming that this calculation will not vary considerably from those of the other growth
participating species for these chemistries.
The diffusivity of a gas at temperature T2 can be calculated from the diffusivity at
temperature T1 by applying the following formula [19].
(2)
The diffusivity of silane at the regular growth condition (300 torr and 1550oC in this paper) is
analytically calculated to be 33.6 cm2/s by using Equation-2. Since the collision integrals of the
DCS molecule are not readily available, we extrapolate the diffusivity of DCS at growth
conditions from the fitted curve (Fig. 1b). We estimate the diffusivity of DCS to be ~25 cm2/s
from this graph at the growth condition (300 torr and 1550°C).
2.2 Growth rate calculation
In order to predict growth rate by analytical calculation, the growth process is analyzed in
a simple reactor geometry as shown in Fig. 2. Initially, Hydrogen (6000 sccm) flows into the
reactor. The silane flow (1 sccm) is initiated at 1550oC. A stagnant layer forms near the growth
surface in the boundary layer (Fig. 2b). The very first few adhered molecules start participating
in the growth kinetics and a concentration gradient forms. The concentration of gas molecules at
the solid-gas interface is reduced (assumed to be 0, i.e. a perfect sink) and diffusional mass
transfer sets in. It is assumed that there is always one carbon atom present (from propane) for
each silicon atom (from the Si precursor) in the boundary layer during growth.
The calculation can be divided into three parts. They are: calculation of diffusivity of
silicon precursors in the hydrogen, calculation of the boundary layer thickness, and finally
calculation of growth rate using Fick‟s law of diffusion. This provides a general first order 1-D
estimation of growth rate for a given system. Since this calculation does not include gas phase
nucleation or aerosol formation, a lower growth rate is expected in the actual experimental

5
growth. The difference between experimental and calculated growth is an indication of precursor
losses in the reactor and should be minimal for ideal growth conditions.
The Si flux (cm-2
s-1
) near the growth surface in the reactor geometry shown in Fig. 2 can
be found from [27]
(3)
No is the inlet reactant concentration (cm-3
) and δ is the boundary layer thickness (cm).
The inlet reactant concentration of Si,
cm
-3 (Where PSi is inlet Si
partial pressure for the previously given growth condition).
The thickness of the boundary layer is found from [27]
(4)
Where x = 33 mm in our case in (Fig. 2a) from [27].
The free velocity of gas in the tube beyond the boundary layer region is 4.5 m/s from Equation-5.
(5)
Here, the gas flow rate M= 6000 sccm, the cross section area of the hotwall S= 34 cm2,
Po=Atmospheric pressure in torr, P= growth pressure in torr.
The boundary layer thickness is found using Equation-4 to be ~9 mm (diffusivity of silane D=33
cm2/s by calculation from section 2.1).
Using the above values, the number of Si atoms diffusing into the boundary layer per second is
calculated from Equation-3 to be,
The total Si mass transfer in t seconds is,
(6)
Here NA is Avogadro‟s number, M is the molar mass. It is assumed that the propane flow rate is
adjusted in such a way that there is no deficiency of carbon atoms in the boundary layer for each
incoming silicon atom as discussed in the introduction.
The total C mass transfer in t second is,
(7)
The average growth rate for the hot wall cross sectional area (A) at the growth surface is,
(8)
Here ρ, the density of SiC, is 3220 Kg/m3.
Using Equation-8, the growth rate for the silane precursor was found to be ~7.5 µm/hr.
Using the diffusivity of DCS (SiH2Cl2) as 25.6 cm2/s (estimated from Fig. 1b for the
growth conditions), the growth rate is found to be ~6.5 µm/hr for the DCS precursor.
Comparison of growth rates using silane and DCS precursor gases, based on the above 1-D
calculations, is shown in Table-2. For silane, the growth rate calculated by the VR simulation
software (details of VR are provided in the experimental section), is found to be ~6 um/hr for the
geometry in Fig. 2a. Experiments are conducted using the same reactor arrangement (Fig. 2a) to
compare simulation and analytical calculation results giving a growth rate of ~5 um/hr. This
growth rate is lower than the analytical calculation and simulation results as expected. The
difference is attributed to precursor losses due to gas phase nucleation and parasitic deposition.
We will provide evidence of parasitic deposition later, while gas phase nucleation has already
been reported in the literature to be an issue in CVD growth. While the analytical model is
simple but incomplete, it provides a convenient starting point to study the growth of SiC.

6
3. Experimental and simulation
Epitaxial growth of SiC is carried out using an inverted chimney type vertical hot-wall
CVD reactor (Fig. 3). This arrangement consists of a hotwall, a gas injector and a substrate
holding susceptor. The system is inductively heated by a 20kW generator at 9090 Hz. Silane/
DCS and propane are used as precursor gases. Propane, silane/DCS and hydrogen gas flow are
kept fixed at 1.5 sccm, 3.28 sccm and 6000 sccm respectively while the growth temperature is
fixed at 1550oC. The distance between the injector end and the SiC substrate sample is 33 mm
and the growth pressure is varied from 30 to 600 torr. Commercially available 4H-SiC wafers (8
degree off cut towards [ ], optically polished) are used as the substrate for all of the
experiments. The epilayer thickness is measured using Fourier transform infrared (FTIR)
spectroscopy. Atomic force microscopy (AFM) is used to measure the roughness of the samples.
Capacitance-voltage (C-V) mercury probe measurement is performed to determine the doping
concentration of the epilayers.
VR, developed by Semiconductor Technology Research Inc. is employed for simulation
of the growth process in our reactor geometry shown in Fig. 3. The boundary conditions and
material properties are also provided in Fig. 3. A complete discussion of the thermal field
calculation using the VR can be found in [28]. Parasitic deposition is included in the simulation
by defining „catalytic‟ or reactive growth surfaces in the furnace based on our observation of
actual parasitic deposition taking place on the injector tube during growth. Catalytic surfaces are
indicated by dashed lines in Fig. 3. Silane or DCS chemistries can be used in the simulation for
calculation of the partial pressures of the different decomposed species and growth rate at
various pressures (30 torr to 300 torr). The gas decomposition kinetics in VR offers an important
tool to compare DCS and silane chemistries at various growth conditions.
4. Results and Discussion
In this section epitaxial growth from silane and DCS is compared at various growth
pressures in terms of growth rate, doping and surface morphology. These are explained on the
basis of different decomposition behavior of the precursor gases obtained from simulation.
In order to understand the influence of pressure on epitaxial growth, a brief discussion of
the pressure control mechanism in the CVD reactor, which eventually controls the residence
time, gas phase nucleation, parasitic deposition, and epitaxial growth for a given gas flow rate
and reactor geometry is provided below.
In CVD growth, gases flow in the chamber at certain flow rates into the reactor and the
pressure is maintained by an adjustable valve. This valve controls the aperture of the gas exit
path in the reactor to maintain a certain pressure while gases flow constantly during the growth.
A higher amount of gas is pumped away per unit time for lower pressures and vice versa. A
lower pressure shortens the residence time of the gas molecules in the reactor proportionately. At
any instance during growth, the number of gas molecules per cc in the chamber is lower for
lower growth pressures than that at higher growth pressures for fixed flow rates of precursor
gases.
However, the total number of gas molecules flowing through the chamber cross section
per unit time (molecules/cm2/sec) remains constant at a certain gas flow rate irrespective of the
growth pressure. Considering only the amount of mass passing through the reactor cross section,
the pressure thus should not have any effect on the growth rate. It is important to consider the

7
interaction of these gas molecules among themselves in the gas and with the reactor furniture
parts in order to estimate the correct growth rate at various pressures.
Obviously, a longer residence time at a higher pressure will allow these molecules to
absorb more energy from the heating element as well as to interact among themselves for a
longer period with shorter mean free path. This will increase both gas phase nucleation and
parasitic deposition on the reactor walls and thus depletes the source elements from the intended
crystal growth. These losses deplete the precursors, change the effective C/S and/or induce
particulates on the growth surface and hence can affect growth rate, doping concentration and
morphology. It is noteworthy that different reactors may behave differently and growth related
results may not be comparable even at same growth pressures since volume and geometry of the
reactor, which determines the residence time of the gas molecules in the reactor, might vary for
different reactors.
4.1. Decomposition of silane and DCS into elemental silicon
First, the decomposition of silane and DCS into elemental Si is analyzed at the same
experiment growth conditions by VR. A higher dissociation bonding energy per mole for a
molecular bond requires a relatively longer residence time (function of pressure) to dissociate
into constituent species at a fixed temperature (1550oC in our case). The dissociation bonding
energy of relevant bonds in silicon carbide CVD is shown in Table-3 [29]. The bond energy of
Si-Cl is 381 KJ/mol compared to that of Si-H (318 KJ/mol), which implies that for a given
system, when heat energy is applied, the Si-Cl bond should take a longer time to dissociate
compared to the Si-H bond.
The VR simulation of the decomposition of DCS and silane into elemental Si at various
growth pressures is shown in Fig. 4 for different growth pressures. From Fig. 4 it is evident that
silane decomposes in a higher proportion into elemental Si at a low pressure (30 Torr) compared
to DCS. However, at higher pressures (> 300 Torr) even DCS dissociates to form an increased
amount of elemental Si. At 30 torr, the gas molecules pass through the chamber with a velocity
of ~4.5 m/s (from simulation and analytical calculation) for the hotwall cross sectional area. At
this velocity, the residence time of the gas molecules in the hot zone of the furnace is long
enough for the silane (SiH4) molecules to absorb adequate energy to dissociate into elemental Si
in a notable amount as presented visually and quantitatively in Fig. 4b (30 torr, silane). On the
other hand, in DCS, elemental Si does not form in a considerable amount as DCS (SiH2Cl2)
molecules posses higher dissociation bonding energy as seen in Fig. 4b (30 torr, DCS). This is
the key difference between DCS and silane in terms of their dissociation behavior, as evidenced
by the VR simulation, which is the primary reason for the suppressed gas phase nucleation and
parasitic deposition in DCS compared to silane.
Change of gas velocity at various growth pressures influences the temperature profile. The
variation of temperature profile at different pressures also influences the gas decomposition
behavior in the reactor. However our discussion is only limited to the comparison of the
decomposition behavior of DCS and silane gases at a given growth pressure. Change of
temperature profile due to change of gas velocity is applicable to both of the chemistries, and
hence ignoring this effect does not affect our chemical decomposition comparisons of two gases
presented in this section. Experimentally, we find that the RF power consumed at a given growth
temperature and pressure is the same for both precursors, indicating that the temperature profile
is similar.

8
4.2. Growth rate versus pressure
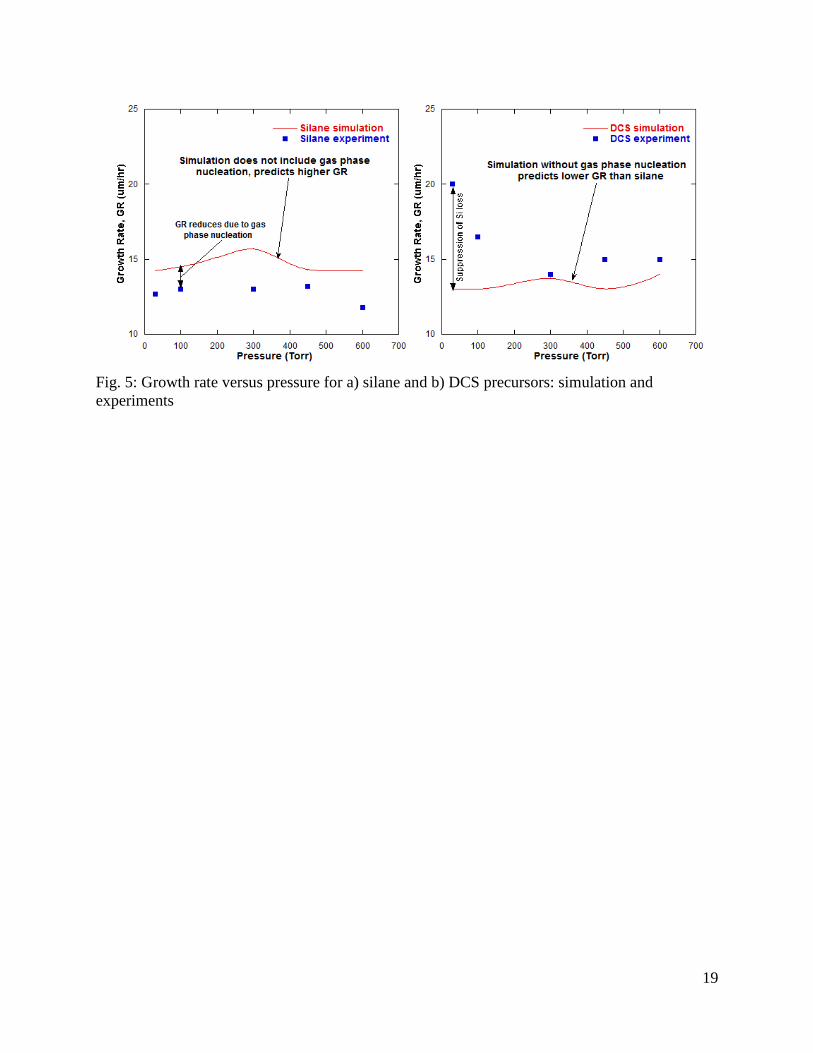
The growth rates for various growth pressures are plotted in Fig. 5 using simulation and
experiments for silane-propane and DCS-propane precursor systems. The experimentally
obtained growth rate for the DCS precursor is found to be higher compared to growth from silane
at all growth pressures. This difference is found to be more significant at a lower growth pressure
(30 torr). To the contrary, the simulation results predicted a higher growth rate for silane than
the DCS at the same conditions. We explain this behavior below.
Silicon and carbon growth species (supplied from precursor gas dissociation) which do
not participate in the epitaxial growth can be considered as a loss mechanism. These losses in the
SiC-CVD process are mainly due to silicon gas phase nucleation and parasitic silicon and
parasitic SixCy deposition on the injector or reactor walls. Further, parasitic carbon deposition on
the injector wall is also to be considered. The details of carbon deposition from the hydrocarbon
precursor are disscussed elsewhere [30], and summerized below to provide rationale for carbon
depletion during growth due to carbon depositions on the reactor walls.
Carbon produced by the thermal decomposition of hydrocarbon gases such as methane,
and propane is called pyrocarbon. Pyrocarbon is deposited for various applications such as
carbon resistors, microphonic materials, nuclear material coatings, etc. Pyrocarbon deposition is
a complex process which is believed to be the result of simultaneous gas phase and surface
reaction of hydrocarbons [30]. Removing hydrogen from the hydrocarbon molecules by applying
heat initiates the process of carbon deposition. Interaction amongst these dehydrogenated
molecules and their further dehydrogenation and collisions may form complex and heavier
carbon enriched molecules or polymers [31]. These are carbon particles of different sizes and
shapes, which deposit on the reactor parts. The shape and size of these depositions is reported to
vary at different temperatures (1000 to 2400˚C) [30, 31]. Formation of heavier carbon rich
molecules or polymers in the gas can be considered as gas phase nucleation of carbon [31]. The
deposition rate of pyrocarbon from propane is a function of temperature, pressure, flow rate, etc.
which is well studied [30]. In silicon carbide CVD, the presence of the hydrocarbon propane
provides a favorable condition for carbon deposition on the furnace parts similar to the
pyrocarbon CVD described in [30].
With respect to SiC epitaxy, the pyrocarbon deposition on the reactor walls and carbon
gas phase nucleation are termed as carbon losses since they deplete the carbon precursor. These
carbon losses will vary depending growth temperature and pressure since pyrocarbon deposition
is influenced by temperature and pressure. Carbon losses may affect growth in terms of growth
rate, epi film doping concentration and crystal quality. However, due to the presence of silicon in
the SiC CVD environment, carbon depositions in the reactor may take much more complex
forms than the ordinary pyrocarbon depositions.
The parasitic depositions on the injector tube wall after several growth runs is shown by
the split tube image in Fig. 6 with the associated temperature profile. The upper portion, i.e. the
low temperature zone, is found to be mainly silicon deposition (Fig. 6a), whereas the lower
portion in the higher temperature zone is found to be deposited with materials of different colors
and compositions. The depositions vary from loosely bound powdered materials to strongly
adhearing grains on the tube wall. Yellowish parts consist of 3C-SiC. Dark gray to black
materials are deposited in regions of ~1000-1300˚C (Fig. 6b), which implies that this region
could be deposited having carbon rich materials with different proportions. These elemental
assignments were confirmed using EDX (Energy Dispersive X-ray spectroscopy). The

9
composition and span of this region depends on the growth conditions such as temperature and
pressure for a given gas flow rate.
The total mass associated with parasitic depositions is measured to confirm that DCS
increases the growth rate by suppressing losses (reduced gas phase nucleation and parasitic
deposition). The mass of the parasitic depositions are measured by weighing the gas delivery
system where parasitic deposition takes place, before and after Si precursor flow. Precursor flow
rate is kept at 5sccm for silane and DCS experiments and other growth conditions are kept the
same. The total deposited mass (Si) in the gas delivery system was found to be ~341mg for
silane compared to ~236mg using DCS, indicating that less Si is lost to parasitic deposition using
DCS. The above results support the experimentally observed increase of growth rate in DCS
compared to silane (Fig. 5). Thus the DCS system increases the availability of growth species for
the epi growth boundary layer by reducing Si losses in the gas stream and reactor walls.
To the contrary, unlike the experimental results, the simulation (and calculation in
section-1) gives a higher growth rate for silane precursor than DCS. The discrepancy is clearly
explained by the higher diffusivity and more efficient decomposition of silane (Fig. 4b) into
elemental Si, suggesting a higher growth rate for silane compared to DCS for the simulation
(Fig. 5) without including gas phase nucleation (which exists during the actual growth).
Accounting for these non-idealities, the apparent contradiction in growth rates is resolved, giving
a higher growth rate for DCS.
According to the collision theory of chemical reaction, elemental silicon has the highest
probability to take part in the reaction, in the gas phase, to form Si particles since it has a higher
number of dangling bonds to form Si-Si bonding. From the analysis of simulation results, the
degree of formation of elemental Si for a certain growth condition is an indication of the severity
of silicon gas phase nucleation in the reactor. Combining simulation and experimental results
(Fig. 4, 5), it can be concluded that growth at 30 Torr in DCS is mostly due to participation of
SiClx or SiHxClx species in growth, due to the smaller amount of decomposed Si in this condition
(Fig. 4). Thus, DCS provides an environment with reduced Si gas phase nucleation, consistent
with the assumption that collisions among SiClx or SiHxClx have lower probability to form Si
droplets or silicon aerosol. On the other hand, Fig. 4 shows that silane decomposes much more
easily to form elemental Si even at a lower pressure (30 torr) resulting in higher gas phase
nucleation and lower growth rate. However, at higher pressures (>300Torr), simulation shows
that even DCS decomposes significantly to produce increased amounts of elemental Si (Fig. 4a)
leading to increased Si aerosol formation (or gas phase nucleation) and reduced growth rate.
However, the increased Si formation in DCS at higher pressures is still less than silane,
consistent with the experimental results (Fig. 5). Increased HCl formation (which will be
discussed later) and related etching [32] may also be a reason for lower growth rate found at
higher pressures using DCS.
4.3. Variation of doping concentration with pressure
Experimental results demonstrate that n-type doping concentration of the epitaxial layer
increases with increasing growth pressure (Fig. 7) for both precursors; this result is consistent
with the previously published results for silane [33]. The effective C/Si ratio is the carbon to
silicon ratio at the growth surface rather than C/Si ratio at the inlet. The effective C/Si ratio
depends on the relative losses of silicon and carbon precursors (or the relative availabilities of
them for epi growth) mainly as a result of parasitic deposition and gas phase nucleation (or
aerosol formation) prior to reaching the growth surface. Si-aerosol can be considered to be a

10
“pseudo-gas” with much heavier particles, with considerably lower diffusivity [16]. Lower
diffusivity restricts the molecules participating in growth by diffusional mass transport.
According to this picture, a higher gas phase nucleation rate should result in higher effective C/Si
ratio (due to depletion of Si) and lower nitrogen incorporation by the site competition principle
[34]. However, this is in contradiction with our experimental results where net n-type doping
increased at higher pressures (Fig. 7). This discrepancy can be explained if depletion of carbon is
considered as well. If depletion of C is considered, then the relative depletion of carbon to the
depletion of silicon (already discussed) will govern the effective C/Si ratio.
Parasitic depositions occur mainly in the injector tube and the hotwall. There are three
possibilities for parasitic deposition on these walls: pyrocarbon, silicon, and silicon carbide. The
deposition of SiC (1C and 1Si) should not have any effect on the effective C/Si ratio at the
growth surface and hence is not expected to affect the doping at the growth surface. On the other
hand, the relative amounts of pyrocarbon and parasitic silicon deposition on the tube wall will
play a dominant role in determining the effective carbon to silicon ratio at the epitaxial growth
surface. The behavior of doping versus pressure in Fig. 7 can be explained if we consider a
higher amount of carbon depletion compared to silicon, reducing the effective C/Si ratio. This
increased reduction of carbon can be attributed to the increased carbon losses at higher pressures
due to increased pyrocarbon deposition on the reactor materials and formation of heavier carbon
enriched molecules in the gas. We consider this loss of carbon to be the reason for the reduced
effective C/Si ratio at higher pressures. This increases the net n-type doping according to the site
competition rule [34], a result consistent with our experimental observations in Fig. 7. A detailed
study is required to determine the relative depletion of carbon versus silicon in the reactor under
different growth conditions.
It is observed that at higher pressures above 300 torr, both DCS and silane yield similar
doping concentrations (Fig. 7). We can conclude that at higher pressures, both precursors have
similar precursor losses. Simulation results demonstrated a higher amount of elemental Si
formation for both of the precursors (Fig. 4) which indicates similar precursor losses for both
chemistries at higher pressures. Growth with DCS at this condition is due to the participation of
elemental Si in the growth unlike SiCl2 at low pressures. At higher pressures, DCS growth is
similar to silane growth. We therefore infer that at high pressures (>300 torr), both precursors
result in a similar effective C/Si ratio. The observed relatively higher n-doping for DCS
compared to silane (Fig.7) can be explained by the mass measurement of the gas delivery tube
discussed earlier. The lower parasitic deposition in DCS indicates a Si rich growth condition
(lower C/Si ratio) which is consistent with higher n-doping as per site-competition epitaxy [34].
4.4. Variation of surface morphology with growth pressure
Even though a smoother surface is obtained using DCS at a low pressure (30 Torr), the
surface quality degrades significantly at higher pressures (above 450 Torr, Fig. 8b). A severely
degraded wavy surface morphology, with increased roughness, is observed by AFM analysis for
epilayers grown at higher pressures. However, no significant variation of surface morphology is
observed for silane growths at various pressures (Fig. 8c). Increased formation of HCl due to
dissociated Cl from DCS at high pressures is responsible for surface waviness because of
excessive HCl etching [32] during growth. This assertion is supported by VR simulation as
shown in Fig. 8a, which shows ~20 times increased amount of HCl at 600 torr than at 30 torr,
demonstrated by the larger red area.

11
5. Summary
Diffusivities of silane and DCS gases in hydrogen are calculated using Reid and
Sherwood‟s formula and growth rates are calculated using diffusional mass transport.
Experimentally, a higher growth rate is observed for DCS compared to silane chemistry despite
DCS‟s larger molecular mass. This higher growth rate is due to reduced loss of the silicon
precursor attributed to suppressed gas phase nucleation and parasitic deposition in DCS
environment. The reduction of parasitic deposition using DCS is confirmed by mass
measurements of parasitic deposition. Further comparison is provided for growth rates obtained
in silane and DCS using analytical calculation and by simulation.
Comparison of growth rates at various growth pressures for these chemistries
demonstrate that DCS growth rate increases noticeably at low pressures (e.g., 30 Torr). With the
support of simulation results, it is demonstrated that growth with DCS at this low pressure is
mostly due to SiHxClx species which creates the condition for reduced gas phase nucleation. At
higher pressures even DCS decomposes into elemental Si, which reduces growth by increasing
silicon loss.
The dependence of doping concentration on pressure is examined for both precursors
and explained by consideration of effective C/Si ratio, the carbon to silicon ratio at the growth
surface rather than the C/Si ratio at the inlet. Carbon depletion is considered for the first time in
SiC CVD to explain the higher net n-type doping found at higher growth pressures. We infer that
the relative losses of carbon and silicon growth species cause a variation in the effective C/Si
ratio, which governs the doping concentrations at various growth pressures.
A wavy, degraded surface was observed using DCS at high pressures in contrast with
growth by silane. Excessive etching due to the presence of higher amounts of HCl in DCS at
higher pressures is believed to be the reason for the observed degradation in surface morphology.
Acknowledgement
This work was supported by the ONR, Grant no. # N000141010530. The authors thank the
program manager Dr. H. Scott Coombe for his support of this research. The authors also thank
Mr. Sabih Omar for the FTIR measurements.

12
References
1. A. Henry, J. ul Hassan, J. P. Bergman, C. Hallin, E. Janzen, Thick silicon carbide
homoepitaxial layers grown by CVD techniques, Chemical Vapor Deposition, 12 (2006)
475
2. J. Palisaitis, R. Vasiliauskas, Epitaxial growth of thin films, Physics of Advanced
Materials Winter School 2008
3. S. Nishizawa, M. Pons, Numerical modeling of silicon carbide epitaxy in a horizontal
hot-wall reactor, Journal of Crystal Growth 303 (2007) 334
4. O. Danielsson, A. Henry, E. Janzen, Growth rate predictions of chemical vapor deposited
silicon carbide epitaxial layers, Journal of Crystal Growth 243 (2002) 170
5. Iftekhar Chowdhury, MVS Chandrashekhar, Paul B Klein, Joshua D. Caldwell, Tangali
Sudarshan, High growth rate 4H-SiC epitaxial growth using dichlorosilane in a hotwall
CVD reactor, Journal of Crystal Growth, 316 (2011) 60
6. H. Pedersen, Chloride-based Silicon Carbide CVD, Thesis, 2008
7. Rong Wang and Ronghui Ma, Kinetics of halide chemical vapor deposition of silicon
carbide film, Journal of Crystal Growth, 308 (2007) 189
8. H. Pedersen, S. Leone, A. Henry, F.C. Beyer, V. Darakchieva, E. Janzen, Very high
growth rate of 4H-SiC epilayers using the chlorinated precursor methyltrichlorosilane
(MTS), Journal of crystal growth 307 (2007) 334-340
9. F. La Via, G. Galvagno, F. Roccaforte, F. Giannazzo, S. Di Franco, A. Ruggiero, R.
Reitano, L. Calcagno, G. Foti, M. Mauceri, S. Leone, G. Pistone, F. Portuese, G.
Abbondanza, G. Abbagnale, A. Veneroni, F. Omarini, L. Zamolo, M. Masi, G.L.
Valente and D. Crippa, High growth rate process in a SiC horizontal CVD reactor using
HCl, Microelectronic Engineering 83 (2006) 48-50
10. S. Nishizawa, M. Pons, Numerical modeling of SiC–CVD in a horizontal hot-wall
reactor, Microelectronic Engineering 83 (2006) 100
11. A. Veneroni and M. Masi, Gas-Phase and Surface Kinetics of Epitaxial Silicon Carbide
Growth Involving Chlorine-Containing Species, Chem. Vap. Deposition, 12 (2006) 562
12. Rong Wang, Ronghui Ma, An integrated model for halide chemical vapor deposition of
silicon carbide epitaxial films, Journal of Crystal Growth 310 (2008) 4248

13
13. P. H. Robinson and N. Goldsmith, Silicon epitaxial growth using dichlorosilane, Journal
of electronic material 4 (1975) 313
14. Method of growing thick epitaxial layers of silicon, US Patent no. 3945864, 1976
15. A. Ellison, J. Zhang, A. Henry, E. Janzen, Epitaxial growth of SiC in a chimney CVD
reactor, Journal of Crystal Growth 236 (2002) 225–238
16. A. N. Vorob'ev, S. Yu. Karpov, O. V. Bord, A. I. Zhmakin, A. A. Lovtsus and Yu. N.
Makarov, Modeling of gas phase nucleation during SiC CVD, Diamond and related
materials 9 (2000) 472
17. Growth mechanism of 6H-SiC in step-controlled epitaxy, Kimoto, Tsunenobu Nishino,
Hironori Yoo, Woo Sik Matsunami, Hiroyuki , J. Appl. Phys. 73 (1993) 726
18. Step-controlled epitaxial growth of SiC: high quality homoepitaxy by Hiroyuki
Matsunami , Tsunenobu Kimoto, 5 November 1996
19. Diffusional Mass Transfer, A.H.P Skelland, Krieger Publishing Company, 1985
20. H. B Spencer, J. M. Toguri, and J. A Kurtis, Canadian Journal of Chemistry, 47 (1969)
2197
21. J. O. Hirschfelder, C. F. Curtiss, and R. B. Bird, Molecular theory of gases and liquids,
Wiley, New York, 1954
22. P. Vander Putte, L.J. Gilling and J. Bloem, Growth and etching of silicon in chemical
vapour deposition system; The influence of thermal diffusion and temperature gradient. J.
Crystal Growth 31 (1975), p. 299
23. W.H. Shephered, Vapor phase deposition and etching of silicon, J. Electrochem. Soc. 112
(1965) 988
24. M.T. Swihart, R.W. Carr, On the mechanism of homogeneous decomposition of the
chlorinated silanes. Chain Reactions Propagated by Divalent Silicon Species, J. Phys.
Chem. A 102 (1998) 1542
25. T. Kolke, W.C. Gardlner, Thermal decomposition of propane, Jr., J. Phys, Chem. 84
(1980) 2005
26. G. Valente, C. Cavallotti, M. Masi and S. Carra, Reduced order model for the CVD of
epitaxial silicon from silane and chlorosilanes, Journal of Crystal Growth 230 (2001) 247
27. S.K. Ghandhi and R.J. Field, A Re-examination of boundary layer theory for a horizontal
CVD reactor, Journal of Crystal Growth 69 (1984) 619

14
28. M.V. Bogdanov, A.O. Galyukov, S.Yu. Karpov, A.V. Kulik, S.K. Kochuguev, D.Kh.
Ofengeim, A.V. Tsiryulnikov, M.S. Ramm, A.I. Zhmakin, Yu.N. Makarov, Virtual
reactor as a new tool for modeling and optimization of SiC bulk crystal growth, Journal
of Crystal Growth, 225 (2001) 307
29. James E. Huheey, Inorganic Chemistry Principles of structure and reactivity, Prentice
Hall, 1972
30. O. Feron, F. Langlais, R. Naslain, J. Thebault, On kinetic and microstructural transitions
in the CVD of pyrocarbon from propane, Carbon 37 (1999) 1343
31. R. O. Grisdale, The formation of black carbon, Journal of applied physics, 24 (1953)
1082
32. Shun-ichi Nakamura, Tsunenobu Kimoto, Hiroyuki Matsunami, Satoru Tanaka, Nobuaki
Teraguchi, and Akira Suzuki, Formation of periodic steps with a unit-cell height on 6H–
SiC (0001) surface by HCl etching, Appl. Phys. Lett. 76, (2000) 3412
33. U. Forsberg et al, Nitrogen doping of epitaxial silicon carbide, J. Crystal Growth, vol.
236 (2002) 101
34. DJ Larkin, PG Neudeck, JA Powell, LG Matus, Site-competition epitaxy for superior
silicon carbide electronics, Applied Physics Letters, 65 (1994), 1659
Figure captions:

15
Fig. 1: Theoretically calculated (a) diffusivity versus molecular weight plot calculated for
various gases at 1 atm (760 torr) and 273oK, (b) diffusivity versus molecular weight plot for
various gases at 300 torr and 1823oK (1550
oC)

16
Fig. 2: a) Schematic of the CVD reactor used for growth calculation. b) Boundary layer at the
solid-gas interface.

17
Fig. 3: Schematic diagram and boundary conditions of the CVD furnace used in simulation. The
sticking coefficient for the growth surface is assumed to be 1, i.e., growth species adsorbed on
the substrate surface will participate in growth.

18
Fig. 4: Simulation of Si partial pressure at various growth pressures. Suppression of Si formation
in DCS is clearly seen at 30 torr. Temperatures at specific locations in the reactor are shown.
19
Fig. 5: Growth rate versus pressure for a) silane and b) DCS precursors: simulation and
experiments

20
Fig. 6: Temperature profile is shown using the Virtual Reactor (VR) simulation (left). The
dissected gas delivery tube is juxtaposed to observe parasitic deposition at various temperatures.

21
Fig. 7: Doping concentration versus growth pressure.

22
Fig. 8: (a) Simulated HCl partial pressure for various growth pressures for DCS. Temperatures at
specific locations in the reactor are shown. (b) AFM surface roughness at various growth
pressures for DCS precursor. (c) AFM images for epitaxy grown by silane precursor at various
growth pressures.

23
Table-1: Experimental and theoretical values of the diffusivities of various gas molecules in the
silane-propane and DCS-propane CVD chemistries at STP.
Molecule Molecular
weight
Diffusivity,
Do
(cm2/sec)
Calculated
(Fig. 1a)
Diffusivity,
Do
(cm2/sec)
[23]
SiH4 0.51
SiH2 0.54
SiH 0.54
Si 0.55
SiH2Cl2 0.38 SiCl2 0.39
SiHCl 0.44
SiCl 0.44
HCl 0.51 0.58
C3H8 0.37 0.52
C2H5 29 0.55 0.65 C2H4 28 0.55 0.66
C2H2 26 0.56 0.68 CH4 16 0.64 0.75 CH3 15 0.66 0.77

24
Table-2: Comparison of analytical calculation of diffusivity, boundary layer thickness and
growth rate for Silane and DCS.
Gas Diffusivity,
D (cm2/sec)
Boundary layer
thickness (mm)
Analytical
growth rate
(µm/hr)
Silane (SiH4) 33.6 8.8 7.5 um/hr
Dichlorosilane
(SiH2Cl2)
25.6 7.7 6.5 um/hr

25
Table-3: Dissociation bonding energies [29] for various bonds related to silicon carbide growth.
Bond KJ/mol
H-Cl 428.02
C-H 411
Si-Cl 381
C-C 345.6
Si-C 318
Si-H 318
Si-Si 222
C=C 602
C≡C 835.1