Embed Size (px)
Citation preview

European Journal of Advanced Research in Biological and Life Sciences Vol. 5 No. 3, 2017 ISSN 2056-5984
Progressive Academic Publishing, UK Page 1 www.idpublications.org
A COMPARATIVE STUDY OF KINETIC IMMOBILIZED YEAST
PARAMETERS IN BATCH FERMENTATION PROCESSES
Terkida Prifti (Vaso)
Faculty of Natural Sciences,
University of Tirana, Tirana,
ALBANIA
Luljeta Pinguli
Faculty of Natural Sciences,
University of Tirana, Tirana,
ALBANIA
Ilirjan Malollari
Faculty of Natural Sciences,
University of Tirana, Tirana,
ALBANIA
ABSTRACT
The rate of biochemical reactions in immobilized cell systems usually is lower compared to free cell
fermentation. Kinetic parameters modified resulting in different mathematical models, productivity
and rate. This paper is focused in kinetic parameters study (µmax, Ks, Ki) of immobilized yeast cells
in alginate matrix compared to free yeast cells parameters in batch fermentation processes. Using
different beads diameters, cell density, including substrate and product inhibition conditions. We
have evaluated kinetic parameters with three different linearization methods and mathematical
models that fits with experimental results. At non – inhibitory conditions immobilized yeast ferment
similiary to free yeast for small bead diameters. Due to bead diffusion resistance the differences
compared to free yeast system are notable with beads size increase. In inhibitory condition,
productvity and reaction rate are higher compared to free yeast fermentation. This is linear with
beads size increasing.
Keywords: Immobilized yeast, kinetic parameters, linearization, inhibition constant.
INTRODUCTION
The “white biotechnology”, the new concept proclaims that the use of renewable raw materials for
biofuels production by low expensive and ecofriendly biotechnologies constitutes one of the priority
of industrial activities. However, the economic feasibility of the ethanol industry is still questioned
and much effort should be put into improving the process, especially resistance to the main
inhibition factors.
To eliminate inhibition caused by high concentrations of substrate and product as well as to enhance
yield, cell immobilization approaches have been applied in ethanol production. The advantages of
immobilized cell over free cell systems have been extensively reported. Immobilized cell
fermentation has been shown to be more effective than the free yeast process, mainly due to the
enhanced fermentation productivity, feasibility for continuous processing, cell stability and lower
costs of recovery and recycling and downstream processing. However, immobilized cells still have
limited industrial application. The process of immobilization changes not only the environment, but
also the physiological and morphological characteristic of cells, and the catalitic activity of
enzymes. Therefore the fermentation conditions (kinetics) of the free yeast fermentation and of the
immobilized cell process are different.
Simulation investigations are proven to be powerful tools for evaluating the fermentation processes
alternatives that decrease spending of expenses on pilot experiments. The quality of the simulation
itself depends on the quality of the underlying mathematical model used fot prediction of the
responses of a given system to changes in environmental and operating conditional. Hence the
mathematical models should describe with sufficient accuracy the mechanisms of the processes
under consideration. For the purpose of bioprocesses simulation, kinetic models based on mass
balance of the main compounds in the bioreactor. Modeling batch fermentation process by the yeast
Saccharomyces Carlsbergensis in immobilized in Na-alginate gel beds were considered. They

European Journal of Advanced Research in Biological and Life Sciences Vol. 5 No. 3, 2017 ISSN 2056-5984
Progressive Academic Publishing, UK Page 2 www.idpublications.org
describe the main factors affecting the glucose concentration – substrate and product inhibition, but
none of them can account simultaneously for all of these factors. However there is no model
universal structure that could perfectly suit glucose fermentation by all possible kinds of strains
since each particular strain has its specifics that require an individual approach to kinetics modeling.
The yeast posses the ability to converse glucose under anaerobic conditions and the main final
products being the ethanol and carbon dioxide. The efficiency of the ethanol production by yeasts
can be affected by glucose or ethanol concentration, due to the specific phenomenon of substrate
and product inhibition. An interesting result has been obtained that the addition of ethanol in a
culture of Saccharomyces Carlsbergensis induces less toxic effect than that generated by ethanol
biosynthesized during the fermentation, the cells death occurring with lower rate in the former case.
This result could be explained by the presence of other metabolic products beside ethanol, these
secondary products contributing to the amplification of the inhibitory phenomenon.
MATERIALS and METHODS
The aim of our study was to carry out a comparative analysis of different mathematical structures
known by far for modeling of batch alcoholic fermentation with free and immobilized cells of
Saccharomyces Carlsbergensis using real experimental data. The two type of processes (with free
and immobilized cells) were compared with respect to the main model parameters that determine
the main interactions in the culture – inhibition and transformation of sugar to ethanol and biomass.
Conclusions were drawn about the influence of cell immobilization on the batch process. The main
purpose of this study was to choose the best model that will be further refined and used for control
synthesis of the process in order to increase its productivity. The equipment consists in eight conical
bioreactors (vessels) 250ml, where was placed the immobilized yeast with the entrapment method
and free yeast, in respective amount 1 and 2 g/l. For yeast cell immobilization solution of Na –
alginate was used. It was prepared by dissolving alginate in distilled water at constaint stirring until
a homogeneous solution was obtained.The immobilization has been carried out by cells inclusion
into the alginate matrix, respecting the entrapment method. The following diameters of the
biocatalyst spherical particles have been obtained: 4, 5.3 and 7 mm.The fermentations have been
carried out until a constant amount of glucose was taken, at the ambient temperature.
RESULTS and DISCUSSION
Glucose consumption and ethanol production
The experimental studies presented in this paper have been carried out at various glucose
concentrations, including here inhibitory and non-inhibitory substrate conditions. Immobilized
batch fermentation was analysed for three different bead size (4, 5.3 and 7 mm) and fermentation
performance was compared with free yeast fermentation.
Figure 1. Extract plot versus Time in 12 0 Plato batch fermentation
0
2
4
6
8
10
12
14
0 10 20 30 40 50
Extr
act
( ͦP
lato
)
Time (hour)
4mm
5.3mm
7mm
Free yeast

European Journal of Advanced Research in Biological and Life Sciences Vol. 5 No. 3, 2017 ISSN 2056-5984
Progressive Academic Publishing, UK Page 3 www.idpublications.org
Figure 2. Extract plot versus Time in 16 0Plato and 20
0Plato batch fermentation
Free fermentation perforformance in 12 Plato (Figure 1) compared to immobilized yeast
fermentation is better in terms of rate of substrate consumption and remain extraxt. A good
similiarity is noticed with 4 mm bead size fermentation. Higher the bead size larger are the
differences between imobilized and free yeast fermentation. In the case of substrate and product
inhibition (Figure 2 and 3) this dependence is the opposite. Residual extract remains higher in the
case of free yeast fermentation and the plot is distlinctly isolated from the others. Higher the bead
size lower is the residual extract.
Figure 3. Extract plot versus Time in 12 0 Plato + 5 % Alcohol and in 12
0 Plato batch fermentation
Figure 4. Ethanol plot versur Time in 12 0 Plato batch fermentation
0
0.5
1
1.5
2
2.5
3
3.5
4
0 10 20 30 40 50
Eth
ano
l ( ͦP
lato
)
Time (hour)
4mm
5.3mm
7mm
Free yeast
0
5
10
15
20
25
0 20 40 60
Extr
act
( ͦP
lato
)
Time (hour)
4mm 5.3mm 7mm Free yeast
0
5
10
15
20
0 20 40 60 80
Extr
act
( ͦP
lato
)
Time (hour)
4mm 5.3mm 7mm Free yeast
0 2 4 6 8
10 12 14
0 20 40 60
Extr
act
( ͦP
lato
)
Time (hour)
4mm 5.3mm 7mm Free yeast
9
10
11
12
13
14
0 20 40 60
Extr
act
( ͦP
lato
)
Time (hour)
4mm 5.3mm 7mm Free yeast

European Journal of Advanced Research in Biological and Life Sciences Vol. 5 No. 3, 2017 ISSN 2056-5984
Progressive Academic Publishing, UK Page 4 www.idpublications.org
Figure 5. Ethanol plot versus Time in 16 0 Plato and 20
0 Plato batch fermentation
Figure 6. Ethanol plot versus Time in 12 0 Plato + 5 % Alcohol and 12
0 Plato + 20 % Alcohol
batch fermentation
Ethanol production in 120 Plato free yeast fermentation is very close to 4mm fermentation (Figure
4).
In inhibitory conditions, substrate and product inhibition (Figure 5 and 6), productivity is higher in
immobilized yeast fermentation due to diffusion resistance of alginate matrice. The internal
diffusion reduces significantly the inhibitoty effect of glucose. But, in this case, the product
inhibition could become important, due to the low diffusion rate of ethanol towards the outer
medium and to its accumulation inside the particle.
Kinetic Parameters
The rate of biochemical reactions in heterogeneous systems is lower than that recorded for
homogeneous media, owing to the radial decreasing of the substrate concentration inside of the
0
1
2
3
4
5
6
7
0 20 40 60
Eth
ano
l ( ͦP
lato
)
Time (hour)
4mm 5.3mm 7mm Free yeast
0
0.5
1
1.5
2
2.5
3
3.5
0 20 40 60
Eth
ano
l ( ͦP
lato
)
Time (hour)
4mm 5.3mm 7mm Free yeast
0
1
2
3
4
5
6
0 20 40 60 80
Eth
ano
l ( ͦP
lato
)
Time (hour)
4mm 5.3mm 7mm Free yeast
-0.2
0
0.2
0.4
0.6
0.8
1
1.2
1.4
1.6
0 20 40 60
Eth
ano
l ( ͦP
lato
)
Time (hour)
4mm 5.3mm 7mm Free yeast

European Journal of Advanced Research in Biological and Life Sciences Vol. 5 No. 3, 2017 ISSN 2056-5984
Progressive Academic Publishing, UK Page 5 www.idpublications.org
biocatalyst particles. For the heterogeneous systems, not only the value of the biochemical reaction
rate is affected, but also the kinetic model is modified compared to the ideal models describing the
substrate cunsumpition or product formation.
For these reasons, the kinetic parameters of the biochemical reactions which involve immobilized
cells differ from those of homogeneous environments. For the analyzed fermentation systems, the
ethanol formation can be mathematical described by Monod equation:
max
s
1μ μ
s K=
+ (1)
The equation (1) can be used for fermentation systems without inhibitory phenomena. But the
inhibitory effects occur also in the case of alcoholic fermentation with immobilized yeast cells, the
most important being that induced by glucose. Therefore, taking into account the substrate
inhibition, the Monod equation can be written for the immobilized cells as follow as:
max
s i
s sμ μ exp
s K K
æ öç ÷= -ç ÷ç ÷ç ÷+ è ø
(2)
When we have product inhibition the equation can be:
( )max i
s
sμ μ exp K * p
s K= -
+ (3)
After the determination of the kinetic parameters, various mathematical models were ploted for
each fermentation. These plots were compared with the experimental plot. An example of
mathematical modeling is shown in Figure 7.
Figure 7. Example of mathematical modeling
From the obtained results it is difficult to choose a single best fitting model. Good approximation
potencial was shown by the model of Monod, Teisser, Aiba. For substrate and product inhibition
the most approximate models were exponential. Non-inhibitory fermentations fit with the Monod
model, while product and substrate inhibition fermentation fits with exponential models.
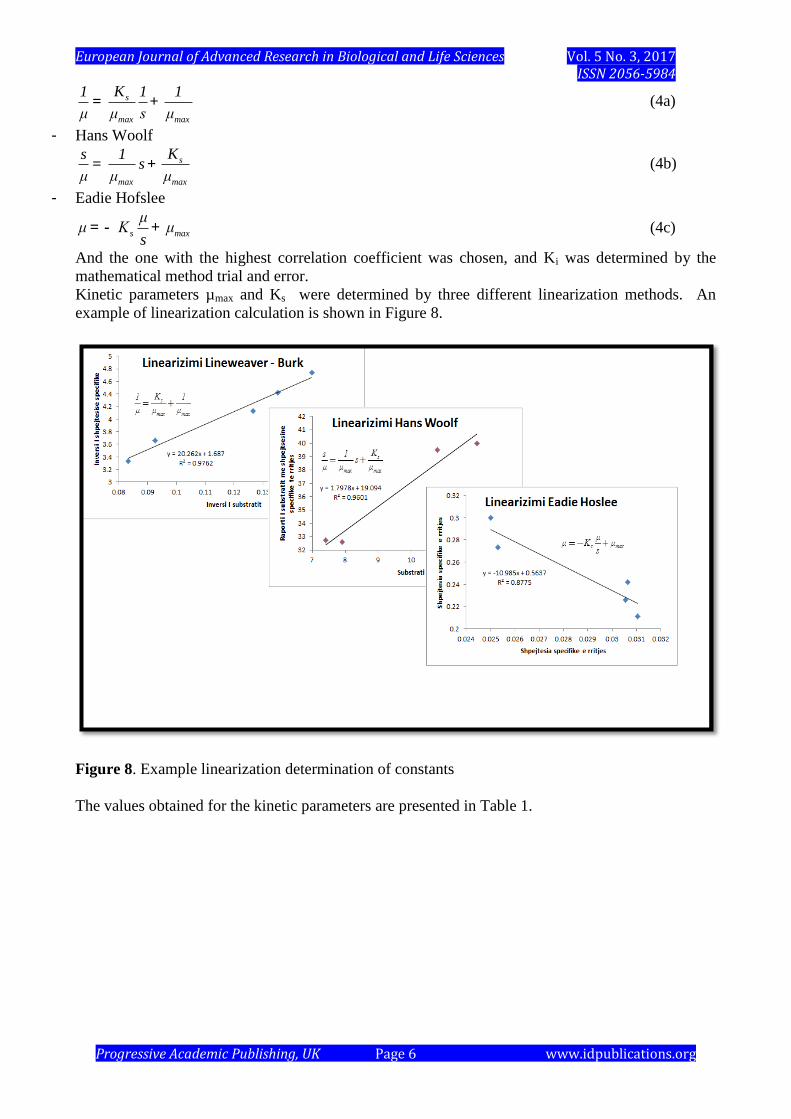
Three linearization methods were used to determine maxμ and Ks, which are:
- Lineweaver – Burk
European Journal of Advanced Research in Biological and Life Sciences Vol. 5 No. 3, 2017 ISSN 2056-5984
Progressive Academic Publishing, UK Page 6 www.idpublications.org
s
max max
K1 1 1
μ μ s μ= + (4a)
- Hans Woolf
s
max max
Ks 1s
μ μ μ= + (4b)
- Eadie Hofslee
s max
μμ K μ
s= - + (4c)
And the one with the highest correlation coefficient was chosen, and Ki was determined by the
mathematical method trial and error.
Kinetic parameters µmax and Ks were determined by three different linearization methods. An
example of linearization calculation is shown in Figure 8.
Figure 8. Example linearization determination of constants
The values obtained for the kinetic parameters are presented in Table 1.

European Journal of Advanced Research in Biological and Life Sciences Vol. 5 No. 3, 2017 ISSN 2056-5984
Progressive Academic Publishing, UK Page 7 www.idpublications.org
Table 1. Kinetic parameters for each fermentation
μmax Ks Ki Yp/s Yx/s R
Unit 1/hour °Plato °Plato - - %
Fermentation
1
4 mm 0.593 12.01 - 0.5 0.00114 97.6
5.3 mm 0.34 7.145 - 0.5 0.0021 82.8
7 mm 0.385 10 - 0.5 0.0023 66.3
Free
yeast
0.711 14.413 - 0.5 0.09881 89.3
Fermentation
2
4 mm 5.78 118.844 - 0.5 0.0039 82.7
5.3 mm 0.087 12.38 - 0.5 0.0118 63.6
7 mm 2.924 69.941 - 0.5 0.0118 79.3
Free
yeast
0.077 13.06 - 0.5 0.1079 71.3
Fermentation
3
4 mm 0.471 20.94 104.7 0.5 0.0117 93.8
5.3 mm 0.839 42.718 213.6 0.5 0.0126 93.1
7 mm 0.406 22.94 114.7 0.5 0.0127 97.3
Free
yeast
0.384 24.894 124.47 0.5 0.0669 91.6
Fermentation
4
4 mm 0.321 22.793 113.965 0.5 0.0101 95.17
5.3 mm 0.425 29.701 148.505 0.5 0.0132 91.01
7 mm 0.412 27.629 138.145 0.5 0.0134 87.58
Free
yeast
0.208 23.638 118.19 0.5 0.0624 95
Fermentation
5
4 mm 0.135 14.79 0.1 0.5 0.0143 98.3
5.3 mm 0.018 9.316 0.09 0.5 0.0162 68.1
7 mm 0.167 0.613 0.006 0.5 0.0217 80.7
Free
yeast
0.11 18.54 0.18 0.5 0.1148 97.1
Fermentation
6
4 mm 0.009 12.37 0.12 0.5 0.0059 99.9
5.3 mm 0.005 11.84 0.11 0.5 0.0095 94.4
7 mm 0.011 12.51 0.12 0.5 0.0064 99.6
Free
yeast
0.00008 12.3 0.12 0.5 0.1975 99
The results indicate that the inhibition constant has an unique value indifferent of the biocatalyst
particles size, but depending on their concentration. The Monod constant is influenced by the size
and concetration of biocatalyst particles. The maximum rate of ethanol production is favorably
influenced by the increase of the biocatalysts concentration, and is affected by their size.
The Monod constant is greater compared with homogeneous systems fermentation by the internal
diffusion. Besides the positive exhibited by the attenuation of the inhibitory phenomena, the
immobilization of yeast cells affects the fermentation rate compared to the systems without
inhibition contationing free yeast cells.
In the case of the free cell fermentation, we have high values of the parameters Ks and YX/S. In case
of substrate inhibition, we have the impact of the inhibition constant Ki, that reduces the maximum
specific growth rate and increases the semi saturation constant Ks. In case of product inhibition, the
values of Ki parameter is very low. This is because the obtained ethanol concentration is much
lower than the concentration that causes complete cell growth inhibitionfor our experimental data.
European Journal of Advanced Research in Biological and Life Sciences Vol. 5 No. 3, 2017 ISSN 2056-5984
Progressive Academic Publishing, UK Page 8 www.idpublications.org
CONCLUSIONS
The studies on the substrate consumption and product formation rates during the alcoholic
fermentation with immobilized yeast cells compared to free yeast performance show that
immobilized yeast ferment similiary to free yeast for small bead diameters. Higher the bead size
larger are the differences between imobilized and free yeast fermentation.
In inhibitory conditions, substrate and product inhibition productivity is higher in immobilized yeast
fermentation. Due to other diffusion inside the biocatalyst particles, the inhibitory phenomena are
avoided, the microbial activity being preserved.
Using a specific mathematical model for ethanol formation in the investigated systems, the kinetic
parameters μmax, Ks and Ki have been estimated and compared with their values reported for
alcoholic fermentation in homogeneous media in presence or not of inhibitory effects.
It was considered also modeling of batch fermentations with free and immobilized yeasts. Non-
inhibitory fermentations fits with the Monod model, while product and substrate inhibition
fermentation fits with exponential models.
Based on fermentation performance, kinetic parameters and mathematical models we conclude that
immobilised yeast cells in normal conditions ferment similarly to the free yeast. Immobilization
decrease the substrate and product inhibition phenomena compared to free yeast fermentation.
REFERENCES
1. Najafpour G, Younsei H, Syahidah K, Ismail K. Ethanol fermentation in an immobilized cell
reactor using S. Cerevisiae. Biores Technol 2004; 92;251-60
2. Aiba S, Shoda M, Nagatani M. Kinetic of product inhibition in alcohol fermentation. Biotechnol
Bioeng 2000; 67;671-90
3. Luljeta Xhagolli, Ilirjan Malollari. Inxhinieria e proceseve biokimike. 2009
4. Arellano-Plaza M, Herrera-López EJ, Díaz-Montaño DM, Moran A,Ramírez-Córdova JJ (2007).
Unstructured Kinetic Model for Tequila Batch Fermentation. Int. J. Math Comput. Simul, Vol. 1,
Num. 1
5. Kosaric N., Vardar-Sukan F. (2001) In: The Biotechnology of Ethanol (M. Roehr, Ed.), WILEY-
VCH Verlag GmbH, Weinheim, pp.87-90.
6. Kostov G. (2007) Investigation of Fermentation Systems for Ethanol Production, PhD thesis,
University of Food Technologies, Plovdiv, Bulgaria, p.180. (In Bulgarian)