Embed Size (px)
Citation preview

Program on Science and Global Security Woodrow Wilson School of Public and International Affairs Princeton University
A Comparative Study of Four States’ Public Health Systems: Survey Results from Local Health Departments, Physicians and Veterinarians
by Laura H. Kahn, M.D., M.P.H., M.P.P.
FINAL REPORT
to the Josiah Macy, Jr. Foundation, August 2006
A Comparative Study of Four States’ Public Health Systems: Survey Results from Local Health Departments, Physicians, and Veterinarians
Laura H. Kahn, MD, MPH, MPP Program on Science and Global Security Woodrow Wilson School of Public and International Affairs Princeton University 221 Nassau Street, 2nd floor Princeton, New Jersey 08542 Tel: (609) 258-6763 Fax: (609) 258-3661 [email protected]


Acknowledgements
I would like to thank Dr. June E. Osborn and the Josiah Macy, Jr. Foundation for their support of this project. In addition, I am most grateful to all the public health and agriculture officials, physicians, and veterinarians who generously donated their time to help with this project. I am also fortunate to have had Jean Atcheson’s excellent help in editing this final report.


Table of Contents
Page I. Executive Summary and Key Findings 1 II. Introduction 3 III. Survey Methods 7 IV. Final Results of the Project Activities 9
State and Local Leadership 9 Disease Surveillance and Data Management 10
Laboratory Capabilities and Specimen Submissions 14 Clinical Capabilities 15 Communications 17 Attitudes Regarding Public Health Capabilities 19 Local Public Health and Federal Biodefense Funding 20 V. Discussion 22
State and Local Leadership 22 Disease Surveillance and Data Management 24
Laboratory Capabilities and Specimen Submissions 29 Clinical Capabilities 30 Communications 31 Attitudes Regarding Public Health Capabilities 32 Local Public Health and Federal Biodefense Funding 34 VI. Conclusions and Recommendations 35 VII. Epilogue 39 Appendix A. State and Local Public Health Infrastructures and
Demographics A-1
Appendix B. Study Methods and Respondent Demographics B-1
Appendix C. State and Local Leadership C-1 Appendix D. Disease Surveillance and Data D-1
Appendix E. Laboratory Capabilities and Specimen Submissions E-1 Appendix F. Clinical Capabilities F-1 Appendix G. Communications G-1
Page Appendix H. Attitudes Regarding Public Health Capabilities H-1 Appendix I. Local Public Health Funding I-1 Appendix J. Laboratory Roles and Public Oversight J-1 Appendix K. Local Public Health Agency, Physician, and
Veterinarian Comments K-1 Endnotes EN-1

1
I. Executive Summary and Key Findings
This two-year study examined how four northeastern states–New Hampshire, New Jersey, New York, and Pennsylvania–were preparing for potential outbreaks of infectious diseases, whether naturally occurring or resulting from bioterrorism. Since the anthrax attacks of 2001, the federal government has allocated millions of dollars to states to improve their capabilities.1 Have these funds been adequately distributed? Have state and local capabilities actually improved as a result? Short of an actual event, how can the states’ capabilities be adequately assessed? This cross-sectional, observational study involved surveying all local health agencies as well as random samples of physicians and veterinarians who practiced in these states. A midterm report presented the results of a series of interviews with state public health and agriculture officials. Against the background of these initial results, this final report discusses the findings from surveys of local public health agencies, physicians, and veterinarians in the four selected states. These surveys included questions on leadership, infectious disease surveillance and reporting, laboratory capabilities, clinical capabilities, communications, and funding. The responses involving leadership and disease reporting were analyzed using a systems-analysis approach. The key findings are listed below.
• For human public health, there is confusion between political and professional leadership. Most of those surveyed believed that professional appointees, such as public health commissioners, would serve as the leaders during a public health crisis, even though in two of the states studied, this assumption was incorrect: in fact, the elected officials would be the leaders. This confusion did not exist for animal public health: in all four states, all the leaders would be professional appointees, not elected officials.
• There is minimal physician and veterinarian engagement with local public health
organizations. More than a quarter of physician and veterinarian respondents did not even know if their community had a local public health agency.
• There is minimal communication between the physicians and veterinarians. To
improve responses to future outbreaks of zoonotic infectious disease, forums, conferences, and exchanges should be encouraged between physicians and veterinarians to increase collaboration and communication between these two professional groups. A number of physicians indicated that these issues were not relevant to their practice since they were specialists. However, most of the veterinarians surveyed were generalists and believed that these issues were relevant for them.
• Commercial and hospital laboratories, not physicians or infection-control nurses,
are the primary sources of infectious disease reporting for local public health agencies. A larger percentage of physicians then veterinarians did not know

2
where to send laboratory specimens if they had a patient with an unusual infectious disease.
• With the exception of New York State, few local public health agencies were able
to provide incidence-rate data for many vaccine-preventable diseases in humans.
• Very few physicians are employed full-time or even part-time by local public health agencies. Though more nurses are employed, there are not enough to provide clinical services during a crisis. In a crisis situation, public health would be almost entirely dependent upon volunteers, local clinics, and the National Guard for out-of-hospital clinical and preventive services.
• Vaccination and disease statistics for all species of animals were lacking in all
four states. In the case of livestock, farmers’ reluctance to have issues involving proprietary and confidential information made openly available to public health professionals and/or to the public may play a role in creating this unsatisfactory situation.
• Physicians’ and veterinarians’ opinions of local public health agency capabilities
during a crisis were uniformly low.
• Local public health agencies that depended upon local sources for their primary funding were 11 times less likely to have received federal biodefense funds than agencies that received most of their funding from their state.
• Local public health agencies that had received federal biodefense funding were
more likely to have hired new surveillance staff and purchased new equipment, and consider themselves more capable of responding to a severe outbreak than were other agencies that had not received such funds.
3
II. Introduction Findings from interviews with health and agriculture officials in New Hampshire, New Jersey, New York, and Pennsylvania were discussed in detail in the midterm report, issued in May 2004. Several of these findings provided fresh impetus for the surveys conducted the following year with the local health departments, physicians, and veterinarians. In order to control an unusual outbreak, such as SARS, avian influenza or smallpox, good surveillance mechanisms, contact tracing capabilities, quarantine, and mass vaccinations are required; so are well-trained and qualified individuals who can carry out this work. The goal was to get a picture of how well these states were prepared for future outbreaks of disease, both naturally and deliberately initiated. The states differed dramatically in terms of their public health infrastructures. These differences affected the state and local agencies’ interactions with the physicians and veterinarians who are in effect, the eyes and ears of public health.2 Lacking the cooperation of these all-important professionals to promptly notify public health or agriculture officials about communicable diseases in their patients, outbreak responses could be delayed with potentially serious consequences.
For example, during the 2003 monkeypox outbreak in Illinois, Indiana, and Wisconsin, public health authorities were notified only after the initial patient, a three-year-old girl, required hospitalization, which was at least eight days after she first became ill.3 Another report stated that it was two weeks before the case was reported.4 While the delay in reporting did not appear to have any serious adverse consequences on the containment efforts for this poxvirus, had the pathogen been smallpox it could have been a disaster.
The importance of physician and veterinarian cooperation cannot be sufficiently stressed. David Ashford and his colleagues at the Centers for Disease Control and Prevention (CDC) determined that the most critical component for bioterrorism outbreak detection is rapid communication and cooperation between health care professionals and public health departments. Ashford’s group examined all the investigations of outbreaks, including pathogens with bioterrorism potential that had been conducted by the CDC’s Epidemic Intelligence Service (EIS) between 1988 and 1999. They found that health care providers and infection-control practitioners accounted for the largest fraction, approximately one-third, of the incidents reported.5 6 Other reporting sources included health departments (30.5 percent), surveillance systems (5 percent), foreign ministries of health (2.7 percent), nongovernmental organizations (2 percent), and the World Health Organization (1.5 percent). The authors noted that many of these other sources were probably notified initially by frontline practitioners. The number of days between the initial onset of disease symptoms and reporting ranged from 0 to 26 days. Reasons for these delays were not given. Although animal disease outbreak investigations were not included in the study, Ashford and his colleagues stressed that timely reporting by veterinarians to the proper authorities would be critical

4
during an outbreak of disease that was zoonotic (i.e., potentially communicable from animals to humans) or non-zoonotic.7
The issue of physician and veterinarian performance during initial outbreak recognition is complicated. Not only must the medical and veterinary medical professionals recognize that a problem exists, they must also notify the relevant human and animal public health agencies about a possible outbreak. In the United States, the medical and veterinary health care systems are, in general, completely separate from public health and agriculture, hence the interactions between them are far from seamless. With this scenario, it is easy to blame individuals for poor performance, which does nothing to improve the situation. Rather than focus on individual factors, therefore, systems analysis, specifically, “patient safety” systems analysis, was used to better understand how communications between physicians, veterinarians, and human and animal public health professionals could be improved. Patient Safety and Systems Analysis In 1999, the Institute of Medicine issued a report, To Err is Human, which highlighted the finding that as many as 45,000 to 98,000 Americans die each year from medical errors in hospitals.8 The authors of this report recommended that the health care industry should learn from safety experts in other fields, such as the airline industry, who design systems that minimize errors. Accreditation agencies, such as the Joint Commission on the Accreditation of Healthcare Organizations (JCAHO), and hospitals are working to implement many of this report’s recommendations.9 While, admittedly, many of these safety systems involve technical industries, some of the same principles could be applied to any system involving human performance. The systems of interest in this project involve local and state public health agencies as well as state agriculture agencies. Safety systems theory proposes that errors can be diminished through effective designs such as simplification, standardization, feedback mechanisms, and open, bidirectional communications.10 For example, a physician who must interact with a complicated and disorganized public health infrastructure might be more likely to encounter reporting difficulties than one who works in a state with a simple, easy-to-understand system. In other words, the more “red tape” or bureaucratic complexity a health care professional encounters in trying to notify government officials about a concern, the more likely he or she is to contact the wrong individual (or agency), be bounced from person to person (or agency to agency), and/or give up in frustration.
Internet reporting could reduce some of the bureaucratic red tape, although not all health care professionals or veterinarians have internet capabilities, or even computers. If they did have these capabilities, they would still need to know the correct web site for online reporting. An additional challenge is that not all states and local public health agencies have computers or web sites with online reporting capabilities, although this situation is improving. In order for this recommendation to work satisfactorily, both health care professionals and public health agencies need to have comparable communication
5
capabilities. For the public health agencies, at least, federal initiatives such as the Center for Disease Control’s (CDC) National Electronic Disease Surveillance System (NEDSS), which first received congressional funding in 1999, are helping to improve the situation.11 Public Health Systems For the purposes of this study only, the four states’ public health systems were categorized as either “simple” or “complex.” “Simple” was defined as a state system found to be internally orderly, coherent, and easy to understand; there were two or fewer categories of types of agencies in the local public health infrastructure. (See Table 2.1.) In contrast, a “complex” state system lacked both internal consistency and coherence, and was difficult to understand.12 These systems had three or more categories of agencies in the local public health infrastructure. None of the states had analogous local agricultural agencies, so the system of categorization was based on local public health organizations only. However, reporting preferences, particularly for animal diseases, differed among states. This issue is discussed later in this report under disease surveillance. In all four states, state laws directed the development of the local public health infrastructures. New Hampshire and Pennsylvania have no state laws requiring a local public health infrastructure;13 New Jersey’s state law requires local public health capabilities at the municipal level; New York’s law establishes requirements at the county level.14
New Hampshire and New York were categorized as “simple” systems. New Hampshire has two local health departments, in Manchester and Nashua. The rest of the state, which is small and sparsely populated, is covered by the state health department. In New York State, virtually all the counties, 57 out of 62, have county-level local health departments. Both states have two or fewer categories of types of local public health infrastructures. New York City operates under the same state public health law as the rest of the state, and is the largest recipient of Article 6 state reimbursement. It also has a city health code that can go beyond the state requirements.
In contrast, New Jersey and Pennsylvania were categorized as “complex” systems. New Jersey has approximately 115 local health departments: 51 municipal, 41 multi-municipal, 16 county, and 7 regional. In addition, there are 22 Local Information Network Communication Systems (LINCS) agencies that are funded separately from the local public health agencies, but are considered part of the system to enhance surveillance capabilities. Pennsylvania has nine local health departments: 4 are municipal health departments, including the city of Philadelphia and 5 are county-level. The rest of the state is divided into six districts that are run by the state. These two states have three or more categories of local public health infrastructures. (See Table 2.2.)

6
Table 2.1 - Number of Categories of Local Public Health Infrastructures (LPHI) by State
Table 2.2 - State Classification According to Local Public Health Infrastructure (States with 3 or more LPHI are considered “complex”) The goal was to determine if there was an association between the level of complexity of the states’ public health infrastructure and their physicians’ and veterinarians’ knowledge of public health preparedness and infectious-disease reporting. Appendix A contains each state’s unique demographic data.
State Regions Districts County Multi-Municipal Municipal Total
LPHI New Hampshire X 1 New Jersey X X X X 4 New York X X 2 Pennsylvania X X X 3
State Total LPHI Category
New Hampshire 1 Simple New Jersey 4 Complex New York 2 Simple Pennsylvania 3 Complex

7
III. Survey Methods
The surveys were designed to be as parallel as possible in order to assess levels of understanding between the three different respondent groups–local public health systems, physicians, and veterinarians–in each state. All were developed with considerable input from health policy, medical, and veterinary experts.15 16 Each survey was pilot-tested with individuals possessing credentials comparable to those of the subjects who would be completing them. The surveys were approved by Princeton University’s Institutional Review Panel for Human Subjects. The names and addresses of the licensed physicians and veterinarians in three states: New Hampshire, New Jersey, and Pennsylvania, were available for purchase. However, New York has a policy of not releasing this information, so it was necessary to substitute physician and veterinarian data purchased from the Medical Society of the State of New York (MSSNY) and the American Veterinary Medical Association (AVMA), respectively. The MSSNY list included a random sample of members and nonmembers; however, the physicians selected included a disproportionately greater percentage of primary care providers than in the three other states (see Appendix B, Table 1). This inherent bias in the sample required statistical adjustment during the analysis. Although the AVMA list of New York veterinarians also led to inherent biases in the sample, the veterinary specialties represented in the sample did not differ appreciably from those in the other three states.
The Princeton Survey Research Center constructed the final physician and veterinarian samples by drawing random samples from the purchased states’ or professional societies’ databases. The goal was to survey approximately 5,000 physicians and veterinarians in the expectation of response rates around 25 percent, producing final samples consisting of approximately 1,000 physicians and 1,000 veterinarians. Ideally, equal numbers of these professionals would be represented in each of the four states. Descriptions of the survey universe, sample sizes, and respondent sizes appear in Appendix B, Table 2.
The final response rates are listed in Appendix B, Table 2. Unfortunately, the physician response rate was far lower than anticipated–only 12 percent overall. Physicians are notoriously difficult to survey because they are inundated with mail, surveys, paperwork, and patient care responsibilities. However, aside from New York, which had a disproportionately low response rate and a higher percentage of primary care specialists, the samples of physicians who responded in the other three states appeared to be somewhat representative of the overall composition of physician specialties across the United States.17 Approximately 42 percent of the respondents categorized their practice as being >50 to 100 percent primary care. In 2001, approximately 36 percent of the total physicians in the United States were classified as primary care providers.16 The medical specialties and demographics of the physicians who responded are listed in Appendix B, Tables 3 and 4. Demographically, almost three-quarters of them were male with an average age of 50 years old. Forty-four percent had been in practice for more than 20 years.
8
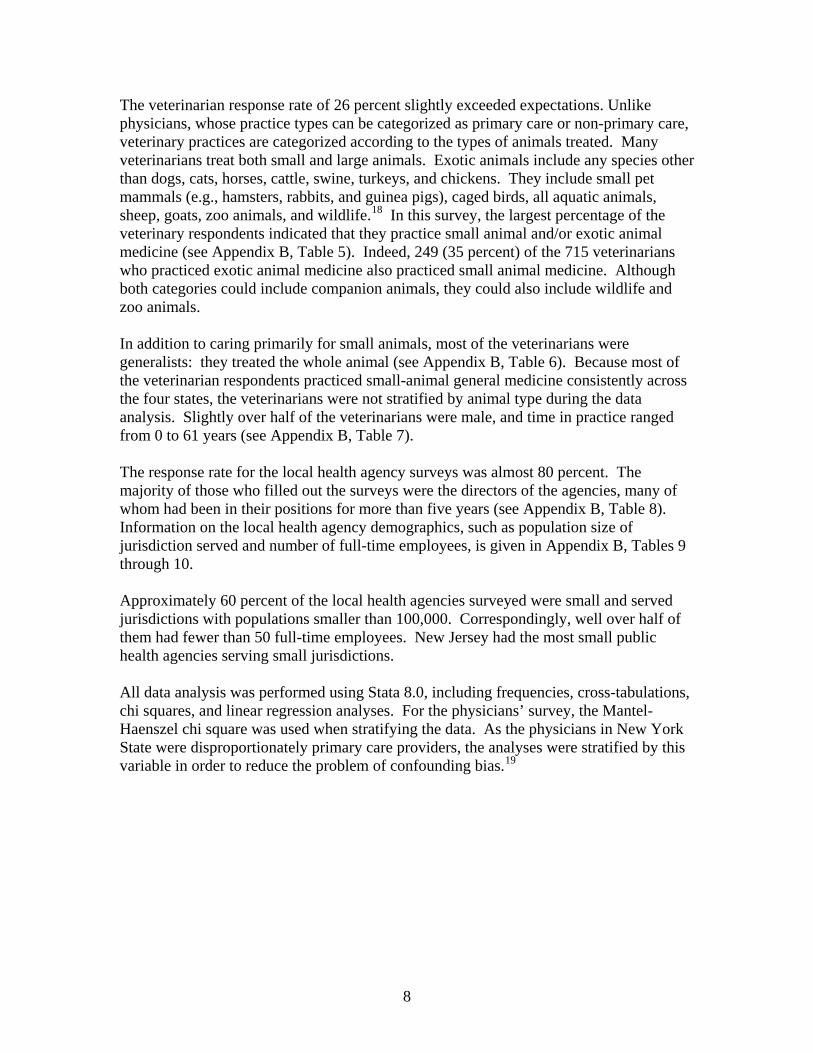
The veterinarian response rate of 26 percent slightly exceeded expectations. Unlike physicians, whose practice types can be categorized as primary care or non-primary care, veterinary practices are categorized according to the types of animals treated. Many veterinarians treat both small and large animals. Exotic animals include any species other than dogs, cats, horses, cattle, swine, turkeys, and chickens. They include small pet mammals (e.g., hamsters, rabbits, and guinea pigs), caged birds, all aquatic animals, sheep, goats, zoo animals, and wildlife.18 In this survey, the largest percentage of the veterinary respondents indicated that they practice small animal and/or exotic animal medicine (see Appendix B, Table 5). Indeed, 249 (35 percent) of the 715 veterinarians who practiced exotic animal medicine also practiced small animal medicine. Although both categories could include companion animals, they could also include wildlife and zoo animals.
In addition to caring primarily for small animals, most of the veterinarians were generalists: they treated the whole animal (see Appendix B, Table 6). Because most of the veterinarian respondents practiced small-animal general medicine consistently across the four states, the veterinarians were not stratified by animal type during the data analysis. Slightly over half of the veterinarians were male, and time in practice ranged from 0 to 61 years (see Appendix B, Table 7).
The response rate for the local health agency surveys was almost 80 percent. The majority of those who filled out the surveys were the directors of the agencies, many of whom had been in their positions for more than five years (see Appendix B, Table 8). Information on the local health agency demographics, such as population size of jurisdiction served and number of full-time employees, is given in Appendix B, Tables 9 through 10.
Approximately 60 percent of the local health agencies surveyed were small and served jurisdictions with populations smaller than 100,000. Correspondingly, well over half of them had fewer than 50 full-time employees. New Jersey had the most small public health agencies serving small jurisdictions.
All data analysis was performed using Stata 8.0, including frequencies, cross-tabulations, chi squares, and linear regression analyses. For the physicians’ survey, the Mantel-Haenszel chi square was used when stratifying the data. As the physicians in New York State were disproportionately primary care providers, the analyses were stratified by this variable in order to reduce the problem of confounding bias.19
9
IV. Final Results of the Project Activities
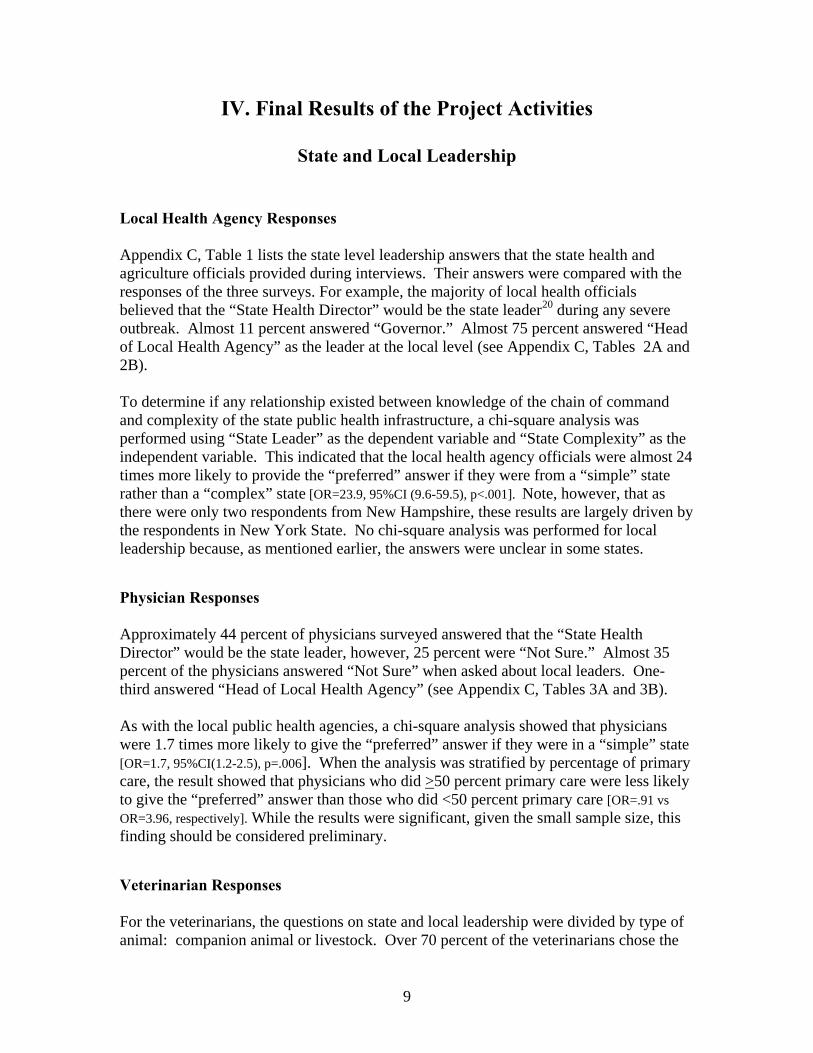
State and Local Leadership Local Health Agency Responses Appendix C, Table 1 lists the state level leadership answers that the state health and agriculture officials provided during interviews. Their answers were compared with the responses of the three surveys. For example, the majority of local health officials believed that the “State Health Director” would be the state leader20 during any severe outbreak. Almost 11 percent answered “Governor.” Almost 75 percent answered “Head of Local Health Agency” as the leader at the local level (see Appendix C, Tables 2A and 2B). To determine if any relationship existed between knowledge of the chain of command and complexity of the state public health infrastructure, a chi-square analysis was performed using “State Leader” as the dependent variable and “State Complexity” as the independent variable. This indicated that the local health agency officials were almost 24 times more likely to provide the “preferred” answer if they were from a “simple” state rather than a “complex” state [OR=23.9, 95%CI (9.6-59.5), p<.001]. Note, however, that as there were only two respondents from New Hampshire, these results are largely driven by the respondents in New York State. No chi-square analysis was performed for local leadership because, as mentioned earlier, the answers were unclear in some states. Physician Responses Approximately 44 percent of physicians surveyed answered that the “State Health Director” would be the state leader, however, 25 percent were “Not Sure.” Almost 35 percent of the physicians answered “Not Sure” when asked about local leaders. One-third answered “Head of Local Health Agency” (see Appendix C, Tables 3A and 3B). As with the local public health agencies, a chi-square analysis showed that physicians were 1.7 times more likely to give the “preferred” answer if they were in a “simple” state [OR=1.7, 95%CI(1.2-2.5), p=.006]. When the analysis was stratified by percentage of primary care, the result showed that physicians who did >50 percent primary care were less likely to give the “preferred” answer than those who did <50 percent primary care [OR=.91 vs OR=3.96, respectively]. While the results were significant, given the small sample size, this finding should be considered preliminary. Veterinarian Responses
For the veterinarians, the questions on state and local leadership were divided by type of animal: companion animal or livestock. Over 70 percent of the veterinarians chose the

10
“State Veterinarian” for the leader at the state level. At the local level, the veterinarians’ answers were tied between “Head of Local Health Agency” and “Not Sure” for both companion animals and livestock. There were no statistical differences between answers and type of state (see Appendix C, Tables 4A – 4D).
Disease Surveillance and Data Management One of the goals of the survey was to determine if local health agencies conducted disease surveillance and data analysis. Because physicians and veterinarians are the key participants in this endeavor, it was important to assess if they knew where to report, since each state differed in this regard. For example, in New Hampshire, physicians are expected to report notifiable cases directly to the state health department. In New Jersey, reports should go to the responsible local health department, and in New York, to the local health department in the jurisdiction in which the patient resides. In Pennsylvania, physicians report to the local agency in the patient’s residence area, or to the National Electronic Disease Surveillance System (NEDSS), which goes directly to the state’s health department.21
For animal diseases, reporting also varies by state. In New Hampshire and Pennsylvania, all animal diseases are reportable to the Departments of Agriculture. In New Jersey and New York, the answer is not entirely clear. In New Jersey, animal diseases should be reported to the Department of Agriculture unless there is zoonotic concern (that the disease might be transferable to humans), in which case they should be reported to local health departments.22 In New York State, animals suspected of having rabies are handled by the county health departments, all other animal diseases get reported to the Department of Agriculture.23
To ascertain if splitting animal disease reporting between two agencies led to greater confusion for the veterinarians, the states were reclassified according to whether or not they split animal disease reporting between two agencies. In this case, New Hampshire and Pennsylvania were classified as “simple” because all animal diseases get reported to their respective Departments of Agriculture.24 New Jersey and New York were classified as “complex” because reporting is split between the Departments of Agriculture and local departments of health. (See Table 4.1.)
11
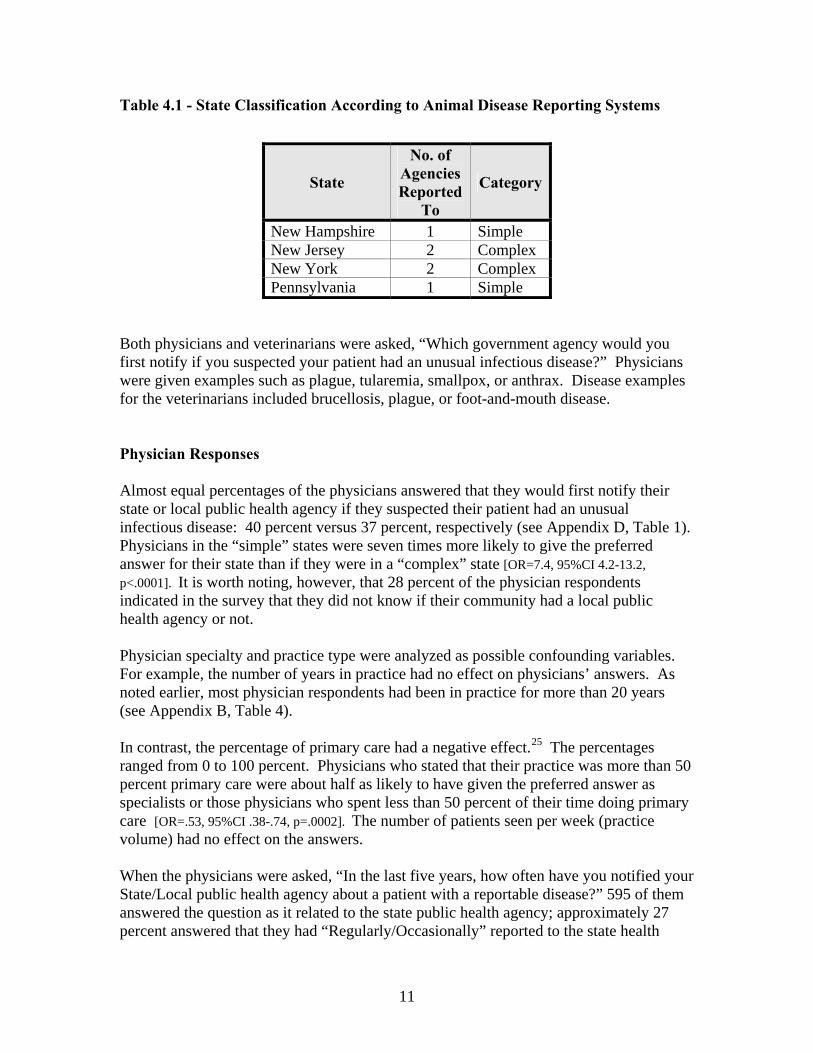
Table 4.1 - State Classification According to Animal Disease Reporting Systems
Both physicians and veterinarians were asked, “Which government agency would you first notify if you suspected your patient had an unusual infectious disease?” Physicians were given examples such as plague, tularemia, smallpox, or anthrax. Disease examples for the veterinarians included brucellosis, plague, or foot-and-mouth disease. Physician Responses Almost equal percentages of the physicians answered that they would first notify their state or local public health agency if they suspected their patient had an unusual infectious disease: 40 percent versus 37 percent, respectively (see Appendix D, Table 1). Physicians in the “simple” states were seven times more likely to give the preferred answer for their state than if they were in a “complex” state [OR=7.4, 95%CI 4.2-13.2, p<.0001]. It is worth noting, however, that 28 percent of the physician respondents indicated in the survey that they did not know if their community had a local public health agency or not. Physician specialty and practice type were analyzed as possible confounding variables. For example, the number of years in practice had no effect on physicians’ answers. As noted earlier, most physician respondents had been in practice for more than 20 years (see Appendix B, Table 4).
In contrast, the percentage of primary care had a negative effect.25 The percentages ranged from 0 to 100 percent. Physicians who stated that their practice was more than 50 percent primary care were about half as likely to have given the preferred answer as specialists or those physicians who spent less than 50 percent of their time doing primary care [OR=.53, 95%CI .38-.74, p=.0002]. The number of patients seen per week (practice volume) had no effect on the answers.
When the physicians were asked, “In the last five years, how often have you notified your State/Local public health agency about a patient with a reportable disease?” 595 of them answered the question as it related to the state public health agency; approximately 27 percent answered that they had “Regularly/Occasionally” reported to the state health
State
No. of Agencies Reported
To
Category
New Hampshire 1 Simple New Jersey 2 Complex New York 2 Complex Pennsylvania 1 Simple
12
department. Only 346 physicians answered the question in connection with reporting to local public health agencies. Of these, approximately 38 percent said that they had reported to their local public health agency “Regularly/Occasionally” in the previous five years (see Appendix D, Table 2).
The simplicity/complexity of the state had less of an impact than specialty type and practice volume on whether or not physicians had reported in the previous five years. Physicians who did 50 percent or less primary care were five times more likely to have reported to a local health agency and almost four times more likely to have reported to the state health agency in the previous five years [ORLHA=.19, 95%CI .12-.32, p<.00001; ORSTATE=.28, 95%CI .19-.41, p<.00001].
Physicians who saw more than 78 patients per week were 2.9 times more likely to report to a local public health agency than were physicians with lower practice volumes [OR=2.9, 95%CI 1.8-4.6, p<.00001]. Similarly, physicians with high-volume practices were 2.1 times more likely to report to their state health agency than were those with low volumes [OR=2.1, 95%CI 1.43-3.1, p=.0001]. The number of years in practice had no effect on reporting. In the interests of quality improvement, the physicians were asked how satisfied they were with their state and local public health agencies’ responses after they had reported a notifiable case. Overall, 67 percent of the physicians answered that they were satisfied with their state agency’s handling of the case, and 75 percent were satisfied with their local health agency’s response. The New York state and local public health agencies received the highest ratings (see Appendix D, Table 3). Additional questions pertaining to disease surveillance included “What is the most important factor in determining whether or not you would participate in a regular, voluntary online disease reporting and surveillance program?” and “If you were to participate in a voluntary online reporting and surveillance program, how often would you prefer to report?” Over half (308/595) of the physicians indicated that ‘time required’ was the most important factor for participating in an online disease reporting program. The next most frequently cited factor (142/595) was ‘usefulness to public health’. Forty percent of the physicians would be willing to report monthly. The next most frequent answer (24 percent) was every three months. Veterinarian Responses Veterinarian responses were divided according to whether the questions pertained to companion animals or livestock.26 For companion animals, 32 percent of the veterinarians chose “State Agriculture Agency” as their first government agency choice in reporting. Twenty-three percent chose “State Public Health Agency,” and 20 percent chose “Local Public Health Agency.”27 Chi-square analyses of the veterinarians’ responses with both the human public health infrastructure and the animal disease reporting system showed that the human infrastructure had a slight impact on the
13
veterinarians’ knowledge of companion animal disease reporting, but not the animal disease reporting system [OR=1.6, 95%CI 1.2-2.2, p=.001 versus OR=.89, p=.4, respectively]. In contrast, the findings for livestock were just the opposite. The human infrastructure had no impact on the veterinarians’ answers. Veterinarians were more likely to have given the preferred answer if they were in a state in which reporting was restricted to only one agency [OR=1.1, p=.7 versus OR=1.5, 95%CI 1.2-2.0, p=.002, respectively]. Forty-six percent of the veterinarians chose “State Agriculture Agency,” 16 percent chose a federal agency, 13 percent chose “State Public Health Agency,” and 6 percent chose “Local Public Health Agency” (see Appendix D, Table 4). Interestingly, as with the physicians, approximately 28 percent of the veterinarians did not know if their community had a local public health agency. When asked, “In the last five years, how often have you notified your state/local public health or state agriculture agency about an animal with a reportable infectious disease?” only 58 percent of the veterinarians answered the question as pertaining to local public health agencies. Of these, 42 percent said that they had reported “Regularly/Occasionally,” whereas almost 56 percent said “Rarely/Never.” In absolute numbers, however, more veterinarians reported that they had notified their local public health agency than had notified their state health or state agriculture agencies (see Appendix D, Table 5). In states in which reporting was preferential to one agency, the Department of Agriculture, the veterinarians were less likely to have reported to local public health agencies and more likely to have reported to the state agriculture agency in the previous five years [ORLHA=.69, 95% CI .5-.94, p=.02 versus ORAG=1.9, 95%CI 1.3-2.7, p=.0003]. As with the physicians, the veterinarians were asked how satisfied they were with their local or state public health or agriculture agencies’ responses after they had informed them about a patient with a reportable infectious disease. Overall, the veterinarians expressed the greatest satisfaction with their state agriculture agencies’ responses and the least satisfaction with local public health agencies’ responses (see Appendix D, Table 6). When asked “What is the most important factor in determining whether or not you would participate in a regular, voluntary online disease reporting and surveillance program?” and “If you were to participate in a voluntary online reporting and surveillance program, how often would you prefer to report?” the veterinarians gave responses very similar to those of the physicians. Fifty percent of the veterinarians cited ‘time required’ as the most important consideration in participating in an online reporting program. ‘Usefulness to public health’ followed at 27 percent. Sixty percent of the veterinarians answered that they would be willing to report monthly while 18 percent would be willing to report weekly.28 Local Public Health Agency Responses Local health agencies were asked “What percentages of your infectious disease reports come from physicians, veterinarians, laboratories, infection-control nurses, and others?”

14
Not all of the local health agencies answered these questions, but of those that did, the majority (88 percent) indicated that laboratories constituted 40 percent to 100 percent of their sources. The next most frequently cited sources were infection-control nurses and physicians. Approximately 95 percent of the local health agencies reported that less than 5 percent of their reports come from veterinarians (see Appendix D, Table 7). The next set of questions asked the local health agencies if they collected data on 14 vaccine-preventable diseases, and requested that they send in any such data for the previous year.29 The rationale for asking this question was that if they routinely collected and analyzed data on known diseases, the local health agencies would be getting regular practice in disease surveillance–efforts that would help prepare them for surveillance of unusual or unexpected diseases. On average, approximately 41 percent of the local health agencies answered that they collected data on the 14 vaccine-preventable diseases listed. When asked to provide the actual incidence rate data, however, few did so. New York State had the largest percentage of local health agencies that did include their data in the survey. But it is important to note that comparisons across the states should be made with caution as only two agencies exist in New Hampshire and, technically, only nine in Pennsylvania30 (see Appendix D, Table 8).
Laboratory Capabilities and Specimen Submissions
Local Public Health Agencies’ Laboratory Capabilities Seventeen of the 147 responding local public health agencies had laboratories.31 The biosafety levels (BSL) of these laboratories were as follows: three BSL 1; five BSL 2; five BSL 3; two unsure, and two didn’t answer the question.32 Six laboratories were participants in the CDC’s Laboratory Response Network33 (see Appendix E, Table 1).34 Local health agencies were asked “How capable would your laboratory be in handling at least one Category A agent (such as Yersinia pestis, anthrax, Clostridium botulinum toxin, Francisella tularensis) on the CDC’s list of possible bioterrorist agents?” The responses were fairly evenly split between “Capable” and “Incapable” (see Appendix E, Table 2).
Next, a double question asked “How well would your laboratory handle a two-fold or five-fold increase in specimens from your baseline in the event of a severe infectious disease outbreak?” For a five-fold increase, the number of “Not Sure” and “Overwhelmed” responses increased compared to the answers relating to a two-fold increase (see Appendix E, Table 3).
All the laboratories had directors, but only eight respondents knew if the directors possessed doctorates. Ten respondents answered that the laboratory directors had over 10

15
years of experience, two had 6 to 10 years of experience, one had 0 to 5 years of experience, three didn’t know, and one failed to answer the question (see Appendix E, Table 4).
Physician and Veterinarian Responses to Specimen Submissions All four states were contacted to determine which laboratories physicians and veterinarians should send their specimens to if they suspected their patient had an unusual infectious disease. The answers are listed in Appendix E, Table 5. The physician and veterinarian responses follow: The question was, “If you suspected your patient had an unusual infectious disease (such as plague, tularemia, smallpox, or anthrax) which laboratory would you send the specimen(s) to first?” The largest percentage of physicians, 31 percent, answered that they would send the specimens to their hospital laboratory. This was the preferred answer in three out of the four states. The New York State Department of Health preferred that the physicians call them first before sending the specimen to the state public health laboratory. 24 percent of the physicians answered, “State Public Health Laboratory,” and 31 percent chose “My Hospital Laboratory.” Fifteen percent of the physicians would send the specimen directly to the CDC’s laboratory, and 14 percent were “Not Sure” where to send them. In summary, none of the answers had a clear majority preference (see Appendix E, Table 6).
In contrast to the physicians’ responses, the majority of veterinarians chose “State Agriculture Laboratory” over all the other choices for both companion animals and livestock. Almost 50 percent chose “State Agriculture Laboratory” for companion animals, and 57 percent chose it for livestock specimens (see Appendix E, Tables 7 and 8).
Clinical Capabilities Local Public Health Clinical Capabilities Almost 90 percent of the local health agencies reported that they regularly provide clinical services, such as well-baby care, sexually transmitted disease screening and treatment, vaccinations, family planning, HIV screening, and/or TB screening at their agencies. Only New Jersey had a few agencies that rarely or never offered these services (see Appendix F, Table 1). Most offered the usual childhood-disease vaccines such as polio, measles, mumps, rubella, diphtheria, pertussis, and tetanus, on a regular basis. One hundred thirty-nine out of 144 responding agencies provided the influenza vaccine, and of these, 108, or
16
approximately 78 percent, did so regularly. Varicella (chickenpox), hepatitis A, and meningococcal disease were the vaccines administered by the smallest percentage of agencies: 82 percent, 52 percent, and 50 percent, respectively (see Appendix F, Table 2). New Jersey had the largest percentage of agencies that did not report offering vaccines. For example, of the total 142 local health agencies that answered the question, 13 out of 14 that did not administer the measles vaccine were in New Jersey. Twenty-four (92 percent) out of the 26 agencies that did not offer the varicella vaccine were in New Jersey with the other two being in New York. Of the 67 agencies that did not offer the hepatitis A vaccine, 60 (90 percent) were New Jersey local health agencies. However, in absolute numbers, New Hampshire and Pennsylvania had the fewest agencies offering any clinical services; including vaccines (see Appendix F, Tables 1-3).
The survey questioned the agencies about the number of full- and part-time physicians and nurses they employed, because these professionals would be the all-important providers of clinical services such as disease screening and vaccine administration. Of those agencies that responded, the majority, 76 percent (91/119), did not employ any full-time physicians; of these, approximately 26 percent did not employ any part-time physicians, either (see Appendix F, Tables 4 and 5). Most (82 percent) of the agencies reported that they employed 0 to 5 part-time nurses. Only 46 percent employed 0 to 5 full-time nurses. Forty-seven percent (60/127) agencies employed 0 to 5 full-time and part-time nurses (see Appendix F, Tables 6 and 7). A linear regression analysis was conducted to determine what factors influenced the numbers of physicians and nurses employed by the local health agencies. Factors included population size and total number of full-time employees in the agency, as well as federal, state, and local funding levels. For both full-time and part-time physicians, there was a linear relationship with both population size of the jurisdiction and total number of full-time employees in the agency. The larger the jurisdiction and size of the agency, the more likely it was that there were physicians employed. There was no association with source of funding. For part-time nurses, the situation was similar to that of the physicians: large population size and greater total number of full-time employees were positively associated with the employment of more part-time nurses. For full-time nurses, however, the picture was slightly different. In addition to population size and total number of full-time employees, funding from state and local sources was also positively correlated with the number of full-time nurses
Physician and Veterinarian Clinical Capabilities Both physicians and veterinarians were asked how prepared they believed they were to recognize a patient with an unusual infectious disease. Similar percentages of physicians

17
and veterinarians believed they were “Very” or “Somewhat” prepared: 50 percent and 56 percent, respectively (see Appendix F, Tables 8 and 9). To assess if the physicians and veterinarians were interested in epidemiologic data, both groups were asked how often, in the previous five years, they had read disease surveillance reports such as the CDC’s Morbidity Mortality Weekly Report (MMWR), the Infectious Disease Society’s PROMED, or state-level data. Forty-six percent of the physicians and 50 percent of the veterinarians answered that they read such reports “Regularly” or “Occasionally.”
Communications Local Public Health Agencies Virtually all of the health agencies surveyed had computers with internet access. More than half of them reported sending information on the reporting of infectious diseases to physicians yearly or every few years (see Appendix G, Table 1). A large percentage, 86 percent, (126/147) of the agencies surveyed reported that they “Regularly” or “Occasionally” send out public health information to the health care professionals in their local community (see Appendix G, Table 2). In the event of a public health crisis, over 90 percent of the local health agencies reported that they would use fax, electronic mail, or telephone calls to communicate with health professionals. Over 90 percent would use their web site and public media such as radio to communicate with the public. Electronic mail, telephone, and cellular phones were the most frequently chosen answers for communication with both their own staff and with other agencies (see Appendix G, Table 3). Physicians More physicians reported receiving infectious disease reporting information from their state public health agency than from their local public health agency: 68 percent vs. 50 percent, respectively. Only 347 out of 602 physicians answered the question about information from local public health agencies. 71 percent indicated that they were “Very” or ”Somewhat Familiar” with their state’s reporting requirements (see Appendix G, Tables 4-6). Regression analysis showed that physician reporting familiarity was highly correlated with information received from state and local public health agencies. The fit of the regression line (R2) was greater with information from the state agency than from the local agencies [p<.0001, 95% CI .34-.46, R2 =.21; p<.0001, 95% CI .14-.30, R2 = .07].
18
In the event of an emergency, more physicians preferred to be contacted by fax, electronic mail, and telephone than by other methods. When the physicians were asked if they ever communicated with their veterinary colleagues about animal diseases or behaviors that might have an impact on humans in their area, almost 80 percent said that they “Never” had, and only 33 percent were “Very” or “Somewhat” interested in future forums that would facilitate such communications (see Appendix G, Tables 8 and 9). Veterinarians Almost 60 percent of the veterinarians answered the question about receiving information about infectious disease reporting from local public health agencies. Of this 60 percent, slightly more than half answered that they received this information “Regularly” or “Occasionally.” More veterinarians received reporting information from their state public health and state agriculture agencies. Similarly, the same percentage of veterinarians, 71 percent (752/1058), believed they were “Very” or “Somewhat Familiar” with their state’s reporting requirements as were physicians (see Appendix G, Tables 10–13). Regression analysis showed that information received from the state agriculture agencies was more closely correlated with veterinarian reporting on familiarity than information that was received from state or local public health agencies (State Agriculture Agency: p<.0001, 95 percent CI .20-.27, R2 = .11; State Public Health Agency: p<.0001, 95% CI .13-.23, R2 = .05; Local Public Health Agency: p=.0008, 95% CI .046-.18, R2 =.01). Again, a similarity with the physicians’ responses, most veterinarians preferred to be contacted by fax, electronic mail, and telephone in the event of a public health emergency (see Appendix G, Table 14).
The veterinarians were more receptive to the idea of communicating with their medical colleagues than vice versa. Forty-five percent of the responding veterinarians answered that they “Never” communicated with their medical colleagues about animal diseases in the area; however, 65 percent said that they would be “Very” or “Somewhat” interested in such communication (see Appendix G, Tables 15 and 16).

19
Attitudes Regarding Public Health Capabilities Local Public Health Agencies Local public health agencies were asked how capable they thought their agency and their state public health agency would be if they had to handle a severe infectious disease outbreak, such as pandemic influenza, in the near future. Eighty-three percent responded that their local agency would be “Very” or “Somewhat” capable of handling a severe outbreak and 81 percent believed that their state agency would be “Very” or “Somewhat” capable as well (see Appendix H, Table 1). Sixty-three agencies answered that they had recruited volunteers such as physicians and/or nurses who would be available to respond in the event of a severe outbreak of infectious disease. Of these agencies, 41 (67 percent) indicated that they communicate regularly with these volunteers and 68 percent (39/57) provide their volunteers with training. Of the 77 agencies that have not recruited volunteers, 45 indicated that they had plans to develop a volunteer corps in the near future. Physicians Approximately 50 percent of the physicians believed that their local public health agencies would be “Very” or “Somewhat” capable of handling a severe infectious disease outbreak. However, they were a bit more confident about their state public health agencies: 63 percent thought that their state agency would be “Very” or “Somewhat” capable (see Appendix H, Table 2). Asked how important they thought an education in public health was for someone working in the field of public health, 84 percent of the physicians thought that an education (such as a master’s degree in public health) was “Very” or “Somewhat” important. However, a higher percentage, 90 percent, thought that a medical degree was “Very” or “Somewhat” important for someone working in public health (see Appendix H, Tables 3 and 4).
Only 18 percent of the physicians answered that they were “Very” or “Somewhat” involved in local and/or state public health emergency preparedness efforts, and of these, only 35 percent indicated that they would be “Very” or “Somewhat” interested in getting involved (see Appendix H, Tables 5 and 6).
Veterinarians The veterinarians had far less confidence in their local health agencies than did the physicians. Only 32 percent thought that their local public health agencies would be “Very” or “Somewhat” capable of handling a severe animal disease outbreak in the near

20
future. They had more confidence in their state public health and agriculture agencies: 71 percent and 78 percent, respectively, thought that these agencies would be “Very” or “Somewhat” capable (see Appendix H, Table 7). Seventy-seven percent of the veterinarians surveyed thought that a degree in public health (such as a master’s in public health) would be important for someone working in animal public health. However, 98 percent, an even higher percentage than the physicians thought that a veterinary degree was important for someone working in animal public health (see Appendix H, Tables 8 and 9).
Only 19 percent of veterinarians were involved in local and/or state public health emergency preparedness efforts (see Appendix H, Table 10).
Local Public Health and Federal Biodefense Funding
The survey asked local public health agencies to estimate the percentage of each source they received their general base revenue: federal, state, local, or other. Funding for New Jersey’s local public health agencies was notable in that approximately 70 percent (55 out of 79 agencies) receive approximately 80 to 100 percent of their general funding from local sources. An additional 14 New Jersey agencies indicated that 50 to 80 percent of their funding was from local sources, meaning that, in all, approximately 87 percent of New Jersey’s local public health agencies receive their funding from local sources. In contrast, approximately 83 percent (38 out of 46) of the New York local public health agencies receive 0 to <50 percent of their general funding from local sources. Forty-one out of 47 (87 percent) of these agencies responded that 20 to 80 percent of their funding comes from state sources. In Pennsylvania, 8 out of 11 (73 percent) local entities receive 50 to 100 percent of their funding from the state. In New Hampshire, one of the two local public health agencies receives 0 to <20 percent of its funding from the state, while the other receives 20 to <50 percent from the state. They differ in the amount of funding from local sources as well: one receives 50 to <80 percent and the other, 20 to <50 percent.
Ninety-five percent of the local health agencies reported receiving <50 percent of their funds from federal sources (see Appendix I, Table 1).
Forty-nine local health agencies responded that they receive general funding from other sources besides federal, state, or local governments. Of these, 30 (61 percent) were based in New York and 8 (16 percent) in New Jersey. Six of the New York agencies responded that they receive from 50 to 100 percent of their funding from these other sources.

21
The other sources included: fees and revenues (21/49), third-party reimbursement, including Medicare and Medicaid (10/49), grants (6/49), and miscellaneous (county, school district, gifts, special projects, and fines (12/49). Some of the agencies listed more than one of these sources.
In addition to the questions on general revenue, when the local public health agencies were asked if they had received any federal funding specifically targeted for biodefense, 59 percent responded that they had. Only New Jersey had a larger percentage of local public health agencies (60 percent) that had not received funds compared to those that had. Across all four states, a total of 60 local public health agencies reported either not receiving or being unsure of receiving these funds (see Appendix I, Table 2).
Of the local health agencies that had not received these federal funds, 85 percent received 50 percent or more of their regular funding from local sources. Local public health agencies, whose regular source of funding was not derived from local sources, were 11 times more likely to have received federal biodefense funds than those that did not depend on local sources for their support. A chi-square analysis of local funding and receipt of federal biodefense funds revealed: [OR=.09, 95% CI .04-.21, p<.0001].
In addition, the local public health agencies were asked whether their surveillance and laboratory/diagnostic capabilities had expanded as a result of receiving federal biodefense funding. The majority (92 percent) of those that had received these funds responded that their surveillance capabilities had indeed increased (see Appendix I, Table 3). Of these, 60 out of 73 had hired new staff, 66 out of 76 had purchased new surveillance equipment, and 18 out of 23 listed various other efforts, such as increased training, increased communications/networking, upgraded computer systems, more staff hours, and hiring an epidemiologist, as evidence of expansion.
Only 12 local health agencies answered that their laboratory/diagnostic capabilities had improved as a direct result of this funding. Of these, 8 out of 9 answered that they had hired new staff, and 10 out of 11 had purchased new laboratory equipment.
To determine if there was any relationship between receipt of federal biodefense funds and self-assessed capability to respond to a severe infectious disease outbreak, a chi-square analysis was performed on these two variables. This showed that local public health agencies that had received federal biodefense funds were 4 times more likely to answer that they were “Very” or “Somewhat” capable of responding to a severe outbreak, such as pandemic influenza, than were agencies that had not received such funding [OR = 4, 95%CI 1.7-10, p=.0015].

22
V. Discussion
State and Local Leadership
An established chain of command is vital for states and local jurisdictions to be well-prepared for any crisis. Officially and legally, the leaders at the state and local levels are the elected officials; governors, county executives, and mayors.35 However, not all elected officials have the fortitude, background, education, or experience to prepare, direct, or manage widespread catastrophes. Former New York City Mayor, Rudolph Giuliani, provided an example of exceptional leadership during the terrorist attacks of September 11, 2001. In contrast, New Orleans Mayor, C. Ray Nagin, demonstrated inadequate leadership during Hurricane Katrina. For example, he ordered a mandatory evacuation of the city, but was unable to ensure that those who needed transportation, such as the poor and infirm, received it.36 For many elected officials, it makes sense to delegate the decision-making authority to qualified appointees. In the case of dealing with sudden severe outbreaks of infectious diseases, the most qualified leaders would be physicians and veterinarians capable of handling human and animal disease outbreaks. In some states, this delegation of authority is codified in state law as is the case in New York.37 In order to assess whether local public health officials, physicians, and veterinarians understood the chain of command in the event of an emergency, the survey asked them “Who would be the state and local leaders in the event of a severe infectious disease outbreak?” This question is important because so many of the problems during disaster relief have to do with poorly defined or inadequately understood leadership, as illustrated by the bumbling response to Hurricane Katrina.38
For the purposes of this survey, “leaders” were defined as those individuals who would make the crucial decisions regarding mass vaccinations, quarantine, medical treatments, and so on. Of course, these decisions would probably be made with input from others, but ultimately, the responsibility would fall on the shoulders of individuals. During this project’s early interviews with state health and agriculture officials, they were asked who would be the state leaders during a public health crisis such as a severe infectious disease outbreak. Their answers are listed in Appendix C, Table 1. Those approved as local leaders varied from state to state. In New York State, for example, the county health commissioners would serve as leaders, whereas in New Jersey, LINCS [short for Local Information Network Communication Systems] agencies, rather than appointed officials, would be the leaders.39
In all four states, either the Commissioner/Secretary of Agriculture or the State Veterinarian would serve as the leader at the state level for animal disease outbreaks. At the local level, leadership for animal disease outbreaks was unclear. In New Hampshire, the State Veterinarian would serve as the leader at both state and local levels. Veterinarians who work for the Departments of Agriculture in the three other states
23
would serve as de facto leaders at the local level, but they were not necessarily present on a regular basis in these local communities.
Most of the local public health agency and physician respondents chose the “State Health Director” as the state leader during a severe outbreak. However, fully a quarter of the physicians were “Not Sure.” The majority of the veterinarians chose the “State Veterinarian” as the state leader during an animal outbreak.
Almost three-fourths of the local public health agency respondents answered that the heads of their agencies would serve as the local leaders. Both physicians and veterinarians were almost equally split between “Head of Local Health Agency” and “Not Sure” in choosing who the local leader would be. Only 15 percent of the veterinarians chose “Local Veterinarian” as the local leader.
These findings suggest that the question of leadership, particularly local leadership, might be clear to those working at the state level and to those who work in public health at the local level, but clearly it was far from transparent to the physicians and veterinarians.
In combining all the responses–from physicians, veterinarians, and local public health agency officials–one conclusion does emerge quite clearly. The majority of them chose appointed rather than elected officials as the natural leaders during a public health crisis. Therefore, in terms of expectations of who should serve as a leader during a public health crisis, it would appear from these survey results that appointed leaders, such as Commissioners of Health or State Veterinarians, rather than the elected officials themselves, would make more legitimate leaders for the “troops.”
This conclusion is made not only because these individuals would probably be better qualified, but also because the rank and file would expect them to be the leaders. This in no way negates the elected officials’ responsibility to make sure that their appointed designee is both qualified and capable of handling a crisis. For example, appointing, as a leader, someone with no qualifications other than political loyalty, can backfire for the elected official if a crisis is handled poorly.40
This expectation of who should serve as the leader during a crisis appeared to have an effect on the analysis of state complexity and knowledge of the chain of command. For example, in New Jersey, 70 percent of the local public health agency respondents answered that the “State Health Director” would serve as the leader. Only 7 percent indicated the “Governor”–which was the correct answer–according to the New Jersey State Health Department.
A chi-square analysis between the level of state complexity and local public health agencies’ knowledge of the chain of command suggested a relationship, although the numbers of respondents were small. Local health agency respondents in the “simple” states were almost 24 times more likely to have known the preferred leadership answers than their counterparts in the “complex” states. However, it is important to emphasize that these results were primarily a comparison between New York and New Jersey

24
because they had the most local public health agency respondents and because New York’s leader was the “State Health Director” and not the “Governor.” Seventy-one percent of the New York respondents chose “State Health Director.”
Disease Surveillance and Data Management
Several issues need to be addressed regarding disease surveillance and data management. First, were physicians and veterinarians engaged with local public health? Was there collaboration between these groups? Were local public health agencies collecting and analyzing disease data? Were they getting regular practice in data collection with vaccine-preventable diseases? What were their sources of data? It was a major concern that more than a quarter of the physicians and veterinarians surveyed did not know if their communities even had a local public health agency. If they didn’t know such an entity existed, how could they be expected to report to it? Most of the respondents preferred the state agencies for disease reporting. Approximately 15 percent of the physicians and veterinarians indicated that they would skip the whole state and local infrastructure altogether and report directly to a federal agency.
The survey showed that the level of complexity of the local public health infrastructure had less of an impact on physician reporting to public health agencies than did individual practice characteristics, such as primary care and patient volume. Therefore, it would be natural to assume that primary care physicians would be more engaged with public health than specialists, and the analyses were stratified accordingly. Surprisingly, it turned out that the opposite was the case.
Physicians who characterized their practices as 50 percent or less primary care were 5 times more likely to have reported a communicable disease to a local public health agency than those who practiced 50 percent or more primary care. In addition, those physicians who had high-volume practices were more likely to report than were those with low-volume practices.
This study did not examine physician practice characteristics or environments in detail, but a hypothesis could be made that seeing more patients would provide high-volume physicians with greater opportunities for seeing patients with reportable diseases. It is unclear what factors in the primary care physicians’ practices would make them less likely to report compared to those in non-primary care practices. The number of years in practice had no effect.
For the veterinarians, the analysis was split by type of animal; companion or livestock. For companion animals, the complexity of the human public health system did have an impact. Veterinarians were slightly more likely to have given the preferred reporting answer if they were in a “simple” rather than a “complex” state. The animal disease reporting system had no impact on their answers.

25
For livestock, quite the opposite was true. The animal disease reporting system did have an impact, while the human public health system did not. The veterinarians were more likely to have given the preferred answer in a state in which reporting was preferential to just one agency (the State Department of Agriculture). In addition, in states in which reporting was preferential to one agency, the veterinarians were less likely to have reported to a local public health agency and more likely to have reported to the state agriculture agencies in the previous 5 years.
However, regardless of the actual physician and veterinarian responses, the responses of the local public health agencies illuminated an unexpected picture of infectious disease reporting. According to these agencies, <10 percent of their reports came from physicians or infection-control nurses, and barely 5 percent of their reports were from veterinarians. Instead, close to 90 percent of the local public health agencies reported that 40 to 100 percent of their reports came from laboratories. There is a further discussion of laboratory roles and quality oversight in Appendix J.
While many public health agencies are setting up syndromic surveillance systems in an attempt to identify any hint of an outbreak at the earliest possible moment, physicians, who constitute one of public health’s most important sources of outbreak recognition, appear to rely on laboratories to report on their behalf, once the confirmatory test results are complete. Since only 4 states were studied, it is not clear if this finding is widespread, but it does suggest the importance of assessing whether practitioner reliance on laboratory reporting might lead to time delays in public health notification of potential outbreaks, especially if the tests were inconclusive or not immediately confirmatory. Nevertheless, the issue remained as to what the local public health agencies were doing with their data. Were they analyzing the information or were they serving primarily as conduits to the state health department? The survey results showed that relatively few of the local public health agencies actually provided numerical answers for the incidence rates (new cases of disease per a 100,000 population) of 14 vaccine-preventable diseases for the previous year, which would have been 2003. New York State had the highest percentage of local public health agencies that provided answers. Very few of New Jersey’s local public health agencies offered answers, even though the LINCS agencies were supposed to provide this capability.
LINCS was initially developed to enhance electronic communications between the New Jersey state health department and the local health departments. Since September 11, 2001, and the anthrax attacks that followed, LINCS was transformed into a disease surveillance system with the mandate of improving early outbreak recognition.
However, even with a mission to improve disease surveillance, it remains unclear whether the LINCS agencies collect data on non-bioterrorism concerns, such as vaccine-preventable diseases. It could be argued, from a systems-theory point of view, that regular practice on routine mundane diseases, such as the vaccine-preventable ones, would hone the important disease-surveillance skills needed to recognize an outbreak
26
with an unexpected bioterrorism agent. While drills, such as TOPOFF 3, are important, relying on them for outbreak preparedness is short-sighted, especially since they are usually done infrequently, if at all. The survey specifically asked local public health agencies for data on the routine vaccine-preventable diseases in order to see if they knew what was going on in their backyard. Knowledge of the incidence rates of these diseases would also be important from a quality-improvement perspective, as many of the agencies regularly administered vaccines in order to prevent these diseases. Collecting and analyzing such data would provide them with important feedback indicators of the health of their communities.
Collecting and analyzing surveillance data for health indicators is the role of a qualified epidemiologist. Given their importance in tracking the health of communities, how many epidemiologists should there be for a given population? There have been no studies asking this question; however, some estimates have fallen somewhere between 1 per 50,000 to 1 per 1 million.41 Using the estimate of 1 per 500,000, then the four states should have the following number of epidemiologists based on the 2000 U.S. Census data: New Hampshire 2-3; New Jersey 17; New York 38; and Pennsylvania 25. For New York City, Philadelphia, and Allegheny County (Pittsburgh), the estimated number of epidemiologists should be 16, 12, and 5, respectively. The approximate actual numbers of epidemiologists are listed in Table 5.1.

27
++NJ now has 1 epidemiologist in all 22 LINCS agencies (most have MPHs, and 1 or 2 have MDs). There are at least 12 epidemiologists at the state level. +++Gross estimate of number of local epidemiologists from communication with Dr. Dale Morse, NYS epidemiologist; 25% of all 57 counties have a contact person for communicable disease outbreaks (.25 X 57 = 14). There are at least 23 epidemiologists at the state level as of 2002. See: CDC, Terrorism Preparedness in State Health Departments, United States, 2001–2003, MMWR, 52(43): 1051-1053, October31, 2003. #The New York City Department of Health has a total of 97 epidemiologists; 51 are infectious disease epidemiologists who work in the Bureaus of TB, STD, HIV or Communicable Disease. ##Estimate of epidemiologists in PA by Joel Hersh, director, Bureau of Epidemiology. There are 23 full-time MD or PhD epidemiologists in Harrisburg, and 1 MD epidemiologist in Western PA. According the PA state officials, their goal is to hire medical epidemiologists to cover the central and eastern parts of the state. {}Allegheny County includes the city of Pittsburgh.
Table 5.1 - Number of Epidemiologists per State and Selected Major Cities and Counties
New Jersey has approximately twice as many epidemiologists as calculated according to its population; the other states are more or less on target, using this criterion.
New York City has 51 out of a total of 97 (53 percent) epidemiologists who work only on infectious diseases. However, given the density and composition of the New York City population, this impressive number of infectious disease epidemiologists (approximately 1 per 160,000 population) is probably what is needed for adequate communicable disease surveillance. Should this be the standard for high-density populations? Philadelphia and Pittsburgh have fewer epidemiologists than the estimated number.
Yet despite the evidence that the states are adequately endowed with epidemiologists, the quantity and accessibility of data on the internet vary considerably. Only New York City and New York State provided extensive information on disease rates over a period of years. New York State provides case numbers and incidence rates for almost 50 infectious diseases. While New York City does not have data available on the internet, it does provide a pamphlet with extensive information.42 New Jersey provides case numbers, but not incidence rates, for over 60 infectious diseases. New Hampshire does not provide any data on the internet. Data had to be obtained by request through the state epidemiologist. Pennsylvania provides summary rates for 16 infectious diseases even
State/Counties Epidemiologists New Hampshire 3 New Jersey 34++ New York 37+++ New York City& 51# Pennsylvania 24## Philadelphia County 4-5 Allegheny County{} 3

28
though 39 infectious diseases are reportable under Pennsylvania law.43 Given the importance of this data, the qualifications and training of the people generating such information ought to be regulated. Just as physicians should be licensed to practice medicine, epidemiologists should meet certain qualifications and be licensed.
However, even if a state has an adequate number of epidemiologists, if the data is not being analyzed or used by the local health agencies whose mission is to monitor and improve the health of their communities, then what good is it? These local health agencies should not serve merely as data conduits to the state, and they should not depend on the state or federal government to do their work in the event of a crisis. The cryptosporidium outbreak in Milwaukee, Wisconsin, in 2003 illustrates this point well. This outbreak raged for weeks with over-the-counter anti-diarrheal medications flying off the shelves. The city health department finally realized the outbreak’s existence after an infectious disease physician reported an AIDS patient with this disease. The delay in recognition resulted in the largest water-borne outbreak in U.S. history. Four hundred thousand people were sickened and one hundred of them died.
Ideally, local health agencies should be actively engaged with their health providers, including the physicians and veterinarians, in routinely collecting, analyzing, and responding to data. The small number of local health agencies that were able to provide data is a serious issue that needs to be investigated further and addressed if found to be widespread in other states.
In the field of animal infectious diseases, none of the four state Departments of Agriculture had any surveillance data available at all. According to Dr. Gary Smith, a professor of population biology and epidemiology at the University of Pennsylvania School of Veterinary Medicine, these agencies collect animal disease data, particularly for livestock, but because of farmers’ concerns about proprietary and confidentiality issues, the information is not made available to the public. There is no data on vaccine-preventable disease rates because the numbers of animals being vaccinated per year are simply not available. It might be the case that these numbers are not recorded.
At the federal level, the U.S. Department of Agriculture (USDA) has some livestock disease data available, but it is limited.44 Again, agriculture industry concerns limit the availability of animal disease statistics. The CDC collects certain zoonotic disease surveillance data on problems such as West Nile virus and rabies, in animals.45
Calculating disease rates for animal diseases is particularly difficult because census data for animals is limited. The USDA maintains census data for livestock.46 The American Veterinary Medical Association publishes a book with estimated data on companion animal ownership based on household surveys.47 At present, there is no free, easily accessible, comprehensive census data source for all types of domesticated animals.

29
Laboratory Capabilities and Specimen Submissions Laboratories are a critical part of disease surveillance because they conduct the tests that definitively identify the pathogens. In 1999, the U.S. General Accounting Office (GAO) issued a report on the states’ public health laboratory capacities.48 According to this report, “Every state has at least one state public health laboratory to support its infectious disease surveillance activities and other public health programs. Some states operate one or more regional laboratories to serve different parts of the state.” These regional laboratories often involve academic institutions, such as university medical and veterinary schools, to provide public health laboratory services. The mission of state laboratories is to conduct tests for routine public health surveillance, special clinical or epidemiologic studies, diagnosis of rare or unusual pathogens, identification of low-incidence, high-risk diseases (e.g., botulism and tuberculosis), and outbreak investigations. In addition, many state public health laboratories provide licensing and quality improvement oversight of commercial laboratories.49 Recently, in addition to their usual responsibilities, public health laboratories are now considered the vanguards in identifying agents of bioterrorism.
In 1999, the CDC established the Laboratory Response Network (LRN), which is a network of federal, state, local, military, food safety, environmental, veterinary, and international laboratories.50 This network’s mission is to provide laboratories that are fully equipped and able to respond to acts of biological and chemical terrorism as well as other public health emergencies. Since many of these agents of bioterrorism are highly pathogenic and communicable, working with them requires biosafety level 3 (BSL 3) capabilities.
The CDC has published guidelines for biosafety standards and practices in work performed on infectious agents. These guidelines were developed to protect both laboratory workers and the public from dangerous pathogens; biosafety levels are graded from 1 to 4. Pathogens that are extremely virulent, communicable, and/or exotic and expose the laboratory worker to potentially life-threatening diseases require the highest level of safety containment such as a full-body, air-supplied positive-pressure personnel suit. Hemorrhagic fever viruses, such as Ebola and Marburg, have BSL 4 requirements.51
Biosafety level 3 laboratories require specialized enclosed chambers for pathogen testing rather than open tabletops, which are acceptable for biosafety levels 1 and 2. In addition, they require special ventilation systems that minimize the risk of release of agents from the laboratory. (BSL 3 and 4 assume pathogens have aerosol transmission capability.)
Virtually all the state officials interviewed earlier said that their respective departments
had plans or grants to upgrade their laboratories to include BSL 3 capabilities.
Very few local public health agencies have their own laboratories, however. Most of the public health laboratories are at the state level with the exception of large metropolitan areas such as New York City (NYC), whose Department of Health laboratory is in a class

30
by itself. Aside from the NYC laboratory, most of the small, local public health laboratories would be unlikely to play a role in any serious outbreak.
Less than half of the local public health agency respondents indicated that their laboratories would be capable of handling a category A agent, and even fewer believed that their laboratories would be capable of handling a two-fold or five-fold increase in specimens such as would occur during a severe outbreak.
Indeed, for most human or animal laboratory specimens, the laboratories involved would be hospital/commercial or state laboratories, respectively (see the previous discussion and Appendix J). Most of the physicians surveyed (31 percent) said they would send their specimens to their hospital laboratory in the event of an outbreak. However, the veterinarians would send their specimens to the state agriculture/animal laboratory. As mentioned earlier this study did not assess hospital and commercial laboratory capabilities. Given the frontline role that they would play in disease identification and reporting, their capabilities ought to be studied. Physicians and veterinarians differed in terms of their knowledge of where to send their laboratory specimens in the event that their patient had an unusual infectious disease. Approximately half as many veterinarians answered “Not Sure” compared to the physicians. However, the small physician response rate, difference in practice environments, and difference in survey questions between the two professions makes comparisons difficult. Nevertheless, the physician practice environment should be examined further to determine what factors might affect their knowledge and choice of laboratories. It is possible that the current complicated medical practice environment, in which laboratory choice is dependent upon patient health insurance status, makes physician decision-making in this regard extremely difficult. In contrast, veterinarians do not face these constraints; for better or worse, they have fewer laboratory choices, which make the decisions as to where to send laboratory specimens much easier.
Clinical Capabilities Although almost 90 percent of the local public health agencies surveyed indicated that they provided clinical services such as well-baby care, sexually transmitted disease screening and treatment, and vaccinations for diseases, such as influenza, and some childhood vaccines, few actually employed the clinicians needed to provide such services. Indeed, of the 119 local public health agencies that answered this question, 91 indicated that they employed zero full-time physicians, and 34 out of 130 employed zero part-time physicians. A cross-tabulation of the two groups established that 28 local public health agencies employed no physicians at all, either full-time or part-time.52
31
More local public health agencies employed nurses, although a sizable fraction of them–63 out of 137 (46 percent) and 107 out of 131 (82 percent)–employed only 0 to 5 full-time or part-time nurses, respectively. Sixty out of 127 local public health agencies employed fewer than 5 nurses, whether full-time or part-time.
The survey did not ask if the local public health agencies employed other workers with clinical skills, such as nurse practitioners, physicians’ assistants, licensed practical nurses (LPNs), or emergency medical technicians. It might be possible that such workers were providing services within local public health agencies, but a more likely scenario would be that the agencies contract with individual local area providers to offer these clinical services.
Nonetheless, the survey results suggest that few local public health agencies have sufficient health care professionals at hand to provide clinical services within their facilities during a public health crisis. New York State’s emergency plans would not rely on local health departments to provide clinical services in a crisis. Instead, the public health agency role would be to coordinate with hospitals to provide the needed clinical services and to work with volunteers to provide community vaccinations and/or dispensing of medications.53 This means that in any kind of severe outbreak, public health agencies would have to depend on volunteers, local providers, the Red Cross, and the National Guard to provide clinical and/or preventive services to their populations.
Communications Effective communication is one of the most important components of a public health response. Without it, collaboration and cooperation on the part of both health care professionals and the general public would be jeopardized. To avoid making the survey too lengthy and cumbersome, the question of who would be doing the communicating was not included; the focus was on how communication would take place–although the argument can still be made that who does it is just as important as how it is done. Concerning “who,” for example, a 2003 survey of adults, both nationwide and in New York City, done by the National Center for Disaster Preparedness at Columbia University, found that physicians with expertise in bioterrorism inspired the most trust.54 Seventy-six percent of the survey respondents identified a physician, the U.S. Surgeon General, as the single most reliable public official on issues such as bioterrorism. The survey also found that the Centers for Disease Control and Prevention had the highest level of trust (84 percent) of any government agency for accurate information on bioterrorism.55 Most local public health agencies do not have physician leaders capable of conveying information to health care professionals or to the public.56 For those agencies lacking such leaders, credibility might be a real problem during a crisis. This issue is critical and deserves further study.

32
With regard to “how,” most of the local public health agencies indicated that they would communicate with health professionals during a crisis via telephone, fax, and/or electronic mail. Fortunately, these were the modes of communication most frequently preferred by physicians as well as veterinarians. For communicating with the public, the agencies reported that they would most frequently use radio broadcasts and the internet. Other forms of communication with the public included a reverse 911 system, a 24-hour telephone hot line, and the media (television and newspapers). How well these agencies would get their message out to the public during a crisis would probably determine how well they were “graded” in their overall response by the media, which has tremendous power over public opinion. More veterinarians expressed an interest in communicating with their medical colleagues than vice versa. This is a serious problem if zoonotic disease threats are to be adequately handled in the future. For example, during the early stages of the West Nile virus outbreak in New York City in 1999, veterinarians in the Borough of Queens were seeing dozens of dying crows with neurological symptoms that were similar to those that would be seen one month later in the first human cases.57 There was no forum where the veterinarians could communicate their concerns to their medical colleagues in the area.
Sadly, in this survey, few physicians were interested in communicating with their veterinary colleagues on issues such as zoonotic risks. One explanation might be that many of the physician respondents were specialists who felt that these issues were not relevant to their practice. In contrast, the veterinarians were primarily generalists who did regard these issues as important and relevant to them. Confronting future zoonotic diseases will require educating physicians about the relevance of these diseases in their practice and promoting collaborative efforts between physicians and veterinarians.
Attitudes Regarding Public Health Capabilities The differences in attitudes regarding public health capabilities between the local public health agencies, physicians, and veterinarians were quite striking. Over 80 percent of the local public health agencies believed that either they or their state agency were “Very” or “Somewhat” capable of responding to a severe infectious disease outbreak in the near future. In contrast, only 49 percent of the physicians and only 32 percent of the veterinarians felt similarly. Both groups of professionals had more confidence in their state agencies, but not nearly as much as the public health respondents. Policy-makers should be concerned that professionals with vital roles in outbreak identification and reporting have such low opinions of their counterparts in public health.58 There could be several explanations. First, for the past 30 years or so, public health has been starved of resources and now functions largely with an unfunded mandate. Local public health agencies forced to work with skeletal resources and insufficient

33
personnel might not inspire much confidence in medical and veterinary medical professionals–or the public, for that matter. A second reason could be that many people working in local public health are not members of the medical or veterinary professions. When physicians and veterinarians were asked their opinions on the importance of educational background for those working in public health, on average, around 80 percent of the two groups thought that a degree, such as a master’s degree in public health, was “Very” or “Somewhat” important for a person working in the public health field. In contrast, 90 percent of the physicians and 98 percent of the veterinarians thought that a degree in medicine or veterinary medicine was “Very” or “Somewhat” important for a person working in human or animal public health, respectively. These results might help explain some of the low opinions of local public health outbreak response capabilities.
For example, the physicians’ answers regarding local public health capabilities differed by state. Seventy-six percent of the physicians in New York State answered that their local public health agencies would be “Very” or “Somewhat” capable of responding to an outbreak. In contrast, only 34 percent of the physicians in New Jersey answered similarly. New Hampshire and Pennsylvania responses averaged around 50 percent. However, because of the small physician response rate, the differences between the states were suggestive but not statistically significant. In contrast, responses were similar for the veterinarians in all four states, averaging around 33 percent.
While the results were not significant for the physicians, it could be hypothesized that a larger physician response rate would have shown a statistically significant effect between the states because the local public health infrastructures differ in one key aspect: physician leadership. In New York State, local public health agencies that serve populations greater than 250,000 people are, by law, required to be led by public health physicians.59 No similar requirement exists in the other three states, and as a result, physician leadership is minimal to nonexistent.
Rightly or wrongly, physicians are more likely to trust and listen to individuals with credentials similar to their own, rather than to those whom they perceive as not being as highly educated–a phenomenon that could be called “The Trusted Colleague Effect.”
Since very few, if any, local public health agencies are led by individuals with doctorates in veterinary medicine, much less have veterinarians on staff who could communicate with the veterinary community, it is to be expected that veterinarians would have very low opinions of local public health capabilities to handle crises involving animals. That was indeed the finding in this survey. Of the three groups studied, the veterinarians had the lowest opinion of local public health capabilities.
However, it is also to be expected that veterinarians would have higher levels of trust in their state agencies, and the study confirmed this. Veterinarians had much higher levels of trust for their state public health and agriculture colleagues’ capabilities. This was particularly true regarding the state agriculture capabilities, and could be explained by the

34
fact that these agencies often have several veterinarians on staff. Some state veterinarians, particularly the state veterinarian in New Hampshire, were well-known and trusted by the veterinary community. A few state public health agencies also employ veterinarians who communicate with their colleagues in agriculture.
Local Public Health and Federal Biodefense Funding
Those local public health agencies that received federal biodefense funds spent them on improving surveillance and, in a few cases, laboratory capabilities.60 The key issue was whether or not they had received the funds. The majority of local public health agencies dependent upon local funding sources as their primary form of support, were less likely to have received federal biodefense funds than agencies that primarily received state funding. One reason for this might be that states whose payment infrastructures are already established to distribute funds to local agencies would be in a better position to distribute the federal funds. A hypothesis, taking this issue a step further, could be that states in which public health funding is mostly a local affair, might be at a disadvantage in disease surveillance and control, compared to those whose funding and functions are regional in scope. As the saying goes, “He who pays the piper calls the tune.” Locally funded agencies might have different priorities than those that are state-funded. Many locally funded agencies, like those in New Jersey, would be likely to focus on local concerns, such as restaurant and sanitation system inspections, dead-animal pickups, and lead abatement issues rather than the collection of disease surveillance data.61 Such local activities, while important, are not exercises that prepare for controlling severe communicable disease outbreaks such as pandemic influenza. Federal assistance grants can improve the situation in the short term, but such grants are inherently unstable and should not be expected to maintain the long-term investments needed for restructuring local public health.

35
VI. Conclusions and Recommendations
The purpose of this in-depth study of four states, over a two-year period, was to examine the ways in which the local and state public health and agriculture departments were responding to the threat of bioterrorism and novel infectious disease outbreaks. The preparedness capabilities studied included; leadership, disease surveillance, laboratory capabilities, clinical capabilities, communications, and funding. A systems analysis was conducted to assess whether or not the complexity of a state’s infrastructure had any effect on the pertinent participants’ knowledge of how it worked, and how to interact with it. Finally, since the federal government has allocated significant funds to improve public health capabilities, the study also assessed how the states and local communities were spending these funds, assuming they had been received. The survey response rates for the local public health agencies and veterinarians were respectable, and the findings from these study participants provide a reasonably good assessment of the state of affairs in these two groups. Unfortunately, the physician response rate was poor, and somewhat biased toward an older male group. Any conclusion derived from this group, therefore, should be made with caution. However, that having been said, many of the physician responses were surprisingly similar to the veterinarian responses, such as knowledge of whether or not their community had a local public health agency, and self-assessed capabilities of recognizing an unusual infectious disease in a patient.
The primary conclusions and recommendations are as follows:
1. The chain of command in a public health crisis needs to be much better articulated,
particularly for the “troops.” 62 Most of these troops expect, in some cases, incorrectly, to have an appointed person with professional expertise who will serve as the “leader” during such a time of crisis rather than an elected official who ultimately has the legal responsibility for any final outcomes.
2. There is minimal physician and veterinarian engagement with local public health
agencies. Over a quarter of both respondent groups didn’t even know if there was a local public health agency in their community. The problem might not stem entirely from the professionals. There have been reports of projects in which the local public health agencies were so difficult to work with that the volunteer physician groups gave up.63 Public health needs to do a better job of reaching out to physicians and veterinarians.
3. There is minimal communication between the physicians and veterinarians. The
veterinarians expressed a greater interest in developing collaborative relationships than the physicians. One possible explanation is that most of the veterinarians are generalists and view these public health issues as being relevant to their practice. In contrast, most of the physicians are specialists, and do not view these issues as

36
relevant, even though more specialists than primary care physicians indicated that they had notified local health departments more frequently in the past five years.
4. There is some evidence to suggest that the more complicated the public health
system, the greater the risk of confusion among those who interact with it, but the results are not conclusive. This study was limited because it included only four states, there was bias with the physician sample, and there were other confounding variables such as percentage of primary care, and practice volume. The complexity of the human public health system appeared to have less of an impact on veterinarians than on physicians. There was some evidence that animal disease reporting was better understood when it was kept to one agency rather than splitting it between agencies. Both the physicians and veterinarians indicated that the most important issue they cared about in voluntary reporting was “time required.” Ideally, disease reporting should be simple and consistent across state lines so that practitioners who work in more than one state do not have to struggle with different reporting systems.
5. Commercial and hospital laboratories appeared to be the main source of infectious
disease reporting for local public health agencies. Infection-control nurses were the second largest source, and physicians were the third. While confirmatory test results are extremely important, it is not clear whether the current reliance on laboratories to report to public health authorities may or may not contribute to significant time delays, especially if the tests are inconclusive, nonconfirmatory, or become lost. Studies should be carried out promptly to determine if this situation is pervasive in many, if not all, U.S. states. If it is pervasive, then an in-depth analysis of commercial and hospital laboratory capabilities and oversight should be done by an independent body such as the Government Accountability Office.64 Also, a larger percentage of physicians relative to the veterinarians did not know where to send their laboratory specimens if they had a patient with an unusual infectious disease. The complicated medical practice environment might be one reason for this finding, but this study did not examine this issue.
6. Departments of agriculture are the lead agencies for animal disease surveillance
and response, yet the primary mission for many departments has been to promote agriculture, not disease control. Animal vaccination and disease statistics were lacking in all four states. (The USDA has some livestock disease data, but it is limited. The CDC has animal data for rabies and West Nile virus only.) Part of the problem may be due to farmers’ concerns about proprietary and confidential information being disclosed to the public.65 However, for there to be an adequate public health response to a severe infectious disease outbreak, such as avian influenza, for example, it is crucial that comprehensive current information be readily available. One solution would be to have all state agriculture departments specifically include animal disease surveillance and control in their missions. If this is not possible, then a Department of Animal Health should be created, whose sole mission would be to detect and control disease outbreaks in all species of animals. As the West Nile virus outbreak in New York City in 1999 showed, the
37
surveillance of disease in wildlife and zoo animals is extremely important for early detection of zoonotic disease outbreaks. Animals that spend all of their time outdoors serve as extremely important sentinels; developing and maintaining surveillance systems of these animals should be a national priority.
Finally, there needs to be free, easily accessible, comprehensive census data for all types of animals. The USDA has census data for livestock, and the AVMA publishes a book that includes data on companion animal ownership that is based on household surveys. Ideally, the U.S. census bureau should add companion animal ownership to its census every ten years. No organization gathers specific data for wildlife, which admittedly, would be difficult to obtain. Nevertheless, it is not easy to calculate rates for animal diseases when no denominator is available.
7. Few local public health agencies employ physicians or veterinarians on staff, and
very few employ them full-time. A larger percentage employ a few nurses, but even so, in the event of a public health crisis, most local public health agencies would be almost entirely dependent upon volunteers, local clinics, and the National Guard to provide pre-hospital clinical and/or preventive services, such as vaccination or the dispensing of medications. As evidenced by the Hurricane Katrina debacle in New Orleans and the Gulf Coast, if a sizable fraction of any state’s National Guard is deployed at a distance, such as to a foreign country during the crisis, then the state’s ability to provide adequate clinical services would be severely diminished. Local communities are starting to recruit volunteers, but it is not clear if this effort will suffice. If too few people volunteer, then states might have to consider mandatory conscription of licensed clinical professionals in order to meet local needs during crisis situations. Another possibility could be to team up counties with “sister counties” in other states that would come to each other’s aid during public health crises.
8. Most of the local public health agencies planned to use multiple modes of
communication with health professionals, their own staff, and the public during a crisis. However, any assumption that these communication networks would be functional at such times should be made with caution considering the lack of interactive communication that bedeviled first responders during 9/11 and was still a major cause of confusion during efforts to cope with Hurricane Katrina five years later. Without question, the establishment and preservation of reliable and alternative communication capabilities is absolutely basic to dealing with any type of crisis. In addition, political and professional leaders must be identified, and their roles clearly established well before an outbreak takes place, so that vital communication issues, such as “whom,” “how,” “when,” and with “what” are known to all and can immediately be acted upon by the appropriate individuals.
Again, this raises the question of leadership: who should be conveying important information to the health professionals and the public in order to ensure their trust and cooperation? State and local public health commissioners, rather than elected

38
officials, might well be the best individuals for providing both crisis updates and health advice.
9. Physicians’ and veterinarians’ opinions of local public health capabilities were low. This is especially concerning since both groups’ participation with local public health agencies would be vital during public health crises. These findings deserve further investigation in order to determine what factors contribute to these poor opinions. One possible speculation is that there are all too few physicians and veterinarians who are currently at work in local public health agencies and thus, in a position to generate collaborative and trusting relationships with their colleagues.
10. Local public health agencies made use of the federal biodefense funds if they
received them. The study found that local public health agencies that depend upon local funding sources were 11 times less likely to have received federal biodefense funds than those that receive most of their funding from the state. It seems that the state public health funding infrastructure impacts the distribution of federal biodefense funds. Local agencies that received federal biodefense funding were more likely to have hired new surveillance staff and purchased new equipment, and to consider themselves more capable of responding to a severe outbreak than were agencies that had not received such funds. Local public health agencies that depend upon local funding as their primary source of revenue may be at a disadvantage compared to those that receive state-level funding.
Since only four states were surveyed, two of which had very few local public health agencies, additional studies are needed right away to determine if these results are similar in other states.
39
VII. Epilogue
In the course of working on this project two issues came up that were discussed in the midterm report, and deserve reiteration in this, the final report. The first is the growing national obsession with secrecy, or the lack of it; the second is whether there has been a decline in what has been called our nation’s “social capital”–the sense of community spirit that has always been America’s pride. The issue of bureaucratic secrecy seems especially timely given current concerns about excessive governmental secrecy and its erosion of public trust. During my series of interviews with state health and agriculture officials, New Jersey’s health officials, under the McGreevey administration, displayed a striking lack of willingness to share information compared with the other states. Overcoming this mistrust resulted in me negotiating a number of channels, first with the help of Princeton University’s Office of Community and State Affairs, whose director contacted the Governor’s Deputy Chief of Management and Operations. This official also had misgivings about potential bias in my study but eventually was prepared to put my case before the state’s Assistant Attorney General, who was also chair of New Jersey’s Homeland Security Task Force. It was only after this high-level official became involved that the State Health Commissioner was willing to schedule an appointment with me, and even then, he was still reluctant to cooperate. Such a level of suspicion and secrecy was unexpected and concerning; none of the other states required these efforts.
In April 2004, I attended a lecture at Princeton given by Steven Aftergood, who directs the Federation for American Scientists (FAS) Government Secrecy Project. During his talk, he discussed three types of secrecy: “genuine,” “political,” and “bureaucratic.” He considered “genuine” secrets to be the only forms of legitimate secrets; they include war plans, intelligence sources, and advanced military technologies. “Political” secrets are used to shield programs from unwanted controversy and oversight. “Bureaucratic” secrets are a reflexive type of hoarding of information often seen in bureaucracies. The New Jersey response, to me, reflected this third type of secrecy. It is a maladaptive behavior that appeared, at least in this study, to be confined to the state’s Department of Health and Senior Services. The New Jersey Department of Agriculture did not demonstrate any degree of bureaucratic hoarding of information nor did any of the agencies from the other states. Bureaucratic secrecy is not a good way to instill trust and cooperation in health professionals or the public–especially at a time when crisis looms.
The second issue is the role of the public in any kind of major health crisis. My interview with New Hampshire officials yielded some unexpected answers. I had asked the Commissioner of Agriculture, Steven Taylor, why he thought New Hampshire was ranked the “healthiest state” in the nation. He suggested several reasons– the presence of a stellar health care institution, the Dartmouth-Hitchcock Medical Center, which is committed to family medicine and has a series of community centers covering the whole state; an excellent system of full-time nurses in primary and secondary schools; no pockets of extreme poverty; and a strong sense of community spirit.

40
Indeed, when I checked the U.S. Census Bureau on percentages of people in poverty by state from 2000 to 2002, New Hampshire had the lowest three-year average (5.6 percent) of any state in the nation. Minnesota came in next with 6.5 percent, and was tied with New Hampshire in being rated the “healthiest state” in the nation in 2003. (Of the other states in the study, New Jersey had 7.8 percent, Pennsylvania had 9.2 percent, and New York had 14 percent of people living in poverty.)66 Mr. Taylor also emphasized New Hampshire’s strong sense of community spirit. Investigating this claim further, I found some important information. In Robert Putnam’s book Bowling Alone, New Hampshire was ranked among states with the highest levels of “social capital,” meaning that there is a very high rate of civic engagement and volunteerism. States with especially high levels of social capital are noted to have many benefits, among them, healthier citizens. Whether or not high social capital would improve a state’s ability to prepare for future outbreaks of disease is unknown, and endeavoring to find the answer was not part of this study. Although the surveys did ask local health agencies if they were seeking volunteers and if physicians and veterinarians were volunteering in public health preparedness activities, there were no questions about general civic engagement and volunteerism.
However, this question ought to be of paramount importance in future research, because past experience indicates that civic involvement and volunteerism are vital in bringing about a successful response to a major eruption of disease. The success of New York City’s response to a smallpox outbreak in 1947 was largely due to a high level of cooperation and volunteerism by the city’s population. More than 3,000 people, who were not necessarily doctors and nurses, volunteered to help with the mass vaccination campaign by helping run the clinics and getting people vaccinated. Of concern in Putnam’s book is the finding that social capital has been dwindling dramatically over the past 40 years. Members of the “greatest generation” were unusually good citizens who got involved with organizations–and they still do in their retirement. The era of the “baby boomers,” on the other hand, has been marked by a falling off in civic engagement that began in the 1960s. Putnam names various contributing factors: disintegration of the family as a unit, generational change, increased time spent at work, television, urban sprawl, and the decline of local businesses and rise of multinational corporations.67
Public involvement and volunteerism in future efforts should not be underestimated, however. Fortunately, there appeared to be very high levels of volunteerism during the September 11th terrorist attacks five years ago and in the aftermath of Hurricane Katrina’s assault on the Gulf Coast last year. However, if a crisis such as a deadly influenza pandemic should strike, it is not clear how cooperative the 21st-century public would be, especially if there were mandatory quarantines, vaccinations, and other potential infringements on civil liberties.
Public health officials would be well advised to discuss these issues with the public before such an event occurs.

A-1
Appendix A. State and Local Public Health Infrastructures and Demographics
(Demographic data from the U.S. Census Bureau Web site.) New Hampshire:
• Two local municipal health departments: Manchester and Nashua
• One locally funded, one state funded • Rest of state is largely covered by the state health
department • Persons per square mile (2000): 137.8 • Population (2003 est.): 1,287,687 • Persons below poverty (1999): 6.5% (lowest in
the nation, national average is 12.4%) • 1,726 licensed physicians per 1 million
population • Land area: 8,968 square miles • Counties: 10
New Jersey:
• Approx. 115 local health departments; 16 county, 7 regional, 41 multi-municipal, 51 municipal
• Over 500 local boards of health (1/3 of all local boards of health in the nation)
• Virtually all are locally funded • 22 LINCS sites integrated into county and
municipal local health systems • LINCS agencies funded through federal
bioterrorism grants • Population (2003 est.): 8,638,396 • Persons per square mile (2000): 1,134.4 (8 times
more densely populated than NH) • Persons below poverty (1999): 8.5% • 2,456 licensed physicians per million population • Land area: 7,417 square miles • Counties: 21

A-2
New York:
• 57 county health departments • NYC health department • NYS population (2003 est.): 19,190,115 • NYS persons per square mile (2000): 401.9 • NYS persons below poverty (1999): 14.6% • 3,935 licensed physicians per million population • NYC population (2000): 8,008,278 • NYC persons per square mile (2000): 26,402.9 • NYC persons below poverty (1999): 21.2% • Land area: 47, 214 square miles • Counties: 62
Pennsylvania:
• 9 local health departments: 5 county and 4 municipal
• 6 districts cover rest of the state • System is largely state funded • Population (2003 est.): 12,365,455 • Persons per square mile (2000): 274.0 • Persons below poverty (1999): 11% • 2,620 licensed physicians per million population • Philadelphia population (2000): 1,517,550 • Philadelphia persons per square mile (2000):
11,233.6 • Philadelphia persons below poverty (1999):
22.9% • Land area: 44, 817 square miles • Counties: 67

B-1
Appendix B. Study Methods and Respondent Demographics Table 1. Percentage of Primary Care Physician Respondents by State Table 2. Study Universe, Samples, and Response Rates
*75,559 represents the total number of licensed physicians in New York State. A random sample of 4,750 physicians (members and nonmembers) was obtained from the NYS Medical Society, which served as the base from which a random sample of 1,203 physicians was drawn.
Primary Care Physicians
New Hampshire New Jersey New York Pennsylvania
0-50 % 95 99 29 103 > 50-100 % 50 56 76 57 Total 145 155 105 160
New Hampshire New Jersey New York Pennsylvania Total
Local Health Agencies
Universe 2 115 58 15 190 Sample Size 2 115 58 15 190 Response Rate 2
(100%)84
(72%) 52
(90%) 12
(80%) 150
(79%)Physicians Universe 2,227 21,119 *75,559 32,482 131,387 Sample Size 1,253 1,233 1,208 1,203 4,897 Response Rate 55
(12%) 161
(13%) 113
(9%)173
(14%) 602
(12%)Veterinarians Universe 549 1,662 4,207 3,500 9,918 Sample Size 242 864 741 2,297 4,144 Response Rate 62
(26%) 191
(22%) 200
(27%) 617
(27%) 1,070 (26%)
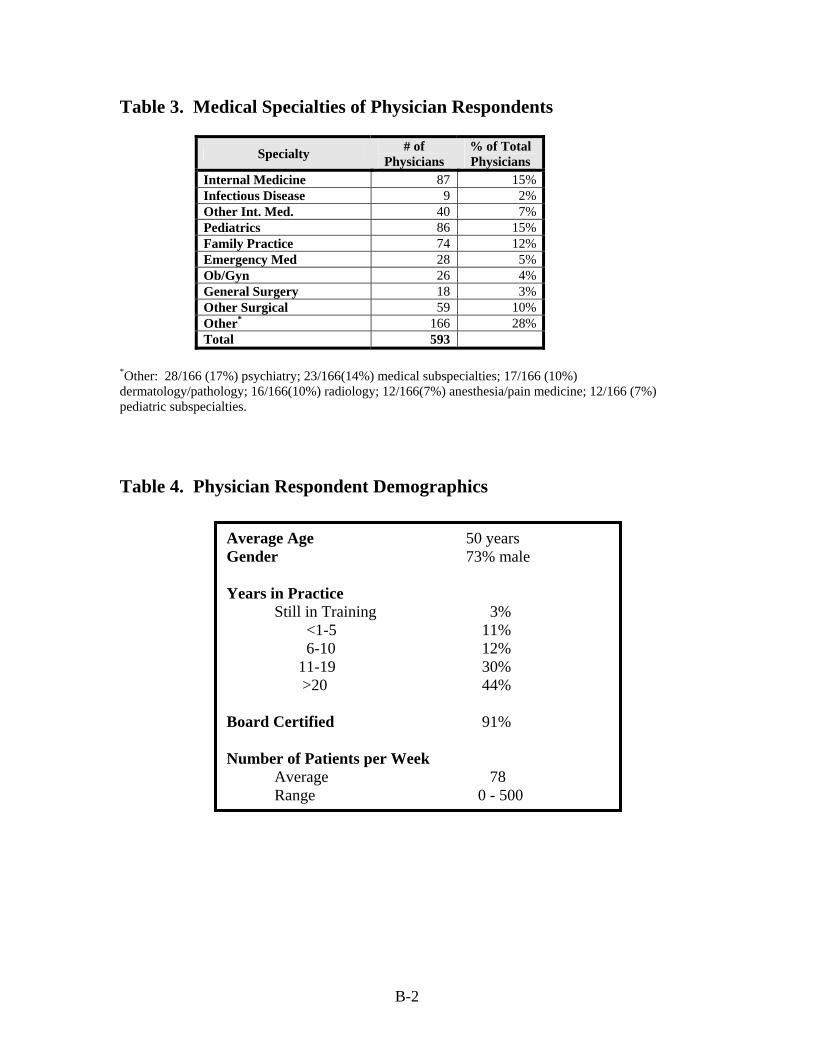
B-2
Table 3. Medical Specialties of Physician Respondents
Specialty # of Physicians
% of Total Physicians
Internal Medicine 87 15%Infectious Disease 9 2%Other Int. Med. 40 7%Pediatrics 86 15%Family Practice 74 12%Emergency Med 28 5%Ob/Gyn 26 4%General Surgery 18 3%Other Surgical 59 10%Other* 166 28%Total 593
*Other: 28/166 (17%) psychiatry; 23/166(14%) medical subspecialties; 17/166 (10%) dermatology/pathology; 16/166(10%) radiology; 12/166(7%) anesthesia/pain medicine; 12/166 (7%) pediatric subspecialties. Table 4. Physician Respondent Demographics
Average Age 50 years Gender 73% male Years in Practice Still in Training 3% <1-5 11% 6-10 12% 11-19 30% >20 44% Board Certified 91% Number of Patients per Week Average 78 Range 0 - 500

B-3
Table 5. Percentage of Veterinarian Respondents by State and Animal Type
Table 6. Veterinarian Respondents by Practice Type
*Other: 102/319 (32%) Combination of above/general practice/ mixed practice; 40/319(13%) Pathology/Lab animal/research; 14/319(4%) state or federal (APHIS vets) government.
Type of Animal
New Hampshire
New Jersey
New York Pennsylvania Total
Small Animal 92% 90% 88% 90% 90% Exotics 47% 43% 33% 35% 36% Equine 33% 27% 21% 24% 24% Swine 9% 6% 6% 9% 8% Bovine 15% 9% 14% 22% 18% Poultry 6% 5% 1% 6% 4% Other 73% 90% 76% 82% 82%
Type of Practice # of Vets % of Total
Vets General/Internal Medicine 643 63% Surgery 36 4% Emergency/Critical Care 29 3% Other* 319 31% Total 1027

B-4
Table 7. Veterinarian Respondent Demographics Table 8. Local Health Agency Respondent Position and Demographics
Average Age 46 years Gender 51% male Years in Practice
Average 17 years Range 0 to 61 years
Position Director of Agency 99 70% Bioterrorist Coord. 10 7% Epidemiologist 4 3% Other 28 20% Total 141 Average Age 49 years Gender 61% male Length of Time in Position < 6 months 4 3% >6 months < 1 year 9 6% 1-5 years 38 27% > 5 years 90 64%

B-5
Table 9. Local Health Agency Jurisdiction Population Size by State
Table 10. Number of Local Health Agency Full-Time Employees by State
Population New Hampshire New Jersey New York Pennsylvania Total
<100,000 1 55 31 1 88 (61%)
<500,000 1 16 16 3 36 (25%)
<1 Million 0 8 3 2 13 (9%)
<5 Million 0 0 1 5 6 (4%)
>5 Million 0 0 1 0 1 Total 2 79 52 11 144
Full Time Employees
New Hampshire New Jersey New York Pennsylvania Total
<50 1 65 15 3 84 (58%)
<200 1 13 31 7 52 (34%)
<500 0 2 4 0 6 (4%)
<1,000 0 0 1 1 2 (1%)
>1,000 0 0 1 0 1 Total 2 80 52 11 145

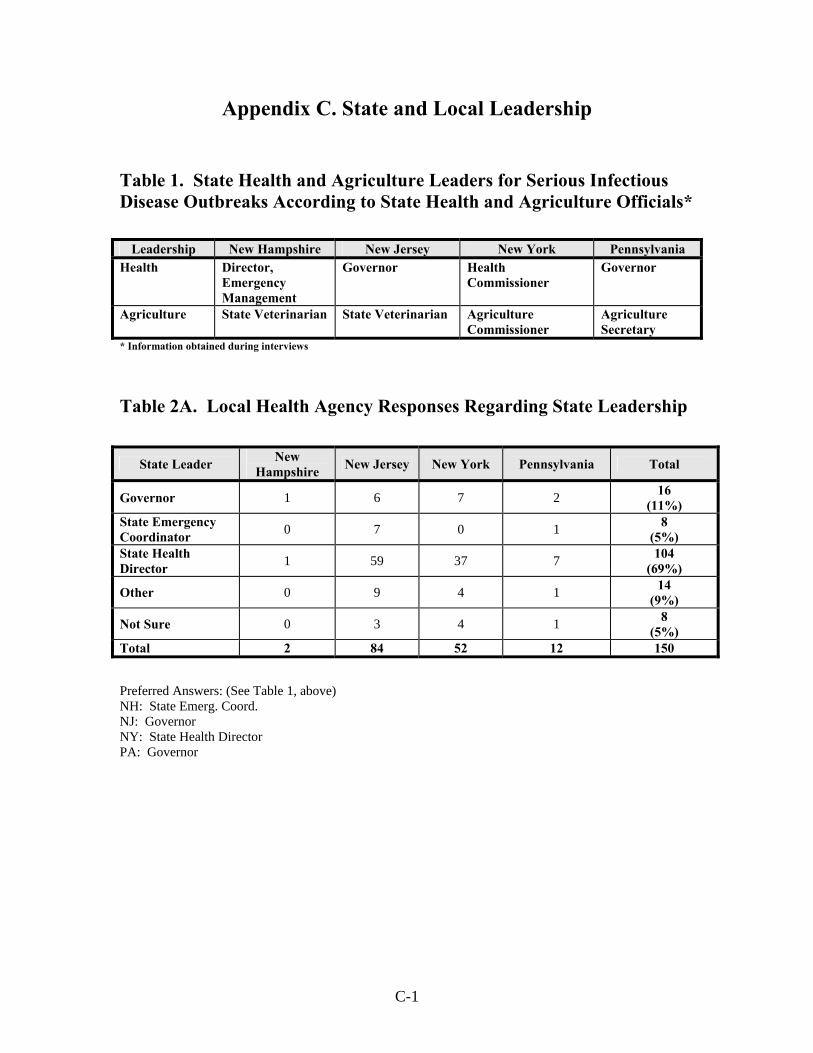
C-1
Appendix C. State and Local Leadership Table 1. State Health and Agriculture Leaders for Serious Infectious Disease Outbreaks According to State Health and Agriculture Officials*
* Information obtained during interviews
Table 2A. Local Health Agency Responses Regarding State Leadership
Preferred Answers: (See Table 1, above) NH: State Emerg. Coord. NJ: Governor NY: State Health Director PA: Governor
Leadership New Hampshire New Jersey New York Pennsylvania Health Director,
Emergency Management
Governor Health Commissioner
Governor
Agriculture State Veterinarian State Veterinarian Agriculture Commissioner
Agriculture Secretary
State Leader New Hampshire New Jersey New York Pennsylvania Total
Governor 1 6 7 2 16 (11%)
State Emergency Coordinator 0 7 0 1 8
(5%) State Health Director 1 59 37 7 104
(69%)
Other 0 9 4 1 14 (9%)
Not Sure 0 3 4 1 8 (5%)
Total 2 84 52 12 150

C-2
Table 2B. Local Health Agency Responses Regarding Local Leadership
*PHA Public Health Agency Preferred Answers: Not entirely clear from state to state. (NY: Head Local PHA) Table 3A. Physician Responses Regarding State Leadership
Preferred Answers: NH: State Emerg. Coord. NJ: Governor NY: State Health Director PA: Governor
Local Leader New Hampshire New Jersey New York Pennsylvania Total
Mayor 2 3 1 1 7 (5%)
Fire Chief 0 1 0 0 1
Head Local PHA* 0 61 43 8 112 (75%)
Local Emergency Coordinator 0 9 2 1 12
(8%)
Other 0 10 6 2 18 (12%)
Total 2 84 52 12 150
State Leader New Hampshire New Jersey New York Pennsylvania Total
Governor 16 26 22 38 102 (18%)
State Emergency Coordinator 22 15 8 13 58
(10%) National Guard 0 1 0 1 2 State Health Director 65 75 54 60 254
(44%)
Other 7 0 0 2 9 (2%)
Not Sure 38 37 21 51 147 (26%)
Total 148 154 105 165 572
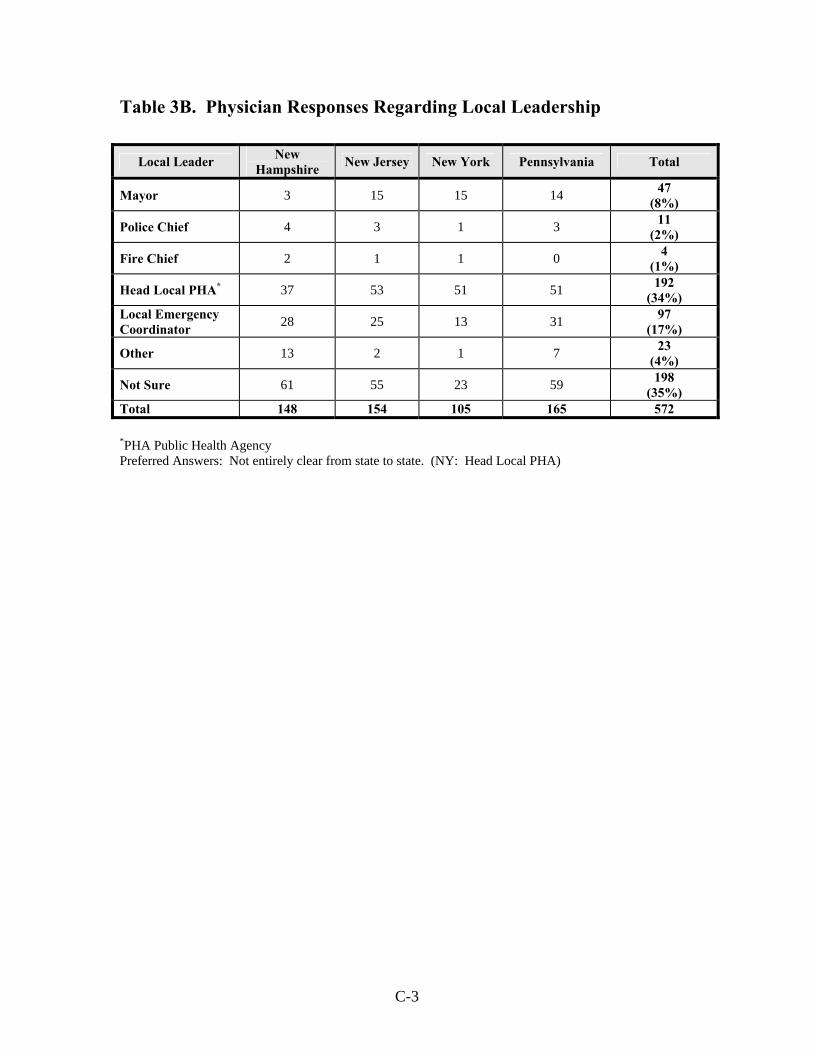
C-3
Table 3B. Physician Responses Regarding Local Leadership
*PHA Public Health Agency Preferred Answers: Not entirely clear from state to state. (NY: Head Local PHA)
Local Leader New Hampshire New Jersey New York Pennsylvania Total
Mayor 3 15 15 14 47 (8%)
Police Chief 4 3 1 3 11 (2%)
Fire Chief 2 1 1 0 4 (1%)
Head Local PHA* 37 53 51 51 192 (34%)
Local Emergency Coordinator 28 25 13 31 97
(17%)
Other 13 2 1 7 23 (4%)
Not Sure 61 55 23 59 198 (35%)
Total 148 154 105 165 572

C-4
Table 4A. Veterinarian Responses Regarding State Leadership for Companion Animals
Table 4B. Veterinarian Responses Regarding State Leadership for Livestock
State Leader Companion
Animals
New Hampshire New Jersey New York Pennsylvania Total
Governor 0 2 3 13 18 (2%)
State Emergency Coordinator 0 3 0 24 27
(3%) State Health Commissioner 0 29 26 41 96
(9%) State Veterinarian 59 129 141 444 773
(73%)
Other 1 4 5 15 25 (2%)
Not Sure 2 21 24 74 121 (11%)
Total 62 188 199 611 1060
State Leader Livestock
New Hampshire New Jersey New York Pennsylvania Total
Governor 1 5 4 8 18 (2%)
State Emergency Coordinator 0 2 1 17 20
(2%) National Guard 0 1 0 0 1 State Health Commissioner 1 23 26 38 88
(8%)
State Veterinarian 58 128 143 463 792 (75%)
Other 1 5 6 20 32 (3%)
Not Sure 1 21 19 63 104 (10%)
Total 62 185 199 609 1055

C-5
Table 4C. Veterinarian Responses Regarding Local Leadership for Companion Animals
Table 4D. Veterinarian Responses Regarding Local Leadership for Livestock
Local Leader Companion
Animals
New Hampshire New Jersey New York Pennsylvania Total
Mayor 1 2 5 12 20 (2%)
Police Chief 5 2 1 6 14 (1%)
Fire Chief 0 1 0 2 3 Head of Local Health Agency 7 102 83 181 373
(35%) Local Emergency Coordinator 2 12 2 28 44
(4%)
Local Veterinarian 8 23 34 95 160 (15%)
Other 12 11 16 44 83 (8%)
Not Sure 27 36 58 243 364 (34%)
Total 62 189 199 611 1061
Local Leader Livestock
New Hampshire New Jersey New York Pennsylvania Total
Mayor 1 0 5 4 10 (1%)
Police Chief 0 1 0 1 2 Fire Chief 0 1 1 0 2 Head of Local Health Agency 8 84 75 158 325
(31%) Local Emergency Coordinator 1 10 2 26 39
(4%)
Local Veterinarian 11 24 41 119 195 (18%)
Other 19 19 24 95 157 (15%)
Not Sure 22 49 51 208 330 (31%)
Total 62 188 199 611 1060


D-1
Appendix D. Disease Surveillance and Data Management Table 1. Physicians’ Responses to “Which government agency would you first notify if you suspected your patient had an unusual infectious disease (such as plague, tularemia, smallpox, or anthrax)?”
Table 2. Physicians’ Responses to “In the last 5 years, how often have you notified your state/local public health agency about a patient with a reportable disease?”
Government Agency
New Hampshire New Jersey New York Pennsylvania Total
Local Public Health 15 51 81 76 223
(37%)
State Public Health 117 71 17 41 247 (41%)
Federal (CDC, FBI) 11 29 10 34 85
(14%)
Other 7 4 4 10 25 (4%)
Not Sure 5 6 1 10 22 (4%)
Total 155 161 113 171 602
New Hampshire
New Jersey
New York Pennsylvania Total
State Local State Local State Local State Local State Local
Regularly 20 2 8 6 15 19 13 14 57 (10%)
41 (12%)
Occasionally 40 11 23 18 21 38 20 24 104 (17%)
91 (26%)
Rarely 28 10 33 18 22 18 23 17
106
(18%) 63
(18%)
Never 64 28 90 44 50 24 105 45 310 (52%)
142 (41%)
Do Not Remember 3 3 6 4 2 0 7 2 18
(3%) 9
(3%) Total 155 54 160 90 110 99 168 102 595 346

D-2
Table 3. Physicians’ Responses to “How satisfied were you with your state/local health agency’s response?”
Table 4. Veterinarians’ Responses to “Which government agency would you first notify if you suspected your companion animal/livestock had an unusual infectious disease (such as brucellosis, plague, or foot-and-mouth disease)?”
*A significant fraction of the NH veterinarians specifically mentioned that they would notify the State Veterinarian; some even specified him by name.
New Hampshire
New Jersey
New York Pennsylvania Total
State Local State Local State Local State Local State Local
Satisfied 66 18 35 24 47 64 28 39 176 (67%)
145 (75%)
No Opinion 18 4 23 12 9 6 23 14 73 (28%)
36 (19%)
Dissatisfied 1 1 4 6 3 5 4 1 12 (5%)
13 (6%)
Total 85 23 62 42 59 75 55 54 261 194
New Hampshire
New Jersey
New York Pennsylvania Total
Companion Livestock Companion Livestock Companion Livestock Companion Livestock Companion Livestock
Local PHA 1 0 38 9 62 16 105 32 206 (20%)
57 (6%)
State PHA 15 9 63 40 55 28 108 45 241 (23%)
122 (13%)
State Agriculture Agency 24 27 39 58 38 61 225 276 326
(32%) 422
(46%) CDC/USDA/ FDA 1 1 25 34 17 29 68 84 111
(11%) 148
(16%)
Other* 19 17 16 21 14 15 67 65 116 (11%)
118 (13%)
Not Sure 2 4 7 7 7 10 14 21 30 (3%)
42 (5%)
Total 62 58 188 169 193 159 587 523 1030 909

D-3
Table 5. Veterinarians’ Responses to “In the last 5 years, how often have you notified your local/state public health agency or agriculture agency about an animal with a reportable disease?”
New Hampshire New Jersey New York Pennsylvania
Local Health Agency
State Health Agency
State Agr
Agency
Local Health Agency
State Health Agency
State Agr
Agency
Local Health Agency
State Health Agency
State Agr
Agency
Local Health Agency
State Health Agency
State Agr
Agency Regularly 0 5 5 15 17 13 30 18 8 57 61 64 Occasionally 7 19 7 37 25 16 43 17 13 74 83 77 Rarely 5 11 14 21 34 28 29 19 24 57 72 80 Never 12 17 33 46 69 111 37 93 128 140 250 342 Do Not Remember 0 2 1 4 5 4 3 5 7 6 11 12
Total 24 54 60 123 150 172 142 152 180 334 477 575
Total
Local Health Agency
State Health Agency
State Agr Agency
Regularly 102 (16%)
101 (12%)
90 ( 9%)
Occasionally 161 (26%)
144 (17%)
113 (11%)
Rarely 112 (18%)
136 (16%)
146 (15%)
Never 235 (38%)
429 (52%)
614 (62%)
Do Not Remember
13 (2%)
23 (3%)
24 (2%)
Total 623 833 987
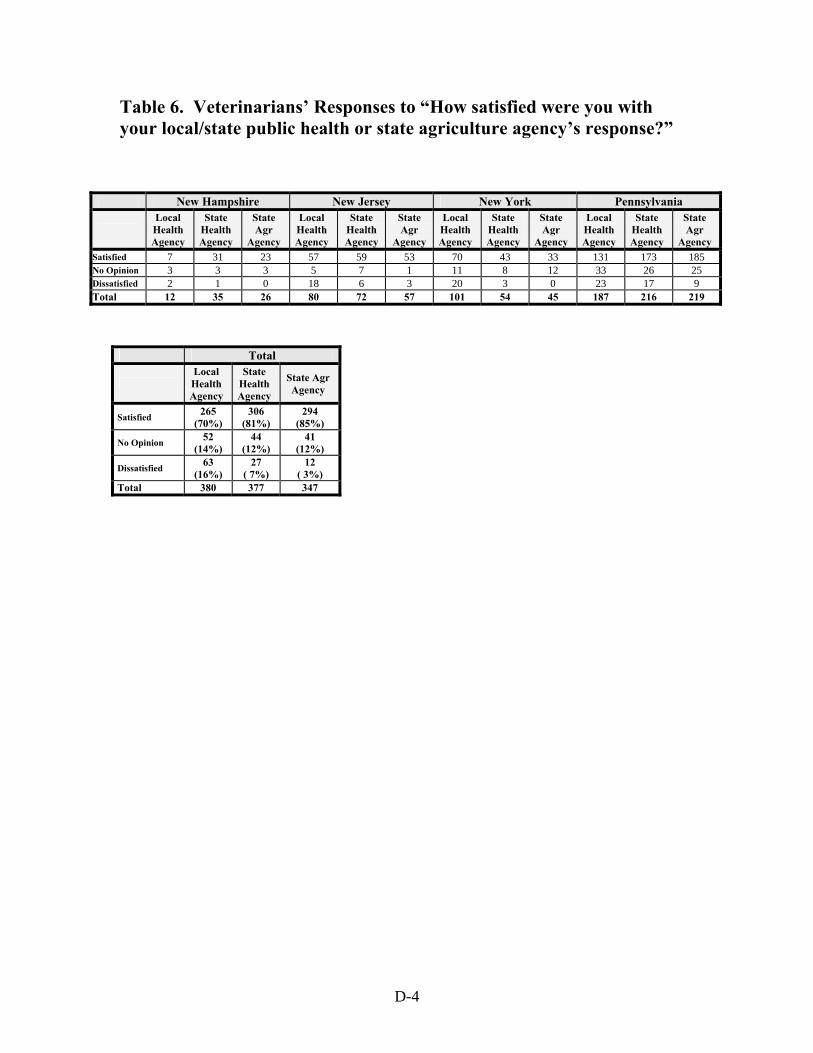
D-4
Table 6. Veterinarians’ Responses to “How satisfied were you with your local/state public health or state agriculture agency’s response?”
New Hampshire New Jersey New York Pennsylvania
Local Health Agency
State Health Agency
State Agr
Agency
Local Health Agency
State Health Agency
State Agr
Agency
Local Health Agency
State Health Agency
State Agr
Agency
Local Health Agency
State Health Agency
State Agr
Agency Satisfied 7 31 23 57 59 53 70 43 33 131 173 185 No Opinion 3 3 3 5 7 1 11 8 12 33 26 25 Dissatisfied 2 1 0 18 6 3 20 3 0 23 17 9 Total 12 35 26 80 72 57 101 54 45 187 216 219
Total
Local Health Agency
State Health Agency
State Agr Agency
Satisfied 265 (70%)
306 (81%)
294 (85%)
No Opinion 52 (14%)
44 (12%)
41 (12%)
Dissatisfied 63 (16%)
27 ( 7%)
12 ( 3%)
Total 380 377 347
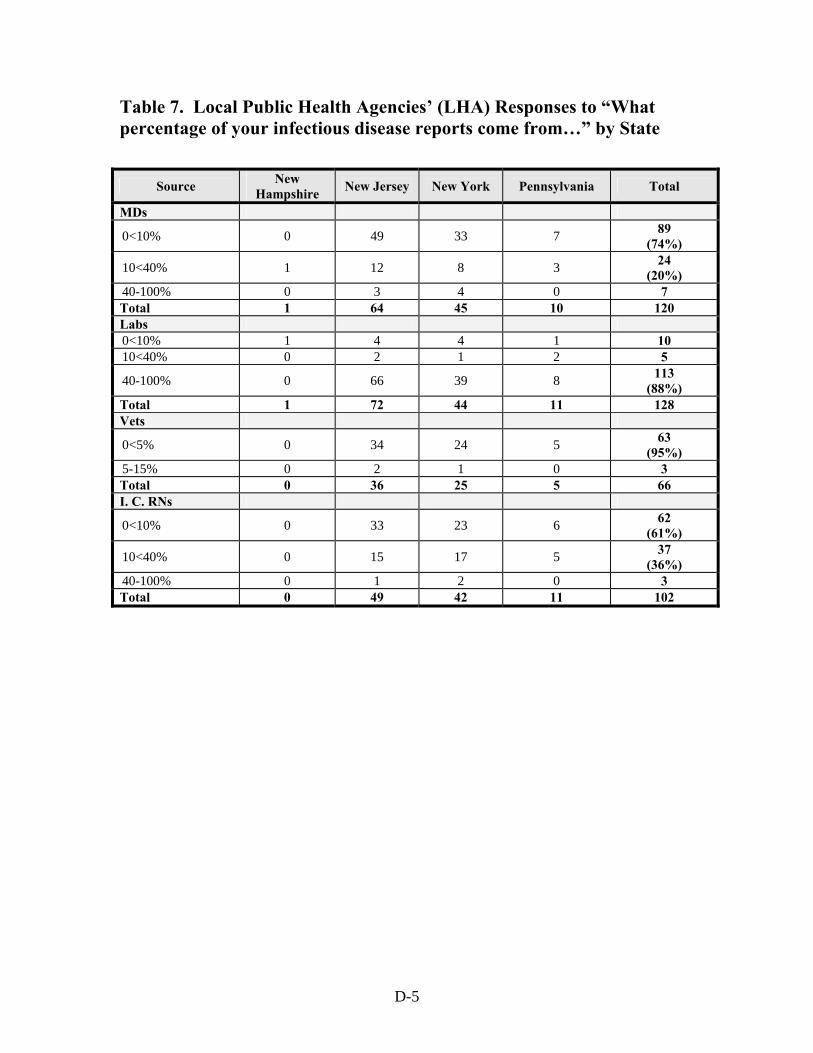
D-5
Table 7. Local Public Health Agencies’ (LHA) Responses to “What percentage of your infectious disease reports come from…” by State
Source New Hampshire New Jersey New York Pennsylvania Total
MDs
0<10% 0 49 33 7 89 (74%)
10<40% 1 12 8 3 24 (20%)
40-100% 0 3 4 0 7 Total 1 64 45 10 120 Labs 0<10% 1 4 4 1 10 10<40% 0 2 1 2 5
40-100% 0 66 39 8 113 (88%)
Total 1 72 44 11 128 Vets
0<5% 0 34 24 5 63 (95%)
5-15% 0 2 1 0 3 Total 0 36 25 5 66 I. C. RNs
0<10% 0 33 23 6 62 (61%)
10<40% 0 15 17 5 37 (36%)
40-100% 0 1 2 0 3 Total 0 49 42 11 102

D-6
Table 8. Incidence Rates (New Cases of Disease per 100,000 Population) for the Previous Year for 14 Vaccine-Preventable Diseases
Number and Percentage of LHA Providing Numerical Answers
Disease
New Hampshire (base = 2)
New Jersey (base = 84)
New York (base = 52)
Pennsylvania
(base = 12)
Total
(base=150) Polio 1 11 24 4 40 Measles 1 12 26 5 44 Mumps 1 11 25 4 41 Rubella 1 12 26 5 43 Diphtheria 1 10 26 4 41 Pertussis 1 13 32 5 51 Tetanus 1 10 24 5 40 Hemophilus Influenza 1 11 26 4 42
Varicella 0 2 7 2 11 Pneumococcal Disease 0 2 16 3 21
Influenza 0 1 9 3 13 Hepatitis A 1 10 29 5 44 Hepatitis B 0 11 29 5 45 Meningococcal Disease 0 9 30 5 44
Average 0.6 (32%)
9 (11%)
24 (45%)
4 (33%)
37 (25%)

E-1
Appendix E. Laboratory Capabilities and Specimen Submissions
Table 1. “What Is the Biosafety Level of Your Local Public Health Laboratory?”*
*Responses tabulated represent survey respondents’ answers, which may not reflect the truth about the state of the local public health laboratories. Table 2. “How Capable Would Your Laboratory Be in Handling at Least One Category an Agent (Such as Yersinia Pestis, Anthrax, Clostridium Botulinum Toxin, Francisella Tularensis) of the CDC’s List of Possible Bioterrorist Agents?”
Biosafety Level
New Hampshire New Jersey New York Pennsylvania
Total
BSL1 1 2 0 0 3 (18%)
BSL2 0 3 2 0 5 (29%)
BSL3 0 1 3 1 5 (29%)
Not Sure 0 0 2 0 2 (12%)
No Answer 0 2 0 0 2 (12%)
Total 1 8 7 1 17
Capability Total
Very Capable 5
Somewhat Capable
2
Somewhat Incapable 1
Very Incapable 8 No Answer 1 Total 17

E-2
Table 3. “How Well Would Your Laboratory Handle a Two-Fold or Five-Fold Increase in Specimens from Your Baseline in the Event of a Severe Infectious Disease Outbreak?” Table 4. Laboratory Directors’ Qualifications and Years of Experience by State
Capability Two-Fold Increase
Five-Fold Increase
Very Capable 4 2 Somewhat Capable 4 0
Not Sure 1 5 Somewhat Overwhelmed 2 2
Very Overwhelmed 5 7
No Answer 1 1 Total 17 17
Qualifications (PhD)
New Hampshire New Jersey New York Pennsylvania Total
Yes 0 4 4 2 10 No 1 3 3 0 7 Don’t Know 0 0 0 2 2 Total 1 7 7 4 19
Years Experience
New Hampshire New Jersey New York Pennsylvania Total
0-5 1 0 0 0 1 6-10 0 1 1 0 2 >10 0 5 5 3 13 Don’t Know 0 1 1 1 3 Total 1 7 7 4 19
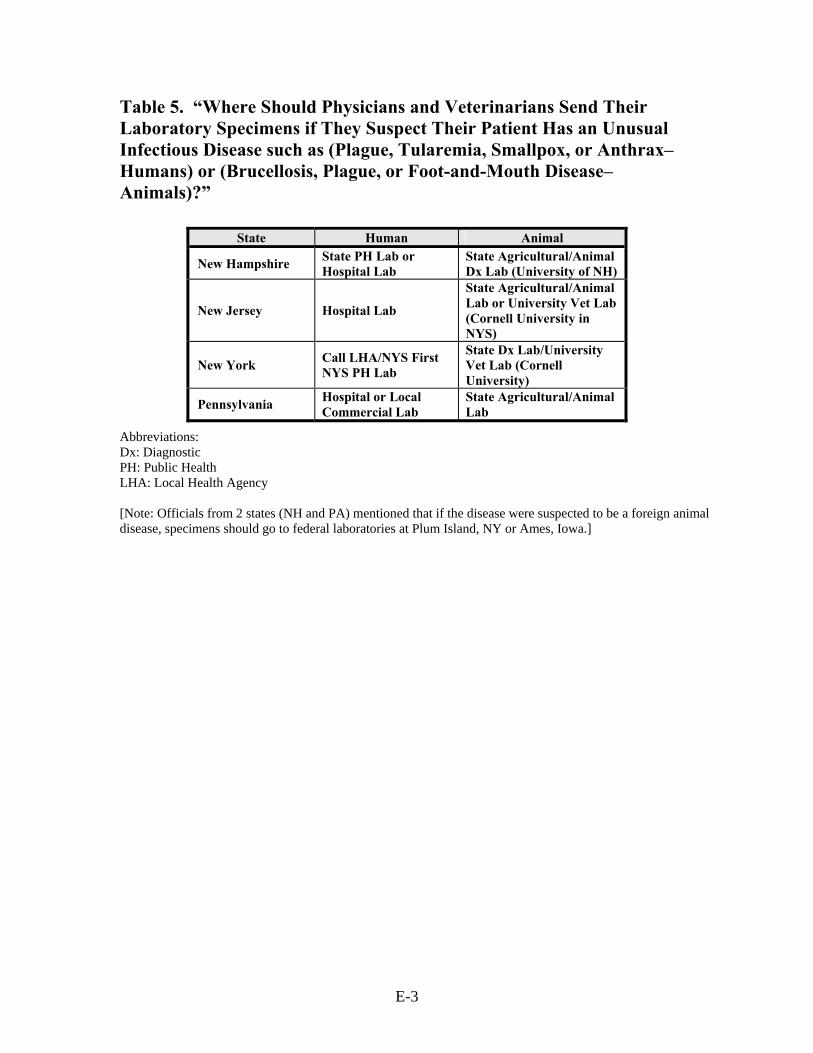
E-3
Table 5. “Where Should Physicians and Veterinarians Send Their Laboratory Specimens if They Suspect Their Patient Has an Unusual Infectious Disease such as (Plague, Tularemia, Smallpox, or Anthrax–Humans) or (Brucellosis, Plague, or Foot-and-Mouth Disease–Animals)?”
Abbreviations: Dx: Diagnostic PH: Public Health LHA: Local Health Agency [Note: Officials from 2 states (NH and PA) mentioned that if the disease were suspected to be a foreign animal disease, specimens should go to federal laboratories at Plum Island, NY or Ames, Iowa.]
State Human Animal
New Hampshire State PH Lab or Hospital Lab
State Agricultural/Animal Dx Lab (University of NH)
New Jersey Hospital Lab
State Agricultural/Animal Lab or University Vet Lab (Cornell University in NYS)
New York Call LHA/NYS First NYS PH Lab
State Dx Lab/University Vet Lab (Cornell University)
Pennsylvania Hospital or Local Commercial Lab
State Agricultural/Animal Lab
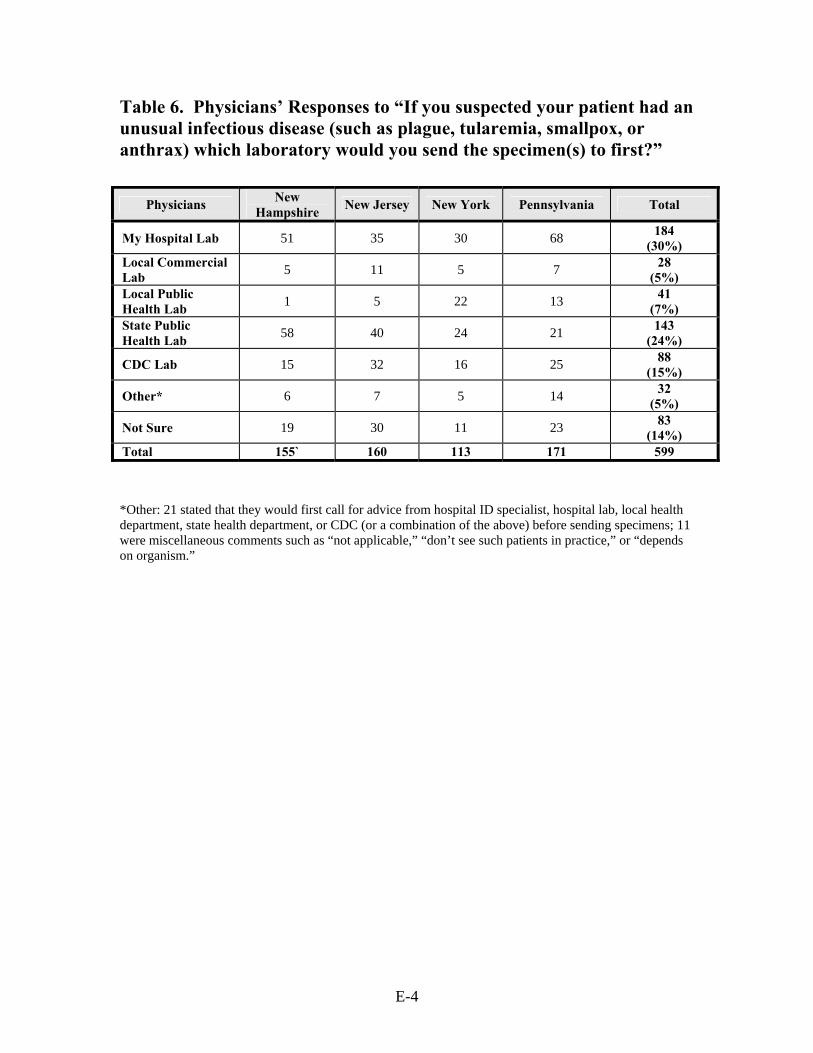
E-4
Table 6. Physicians’ Responses to “If you suspected your patient had an unusual infectious disease (such as plague, tularemia, smallpox, or anthrax) which laboratory would you send the specimen(s) to first?”
*Other: 21 stated that they would first call for advice from hospital ID specialist, hospital lab, local health department, state health department, or CDC (or a combination of the above) before sending specimens; 11 were miscellaneous comments such as “not applicable,” “don’t see such patients in practice,” or “depends on organism.”
Physicians New Hampshire New Jersey New York Pennsylvania Total
My Hospital Lab 51 35 30 68 184 (30%)
Local Commercial Lab 5 11 5 7 28
(5%) Local Public Health Lab 1 5 22 13 41
(7%) State Public Health Lab 58 40 24 21 143
(24%)
CDC Lab 15 32 16 25 88 (15%)
Other* 6 7 5 14 32 (5%)
Not Sure 19 30 11 23 83 (14%)
Total 155` 160 113 171 599

E-5
Table 7. Veterinarians’ Responses to “If you suspected your companion animal patient had an unusual infectious disease suggestive of a bioterrorist attack, which laboratory would you send the specimen(s) to first?”
*Other: 32 (ask state vet or state officials first), 8 (USDA Lab), 7 (Antech labs in NYS)
Veterinarians Companion Animal
New Hampshire New Jersey New York Pennsylvania Total
Local Hospital Lab 1 3 7 6 17
(2%) Local Commercial Lab 1 7 11 12 31
(3%) Local Public Health Lab 0 0 5 18 23
(2%) State Public Health Lab 13 35 26 71 145
(14%) State Agricultural /Animal Lab 26 85 57 338 506
(49%)
CDC Lab 4 14 18 38 74 (7%)
University Vet Lab 10 10 35 39 94
(9%)
Other* 4 21 14 37 76 (7%)
Not Sure 3 12 21 32 68 (7%)
Total 62 187 194 591 1034

E-6
Table 8. Veterinarians’ Responses to “If you suspected your livestock animal patient had an unusual infectious disease suggestive of a bioterrorist attack, which laboratory would you send the specimen(s) to first?”
*Other: 31 (ask state vet or state officials first), 18 (USDA Lab at Ames, Iowa, or Plum Island, NY), 8 (multiple labs)
Veterinarians Livestock
New Hampshire New Jersey New York Pennsylvania Total
Local Hospital Lab 0 3 4 2 9
(1%) Local Commercial Lab 0 1 1 1 3
(0%) Local Public Health Lab 0 0 3 4 7
(0%) State Public Health Lab 11 20 14 46 91
(10%) State Agricultural /Animal Lab 25 97 62 329 513
(57%)
CDC Lab 5 14 10 36 65 (7%)
University Vet Lab 7 3 35 19 64
(7%)
Other* 5 17 13 47 82 (9%)
Not Sure 4 12 17 36 69 (8%)
Total 57 167 159 520 903

F-1
Appendix F. Clinical Capabilities Table 1. Frequency of Clinical Services, Such as Well-Baby Care, Sexually Transmitted Disease Screening and Treatment, Vaccinations, Family Planning, HIV Screening, or Tuberculosis Screening at Local Public Health Agencies
Clinical Services New Hampshire New Jersey New York Pennsylvania Total
Regularly 2 65 52 10 129 (89%)
Occasionally 0 7 0 1 8 (5%)
Rarely 0 4 0 0 4 (3%)
Never 0 4 0 0 4 (3%)
Total 2 80 52 11 145

F-2
Table 2. Vaccines Administered by Local Public Health Agencies
*Other Vaccines: Travel vaccines (14), Rabies post-exposure for humans (9), Smallpox (4), Mantoux screening (2)
Vaccines Total LHA NO YES Regularly Occasionally Rarely
Polio 142 17 125 (88%) 117 8 1
Measles 142 14 128 (90%) 122 6 1
Mumps 143 15 128 (90%) 122 6 1
Rubella 142 14 128 (90%) 121 5 1
Diphtheria 143 15 128 (90%) 121 6 1
Pertussis 142 14 128 (90%) 119 8 1
Tetanus 143 15 128 (90%) 117 8 3
Hemoph. Influ. 140 16 124
(89%) 111 10 3
Varicella 143 26 117 (82%) 106 9 2
Pneumonia 142 18 124 (87%) 87 33 3
Influenza 144 5 139 (97%) 108 28 2
Hepatitis A 139 67 72 (52%) 49 13 14
Hepatitis B 143 16 127 (89%) 109 12 1
Meningo. 140 70 70 (50%) 54 11 12
Other* 63 35 28 (44%) 17 8 5
Average 138 24 113 (82%) 106 12 4

F-3
Table 3. Number of Local Health Agencies Offering SpecificVaccines by State Table 4. Number of Full-Time Physicians (FT MDs) and Part-Time Physicians (PT MDs) Employed by Local Health Agencies, by State
State Measles Varicella Hepatitis A Yes No Yes No Yes No New Hampshire 1 0 1 0 1 0
New Jersey 66 13 56 24 18 60 New York 51 1 50 2 46 5 Pennsylvania 10 0 10 0 7 2
Full Time/ Part Time
MD’s
New Hampshire
New Jersey
New York
Pennsylvania
Total
Full Time
0 1 58 29 3 91 (76%)
1-5 1 5 15 4 25 (21%)
6-35 0 1 2 0 3 (3%)
Total 2 64 46 7 119 Part Time
0 1 22 (31%)
10 (21%) 1 34
(26%)
1-5 1 47 34 7 89 (68%)
6-15 0 3 2 1 6 (5%)
100 0 0 1 0 1 (1%)
Total 2 72 47 9 130

F-4
Table 5. Local Health Agencies’ Number of Full-Time Physicians (FT MDs) by Number of Part-Time Physicians (PT MDs)
Part Time MD’s
Full Time MD’s
Total
0 1-5 6-35
0 28 5 1 34 (30%)
1-5 61 12 1 74 (64%)
6-15 1 5 0 6 (5%)
100 0 0 1 1 (1%)
Total 90 22 3 115

F-5
Table 6. Number of Full-Time (FT RNs) and Part-Time (PT RNs) Registered Nurses* Employed by the Local Health Agencies, by State
* The survey did not ask about nurse practitioners or physician assistants.
Full Time/ Part Time
RN’s
New Hampshire
New Jersey
New York
Pennsylvania
Total
Full Time
0-5 1 58 3 1 63 (46%)
6-20 0 10 20 3 33 (24%)
21-40 1 4 22 5 32 (23%)
41-121 0 2 6 1 9 (7%)
Total 2 74 51 10 137 Part Time
0-5 2 68 31 6 107 (82%)
6-10 0 2 12 0 14 (11%)
11-45 0 3 5 1 9 (7%)
46-637 0 0 1 0 1 (0%)
Total 2 73 49 7 131

F-6
Table 7. Local Health Agencies’ Number of Full-Time (FT RNs) by Number of Part-Time (PT RNs) Registered Nurses
Table 8. Physicians’ Responses to “How prepared do you believe you are to recognize a patient with an unusual infectious disease (such as plague, tularemia, smallpox, or anthrax)?”
Part Time RN’s Full Time RN’s Total
0-5 6-20 21-40 41-121
0-5 60 27 15 3 105 (83%)
6-10 1 3 8 1 13 (10%)
11-45 0 1 4 4 9 (7%)
Total 61 31 27 8 127
Physicians Preparedness
Very Prepared 33 (6%)
Somewhat Prepared
266 (44%)
Neither 81 (13%)
Unprepared 166 (28%)
Very Unprepared 56 (9%)
Total 602
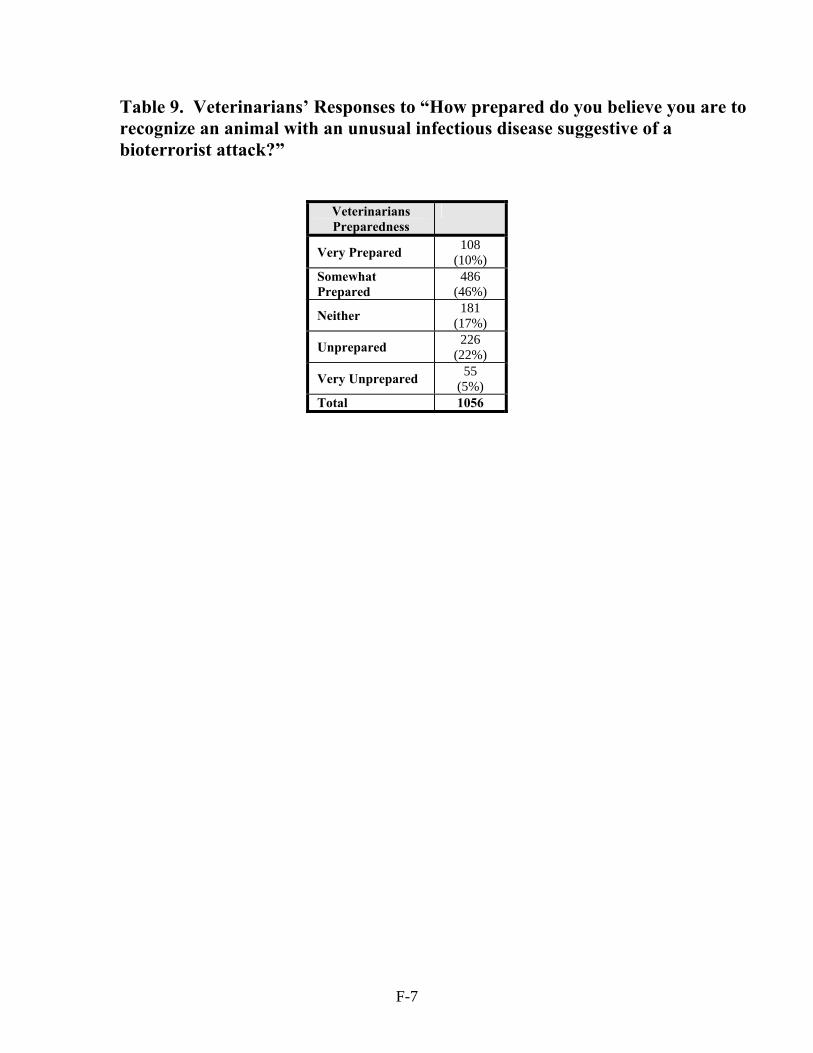
F-7
Table 9. Veterinarians’ Responses to “How prepared do you believe you are to recognize an animal with an unusual infectious disease suggestive of a bioterrorist attack?”
Veterinarians Preparedness
Very Prepared 108 (10%)
Somewhat Prepared
486 (46%)
Neither 181 (17%)
Unprepared 226 (22%)
Very Unprepared 55 (5%)
Total 1056


G-1
Appendix G. Communications Table 1. Local Health Agencies’ Responses to “How often do you send information to physicians regarding the reporting of infectious diseases?”
Table 2. Local Health Agencies’ Responses to “How often does your agency send out public health information to the physicians and other health care professionals in your local community?”
Frequency
New Hampshire
New Jersey
New York
Pennsylvania
Total
Every Few Years 1 29 4 1 35
(27%)
Yearly 0 10 26 3 39 (30%)
Every Six Months 0 13 17 1 31
(23%)
Never 0 12 0 1 13 (10%)
Not Sure 0 10 2 1 13 (10%)
Total 1 74 49 7 131
Frequency New Hampshire New Jersey New York Pennsylvania Total
Regularly 0 27 40 8 75 (51%)
Occasionally 2 35 12 2 51 (35%)
Rarely 0 19 0 1 20 (14%)
Never 0 1 0 0 1 Total 2 82 52 11 147
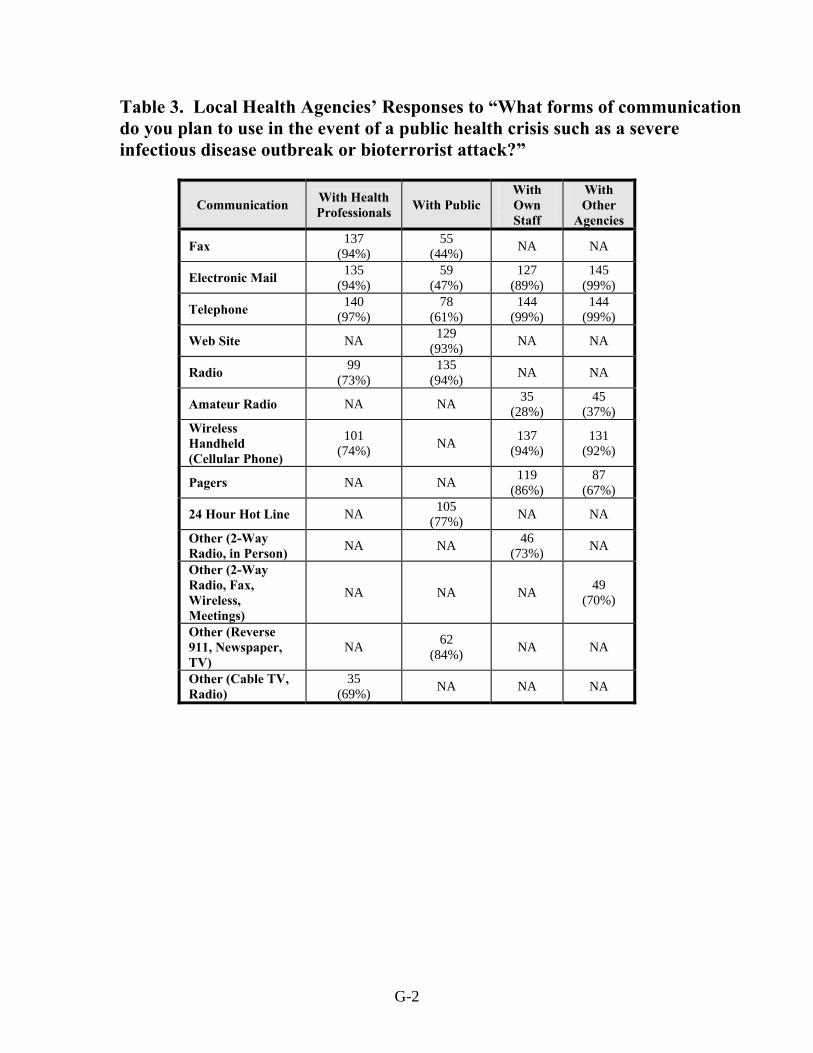
G-2
Table 3. Local Health Agencies’ Responses to “What forms of communication do you plan to use in the event of a public health crisis such as a severe infectious disease outbreak or bioterrorist attack?”
Communication With Health Professionals With Public
With Own Staff
With Other
Agencies
Fax 137 (94%)
55 (44%) NA NA
Electronic Mail 135 (94%)
59 (47%)
127 (89%)
145 (99%)
Telephone 140 (97%)
78 (61%)
144 (99%)
144 (99%)
Web Site NA 129 (93%) NA NA
Radio 99 (73%)
135 (94%) NA NA
Amateur Radio NA NA 35 (28%)
45 (37%)
Wireless Handheld (Cellular Phone)
101 (74%) NA 137
(94%) 131
(92%)
Pagers NA NA 119 (86%)
87 (67%)
24 Hour Hot Line NA 105 (77%) NA NA
Other (2-Way Radio, in Person) NA NA 46
(73%) NA
Other (2-Way Radio, Fax, Wireless, Meetings)
NA NA NA 49 (70%)
Other (Reverse 911, Newspaper, TV)
NA 62 (84%) NA NA
Other (Cable TV, Radio)
35 (69%) NA NA NA
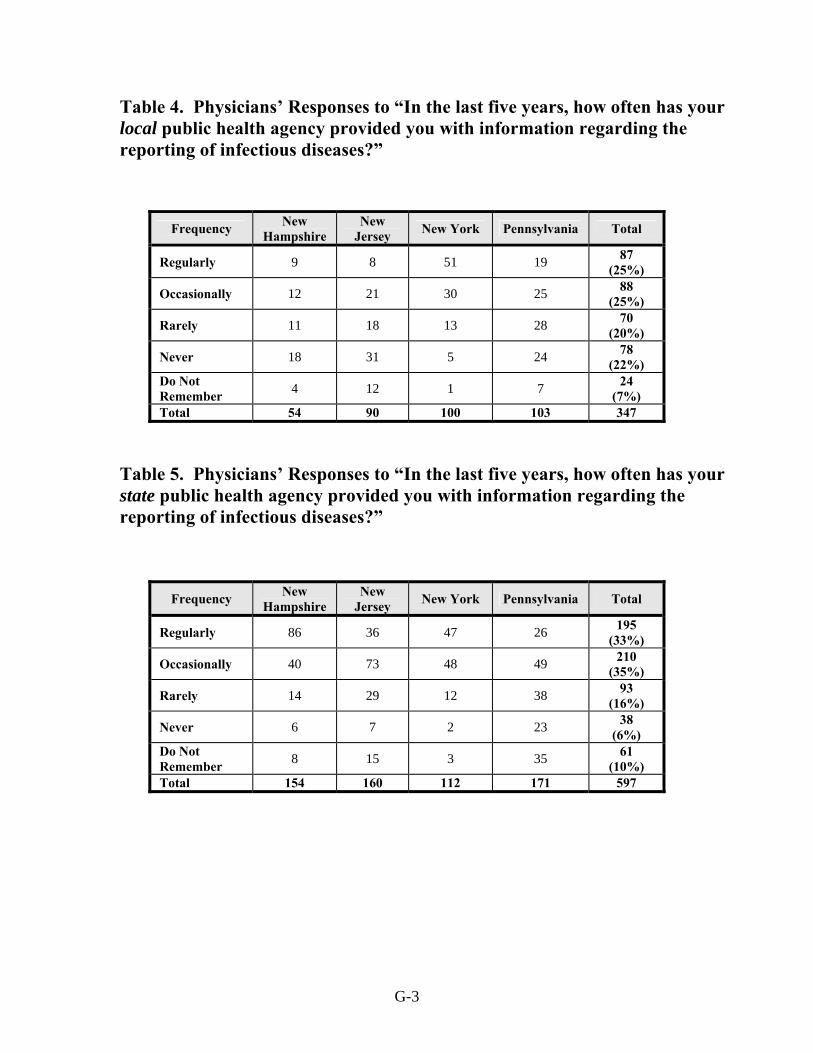
G-3
Table 4. Physicians’ Responses to “In the last five years, how often has your local public health agency provided you with information regarding the reporting of infectious diseases?”
Table 5. Physicians’ Responses to “In the last five years, how often has your state public health agency provided you with information regarding the reporting of infectious diseases?”
Frequency New Hampshire
New Jersey New York Pennsylvania Total
Regularly 9 8 51 19 87 (25%)
Occasionally 12 21 30 25 88 (25%)
Rarely 11 18 13 28 70 (20%)
Never 18 31 5 24 78 (22%)
Do Not Remember 4 12 1 7 24
(7%) Total 54 90 100 103 347
Frequency New Hampshire
New Jersey New York Pennsylvania Total
Regularly 86 36 47 26 195 (33%)
Occasionally 40 73 48 49 210 (35%)
Rarely 14 29 12 38 93 (16%)
Never 6 7 2 23 38 (6%)
Do Not Remember 8 15 3 35 61
(10%) Total 154 160 112 171 597
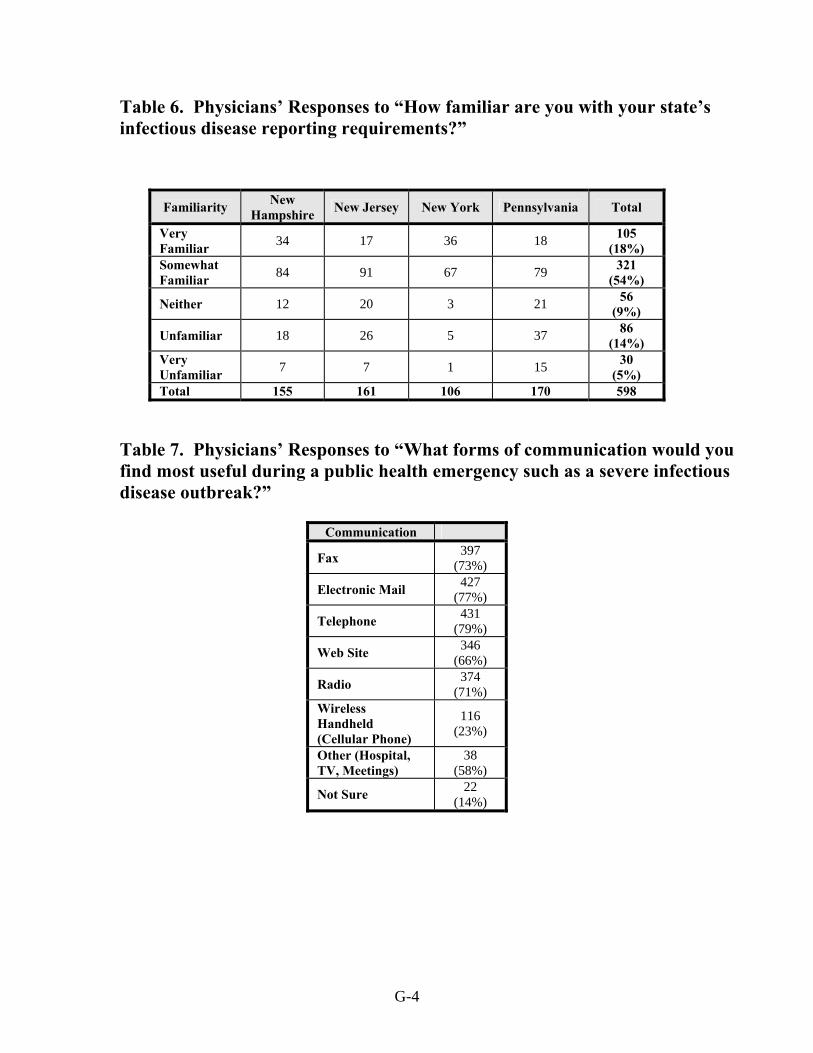
G-4
Table 6. Physicians’ Responses to “How familiar are you with your state’s infectious disease reporting requirements?”
Table 7. Physicians’ Responses to “What forms of communication would you find most useful during a public health emergency such as a severe infectious disease outbreak?”
Familiarity New Hampshire New Jersey New York Pennsylvania Total
Very Familiar 34 17 36 18 105
(18%) Somewhat Familiar 84 91 67 79 321
(54%)
Neither 12 20 3 21 56 (9%)
Unfamiliar 18 26 5 37 86 (14%)
Very Unfamiliar 7 7 1 15 30
(5%) Total 155 161 106 170 598
Communication
Fax 397 (73%)
Electronic Mail 427 (77%)
Telephone 431 (79%)
Web Site 346 (66%)
Radio 374 (71%)
Wireless Handheld (Cellular Phone)
116 (23%)
Other (Hospital, TV, Meetings)
38 (58%)
Not Sure 22 (14%)

G-5
Table 8. Physicians’ Responses to “How often do you communicate with your local veterinary colleagues regarding the emergence of any unusual animal diseases/behaviors that might impact on humans in your area?” Table 9. Physicians’ Responses to “If “Never,” how interested would you be in participating in a forum (e.g., seminar, Internet chat site) in which you could exchange such information with your veterinary colleagues?”
Communication
Regularly 4 (1%)
Occasionally 34 (6%)
Rarely 85 (14%)
Never 472 (79%)
Total 595
Interest Level
Very Interested 21 (5%)
Somewhat Interested
129 (28%)
No Opinion 111 (24%)
Uninterested 127 (28%)
Very Uninterested 73 (16%)
Total 461

G-6
Table 10. Veterinarians’ Responses to “In the last five years, how often has your local public health agency provided you with information regarding the reporting of companion animal infectious diseases such as rabies?”
Table 11. Veterinarians’ Responses to “In the last five years, how often has your state public health agency provided you with information regarding the reporting of companion animal infectious diseases such as rabies?”
Frequency of Information
New Hampshi
re
New Jersey
New York
Pennsylvania
Total
Regularly 2 35 49 82 168 (27%)
Occasionally 4 27 43 83 157 (25%)
Rarely 4 21 28 50 103 (16%)
Never 15 37 17 108 177 (28%)
Do Not Remember 0 6 7 14 27
(4%) Total 25 126 144 337 632
Frequency of Information
New Hampshire New Jersey New York Pennsylvania Total
Regularly 22 69 64 174 329 (39%)
Occasionally 22 39 52 124 237 (28%)
Rarely 3 17 2 64 106 (12%)
Never 6 19 7 86 118 (14%)
Do Not Remember 2 12 13 37 64
(7%) Total 55 156 158 485 854
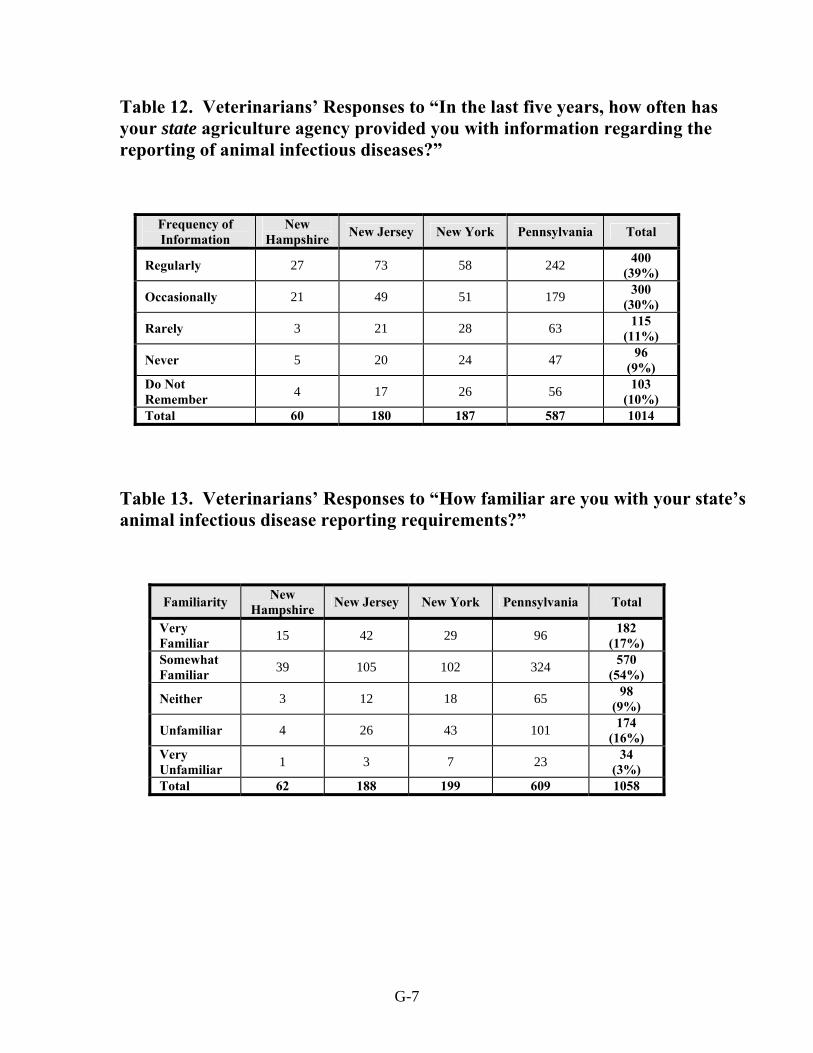
G-7
Table 12. Veterinarians’ Responses to “In the last five years, how often has your state agriculture agency provided you with information regarding the reporting of animal infectious diseases?”
Table 13. Veterinarians’ Responses to “How familiar are you with your state’s animal infectious disease reporting requirements?”
Frequency of Information
New Hampshire New Jersey New York Pennsylvania Total
Regularly 27 73 58 242 400 (39%)
Occasionally 21 49 51 179 300 (30%)
Rarely 3 21 28 63 115 (11%)
Never 5 20 24 47 96 (9%)
Do Not Remember 4 17 26 56 103
(10%) Total 60 180 187 587 1014
Familiarity New Hampshire New Jersey New York Pennsylvania Total
Very Familiar 15 42 29 96 182
(17%) Somewhat Familiar 39 105 102 324 570
(54%)
Neither 3 12 18 65 98 (9%)
Unfamiliar 4 26 43 101 174 (16%)
Very Unfamiliar 1 3 7 23 34
(3%) Total 62 188 199 609 1058
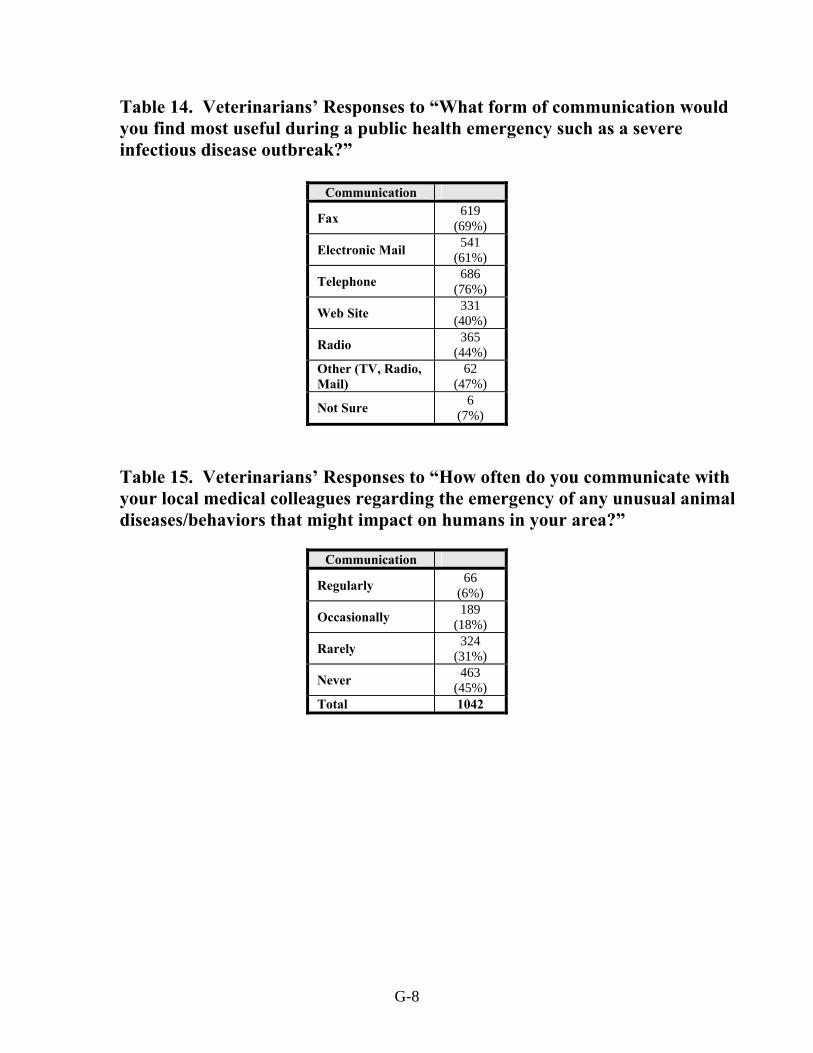
G-8
Table 14. Veterinarians’ Responses to “What form of communication would you find most useful during a public health emergency such as a severe infectious disease outbreak?” Table 15. Veterinarians’ Responses to “How often do you communicate with your local medical colleagues regarding the emergency of any unusual animal diseases/behaviors that might impact on humans in your area?”
Communication
Fax 619 (69%)
Electronic Mail 541 (61%)
Telephone 686 (76%)
Web Site 331 (40%)
Radio 365 (44%)
Other (TV, Radio, Mail)
62 (47%)
Not Sure 6 (7%)
Communication
Regularly 66 (6%)
Occasionally 189 (18%)
Rarely 324 (31%)
Never 463 (45%)
Total 1042

G-9
Table 16. Veterinarians’ Responses to “If “Never,” how interested would you be in participating in a forum (e.g., seminar, Internet chat site) in which you could exchange such information with your medical colleagues?”
Interest Level
Very Interested 58 (12%)
Somewhat Interested
241 (53%)
No Opinion 67 (15%)
Uninterested 67 (15%)
Very Uninterested 25 (5%)
Total 458


H-1
Appendix H. Attitudes Regarding Public Health Capabilities Table 1. Local Health Agencies’ Responses to “How capable do you believe your local agency/ state agency would be if you/they had to handle a severe infectious disease outbreak (such as pandemic influenza or SARS) in the near future?”
Table 2. Physicians’ Responses to “How capable do you believe your local/state public health personnel would be if they had to handle a severe infectious disease outbreak in the near future?”
Capability New Hampshire
New Jersey
New York Pennsylvania Total
State Local State Local State Local State Local State Local
Very Capable 1 1 18 7 16 12 2 3 37 (25%)
23 (16%)
Somewhat Capable 1 1 41 51 31 36 8 8 81
(55%) 96
(67%)
Not Sure 0 0 15 10 5 3 1 0 21 (14%)
13 (9%)
Incapable 0 0 7 10 0 1 0 0 7 (5%)
11 (8%)
Very Incapable NA 0 NA 2 NA 0 NA 0 NA 2 (1%)
Total 2 2 81 80 52 52 11 11 146 144
Capability New Hampshire
New Jersey
New York Pennsylvania Total
State Local State Local State Local State Local State Local
Very Capable 27 16 18 11 24 28 19 13 88 (15%)
68 (12%)
Somewhat Capable 83 57 60 42 68 58 74 65 285
(48%) 222
(38%)
Not Sure 40 50 57 62 3 16 61 57 171 (29%)
185 (32%)
Incapable 4 13 21 29 7 7 15 22 47 (8%)
71 (12%)
Very Incapable 1 12 4 14 1 4 3 10 9 (2%)
40 (7%)
Total 155 148 160 158 113 113 162 167 600 586

H-2
Table 3. Physicians’ Responses to “How important do you believe an education is in public health (e.g., an MPH) for someone working in public health?” Table 4. Physicians’ Responses to “How important do you believe a medical degree (MD/DO) is for someone working in public health?”
Importance
Very Important 278 (46%)
Somewhat Important
226 (38%)
No Opinion 61 (10%)
Unimportant 30 (5%)
Very Unimportant 5 (1%)
Total 600
Importance
Very Important 289 (48%)
Somewhat Important
252 (42%)
No Opinion 25 (4%)
Unimportant 34 (6%)
Very Unimportant 1 (0%)
Total 601

H-3
Table 5. Physicians’ Responses to “How involved are you in local and/or state public health emergency preparedness efforts?”
Table 6. Physicians’ Responses to “If “Not Involved,” how interested would you be in getting involved?”
Involvement New Hampshire New Jersey New York Pennsylvania Total
Very Involved 5 2 13 7 27
(5%) Somewhat Involved 20 11 26 18 75
(13%) Rarely Involved 35 37 35 33 140
(24%) Not Involved 93 110 38 110 351
(59%) Total 153 160 112 168 593
Interest
Very Interested 26 (7%)
Somewhat Interested
96 (28%)
No Opinion 99 (29%)
Uninterested 81 (23%)
Very Uninterested 45 (13%)
Total 347

H-4
Table 7. Veterinarians’ Responses to “How capable do you believe your local/state public health personnel or state agriculture personnel would be if they had to handle a severe animal infectious disease outbreak in the near future?”
New Hampshire New Jersey New York Pennsylvania
Local Health Agency
State Health Agency
State Agr
Agency
Local Health Agency
State Health Agency
State Agr
Agency
Local Health Agency
State Health Agency
State Agr
Agency
Local Health Agency
State Health Agency
State Agr
Agency Very Capable 2 19 25 11 54 72 12 51 68 27 144 241 Somewhat Capable 16 29 20 51 80 74 52 87 70 160 273 244
Not Sure 21 10 14 60 41 37 72 45 48 218 145 96 Somewhat Incapable 12 3 1 39 10 4 47 12 6 123 31 18
Very Incapable 8 1 1 22 3 2 11 2 2 56 10 4
Total 59 62 61 183 188 189 194 197 194 584 603 603
Total
Local Health Agency
State Health Agency
State Agr Agency
Very Capable 52 (5%)
268 (26%)
406 (39%)
Somewhat Capable
279 (27%)
469 (45%)
408 (39%)
Not Sure 371 (36%)
241 (23%)
195 (19%)
Somewhat Incapable
221 (22%)
56 (5%)
29 (3%)
Very Incapable
97 (10%)
16 (2%)
9 (1%)
Total 1020 1050 1047

H-5
Table 8. Veterinarians’ Responses to “How important do you believe a master’s degree in public health (MPH) is for someone working in animal public health?” Table 9. Veterinarians’ Responses to “How important do you believe a veterinary degree is for someone working in animal public health?”
Importance
Very Important 405 (38%)
Somewhat Important
407 (39%)
No Opinion 190 (18%)
Unimportant 46 (4%)
Very Unimportant 5 (1%)
Total 1053
Importance
Very Important 778 (74%)
Somewhat Important
248 (24%)
No Opinion 23 (2%)
Unimportant 4 (0%)
Very Unimportant 2 (0%)
Total 1055

H-6
Table 10. Veterinarians’ Responses to “How involved are you in local and/or state public health emergency preparedness efforts?”
Involvement New Hampshire New Jersey New York Pennsylvania Total
Very Involved 2 11 12 22 47
(4%) Somewhat Involved 9 20 26 100 155
(15%) Rarely Involved 18 50 59 149 276
(26%) Not Involved 33 108 101 335 577
(55%) Total 62 189 198 606 1055

Appendix I. Local Public Health Funding Table 1. Local Health Agencies Receiving Specified Percentages of Federal, State, and Local Funding New Hampshire New Jersey New York Pennsylvania
Federal Funds
State Funds
Local Funds
Federal Funds
State Funds
Local Funds
Federal Funds
State Funds
Local Funds
Federal Funds
State Funds
Local Funds
0<20% 0 1 0 34 53 5 30 6 14 3 0 1 20<50% 1 1 1 7 11 5 10 29 24 5 3 6 50<80% 0 0 1 2 2 14 3 12 7 0 7 0 80≤100% 0 0 0 0 1 55 0 0 1 0 1 0 Total 1 2 2 43 67 79 43 47 46 8 11 7
Total
Federal Funds
State Funds
Local Funds
0<20% 67 (71%)
60 (47%)
20 (15%)
20<50% 23
(24%) 44
(35%) 36
(27%)
50<80%
5
(5%) 21
(17%) 22
(16%)
80≤100% 0 2 (1%)
56 (42%)
Total 95 127 134
Table 2. LHA Responses to “Have you received any federal funding specifically targeted for biodefense?”
Involvement New Hampshire New Jersey New York Pennsylvania Total
Yes 1 29 45 11 86 (59%)
No 1 49 6 0 56 (38%)
Not Sure 0 3 1 0 4 (3%)
Total 2 81 52 11 146
I-1

Table 3. LHA Responses to “Have your surveillance or laboratory/diagnostic capabilities expanded as a result of receiving federal biodefense funding?”
New Hampshire
New Jersey
New York Pennsylvania Total
Surveillance
Lab/ Diag
Surveillance
Lab/ Diag
Surveillance
Lab/ Diag
Surveillance
Lab/ Diag
Surveillance
Lab/ Diag
Yes 1 0 28 2 40 5 11 5 80 (92%)
12 (14%)
No 0 1 2 25 5 37 0 5 7 (8%)
68 (81%)
Not Sure 0 0 0 2 0 1 0 1 0 4
(5%) Total 1 1 30 29 45 43 11 11 87
84
I-2
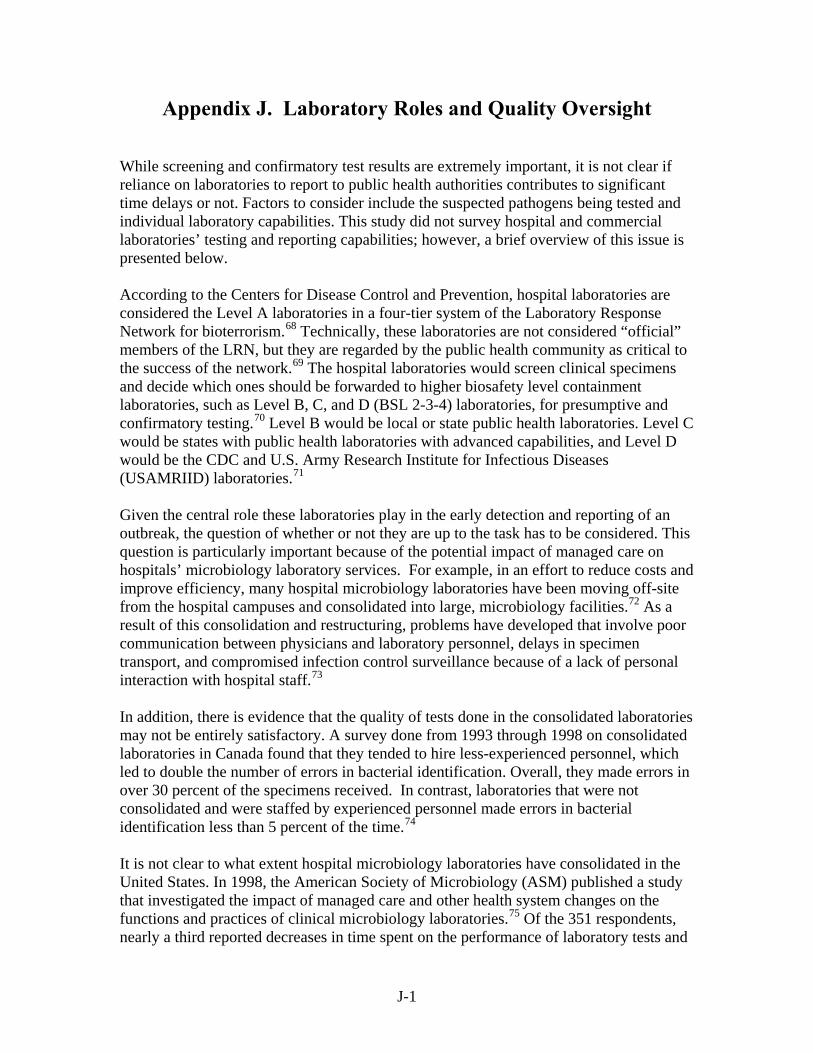
J-1
Appendix J. Laboratory Roles and Quality Oversight
While screening and confirmatory test results are extremely important, it is not clear if reliance on laboratories to report to public health authorities contributes to significant time delays or not. Factors to consider include the suspected pathogens being tested and individual laboratory capabilities. This study did not survey hospital and commercial laboratories’ testing and reporting capabilities; however, a brief overview of this issue is presented below. According to the Centers for Disease Control and Prevention, hospital laboratories are considered the Level A laboratories in a four-tier system of the Laboratory Response Network for bioterrorism.68 Technically, these laboratories are not considered “official” members of the LRN, but they are regarded by the public health community as critical to the success of the network.69 The hospital laboratories would screen clinical specimens and decide which ones should be forwarded to higher biosafety level containment laboratories, such as Level B, C, and D (BSL 2-3-4) laboratories, for presumptive and confirmatory testing.70 Level B would be local or state public health laboratories. Level C would be states with public health laboratories with advanced capabilities, and Level D would be the CDC and U.S. Army Research Institute for Infectious Diseases (USAMRIID) laboratories.71 Given the central role these laboratories play in the early detection and reporting of an outbreak, the question of whether or not they are up to the task has to be considered. This question is particularly important because of the potential impact of managed care on hospitals’ microbiology laboratory services. For example, in an effort to reduce costs and improve efficiency, many hospital microbiology laboratories have been moving off-site from the hospital campuses and consolidated into large, microbiology facilities.72 As a result of this consolidation and restructuring, problems have developed that involve poor communication between physicians and laboratory personnel, delays in specimen transport, and compromised infection control surveillance because of a lack of personal interaction with hospital staff.73
In addition, there is evidence that the quality of tests done in the consolidated laboratories may not be entirely satisfactory. A survey done from 1993 through 1998 on consolidated laboratories in Canada found that they tended to hire less-experienced personnel, which led to double the number of errors in bacterial identification. Overall, they made errors in over 30 percent of the specimens received. In contrast, laboratories that were not consolidated and were staffed by experienced personnel made errors in bacterial identification less than 5 percent of the time.74
It is not clear to what extent hospital microbiology laboratories have consolidated in the United States. In 1998, the American Society of Microbiology (ASM) published a study that investigated the impact of managed care and other health system changes on the functions and practices of clinical microbiology laboratories.75 Of the 351 respondents, nearly a third reported decreases in time spent on the performance of laboratory tests and

J-2
basic research. Sixty-four percent reported a decrease in overall staffing, and approximately a tenth reported decreases in the performance of certain laboratory tests such as bacteriology, mycobacteriology, and antimicrobial susceptibility evaluation. Almost three-fourths of the microbiologists believed that their authority for purchase-making decisions had declined because decision-making had become more centralized. On the positive side, between 60 percent and-80 percent of the respondents reported increases in the use of quality assurance mechanisms such as competency of laboratory personnel and validation and verification of all test results.76
A 2003 study published by ASM addressed clinical laboratories’ workloads and workforce. Six hundred and twelve laboratories were surveyed, representing a variety of settings including community for-profit and not-for-profit hospitals, university teaching hospitals, and Veterans Administration hospitals. Median productivity was found to be over 7,000 total tests per full-time employee per year. However, finding laboratory personnel had become a challenge since half the vacancies for positions required more than three months to fill. Indeed, the study found that the microbiology workforce is aging and that a crisis in microbiology laboratory personnel is looming ahead.77
Finally, the impact of the Clinical Laboratory Improvement Amendments (CLIA) of 1988 (PL 100-578) on medical practice and education is still unfolding. CLIA established standards to improve the quality of laboratory testing in all laboratories nationwide, including physicians’ office laboratories (POL), that conduct testing on human specimens for the diagnosis, prevention, or treatment of disease.78 Tests are categorized as either waived, moderate complexity, or high complexity. Waived tests would be considered so simple that they would be cleared by the Food and Drug Administration for home use. Moderate- and high-complexity tests would require training and experience as well as skill in interpretation and judgment to conduct. For example, tests of moderate complexity include microscopic evaluation of direct wet-mount preparations and Gram stains. One of the consequences of the CLIA regulations is that physicians are now forbidden to conduct their own examinations of patients’ specimens, such as examining sputum specimens by Gram stains.79 There is evidence to suggest that the CLIA regulations have caused many physician practices to eliminate many, if not all, of their in-office testing of patients’ specimens, leading to potential delays in screening, diagnosis, and treatment.80 Medical students, interns, and residents are no longer allowed to do these tests during their training on the wards. While the value of Gram stains is controversial, the end result is that the next generation of physicians will only be able to make therapeutic decisions empirically.81 In an era of antimicrobial resistance, specific selection of antimicrobial agents as initial therapy will become impossible, and patient care could be compromised. If physicians must depend on off-site microbiology laboratory results for all test results, then potential delays or lost specimens could jeopardize patients’ outcomes.
In summary, the combination of consolidation of hospital and commercial laboratories off-site and prohibition of physicians’ timely examination of patient specimens could seriously hinder the

J-3
nation’s ability to identify and control infectious disease outbreaks. It is a problem that needs to be examined in depth.


K-1
Appendix K. Local Public Health Agency, Physician, and Veterinarian Comments
The last page of each survey asked the respondents, “Is there anything about this topic that is not covered that you think is relevant for our project?” Many comments were quite telling, and are included here, with names of cities and counties replaced with “[XXX].”
Local Public Health Agency Comments New Hampshire No comments. New Jersey “We have insufficient staffing, funding, and planning time to give this issue more focus. Because it is very critical that we prepare for such incidents, we are trying to squeeze in the necessary staff training and program planning as much as possible. However, it is not as quick as I would like. It’s a slow process, unfortunately.” “The physicians call us in the event of certain reportable diseases; otherwise the labs send us the reports.” “I just wanted to bring to your attention that in [XXX] County, we have a Health Services partnership agreement between the County Health Department and all municipal health agencies. This agreement covers ‘Public Health Preparedness and Response to Bioterrorism, Outbreaks of Infectious Diseases, and other Public Health Threats and Emergencies.’ The County Department of Health is the ‘Lead Agency’ and must provide equipment, safety gear, and expertise.” “Local health agencies in New Jersey are currently networking through their Regional LINCS Agency (Local Information & Network Communication System) to enhance local public health capabilities by sharing resources and responding to major public health incidents collectively.” “[XXX] Regional Health Commission is not the County Health Department. However, the LINCS agency has hired a few staff members under a BT preparedness and response grant provided through CDC to the state to LINCS agencies. Our LINCS agency is responsible for the management of any type of communicable disease outbreak investigation with the support of the local health department and the county health department. As a LINCS agency epidemiologist, I am responsible 24/7 to respond to
K-2
reportable communicable disease surveillance and investigation. I work as a liaison for the state health department to reinforce the communicable diseases policies and procedures changes to our county health care professionals. For any type of public health emergency, the local health department health officer is in charge and he/she may call upon 24/7 LINCS staff from the LINCS agency.” “In New Jersey, response to incidents of the type inquired about is regionalized. Local health agencies act as support units, allowing for maximization of effort with a minimum of cost to any given agency.” “This city health department participates through our county health department in many of the aspects discussed within your survey. Our county health department is receiving direct funding and is leading efforts in organizing and reacting to various episodes. So they have a Web site, volunteers, MDs, etc. Though I may have answered in the negative to some of your questions we do have other support systems we have involved with. But to the question “Are we satisfactorily prepared for ‘outbreaks and attacks’ at the local level–No! We have no funding and very little seems to be planned for local health departments.” “Locally, we are not prepared to respond to an outbreak of anthrax, smallpox, etc. Our mayor believes this is a state function. He feels the further we get away from 9/11 the less likely there would be another attack. We are not prepared (statewide) to respond to or vaccinate the residents of our state in the event of a bio attack.” “In case of an infectious epidemic, a chain of command needs to be clearly defined. Resources such as provision of chemoprophylaxis need to be addressed both at local and state levels. The small-scale example of an infectious outbreak is meningitis cases, when most of the public health officials have no clue where to get chemoprophylaxis for those who are without any type of medical coverage.” “Responding to a public health emergency can only be successful if full lines of communication have been clearly defined with local police and those players that will assist in responding to the emergency. Therefore, it is vital to meet often, conduct tabletop exercises, and attend CEU cases to make you a well-educated player if a crisis was to occur.” “The federal/state/local governments do not adequately fund public health preparedness. We are expected to respond to public health emergencies with little or no funding or personnel. If this country is serious about protecting the country, they would spend real money on local public health preparedness, equipment, and people. We have spent money on smallpox training and educational programs about incidence command and public health preparedness, but I feel that this is not enough. The country is not doing enough to protect local citizens. We are being exposed to extreme danger so we can fight a useless war in Iraq. Public health will never be ready for bioterrorism until the leaders of this country remove their heads from the Iraq sand and spend real money on public health infrastructure, people, and equipment.”
K-3
“Most of the $ coming from the feds goes to the state (who take a percentage for administration) and to the counties. Very little $ makes it to the local municipal level in New Jersey. Local health, police, rescue squads, fire, emergency management all have needs that can be met if $ made it to the local municipal level.” New York “As a result of 9/11, public health has become much more knowledgeable about emergency operations, including police and fire, in our community. Also the reverse is true. We are much more prepared to respond to a disaster situation involving biological agents especially and we know who to contact and how. We have basic training in ICS (100 & 200 levels) but hope to have more in this calendar year.” “Federal funding for BT activities goes directly to the state and then is distributed to local health departments according to the state’s formula. Every LHD regardless of risk, location, population must mount the same level of preparedness. Local politicians don’t see the need and small health departments like mine are severely handicapped by very limited staff. I have 5 FT nurses assigned to public health including the BT coordinator and supervising nurse and 2 PT infection-control nurses. We are assigned multiple roles in BT response, plus we have to continue doing our everyday jobs.” “We are a very small, rural public health agency. We don’t have environmental services, state DOH provides that. Every staff member wears many hats and has diverse job duties. We would be overwhelmed quickly in a large-scale incident. We work very well with our community partners but all of our resources are stretched to the max. All staff and volunteers would devote their utmost to achieve an optimum outcome but we can’t say we are completely prepared for every contingency.” “Regarding laboratory reporting of reportable infectious diseases–they provide, under state law, the results of laboratory tests that are positive and reportable. They don’t diagnose–our department works with the ECNs and MDs to secure a case report.” “Continual reductions in our base funding would severely limit our response to an event of bioterrorism. Our staffing levels have been eroded over the past 5 years.” Pennsylvania “We have lots of planning preparedness groups and meetings–almost too many (local, regional, statewide). The federal and state approach to providing funding, leadership, and mandates is still too balkanized. Everybody (health, environment, emergency management, law enforcement, fire officials, agriculture, transportation, etc.) has their own funding streams, mandates, and chain of command. Little of the funds or equipment trickles down to local agencies and responders and then only after some percentage has been filtered off the top by higher levels of government. Also there is too much

K-4
information overload. We get volumes of material on any given topic and from numerous sources (100-page documents on smallpox or anthrax, emergency planning, threat levels, levels of preparedness, etc.). Enough already! If/when ‘it hits the fan,’ the real-world reality is that lots of people won’t show up for work; the rest will all have to pull together to work with the people we know and trust. No one will be able to find and read 100-page manuals for operations. Even if we all had them ready now no one has mandated that they be funded, coordinated, practiced and reviewed. And again, if they did require all that, there would be no time or resources to operate our daily PH programs and activities without significant increases in funds and staff.” “The state of Pennsylvania, of which we are a part, has an electronic disease reporting/surveillance system (with the acronym PA-NEDSS for Pennsylvania National Electronic Disease Surveillance System) for real-time reporting. We view all our county infectious disease reports through the system, because the referenced health care personnel most often report directly into it, even though by law, they are also required to report to the local health department, especially the ‘reportable diseases.’ Our analysis of the sources of reports yielded the approximate percentages you find on your question of where our infectious disease reports come from.” “The SouthCentral District is part of the PA Dept. of Health–responsible for public health activities in 13 counties. We are not independent from the state DOH. We are actually a ‘field office’ with an office, as well, in each of our 13 counties.”
Physician Comments New Hampshire “Is there any evidence that expensive preparations for low-likelihood events, such as terrorist attacks, are cost-effective?” “New Hampshire is a small state with a well-organized state health department that would take over in any local public health emergency. New Hampshire’s local PH. infrastructure is sadly lacking.” “Interest in this topic will be dependent upon the specialty of the physician. A FP or internist will be far more likely to see a presentation of the above diseases. If I did see such a case, or were at all concerned about the diagnosis, I would consult our local infectious disease specialist, who is well versed in the reporting requirements, as well as treatment.” “State is getting more practice with each meningitis and hepatitis A mass evaluation and medication/immunization outbreak. Practice makes perfect!”

K-5
“Because of my practice leadership role, I was involved in coordinating local response to a possible smallpox/anthrax outbreak, with local hospital leadership and state agencies. We implemented first-responder smallpox vaccination clinics.” “I work at a large medical center. For any public health emergency, there are many here who are involved in planning. I do not happen to know the details, but can easily access those who do. We communicate by e-mail, phone, and group meeting.” “This is an important subject. Do not become hidebound on the subject of degrees in public health or anything else. There will become a war over who is in charge of terrorism medicine. Everyone should be involved. Programs for initial treatment and follow-up need to be developed. It is not just surgery and trauma care. We in Massachusetts were prepared to help on 9/11, but sadly there were few survivors. The psychological toll, however, was huge. Doctors need to know their communities–the communities need to know them–All of them.” “Maybe you should be asking what emergency preparedness measures the practitioner’s hospital has engaged in.” New Jersey “Most of my preparedness training was done by the hospital that I work at, not the local/state agency.” “Too many nonmedical personnel in our state are making medical decisions with no input from physicians.” “I would report to public health if they would make it easy to report, such as on the Internet. The fact is, the system is just too cumbersome and time-consuming.” “I read the notices that are sent in the mail by state public health. In this age of computers, notification by e-mail is very important and a Web site for info and CME makes sense.” “I am in the pharma industry doing research (not ID at the moment). I don’t see too much mobilization of the industry in this effort. An area to think of starting is the industry organization PhRMA.” “I have found that the Board of Health in my community is resistant to updating their regulations.” “Ask the question: What do physicians do with written mailed material placed in hospital mail? Read? Throw away? Ignore?”

K-6
“I believe there should be a strategic plan both at a local level and a state level. In the event there is a disaster, I am not sure that we are prepared, especially given the events on 9/11.” “A centralized state Web site that gives updated information regarding number of cases of types of disease would be good. A simple reporting mechanism online would help with compliance for reporting conditions.” “It is most important for doctors to be able to recognize a suspicious disease. They can find the correct response once the condition is identified. A mandatory ‘Grand Rounds’ for identifying suspicious conditions would be most useful.” New York “Clarify local/state. I think if I send to county it gets to state. Feedback is lacking when we report.” “The ‘public health’ dept. as you call it is a contradiction in terms–an oxymoron–a waste of money–worse than useless–We are totally unprepared in this country for ‘public health’ crises!! “CDC has excellent info on the Web. Physicians are interested in the topic and preparing for biological events.” “In this county, hospitals report daily ‘types of cases’ presenting to our ED. The local health department looks for trends, calls with questions on specific patients. This is voluntary by any specific hospital; it is done in our hospital by nurse epidemiologist. Feedback from Department of Health is expected when appropriate (a trend is seen). DOH also interacts with zoo and vets since 2001 West Nile. Mandated SARS and smallpox plans for hospitals are prototypes for bioevents in NYS.” “I have a bioterrorism rapid response card which is very helpful and useful.” “State should make mandatory education for this emergency situation of these diseases. State may distribute the CD or video for education purposes to allied health professionals.” “The questions concerning public health and the importance of particular degrees should be expanded! MD, MPH are both important but other degrees could be equally useful especially degrees in nursing. In addition, epidemiology independently using only MPH & MD/DO would limit the field unduly, I think.” “Ask: What education have you had on bioterrorism/disaster training? My answer: Emergency Medicine residency includes some large-scale emergency training, but these potential future leaders are not practiced or up to standards for emerging threats. The

K-7
MD training would not help as much as my more recent smallpox and bioterrorism public health seminars.” “We need continuing education on a broad range of public health issues: bacterial resistance, zoonotic infections, botanical vectors, viral diagnosis, education of NYS police, EMS, fire, and county leadership on public health ranging from water (well, spring, storage and wastewater, monitoring public and septic treatment), soils (normal organic, chemistry, solid waste, historic & current toxic spills, hazardous waste sites, monitoring health), air (historic and contemporary air quality, indoor vs outdoor monitoring, air pollutants and pollution), plants, animals and people as vectors of disease.” “We act as an emergency responder to an outbreak of an unusual type in an area of infectious diseases and agents of bioterrorism but I think there is a lack of public awareness regarding above. So there is a great need of public education if we want our efforts to be effective in case of an emergency.” “CDC or other DOH needs to provide a better (easier to use) Web site on education of physicians to specifics of ID & bioterrorism.” Pennsylvania “The lack of interest I have in this is due to the massive time constraints I have in trying to keep up with diseases/illnesses as well as medical /legal with coding issues. These are things I deal with on a routine basis. Devoting time to study and learn obscure illnesses I have a near-zero statistical risk of seeing is just not worth it. On top of that, dealing with government bodies is frustrating beyond measure.” “There is increased cooperation and preparedness with local, county and regional cooperation through emergency services since 9/11. We have had drills with hospital; EMT; MD; Fire/Police for central PA.” “I am a forensic pathologist and the elected coroner in XXX County. It is an area of approximately 700,000 people with approximately 6 general hospitals and other scattered medical institutions. The role of the coroner in this county is to determine the cause and manner of death of the deceased, who may have died of non-natural causes. In addition to that, and in times of a catastrophe, the role shifts somewhat to determine identification of the deceased with a de-emphasis on the cause and manner since in most instances it is quite obvious. In identifying the deceased a number of techniques are used depending on the condition of the material one works with. Both the scene, the presence or absence of personal effects, background investigation as to likely indestructible material the patient may have on or in him, and a number of factors go into resolving this particular problem. Which brings us down to the next step; if the cause of death is obvious, say a plane crash or a surface catastrophe, again we are primarily concerned with identification. However,
K-8
if the problem is a biological or chemical situation, that poses a major problem since we would be examining fragments and bits of material exposed to whatever toxic or infectious material was used in the terrorist attacks. Appropriate gowning and equipment to handle such contagious or toxic materials is available only in a small quantity in our emergency preparedness trailer. In addition to handling the material and identifying the cause of death, there is the question of what to do with the material that has been examined. Does it pose a threat to the community; can it be cremated, buried, or chemically treated to neutralize any adverse effects that might develop? All these are questions that come to me as a forensic pathologist concerned with a possibility of some type of biohazard or chemical hazard that may involve the population of my county.” “Be aware of the fact that there is a large range of differences in medical practice. As an opthalmologist, I would be very unlikely to see an infectious disease outbreak or other public health calamity.” “This survey is probably not appropriate for me to be participating in. I am in a private outpatient MRI facility and would rarely be the primary physician to be involved in the Dx/Rx of patients of this nature.” “Level of local preparedness–woefully inadequate. At one time every physician knew where to go and what to do. At present only the ambulance drivers seem to know what is going on. We have many competing hospitals and cooperation continues to decline. Physicians at the grassroots level should know what to do, where to go–before a disaster. Phone lines, e-mails, etc. would be absolutely overtaxed after a disaster. We have many department committees, but lack of practical application and common sense.” “Once again doctors are considered to be one class of individuals. This is a false assumption. Radiologists do not (usually) contact public health officials.” “[How about} a comprehensive manual with quick, easy-to-use clinical maps, guidelines or decision flow charts from local/state government to keep on hand in the event of various bioterror attacks. A list of contacts, hierarchy of contacts. List of important phone numbers would also help. The above converted to software that can download to palm or any computer that can be referenced quickly would also be helpful.” “The issue of confusion as to who is directing the response is the central question, I believe, and needs to be fully worked out before the event!” “As a psychiatrist I rarely or never deal with infectious diseases, especially rare ones.” “Unfortunately, the topic of public health awareness suffers under the beleaguered climate (financial, political, and legal) that doctors (especially primary care) find themselves in, and is overshadowed by the haphazard information (or misinformation) sold by the media. Probably, doctors would benefit by a voluntary alignment with public

K-9
health officials (and vice-versa) and the public would value/trust physicians more in such a circumstance. Of course, it goes without saying that no doctor in his/her right mind would participate voluntarily without broad immunity from civil-suit liability.” “It seems to me that primary care physicians want support and education in a crisis, but don’t care for advice that is contrary to the most patient-friendly route. For example, when our medical supervisor (not even a public health official; someone with possibly more validity in our eyes) told us not to give everyone rifampin after a meningitis death, my colleagues said that the supervisor ‘just didn’t understand the community.’ My colleagues felt that on compassionate grounds anyone who wanted rifampin should get it. I disagreed with her on academic grounds, but then again, I am constantly criticized for being too rigid. Am I unsympathetic? Am I wrong? Are supervisors really out of the loop as far as community management goes? None of us really respects the others.” “For medical preparedness, a clear hierarchy will be key; i.e., establishing how infection control/public health authorities at hospital, city/county, state, federal levels will work together.” “There is a tremendous amount of energy, time, and resources put into WMD/terrorism but no one is focusing on the day-by-day deterioration of the American health care system. We cannot handle the patients that we must treat now.… How will we do it if there is a crisis?” “The current system in XXX is that when certain infectious agents are found through the lab system it is reported to the Public Health Department. The health department then contacts the physician’s office or hospital regarding further information and follow-up procedures. This seems to work pretty well.” “State public health officials have not taken a leadership role in developing a response to a WMD event or severe infectious disease outbreak. In western PA, local hospitals and medical personnel have been working in coordination with county and regional EMA officials. If the state has plans regarding such an event, they have not been shared with the local medical community. Individuals (physicians and others working in the health care community) have taken the leadership roles in developing local and regional plans. I have concerns that in the event of a catastrophic occurrence, state officials, without knowledge of the regional plans or any previous interaction with our local community, will respond and cause chaos.” “There are virtually no hospital beds in XXX to treat patients in a full-blown medical emergency situation, e.g., anthrax. I believe we need to at least ‘mothball’ beds to be prepared for such an emergency.”
K-10
Veterinarian Comments New Hampshire “[How about] forming a forum or network of rules where the veterinarians and the medical doctors can work together.” New Jersey “With the ever-present potential for a terrorist attack with infectious agents such as anthrax or toxic gases, it is imperative that public health personnel, physicians, veterinarians and the general public be educated and prepared to respond to any such emergency. A good example is the awareness and conditioning that the civilians have in Israel.” “Animal production veterinarians and ambulatory equine veterinarians have been on alert since the foot-and-mouth outbreak in England. They have not had coursework on bioterrorism facts, recognition of potential epizootic diseases. Who to inform when you suspect a bioterrorism incident is occurring? How quick to react? Should an incident be toned down or immediately reported? It appears that the health department of New Jersey is trying to become the lead agency for emergency and bioterrorism involving pet animals and possibly livestock. This would be a disaster as they have no expertise in this field. A two-agency system, with Agriculture handling pets and livestock and Health handling humans would be faster and more efficient.” “Local or state-run refresher courses on exotic disease for small-animal vet and/or large-animal vet offered to practitioners, including procedures to follow in NJ, would be extremely valuable and welcomed by most private practitioners.” “[How about] public awareness meetings at municipal level/public health emergencies in bioterrorism incidents. State Agriculture and Public Health departments should be more involved and local livestock industries should be alerted about bioterrorism and preventive measures.” “From a small-animal vet point of view you might look toward existing emergency management plans present for natural disasters. In XXX County, vets are involved in the emergency management scheme. From an emergency medical point of view some of the same mechanisms could be employed.” “I feel that local community health departments should have a better relationship with a qualified and interested local veterinarian to assist and educate the health department on zoonosis.”

K-11
“The most recent outbreak of an infectious disease of public health significance in NJ and elsewhere in the US was that of Monkeypox. The USDA took charge of the control and elimination of pet shop prairie dogs, etc. There were no relevant questions that could have been directed toward USDA’s role in public health. I have had no contact with local or state public health departments within the last 5 years but have had contact with the State Veterinarian’s office including communications from the office, the USDA, and would have no hesitation working with the CDC. I am aware that there is a plan to have the State Public Health Department participate in a state bioterrorism program but I have not had any direct communications thus far. Also, a chat line to discuss bioterrorist occurrences would not be useful if there were no events to sustain interest.” “More interaction between veterinary and human medical doctors concerning recognition and treatment of zoonotic diseases would be helpful.” “Most small-animal practitioners see only very occasionally rabies, salmonellosis, and bartonellosis (catscratch disease), none of which spread fast enough to be of bioterrorism significance. Bioterrorism training and preparedness has rightly been aimed toward bovine practitioners, avian/poultry practitioners, and mixed practitioners. This is true for CDC, USDA, and State Veterinarians. The threat is to the food supply, not directly to public health/humans. Incidentally, for your statistical analysis, most veterinarians who are not large-animal practitioners and directly involved don’t know the difference between reports from the State Veterinarian and the state or regional office of the USDA. I get fairly good yearly disease incidence reports from one or the other, I’m not sure which. Small-animal practitioners will not be of much help in biosurveillance efforts. If you are out of school for over five years you don’t remember what common bovine and porcine diseases look like, so you certainly wouldn’t recognize foot-and-mouth disease or African swine fever.” “The XXX County Health Dept. is staffed by an exceptionally active and competent staff; we usually turn to them initially and have been very satisfied. We call the State Veterinarian occasionally but have little contact with anyone else. What I realized from your questions is that in an emergency you start with the people you’ve worked with and trust.” “I believe that as veterinarians we are the first line of defense when it comes to zoonotic diseases. However, on a day-t o-day basis it is not something that I, at least, think about. The way the world is changing and the threat from terrorism should make us think about bioterrorism more, but when it is not seen on a regular basis it can easily be forgotten. As vets in the present day we need to be reminded of the signs and presentations of disease that could spell disaster for many people. Further continuing education in this area is a must for all of our safety.” “I have an old Mac [computer] so anything online can be like pulling teeth! I have been very impressed with USDA/NJ State labs when I needed them. Local health depts. seem most concerned with harassing people about rabies vaccines. I doubt if they could be very useful in a real emergency.”

K-12
New York “Living in Manhattan during 9/11 there was a critical need to coordinate efforts of local/state/police/fire/EMS/govt. agencies in all emergency or bioterror situations. The state and local veterinary associations would be a very efficient way to disseminate ‘emergency’ information about emergency animal infectious disease outbreaks.” “I think a small handbook that I could carry in the truck for references about bioterrorism and infectious diseases would be very useful.” “I am very interested in getting further training in recognition of emerging infectious diseases. I attended the International Conference on Emerging Infectious Diseases in Atlanta and regularly read public health journals. I believe vets should be more involved and integrated in public health, but, unfortunately, I don’t think the public health sector has done a good job of including us.” “In the early 1980s there was a parvo virus outbreak in dogs in Northeast US. It was handled by private practitioners without any communication from local health officials. Information about the outbreak, which started in Southwest US in 1978, was available from the State Veterinary Society, AVMA, State Ag Health Department. Diagnosis and treatment recommendations came mostly from the vet community.” “The extra problem for small-animal veterinarians is the lack of regulation of imported exotic and common pets. The most recent example was a puppy (Bulldog-English type) imported from a Soviet country that had severe vomiting, diarrhea, hemorrhagic illness that it succumbed to before virus isolation could be performed. Was this new or a form of imported illness?” “How do I think we can raise the awareness of preparedness? Have mandatory or paid seminars. Reading materials are not interesting enough for a lot of people, especially with the busy schedules most of us have.” “I think these are extremely important questions. I hope you share the pertinent correct answers with us about a chain of command, who to contact, who will contact us. I have dealt with CDC and local and state public health authorities on a leptospirosis outbreak in 1996. I did get help, but only from the CDC in Georgia and interested clinicians at Cornell’s laboratory. No state cooperation at all. Perhaps (hopefully) in light of terrorism, they’ll be taking things more seriously. I would be happy to be involved and help spread the good word.” “I have rarely seen anything, save rabies, which has risen to the level of needing reporting to any public health agency. Further, the available continuing education in regard to this issue has been directed toward livestock diseases or general medical issues. Little education has been available regarding diseases of companion animals such as plague or brucellosis. Rabies is endemic and we are aware of its diagnosis and reporting requirements. While I feel a coordinated response would be valuable in case of a
K-13
bioterrorist attack, I think such an attack on companion animals is unlikely. It would be far too easy to cause unwarranted panic: proper diagnostics and veterinary input should be part of any response effort.” “Bureaucracy is the major stumbling block to any government reporting program, and the inability to reach someone in authority and get a decision that is pertinent.” “I believe that most of the information I have received on bioterrorism is through the AVMA and their publications, most commonly JAVMA. Locally, we have an Internet chat site to which practitioners will post if they are seeing either an unusual case, or a spate of one type of illness–for example, ringworm or kennel cough. It helps keep us aware of what others in our area are diagnosing.” “As a practitioner, I feel I have an obligation to be constantly aware of emerging infectious diseases and their symptoms, clinical signs, species affected, etc. It would be so helpful to me to receive updates (e-mails?) on various diseases and how they affect companion animals. I am an accredited veterinarian and I try to read all the mailings from the NYS Dept. of Ag and Markets; I must confess, though, that I am unsure how I would proceed if I had a suspected case, and I feel unprepared for that possibility. I think that a review of Exotic Diseases/Companion Animal Foreign Diseases would be most helpful.” “Veterinarians are a very important aspect of a solid biosecurity program. However, I believe a multidisciplinary approach with experts from many fields (veterinary medicine, human medicine, public health, local, state, and federal governments, etc.) trained and prepared for bioterrorism is necessary for such a program.” “Local public health agencies are of no help. State veterinary, Ag Departments, USDA, etc. are very helpful. Need courses which pertain to impact of bioterrorism on small animals. Most small-animal veterinarians would be helpful in livestock outbreaks of disease. A quick review of past outbreaks would be helpful. As veterinarians, our role in time of crisis is somewhat questionable. Where do we fit in?” “Lack of zoonosis information/training for local medical personnel (doctor/nurse) when dealing with people and animals. Locally, need protocols for doctors to use when dealing with people and diseases that are transmitted from animals (e.g., parasites and others).” “Some veterinarians are licensed in several states. I am also licensed in Pennsylvania and would have answered the questions differently. The state of PA has a very organized system of emergency preparedness and I get very good updates in a monthly newsletter. The questions seem to be directed at small/large animal practitioners. As a poultry practitioner, I work a lot more closely with the State Dept. of Ag, which runs a USDA program called the National Poultry Improvement Plan. Specialties such as poultry, swine, and avian medicine are important in infectious disease transmission (influenza!) and should also be used as examples.”

K-14
“I think of public health as human health, so I would only involve public health officials, local or state, in animal disease issues with zoonotic potential. For unusual diseases, emerging diseases, or possible bioterrorist-related outbreaks involving only animal health, I would never call public health agencies. Also, many of us deal with multiple local agencies because our practice areas cover multiple counties or states. So we can be completely satisfied with the work of one agency and completely unsatisfied with another. And the work of one agency can have an impact on animal or human health in contiguous areas.” Pennsylvania “I attended a seminar sponsored by the PA Dept. of Ag on potential bioterrorist activity and resulting disease management. Only the game commission had a viable plan for handling such an emergency, utilizing pickup trucks, mounted aerial platforms, and night vision-outfitted sharpshooters to eliminate foot-and-mouth-infected deer. The Dept. of Ag and USDA were well-meaning but hopeless!” “Recently, I received in the mail some info regarding knowing the signs of Newcastle disease in poultry. I was happy to see specific info like this being sent out to veterinarians. It would be nice to receive periodic pamphlets like this to refresh our knowledge on specific infectious diseases. Even having info available to check periodically online (may help lower costs) would be useful.” “In the event of any type of crisis involving animal health, I am willing to do all I can to assist state and federal personnel. I am very concerned about a problem with our food and water and air. Please let me know if there is anything I can do to help.” “Doing this survey makes me realize I don’t know the pyramid within the state of reporting diseases or emergency help. In other words, who do you call first and when? In today’s busy world with too much information perhaps a concise flow chart would help. Information we don’t use every day or week we tend to forget, so we need something to reach for if we have a question. Also, making phone calls in an emergency can clog lines and be very frustrating.” “Over the years I have made time to participate in outbreak and public service projects sponsored by our county health department. (Rabies vaccination clinics, low-cost spay/neuter clinics, etc.) I think these experiences have been very valuable for me and my fellow veterinarians to have the chance to get to know and work with the Health Dept. staff–these are the people we will have to work with in an emergency situation. It would be great to encourage more contact between the veterinary community and local/state health departments (animal and human) before an emergency strikes.” “The State Dept. of Ag has done the most by far from my perspective. They have 24/7 emergency phone response. Special courier service for samples in place. Quick connections to vet schools, CDC, USDA, and PVMA veterinarians. Regional staffs for
K-15
field work and quarantine. Work groups experienced in depopulation and disposal. In the rabies case that I diagnosed, they transported the sample (cat’s head) by courier to the lab in one day, tested brain in two days, notified PA Dept. of Public Health, and we were vaccinated within the week. FMD (foot-and-mouth disease) suspect in XXX County, August 2003, they had an infectious disease specialist at suspect within 24 hours of being contacted. Answers from Plum Island within 3-4 days. Quarantine lifted in one week. Human hepatitis outbreak XXX County, Nov. 2003, they called CDC and confirmed for me that animals and animal droppings do not propagate human hepatitis virus. I would be lost without them.” “Briefly: Poor communication between MDs and DVMs regarding zoonotic diseases. We have an in-house log of Lyme + dogs in our practice. A vaccine representative has collected this to provide privately a statewide county-by-county number of cases. Our state prepares similar reports for rabies.” “I feel that probably the most difficult aspect of dealing with a bioterrorist attack would be getting the government agencies at night, on weekends or holidays; and then have them actually do something if it doesn’t happen during regular business hours.” “I think we should get serious about these potential threats. It should be mandatory that VMDs DVMs, and MDs attend local seminars given on potential public health diseases and bioterrorism.” “The state has a system of regional veterinarians at the regional Dept. of Agriculture offices. These veterinarians are very cooperative and work closely with the Public Health Dept. and there is coordination between the State Veterinary Lab at Harrisburg, the Penn State Lab and the University of Penn Veterinary Lab.” “In my opinion, local and state preparedness is a question! In 5 years of practice I can count on one hand the number of times I have been contacted by state or local agencies about animal health issues. My only recollection of any contact is the yearly newsletter I receive from the PVMA.” “This was difficult for me to answer as I work part-time as a relief veterinarian. I would very much like to be more informed on this subject–articles in JAVMA or other commonly read veterinary journals/newsletters would be great. In fact, the best for someone like me would be a periodical (every 1 or 3 or 4 months) with good photos and disease descriptions to keep things fresh in mind.” “If you want to mare sure veterinarians are a first-line defense against ‘germ warfare’ supply free seminars that offer CE credits for state license and have APHIS/State Vets visit clinics on a regular basis. I lived in Georgia the last five years and our APHIS rep visited us once a month.” “State Vet is great. My answer to many questions actually, should have been ‘Call XXX and ask what to do next.’ Knowing who should be contacted about what is confusing.”

K-16
“It should be suggested that the State Public Health Agency and the State Department of Agriculture jointly present a one-day or weekend program for both physicians and veterinarians. The program should present each disease in a manner that would foster a little camaraderie between the medical and veterinary communities.” “In our area we have virtually no contact with public health personnel. Rabies and reportable livestock diseases are handled by Dept. of Ag people. If we had an infectious disease outbreak, state Dept. of Ag or USDA personnel would be in charge of dealing with the problem, possibly with the help of local volunteers. I live in a rural area in which there is little if any discussion of ‘terroristic’ or foreign animal diseases related to companion animals. The emphasis is entirely on food animals and equines.” “The sentinel protection provided by animals is more relevant than Homeland Security’s color coding.” “State veterinarians and other officials need to be more aware of the differences in disease susceptibility in nontraditional species. For example, while camelids can contract foot-and-mouth disease in experimental situations, they do not get the typical severe ulcers and they do not give it to other species (i.e., sheep and goats) even when they are commingled in the same housing facility. Many states regulate camelids as they do cervids and other ruminants when in fact they are not true ruminants because they only have a 3-compartment stomach rather than 4 compartments.” “The State Department of Agriculture has been most involved in publishing infectious disease data. Public Health has only really been involved with rabies and sample testing.” “Create a uniform, consistent response to bioterrorism involving Local State Federal: reporting, responding, and communicating to veterinary and human medical practitioners.” “There has been no attempt by local representatives to get veterinarians involved in recognizing possible acts of bioterrorism and utilizing veterinarians to recognize possible outbreaks.” “The agriculture community needs to be involved in any program for control of animal problems. Most farmers are very skeptical of government authorities intruding upon their animals and ground. Proper education at the ground level will be a priority.” “Conflict between state departments–e.g., PA Dept. of Public Health requires reporting of psittacosis, but Dept. of Ag will not accept reports.” “In general, physicians in clinics and practice have little respect for veterinarians and show little interest in potential zoonotic diseases.”
K-17
“Other than JAVMA, it seems that notification of any emergent-type diseases, testing for, and possible treatment, is very minimally covered by any publications. It seems small-animal veterinarians are left ‘out of the loop’ after graduation and more needs to be done to present new disease or renamed (updated) disease info to us, possibly semi-annually in a standardized report.” “I am very willing to help out and am interested in public health/infectious diseases at a local or state level. But I find it difficult to contact the people in my state in order to get involved. If I get an application or offer my services I have been turned down usually because it would be part-time, and they want full-time experience.” “I would very much appreciate more contact with state and local health departments–the current protocol for reporting infectious diseases is confusing and varies from state to state. A comprehensive Web site and/or regular e-mails/letters/newsletters from these agencies, as well as the opportunity for further continuing education, specifically in issues related to public health, would be very useful.” “The veterinary preparedness for future infectious disease outbreaks is very weak. Collectively, the veterinary community does not seem to be working together. This may be due to lack of educational seminars that would organize materials as well as personnel. The flow of information seems to be disjointed and irrelevant, and when you’re trying to become involved, this leads to frustration and eventual lack of participation.” “Last summer our equine-only hospital was presented with a horse exhibiting neurological signs and behavior changes. Rabies was suspected, the horse was euthanized, and rabies was eventually confirmed. The horse had recently been sold and in the weeks preceding diagnosis had been to several horse shows. Obviously, there was potential for exposure to many people and other horses. Our State Health Department seemed incapable of responding to this one animal incident. This scenario made me wonder how they could possibly handle a large-scale outbreak/emergency.” “There appears to be a breakdown of communication in our area about changing regulations in State/USDA operations (e.g., accepting ‘down’ cows to slaughter for BSE testing). I have given my e-mail address and fax number to most everyone from county EMS/Dept. of Ag people on up to State USDA officials, but we seem to be getting our information second- and third-hand. Many times my information arrives to me from lay-people. In this age of electronic communication and instant gratification, why can’t info be disseminated to the professionals first?” “Unfortunately there don’ seem to be many people/agencies which interface human and animal medicine. There is no recognized need for this in either the private or public sector. Veterinarians are probably the most underutilized of the health professionals. Their public health skills are neither recognized nor appreciated as such and when they are asked to become involved it is generally as a volunteer, with complete disregard of the economics of getting a degree, their training, or business (i.e., practice). If there were an infectious zoonotic disease outbreak, the public health response would be inadequate

K-18
because there is no coordinated animal/human effort except at the level of Homeland Security and that is not effective locally.” “I have been contacted in the past about emergency preparedness and whether I would be interested in being involved. I have always responded yes, but never heard from anyone.” “I get most info from the newspaper. Occasionally PA State Dept. of Ag sends a letter about signs of unusual animal disease.” “Every community, whether geographic or professional, needs to be made aware of the chain of events and officers to call when an emergency arises. I feel the agencies in charge need to do a better job of informing the people on the front lines of who to call, especially during “off-hours.” It seems that most questions arise on a holiday, evening, or weekend when state and local offices are closed. Much better communication and basic information needs to be provided. It seems ironic that even after 9/11, many of us in the field are ill-informed and educated as to the appropriate response.” “The Department of Agriculture (state level) knows a lot more about rabies–including human and prevention–than the health department or local regional hospital. The medical profession needs to be educated. If I see a problem, call the State Dept. of Ag. They really know their stuff.” “Our Federal and State Agriculture Associations keep certified large-animal veterinarians well informed as to symptoms and pictures of exotic diseases affecting mostly large animals, especially cattle. Such diseases would be Foot-and-Mouth Disease, Rinderpest, Spongiform Encephalopathies, Transmissable Chronic Wasting Disease of Deer and Elk, etc. To get such information you must be a certified veterinarian, meaning you have received training and CE programs on large-animal diseases. We get information literature on West Nile virus because horses are so susceptible. Our county last summer had 100 cases of horses with West Nile virus with over 50 percent mortality. Who diagnoses these? A veterinarian. If you want accurate info on animal problems, you’d better have a veterinarian involved and forget laymen.” “With the decreased use of vets to see farm animals because of corporate production any FAD or bioterrorism event will be missed, with danger of resulting in a massive outbreak. Currently, before a vet is called, 3 Corp. Prod. people must approve, which usually takes minimum of 3 weeks. Corp. policy: “No state or fed vets allowed on premises!” Currently this operation controls 33 percent of all pigs produced in USA! All vets employed graduated less than 2 years ago and only stay for 2 years or less, or until they cost too much to write health charts and bleed pigs.” “I have practiced in this state for slightly less than one year. There has been much less sharing of information and collegiality here than in my previous places of employment in another state. There is very little communication between practices and no organized flow of information to or from any local/state public health agencies. The only public

K-19
health-related situation was regarding confirmed cases of leptospirosis and the State Veterinary School.” “After personally having been exposed to a recombinant strain of MLV brucella abortus vaccine, I found that the clinicians who managed my care were largely ignorant of the most germane features of common zoonotic diseases.”

EN-1
Endnotes
1 National Association of County and City Health Officials (NACCHO). Bioterrorism Grants Allocation. For FY 2002, total funds allocated and funds to be released June 2002 were: New Hampshire ($8,479,944; $6,783,955), New Jersey ($27,242,380; $21,793,904), New York State ($33,917,260; $27,133,808), New York City ($26,181,040; $20,944,832), and Pennsylvania ($37,348,690; $29,878,952). http://www.naccho.org/general545.cfm. 2 The terms “department” and “agency” are used interchangeably in this report. 3 “The Detection of Monkeypox in Humans in the Western Hemisphere,” by Reed KD, Melski JW, Graham MB, et al., New England Journal of Medicine, Vol. 350, pp. 342-350, 2004. 4 “Slow Response to Monkeypox Reveals Glaring Gap in Bioterror Defences,” by D. MacKenzie, New Scientist, 21 June 2003. 5 Ashford DA, Kaiser RM, Bales ME, et al. “Planning Against Biological Terrorism: Lessons from Outbreak Investigations,” Emerging Infectious Diseases, Vol. 9, pp. 515-510, May 2003. 6 Personal communication with Dr. David Ashford, epidemiologist, Meningitis and Special Pathogens Branch, CDC, “Health care providers” included all nurses, laboratory workers, infection-control practitioners, and physicians. In some cases, physicians reported outbreaks to the CDC directly. In these cases, the CDC referred them back to the state health departments. Any request for CDC assistance must come from the state health departments, 19 July 2005. 7 Ashford DA, Kaiser RM, Bales ME, et al., op. cit. 8To Err Is Human: Building a Safer Health System, by L. T. Kohn, J. Corrigan, M. S. Donaldson, Washington, National Academy Press, 2000. 9The Joint Commission on the Accreditation of Healthcare Organizations (JCAHO) is an independent, not-for-profit organization that evaluates and accredits >15,000 health care organizations and programs in the U.S. http://www.jcaho.org/about+us/jcaho_facts.htm. 10 Ibid. 11 Centers for Disease Control and Prevention National Electronic Disease Surveillance Systems Web site: http://www.cdc.gov/nedss/index.htm. 12 Of course, other analysts might disagree with this assessment. 13 Personal communication with Dr. Jose Montero, Acting State Epidemiologist, New Hampshire Department of Health and Human Services, most public health functions are carried out at the state level. Municipalities are not specifically required to have a health department or board of health, but under RSA 47:12, public health powers are vested in city councils and executed by such officers. Under RSA 128, all towns must have a health officer who has the authority to oversee matters such as housing standards, abatement of nuisances, and food service establishments. However, most food service establishments are licensed and regulated by the state, 26 July 2005. Personal communication with Dr. Margaret Alonso, Director, Division of Health Promotion, Montgomery County Health Department, Pennsylvania does not have any state laws requiring local health departments. Their formation is optional. A handful of municipalities and counties have chosen to have them. The rest

EN-2
of the state is served by outposts of the State Health Dept. which operates in a regional way with small staffs, 25 July 2005. 14 Personal communication with Dave Henry, Health Officer, Princeton Regional Health Department, ,New Jersey State Statutes (26:3-1) require that each of the 566 municipalities have a board of health, and at one time, there were 566 health departments. That number has dwindled to 115, due primarily to financial incentives to regionalize, August 2005. All 115 health departments are bound by NJ Public Health Practice Standards for Local Boards of Health (NJAC 8:52), 22 July, 2005. Personal communication with Dr. Guthrie S., Director, Center for Community Health, NYS Department of Health, NYS Public Health Law, section 347, requires that counties with populations over 250,000 must have a physician commissioner, while smaller counties can have a nonphysician public health director. Article 6 of the Public Health Law describes the required services that county health departments must provide and also governs the system of state reimbursement: 100 percent of base funding depending on population, 36 percent for core services, and 30 percent reimbursement of optional services. This system dates to the early 1900s and was re-codified in 1953, 22 July, 2005. 15 Local Public Health and Physician Surveys: Dr. Kerr White, retired deputy director for health science, Rockefeller Foundation, founding chairman and professor of health care organization, Johns Hopkins University; Dr. Steven Leeder, visiting research scientist at Columbia University and professor of public health and community medicine at the University of Sydney, Australia; Dr. Robert Blendon, professor of health policy and management, Harvard School of Public Health. 16 Veterinarian Surveys: Dr. Robert Eisner, assistant director, division of animal health, NJ Dept. of Agriculture; Dr. Jennifer Fowler, veterinary consultant, NJ Dept. of Agriculture; Dr. Marty Zaluski, public health veterinarian, NC, Dept. of Agriculture. 17 “Adding More Specialists Is Not Likely to Improve Population Health: Is Anybody Listening?” by R. L. Phillips, M. S. Dodoo and L. A. Green, Health Affairs, E-pub ahead of print, 2005, pp. 111-114. 18 Minor Use and Minor Species Animal Health Act of 2001, http://www.avma.org/scienact/mums/whitepaper.asp.. 19 Dr. John T. Doucette, a biostatistician in the department of community and preventive medicine, Mount Sinai School of Medicine, recommended using this analysis strategy with the physician sample. 20“Leader” is defined as the individual who would make the crucial decisions regarding mass vaccinations, quarantine, treatments, etc. “Preferred Leader” is the answer provided by the state health and agriculture officials when asked, “Who would serve as the leader in your state during a public health crisis involving humans or animals?” 21 28 PA Code chps 27 & 211. Reporting of Communicable and Non-Communicable Diseases, by Pennsylvania Dept. of Health, http://www.pabulletin.com/secure/data/vol32/32-4/161.html. 22 Personal communication with Dr. Jeffrey Hamer, assistant director of animal health, NJ Department of Agriculture, November 2004. 23 Personal communication with Dr. Dale Morse, director of the Office of Science and Public Health, New York State Department of Health. The exact arrangement of which zoonotic disease gets reported to Health or Agriculture is still being decided in New York State. Legally all animal diseases are supposed to go to Agriculture, but they primarily focus on livestock and are not able to investigate all reports, December 2004.

EN-3
24 Personal communication with Dr. Clifford McGinnis, New Hampshire Department of Agriculture State Veterinarian (September 2003); with Dr. Nanette Hanshaw-Roberts, Pennsylvania Department of Agriculture November 2004. 25 Primary care is defined as general practice such as the care given in a general internal medicine practice, pediatrics, or family practice. However, some specialists provide varying levels of primary care as well. Primary care in this survey was self-determined by the practicing physician. 26 Consulting veterinarians recommended splitting the animals this way during the survey development. 27 Personal communication with Dr. Guthrie. In New York, veterinarians are not legally required to report to local health departments other than suspect rabies cases. All educational efforts have focused on encouraging them to report to the state agriculture agency, 1 February 2006. 28 The survey did not specifically ask the physicians or veterinarians if they had computers with Internet access. However, the vast majority of the respondents, both physicians and veterinarians, filled out and mailed in the hard-copy surveys rather than answering them online. Physician and veterinarian Internet access should be assessed in order to determine if web-based reporting could be possible in the near future. 29 The 14 vaccine-preventable diseases included: polio, measles, mumps, rubella, diphtheria, pertussis, tetanus, Hemophilus influenza, varicella, pneumococcal disease, influenza, hepatitis A, hepatitis B, and meningococcal disease. 30 Only 9 local health agencies exist in Pennsylvania. State-run districts cover most of the state. However, these districts should collect data and analyze data for their jurisdictions just as the local health agencies should. 31 A total of 20 respondents indicated that their local health agency had a laboratory. However, the question was problematic in that 3 out of the 4 Pennsylvania health districts claimed that the state labs were their local laboratories. Another respondent answered that their agency had a laboratory, but then didn’t answer any of the laboratory-related questions. Removing the 3 PA responses left 17 laboratories. 32 Biosafety levels indicate the degree of containment of the biological agents under study. Level 1 is the lowest level of containment while level 4 is the highest. At this time, only federal government laboratories and some research laboratories are BSL 4. 33 The CDC Laboratory Response Network was established in 1999 to ensure an effective laboratory response to bioterrorism. It is an integrated network of state and local public health, federal, military, and international laboratories with the capability to respond to all forms of public health emergencies. http://www.bt.cdc.gov/lrn/. 34 Personal communication with Dr. Guthrie Birkhead, NYS Dept. of Health, Local health laboratories in New York should not, by design, be capable of handling anthrax, botulism, or tularemia samples. It is not considered cost-effective for every local jurisdiction to have a fully functioning BSL 3 lab. The NYS lab, NYC lab, and two labs in Westchester and Buffalo, which were supported with BT funds, are the only ones that should be handling these types of specimens, 1 February 2006. 35 Personal communication with Elizabeth B. Armstrong, executive director, International Association of Emergency Managers, 6 October, 2005. 36 “City Had Evacuation Plan But Strayed from Strategy,” by L. Olsen, Houston Chronicle, 8 September 2005, http://www.HoustonChronicle.com. 37 Personal communication with Dr. Guthrie Birkhead, NYS Dept. of Health, New York is considered a “home rule” state with legal authority given to the local county executive and local health commissioner.

EN-4
The local health commissioner has the power of public health law, but could be over-ruled by the county executive. In an extreme situation, the governor could declare a disaster and invoke additional powers, such as martial law, that the state health commissioner could not do. Therefore, depending on the crisis, different people would have different leadership roles and responsibilities. “Unified command” is the current buzzword for crisis management. But as far as the clinicians are concerned, the public health authorities would be the ones dispensing public health information, 1 February 2006. 38 “Many Evacuated, but Thousands Still Waiting. White House Shifts Blame to State and Local Officials,” by M. Roig-Franzia and S. Hsu, Washington Post, 4 September 2005, p.A01. 39 Personal communication with Dave Henry, health officer, Princeton Health Dept. The New Jersey Emergency Health Powers Act, which was recently signed into law, puts the LINCS agencies, rather than individuals, in charge of public health crises, 19 September 2005. 40 “Find the Brownie,” by P. Krugman, New York Times, 26 September 2005. 41 Estimate from Dr. Ruth Berkelman, director, Center for Public Health Preparedness, Emory University through personal communication, 28 April 2004. 42 “Summary of Reportable Diseases and Conditions 2000 and 2001,” by New York City Department of Health, City Health Information, Vol. 21, December 2002. 43 Pennsylvania Department of Health http://www.dsf.health.state.pa.us/health/lib/health/guide/NOTIFIABLE_DISEASES.html. 44 USDA: http://www.aphis.usda.gov/vs/ceah/ncahs/nsu/surveillance/domestic.htm. 45 CDC West Nile Virus data: http://www.cdc.gov/ncidod/dvbid/westnile/surv&control05Maps.htm CDC Rabies data: http://www.cdc.gov/ncidod/dvrd/rabies/Epidemiology/Epidemiology.htm. 46 USDA Livestock Census Data, http://www.nass.usda.gov/Census_of_Agriculture/index.asp. 47 AVMA Companion Animal data: http://www.avma.org/membshp/marketstats/sourcebook.asp. 48 Emerging Infectious Diseases. Consensus on Needed Laboratory Capacity Could Strengthen Surveillance, by U.S. General Accounting Office, GAO/HEHS-99, 26 February 1999. 49 Ibid. 50 Centers for Disease Control and Prevention Fact Sheet. Facts About the Laboratory Response Network. Department of Health and Human Services. 4 Feb., 2004, http://www.bt.cdc.gov/lrn/factsheet.asp). 51Biosafety in Microbiological and Biomedical Laboratories (BMBL), by D. O. Fleming and D. L. Hunt, eds., 4th ed., CDC, Reprinted in Biological Safety Principles and Practices, Appendix I, Washington, ASM Press, 2000, http://www.cdc.gov/od/ohs/pdffiles/4th%20BMBL.pdf. 52 Personal communication with Dr. Guthrie Birkhead, NYS Dept. of Health, In New York State, all local health agencies are required, by law, to have a designated medical consultant if they do not have a physician health commissioner. These physicians are approved by the state health department, and every county has one. While they probably would not be considered “employees” of the health agencies, they would be available for consultation on clinical issues and policies, 1 February 2006. 53 Personal communication with Dr. Guthrie Birkhead, NYS Dept. of Health, 1 February 2006.
EN-5
54 “More than $5 billion spent on bioterrorism preparedness, but Americans remain deeply concerned about safety and a majority lack confidence in government and health system to respond effectively,” Press release from National Center for Disaster Preparedness at Columbia University Mailman School of Public Health, http://www.ncdp.mailman.columbia.edu/press.htm. 55Ibid. 56“A Prescription for Change: The Need for Qualified Physician Leadership in Public Health,” by L. H. Kahn, Health Affairs, Vol. 22, No. 4, pp. 241-248, 2003, http://www.cdc.gov/ncidod/EID/vol12no04/pdfs/05-0956.pdf. 57“Confronting Zoonoses, Linking Human and Veterinary Medicine,” by L. H. Kahn, Emerging Infectious Diseases, Vol. 12, pp.556-561, July/August 2006. 58 While the physician response rate was small and was disproportionately male, the veterinarian response rate was respectable. It seems reasonable to make these generalizations, therefore, because these respondents were likely to be more engaged and interested in the issues than those who did not participate at all. 59 NYS Public Health Law, approximately section 347, requires that counties with populations over 250,000 must have a physician commissioner while smaller counties can have a non-physician public health director. 60 It is not clear how “sustainable” these improved capabilities are. Theoretically, new equipment would be sustainable as long as it was functional. New personnel, on the other hand, would only be sustainable as long as funds were available to pay them. 61 This might help explain why so few New Jersey local public health agencies were able to provide disease incidence-rate data. 62 The term “troops” comprises the public health personnel and health care professionals who would be working together to control an outbreak. 63 “Dollars for Disaster Readiness, Bioterrorism Tricky to Spend,” by V. S. Elliott, American Medical News, Vol. 49, No. 1-2, January 2006. 64 Personal communication with Dr. Guthrie Birkhead, NYS Dept. of Health, laboratory reporting is a standard in most parts of the country, but it is not the only method. The importance of physician versus laboratory reporting varies by disease. For example, for diseases that require an immediate public health response, such as meningococcal meningitis, the initial reporting should be from hospital emergency rooms or infection-control specialists. The laboratory should play almost no role. For enteric diarrhea diseases that would not necessarily need a public health response, unless a cluster were determined, all initial reports should be laboratory based, since there would be no other way to make a diagnosis. Influenza would be a similar situation. Finally, some diseases have no diagnostic test, such as hemolytic uremic syndrome (HUS), toxic shock syndrome, etc. Most outbreaks are detected by a phone call from an alert clinician—not by a laboratory, 1 February 2006. 65 Personal communication with Dr. Gary Smith, Professor of Population Biology and Epidemiology at the University of Pennsylvania, School of Veterinary Medicine, 22 September 2005. 66 Poverty in the United States: 2002, by B. D. Proctor and J. Delaker, U.S. Census Bureau, 2003, Table 4. 67 Bowling Alone: The Collapse and Revival of American Community, by R. D. Putnam, New York, Simon & Schuster, 2000.

EN-6
68 “Biological and Chemical Terrorism: Strategic Plan for Preparedness and Response, Recommendations of the CDC Strategic Planning Workgroup,” by A. S. Khan and M. J. Sage, MMWR, Vol.49, RR04, pp.1-14, 21 April 2000. 69“Role of the Hospital-Based Microbiology Laboratory in Preparation for and Response to a Bioterrorism Event,” by J. W. Snyder, Journal of Clinical Microbiology, Vol.41, No.1, pp.1-4, January 2003. 70 Ibid. 71 Ibid. 72 “Role of Clinical Microbiology Laboratories in the Management and Control of Infectious Diseases and the Delivery of Health Care,” by L. R. Peterson, J. D. Hamilton, E. J. Baron, L. S, Tompkins, J. M. Miller, C. M. Wilfert, F. C. Tenover, R. B. Thomson Jr ., Clinical Infectious Diseases. Vol. 32, No.4, pp.605-611, 15 February 2005. 73 Ibid. 74 The Laboratory Response Network (LRN) was established in 1999 by the CDC to respond to biological and chemical terrorism. It consists of a national network of about 140 laboratories including federal, state and local public health, military, food testing, environmental, veterinary, and international participants, CDC Facts About the Laboratory Response Network, 15 June 2005, http://www.bt.cdc.gov/lrn/factsheet.asp. 75 Church DL, Don-Joe C, Unger B. “Effects of Restructuring on the Performance of Microbiology Laboratories in Alberta,” Archives of Pathology, Laboratory Medicine, Vol. 124, pp. 357-361, 2000. 76 The Impact of Managed Care and Health System Change on Clinical Microbiology, by The Lewin Group, 1998, http://www.asm.org/Policy/index.asp?bid=5947. 77 Ibid. 78 “Survey of Clinical Microbiology Laboratory Workloads, Productivity Rates and Staffing Vacancies,” by The American Society for Microbiology, (ASM Benchmarking Study), 2003, http://www.asm.org/Policy/index.asp?bid=39060. 79 “Regulations for Implementing the Clinical Laboratory Improvement Amendments of 1988: A Summary.” MMWR, Vol.41(RR-2), pp.1-17, 28 February 1992. 80 “The Gram Stain,” by A. M. Fournier, Annals of Internal Medicine, Vol.128, No.9, p.776, May 1998. 81 “The Influence of CLIA ’88 on Physician Office Laboratories.” By P. H. Born and S. L. Thran, Journal of Family Practice, Vol.46, No.4, pp. 319-327, April 1998.