Embed Size (px)
Citation preview

JOURNAL OF PUBLIC PROCUREMENT, VOLUME 17, ISSUE 1, 89-125 SPRING 2017
A COMPARATIVE STUDY OF FORMULAS FOR CHOOSING THE
ECONOMICALLY MOST ADVANTAGEOUS TENDER
Przemyslaw S. Stilger, Jan Siderius and Erik M. Van Raaij*
ABSTRACT. Choosing the best bid is a central step in any tendering process.
If the award criterion is the economically most advantageous tender (EMAT),
this involves scoring bids on price and quality and ranking them. Scores are
calculated using a bid evaluation formula that takes as inputs price and
quality, and their respective weights. The choice of formula critically affects
which bid wins. We study 38 such formulas and discuss several of their
aspects, such as how much the outcome of a tender depends on which
formula is being used, relative versus absolute scoring, ranking paradox, iso-
utility curves, protection against a winner with an extremely high price, and
how a formula reflects the weights of price and quality. Based on these
analyses, we summarize the (dis)advantages and risks of certain formulas
and provide associated warnings when applying certain formulas in practice.
INTRODUCTION
Procurement entails the process of obtaining works, goods and
services from external suppliers, needed by the procuring entity to
carry out its primary and support functions (Van Weele, 2010).
Effectiveness in procurement is important for several reasons. First,
every operation relies on a supply of inputs that are in many cases
selected by the procurement function. Second, procurement can play
a vital role in the delivery of strategic objectives. Third, efficient
----------------------------------
* Przemyslaw S. Stilger is a PhD student at Manchester Business School.
His research interest is in financial economics. Jan Siderius, MSc., is CEO of
Negometrix, Utrecht, the Netherlands, and Member of the EU Expert Group
on eProcurement. His interest and research is in public and private
electronic tendering with a focus on economically most advantageous
tender calculation methods. Erik M. Van Raaij, PhD., is Professor, Rotterdam
School of Management and institute for Health Policy and Management,
Erasmus University. His research interest is in procurement in the
healthcare sector.
Copyright © 2017 by PrAcademics Press
90 STILGER, SIDERIUS & VAN RAAIJ
procurement can result in considerable monetary savings. Fourth,
efficient procurement can help to achieve the best value for money.
And fifth, when it involves public money, poor procurement decisions
or failure to comply with procurement legislation can result in legal
challenges (Axelsson, Rozemeiijer, & Wynstra, 2005; Van Weele,
2010; Waters, 2002).
Running a professional tendering process is particularly visible
and relevant in the context of public procurement. Under European
Union (EU) procurement law, objective, transparent and non-
discriminatory criteria and the relative weights for quality and price
have to be published in the contract notice listed on the EU Tenders
Electronic Daily (TED). In addition, the bid evaluation methodology
has to be made publicly available (e.g. Mateus, Ferreira, & Carreira,
2010).
In the current literature, various informative examples of
unintended consequences of certain types of bid evaluation formulas
are presented, and a number of issues related to such formulas are
discussed, such as the ranking paradox (Chen, 2008; Sciancalepore,
Falagario, Costantino, & Pietroforte, 2011; Smith, 2010; Sykes,
2012). In this paper, we make the following contributions to this
relatively emergent public procurement literature. First, we look at
some hitherto under-researched aspects of bid evaluation formulas
such as protection against a winner with an extremely high price and
how bid evaluation formula reflect weights of price and quality.
Second, we use real tender data to evaluate the effects of using
particular formulas, such as the likelihood of a ranking paradox.
Third, we perform these critical assessments for 38 bid evaluation
formulas collected from the literature as well as from purchasing
practice. We start with a review of the relevant literature, followed by
a presentation of our research methods. Subsequently, we analyse
38 bid evaluation formulas, looking at five different aspects:
- How much the outcome of a tender depends on which formula is
being used,
- Likelihood of a ranking paradox,
- Shape of the iso-utility curve,
- Whether the formulas protect against winners with extremely high
prices, and
- How formulas reflect weights of price and quality.
FORMULAS FOR CHOOSING THE ECONOMICALLY MOST ADVANTAGEOUS TENDER 91
We conclude with (dis)advantages and risks of certain formulas
and practical advice regarding the use of certain formulas.
REVIEW OF RELEVANT LITERATURE
Procurement is a process that can be divided into six phases:
determining specifications; supplier selection; contracting; ordering;
expediting, and finally follow-up and evaluation (Van Weele, 2010).
This paper concerns the second phase: That of supplier selection. In
this phase, qualified suppliers need to be identified, and the resulting
list of qualified suppliers needs to be whittled down to the supplier (or
suppliers) selected for a contract (De Boer, Labro, & Morlacchi, 2001;
Wu & Barnes, 2011). The qualification stage is a sorting process,
while the supplier selection stage is a ranking process (De Boer,
Labro, & Morlacchi, 2001). In the qualification stage, suppliers that
do not meet a minimal threshold for a certain criterion are eliminated
(Aissaoui, Haouari, & Hassini, 2007). In the selection stage, buyers
can rank and select suppliers based on price only, or on a
combination of price and quality, the latter often being called a
selection of the economically most advantageous tender (EMAT) or
most economically advantageous tender (MEAT) (Bergman &
Lundberg, 2013). In this paper, we are interested in approaches
where suppliers bid, and the procuring entity uses a procedure based
on EMAT to rank the bids.
When opting for a tendering procedure based on EMAT, the buyer
needs to make a number of key decisions: Which quality (i.e., non-
price) dimensions to include in the qualification stage and which in
the selection stage, how to score each dimension, and how to weigh
each quality dimension so as to come to one overall quality score.
Attention should be given to the definition of quality; in the case of
EMAT calculations in the selection stage, quality may not even be the
right word. Often, most “quality” aspects are already covered in
minimum requirements and do not receive a weight in the EMAT
calculations. Only quality aspects on which competing suppliers offer
discriminating quality are weighted and entered as “quality” in the
EMAT formulas. Examples of such aspects can include environmental
characteristics, technical merit or after-sales service and technical
assistance (Parikka-Alhola, Nissinen, & Ekroos, 2012). For reasons of
simplicity, we keep the term quality, typically the result of a weighted
multi-criteria analysis resulting in one quality score for each offer.

92 STILGER, SIDERIUS & VAN RAAIJ
Quality criteria are listed, prioritized by assigning weights to each
criterion and these weights are usually shown to suppliers. The
quality score is calculated as the weighted sum of the scores on each
individual quality criterion. The minimum (maximum) quality score is
0% (100%). Because only qualified suppliers proceed from the
qualification stage to the selection stage, a compensatory approach
can be used for final selection, whereby a high score on one criterion
(price or quality) can compensate for a low score on another criterion
(Aissaoui Haouari, & Hassini, 2007). This also means that a bid with a
quality level of 0% is still a valid alternative to win the tender in
combination with a low enough price.
Next, the weight of quality versus price has to be decided, and
finally, a choice has to be made which formula to use to combine the
quality score and the price into one overall score, so that bids can be
ranked (De Boer, Linthorst, Schotanus, & Telgen, 2006; Mateus,
Ferreira, & Carreira, 2010). In this paper, we focus on the formula
used to combine the quality score and the price of each bid into an
overall score.
Earlier studies have stressed the importance of choosing an
appropriate bid evaluation formula or “scoring rule” (Bergman &
Lundberg, 2013; Chen, 2008; De Boer et al., 2006; Dreschler, 2009;
Mateus, Ferreira, & Carreira, 2010; Pacini, 2012; Sciancalepore et
al., 2011). According to Chen (2008), the bid evaluation formula
plays a key role in public procurement, since it determines what ‘the
economically most advantageous tender’ is. Chen (2008) focuses
particularly on one aspect of bid evaluation formulas, namely the
issue of ranking paradox. A ranking paradox refers to a situation
when the original ranking of bids changes after one or more bids are
added or removed. It can occur when a relative (as opposed to an
absolute) bid evaluation formula is used. In the relative approach,
after all bids are submitted, each bid is evaluated using a formula
that takes as one of its inputs a characteristic of the total set of bids,
such as the lowest quality, the highest quality, the lowest price or the
highest price. Using examples, Chen (2008) shows that ranking
paradox is possible for relative bid evaluation formulas because the
axiom of independence of irrelevant alternatives is violated (see also
De Boer et al., 2006). Pacini (2012) finds that the outcomes of
certain often-used relative formulas can be manipulated by bidders,
and carry with them the risk of transforming a competitive tender in a

FORMULAS FOR CHOOSING THE ECONOMICALLY MOST ADVANTAGEOUS TENDER 93
collusive tender. Chen (2008) also points out that in practice most
bid evaluation formulas used are relative.
Smith (2010) claims that buyers may end up with a suboptimal
outcome due to their misunderstanding of the bid evaluation
formula’s impact on the procurement process. He points out the
significance of bid evaluation formulas in supplier selection by giving
examples of tenders whose outcomes would be completely different if
alternative bid evaluation formulas had been used. As an advice, he
suggests, as does Chen (2008), that buyers, before using any bid
evaluation formula, should perform a simulation study of its possible
outcomes. This should help to determine whether the outcomes are
acceptable. Sykes (2012) stresses the need to carefully assign
weights to price and quality and notes that assigning different
weights of price and quality for the same bid evaluation formula may
yield different rankings of bids. Sciancalepore et al. (2011) present a
classification of different EMAT award models and provide an
example to illustrate that the choice of a particular model may also
impact the outcome of a tender. Taken together, the literature
acknowledges the importance of choosing an appropriate bid
evaluation formula and calls for investigations into how particular
formulas impact the ranking of bids.
RESEARCH METHODS
The formulas that are investigated and compared in this study
were identified on the basis of an extensive review of academic and
practitioner literature, an Internet search, and a review of formulas
used by Negometrix, a procurement services provider, and its clients.
The 38 bid evaluation formulas are listed in the Appendix. These 38
formulas vary from very simple (e.g., formula 32) to very elaborate
(e.g., formula 27). Some formulas use just the weights of price and
quality and each bid’s price and quality score. Other formulas take
information about the complete range of bids into account, such as
average price, best price, or best quality. Still other formulas require
the tendering entity to specify a price range on forehand (e.g., formula
26) or a reference price and/or reference quality – a benchmark to
measure other offers against (e.g., formula 31). Finally, some
formulas include user-defined parameters (such as formula 27),
which help to tailor the formula to the subject of the tender.

94 STILGER, SIDERIUS & VAN RAAIJ
We analyse these 38 formulas by simulating some of their
behaviours using real tender data. Our dataset consists of 382 real
tenders executed in 2011 and 2012 and collected from the tender
database of Negometrix. For this study, we included all tenders which
were based on EMAT, had two or more bids, were correctly awarded
and archived, and had no negative or zero bids. Tendering entities
(i.c. buyers) are municipalities, hospitals, universities, utility
companies, water boards and other public organisations. Tendering
categories are facility services and products (33.5%), temporary
personnel (18.3%), project management (14.4%), medical equipment
and products (16.5%), IT (6.5%), engineering (5.5%), construction
(3.4%) and transportation (1.8%). Overall, we believe that the dataset
provides a good representation of public procurement tenders. The
breakdown of the dataset according to the official EU tender
categories is as follows: Services – 57.3%; Supplies – 32.7%; and
Works – 9.7%. For each tender, we know the weights of price and
quality as set by the buyer, number of bids, as well as the quality
score and price of each submitted bid. The quality score is obtained
using weighted multi-criteria analysis and includes all relevant non-
price criteria that are expressed in one number between 0% and
100%. The total number of bidders in these tenders is 1999. Some
summary statistics of these 382 tenders are presented in Table 1.
TABLE 1
Descriptive Statistics of the Tenders (N = 382)
Minimum Median Maximum
Number of bidders per tender 2 4 38
Weight of price 20% 50% 95%
Weight of quality 5% 50% 80%
A COMPARISON OF WINNERS AND RANKINGS
To address the question of how much of a difference it makes
which formula is being used, we execute pairwise comparisons of 27
formulas. It is impossible to include all 38 formulas because 11 of
them require some extra input such as reference price, price range,
or user-defined parameters, and this input is not available in our
dataset. We applied the 27 formulas to each tender and counted how
many times each pair of formulas (a) ranked the same bid as number

FORMULAS FOR CHOOSING THE ECONOMICALLY MOST ADVANTAGEOUS TENDER 95
1, and (b) generated the same ranking. When the bid ranked as
number 1 differed between formulas, we also recorded which formula
ranked a cheaper bid as number 1. We divided each count by the
total number of tenders, i.e. 382, to create a similarity score. Table 2
shows for what percentage of the 382 real tenders each pair of 27
formulas ranked the same bid as number 1.
As for the bid ranked number 1, the similarity scores range from
62% to 100%. So in the majority of all tenders, all 27 formulas agree
on the number 1. There are five formulas – 3, 9, 13, 32, and 35 –
which relatively often lead to a number 1 that is different from all
other formulas. Formulas 9 and 35 have particularly low congruence
with other formulas when it comes to identifying the winning bid.
Next, we compared the same 27 formulas on the complete
ranking of bids. Table 3 shows for what percentage of the 382 real
tenders each pair of 27 formulas generated the exact same ranking.
As for the complete ranking, the similarity score ranges from 20%
to 100%. As expected, these percentages are lower than agreeing
only on the number 1 as now the entire ranking is compared. If two
“outlier” formulas are ignored (formulas 9 and 35 only agree in 20%-
21% of the tenders with all other formulas), we can conclude that
roughly half of all formulas come up with the same rankings in 382
tenders. An exact match in ranking in all tenders is quite rare as there
are only 11 exact matches out of 729 pairs. This shows that it does
matter which formula is chosen: Different formulas lead to different
rankings of bids.
As a third pairwise comparison, we took a closer look at those
cases where the formulas disagreed on the winning bid. When a pair
of formulas does not agree on the winning bid, it is of course
interesting to know which formula tends to pick a lower priced bid as
winner and which a higher priced bid. Table 4 shows for what
percentage of the 382 real tenders the row formula ranked a cheaper
bid as number 1 compared to the column formula. For each pair of
formulas, the numbers above the diagonal and below the diagonal
add up to the disagreement score (1 minus the similarity score of
Table 2). For some pairwise comparisons, when there is
disagreement about the winner, one formula always selects a bid. We
conclude that it clearly does matter which formula one uses for the
FORMULAS FOR CHOOSING THE ECONOMICALLY MOST ADVANTAGEOUS TENDER 99
evaluation of bids and Table 4 helps practitioners in judging each
formula for its tendency to pick a lower or higher priced winner.
RELATIVE VERSUS ABSOLUTE FORMULAS AND RANKING PARADOX
As explained before, there are two main approaches to the
evaluation of bids: relative and absolute. An absolute formula does
not utilize information from the submitted bids as a reference point.
In other words, the score calculated using an absolute formula
depends only on price and quality of a given bid. An example of an
absolute formula is formula 29. Of our set of 38 formulas, 14 are
absolute formulas (indicated with “A” in Table 5). A practical
advantage of an absolute formula is that bidders can calculate the
monetary value that buyers attribute to each weighted sub-criterion
(Albano et al., 2008). This supports bidders’ decisions to fulfil certain
criteria or not; after all, it could cost a bidder more than the buyer’s
value to satisfy the criterion. This aspect is useful in guiding both
buyers and bidders in preparing and submitting tenders. According to
Chen (2008), another advantage of an absolute formula is that
bidders can calculate their score before submitting their bid.
Research also suggests that absolute formulas lead to lower bids
from suppliers than relative formulas. Albano et al. (2008) suggest
that predictability of the score in the case of an absolute formula
might stimulate price competition.
The knowledge of the total score does not however help bidders
to estimate their chances of winning the tender, as this score is only
relevant in comparison with the scores of other bidders. Moreover,
calculating the score is often not possible for the supplier because
many quality criteria are evaluated and scored by the tendering entity
only after bid submission.
When a relative formula is used, bidders can only estimate their
final score as it depends on the other submitted bids, which are
unknown a priori. Of our set of 38 formulas, 24 are relative formulas
(indicated with “R” in Table 5). An example of a relative formula is
formula 1. When a relative formula is used and one or more bids are
removed or added, the original ranking of bids could change (Chen,
2008; De Boer et al., 2006), because the difference between two
cheaper bid compared to the other. For example, when comparing
formulas 1 and 35, they disagree on the winning bid in 33% of the
382 real tenders in our dataset; in all these cases of disagreement,

100 STILGER, SIDERIUS & VAN RAAIJ
formula 1 has a cheaper bid as the winning bidders’ scores, derived
from a relative formula, depends on one or more other bids.
While the changed ranking effect is common and known in
contests (e.g. in elections or sports), it seems less intuitive when
ranking bids in tendering process. This is why it has been referred to
as the ‘ranking paradox’, a term we will also use to stay connected to
other publications on the topic of procurement and bid selection,
although it is not really a ‘paradox’. A recent court ruling in the
Netherlands stressed that it is not really a ‘paradox’, but simply the
consequence of the tendering methodology chosen by the buyer
(Court of Arnhem case 200.096.019). In a tender organized by a
Dutch municipality, based on the scores calculated using a relative
formula, the contract was awarded to supplier A, with suppliers B and
C ranked second and third respectively. However, the buyer rejected
supplier A after their first delivery, as this supplier had promised a
feature their product did not have. With the two alternatives left, the
buyer applied the bid evaluation formula again and now supplier C
won. Supplier B disagreed and went to court, but lost the case
because according to the court the buyer applied a methodology that
was known to all the suppliers. Supplier B appealed, but again the
court ruled that there was no problem with the methodology nor with
the ranking paradox. According to the ruling (Court of Arnhem case
200.096.019), the buyer had however not been clear enough on how
they would act in case one of the suppliers was excluded after
announcing the results of the tender. They should have been clearer
about whether they will choose the bid initially ranked number two or
apply the bid evaluation formula again.
To obtain some idea about the impact of the ranking paradox in
procurement, we analysed 22 of the 24 relative formulas from the set
of 38. A ranking paradox is not possible for relative formula 15 (Chen,
2008). As for formula 16, it requires a user-defined parameter which
is not available in our dataset and thus this formula had to be
excluded from the comparison. For the sake of simplicity, we consider
the case when only one bid is removed from the initial ranking. A
ranking paradox can only occur in tenders with more than two bids.
There are 315 of such tenders in our dataset. We applied the 22
relative formulas to the 315 tenders, and generated 22 * 315 initial
rankings. Then, for each formula and each tender we removed one
bid, recalculated the ranking, and compared the initial ranking with

FORMULAS FOR CHOOSING THE ECONOMICALLY MOST ADVANTAGEOUS TENDER 101
the final ranking. After the bid ranked as number 1 was removed from
the initial ranking, we compared the bid ranked as number 1 in the
final ranking with the bid ranked as number 2 in the initial ranking. If
these two bids are different, it means that the ranking paradox has
occurred. We refer to this as ‘number 1 drop-out ranking paradox’.
After removing a bid ranked not as number 1 from the initial ranking,
we compared the bid ranked as number 1 in the final ranking with the
bid ranked as number 1 in the initial ranking. If these two bids are
different, it also means that the ranking paradox has occurred. We
refer to this as ‘number n drop-out ranking paradox’. The ‘number 1
drop-out ranking paradox’ and ‘number n drop-out ranking paradox’
are not the only ranking paradoxes that can occur. It is also possible
that more than one bid is being removed. In practice, it obviously
occurs most often that (only) the number 1 bid is removed. After all, a
buyer will ‘remove’ a bid in case it turns out that number 1 does not
deliver as promised. Or, a non-number 1 supplier contests the legality
of the number 1 bid. There is less incentive to disqualify or contest
the validity of a non-winning bid. However, the ‘number n drop-out
ranking paradox’ creates the possibility of bid rigging: A non-relevant
bidder submits a bid with no intention to rank number 1 in the tender,
but to influence the score of other bids (for example, of a befriended
bidder). With our analysis of the ‘number 1 drop-out ranking paradox’
and the ‘number n drop-out ranking paradox’ we believe we have
covered the most likely cases of an already rare event of a bid being
retracted after the ranking is announced.
For each of the 22 formulas, the likelihood of a ranking paradox is
calculated as a ratio of the total number of cases in which a change
in the ranking occurred over the total number of tenders analysed.
Table 5 shows for what percentage of the 315 real tenders, either of
these two ranking paradoxes occurred.
These outcomes are quite revealing in several ways. First, for only
one out of 22 relative formulas (formula 5) the ‘number 1 drop-out
ranking paradox’ did not occur at all, and for eight relative formulas
the ‘number n drop-out ranking paradox’ did not occur. Second, for
21 formulas the ‘number 1 drop-out ranking paradox’ is more likely
than the ‘number n drop-out ranking paradox’ (formula 5 is again the
exception here). Third, formula 3 has relatively high chances of either
of the two forms of ranking paradox occurring, while formulas 6 and
12 have the highest chances of ‘number 1 drop-out ranking paradox’
102 STILGER, SIDERIUS & VAN RAAIJ
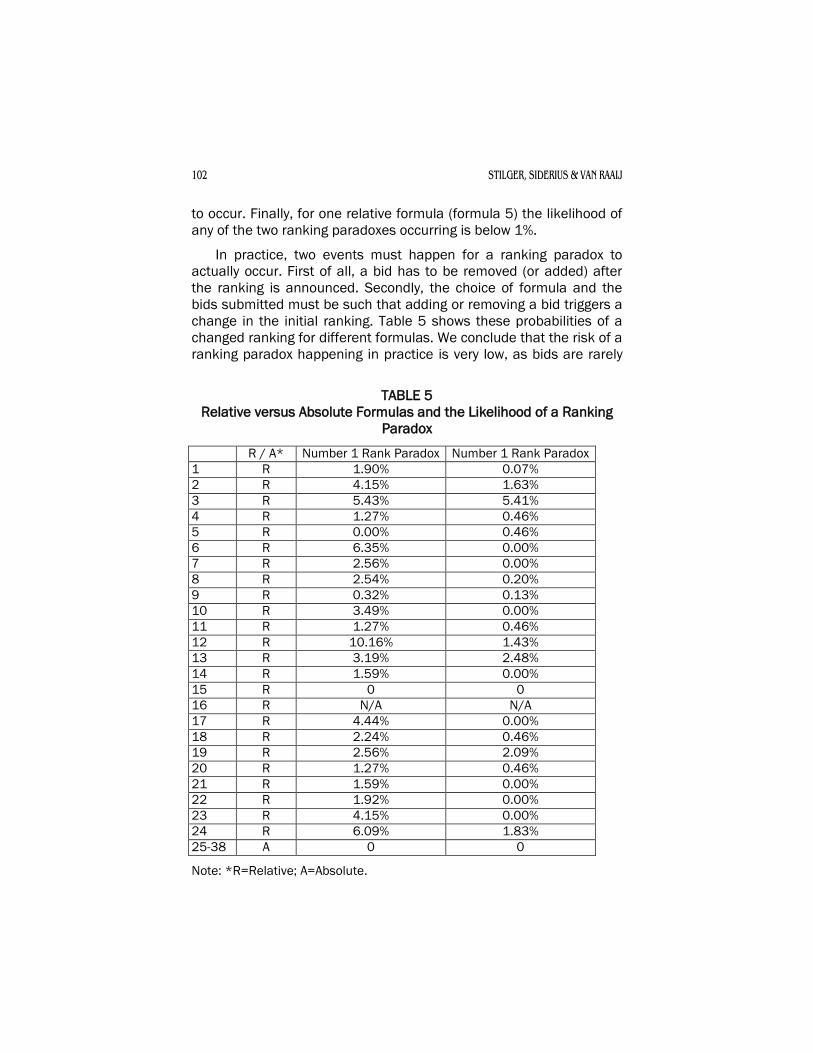
to occur. Finally, for one relative formula (formula 5) the likelihood of
any of the two ranking paradoxes occurring is below 1%.
In practice, two events must happen for a ranking paradox to
actually occur. First of all, a bid has to be removed (or added) after
the ranking is announced. Secondly, the choice of formula and the
bids submitted must be such that adding or removing a bid triggers a
change in the initial ranking. Table 5 shows these probabilities of a
changed ranking for different formulas. We conclude that the risk of a
ranking paradox happening in practice is very low, as bids are rarely
TABLE 5
Relative versus Absolute Formulas and the Likelihood of a Ranking
Paradox
R / A* Number 1 Rank Paradox Number 1 Rank Paradox
1 R 1.90% 0.07%
2 R 4.15% 1.63%
3 R 5.43% 5.41%
4 R 1.27% 0.46%
5 R 0.00% 0.46%
6 R 6.35% 0.00%
7 R 2.56% 0.00%
8 R 2.54% 0.20%
9 R 0.32% 0.13%
10 R 3.49% 0.00%
11 R 1.27% 0.46%
12 R 10.16% 1.43%
13 R 3.19% 2.48%
14 R 1.59% 0.00%
15 R 0 0
16 R N/A N/A
17 R 4.44% 0.00%
18 R 2.24% 0.46%
19 R 2.56% 2.09%
20 R 1.27% 0.46%
21 R 1.59% 0.00%
22 R 1.92% 0.00%
23 R 4.15% 0.00%
24 R 6.09% 1.83%
25-38 A 0 0
Note: *R=Relative; A=Absolute.

FORMULAS FOR CHOOSING THE ECONOMICALLY MOST ADVANTAGEOUS TENDER 103
retracted/disqualified in practice and our analyses show that even if
they are, the probability of a change in ranking as a result is (very)
low.
SHAPE OF AN ISO-UTILITY CURVE
An iso-utility curve (or: indifference curve) represents all
combinations of price and quality that will receive the same score
according to a formula (Chen, 2008). Its shape is not only of scientific
interest; it can express different organisational buying philosophies
and is of practical significance in determining the winner of a tender.
Despite its importance, buyers often do not know the shape of the
iso-utility curve, which is the chief reason we analyse this aspect.
To determine the shape of the iso-utility curve, we assume that
the price of the cheapest offer is 10 and its quality is 20%. If a
formula requires some extra input such as reference price or price
range, we make an assumption to compare the shape of the iso-utility
curve under the same conditions for as many formulas as possible.
However, it is impossible to determine the shape of the iso-utility
curves for five formulas. For formulas 2, 3, 19 and 24 this is because
of division by 0 in the denominator of the price score. For formula 13
we were not able to construct the iso-utility curves because this
formula does not satisfy the requirement that all points on the iso-
utility curve have the same score for any set of weights of price and
quality. With price indicated on the horizontal axis and quality on the
vertical axis, the iso-utility curves can be straight, concave, convex,
sigmoid (s-shaped) or discontinuous.
The marginal rate of substitution of quality for price is defined as
the price an economic agent is willing to pay to obtain one additional
unit of quality. If the iso-utility curve is straight, then the marginal rate
of substitution of quality for price is constant and so every unit of
quality is worth the same amount of money. If the curve is concave,
then the marginal rate of substitution is increasing which means that
consecutive units of quality are valued more and more. In some
cases, the last percent of quality reaching to 100% seems indeed
worth more than the average, so buyers may at times be attracted to
such shape. If the curve is convex, then the marginal rate of
substitution is decreasing which means that consecutive units of
quality are less and less valued. This shape seems also convincing
when budgets are limited - the first bit of quality is well appreciated,

104 STILGER, SIDERIUS & VAN RAAIJ
but a perfect score on quality may not seem aligned with the limited
budget. Sigmoid shaped curves have also attracted interest of buyers;
they do not wish to reward extreme bids, neither really low bids, nor
really high bids. Bids around the average are favoured relatively more.
Besides straight, convex, concave, and sigmoid, we have also
noted discontinuous iso-utility curves (formulas 3, 10, 12 and 16).
Using artificial data, we list in Table 6, whether the iso-utility curves
are straight, convex, concave, or sigmoid for three different sets of
weights of price and quality (50-50; 60-40; and 40-60). We chose
these three sets of weights because it is interesting from a practical
point of view, what is the shape of the iso-utility when the weights of
price and quality are equal; the weight of price is higher than the
weight of quality; and the weight of price is lower than the weight of
quality. For other sets of weights at either side of the 50-50 weights,
the iso-utility curves will have the same shape, but a different slope.
For formula 27 the iso-utility curve can be straight, concave, or
convex, depending on how the user sets the parameter n. For
formulas 29 and 35, the shape varies across these three sets of
weights. Since six formulas (formulas 27, 28, 32, 36, 37, 38) do not
use the weights of both price and quality, we report their general
shape of the iso-utility curve. It is also important to note that these
analyses do not provide a general proof of the shape of the iso-utility
curve.
For all formulas, except two (formulas 29 and 35), the shape of
the iso-utility curve does not vary with the distribution of weights for
quality and price. For formula 27, the shape depends on a parameter
set by the buyer. The majority of formulas, i.e. 19 out of 33, have
straight iso-utility curves. For eight formulas the iso-utility curves are
concave, whereas for two formulas they are convex. Four formulas
have discontinuous iso-utility curves, meaning the iso-utility curve has
a break. As an illustration, we display the iso-utility curves for four
different formulas with the same three sets of weights for price and
quality (50-50; 60-40; 40-60) in Figure 1.
Figure 1 also shows the link between the shape of the
indifference curve and protection against a winner with an extremely
high price which we discuss later in the paper. Looking at convex
indifference curves displayed in top right panel of Figure 1, it is clear
that they have an asymptote, i.e. a straight vertical line bounding the

FORMULAS FOR CHOOSING THE ECONOMICALLY MOST ADVANTAGEOUS TENDER 105
TABLE 6
Shape of the Iso-Utility Curve
Formula
#
Iso-utility curve
(50-50) (60-40) (40-60)
1 Concave
2 N/A*
3 N/A, Discontinuous
4-6 Straight
7 Concave
8 Straight
9 Straight
10 Straight, Discontinuous
11 Straight
12 Straight, Discontinuous
13 N/A
14 Straight
15 Concave
16 Concave, Discontinuous
17 Concave
18 Straight
19 N/A
20-23 Straight
24 N/A
25 Concave
26 Convex
27 Straight, Concave, Convex, depending on n
28 Straight
29 Straight Convex Concave
30 Sigmoid
31 Convex
32-34 Straight
35 Straight Convex Concave
36 Straight
37 Concave, when b > 0
38 Concave, when b < 0
Notes: * N/A = Not applicable – the curve cannot be plotted, e.g.
because the shape of the curve depends on additional
assumptions and/or information about actual bids.

106 STILGER, SIDERIUS & VAN RAAIJ
indifference curve from the right. This means that as the quality
increases, the price will never go above a certain level. Hence,
formulas with convex indifference curves provide protection against a
winner with an extremely high price. On the other hand, formulas with
either straight or concave indifference curves do not provide
protection against a winner with an extremely high price, because
these indifference curves do not have an asymptote bounding them
from the right.
FIGURE 1
Examples of Straight, Convex, Concave, and Sigmoid Iso-Utility Curves
An Example with a Non-straight Iso-utility Curve
To illustrate the issue with straight versus non-linear iso-utility
curves, we look at a real (but simplified) example. A large public
organisation intends to buy multifunctionals (machines that copy,
print and scan documents). Our dataset contains several such

FORMULAS FOR CHOOSING THE ECONOMICALLY MOST ADVANTAGEOUS TENDER 107
tenders. To determine the winner, the buyer uses an often used
formula 1, with a concave iso-utility curve, which is given by:
Qu a lityiice
i
Besti WQW
P
PScore P r
- The lowest price bid gets the maximum price score; others get
fewer points pro rata.
- The quality score is the sum of the scores on the individual quality
criteria times the total weight of quality.
- The total score is the sum of the price score and the quality score.
The ranking is based on the sum, the highest sum ranks first. The
iso-utility curve is concave, which cannot be easily seen from the
formula and it is our experience that practitioners often do not
know this.
The buying organisation has determined that besides price, there
are three quality criteria on which the suppliers can differentiate their
offers: Technical Capacity; SLA (Service Level Agreement including up-
time indicators and management); and CSR (Corporate Social
Responsibility).
Note that there are also a lot of minimum requirements without
weight, ensuring that even if an offer has a 0% quality score, the
organisation can adequately work with the contracted
multifunctionals. These minimum requirements are covered in the
qualification stage. In the selection stage, the buyer is looking to rank
all qualified bidders on discriminating criteria. This allows the buyer to
choose for a 70% weight on price and 30% on quality, and quality and
price are fully compensatory. The buyer now assigns a weight to the
three quality (i.e. non-price) criteria (as in most formulas1 and most
methodologies2). In our simplified example, the buyer has determined
that Technical Capacity, SLA, and CSR are equally important; they all
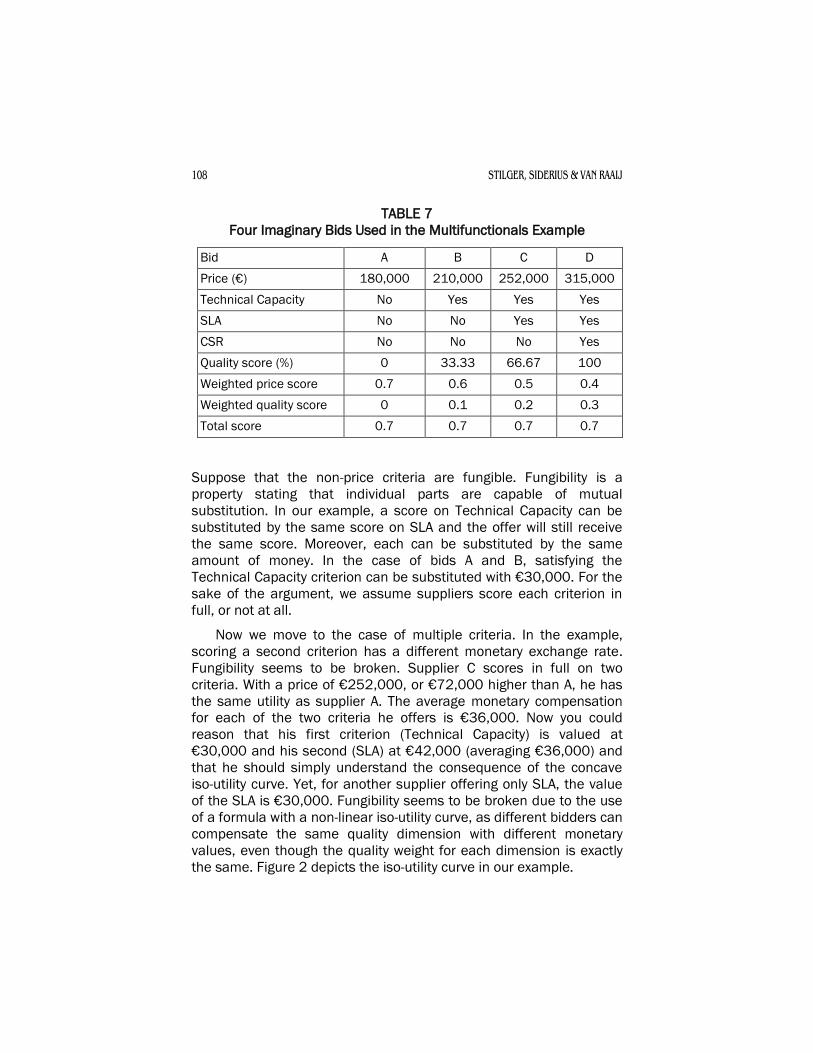
get 33.3% of the quality weight. Four imaginary bids are presented in
Table 7, each receiving the same overall score.
Loss of Fungibility
Buyers and suppliers understand the consequences of EMAT: A
score on a non-price criterion can be compensated with money.
108 STILGER, SIDERIUS & VAN RAAIJ
TABLE 7
Four Imaginary Bids Used in the Multifunctionals Example
Bid A B C D
Price (€) 180,000 210,000 252,000 315,000
Technical Capacity No Yes Yes Yes
SLA No No Yes Yes
CSR No No No Yes
Quality score (%) 0 33.33 66.67 100
Weighted price score 0.7 0.6 0.5 0.4
Weighted quality score 0 0.1 0.2 0.3
Total score 0.7 0.7 0.7 0.7
Suppose that the non-price criteria are fungible. Fungibility is a
property stating that individual parts are capable of mutual
substitution. In our example, a score on Technical Capacity can be
substituted by the same score on SLA and the offer will still receive
the same score. Moreover, each can be substituted by the same
amount of money. In the case of bids A and B, satisfying the
Technical Capacity criterion can be substituted with €30,000. For the
sake of the argument, we assume suppliers score each criterion in
full, or not at all.
Now we move to the case of multiple criteria. In the example,
scoring a second criterion has a different monetary exchange rate.
Fungibility seems to be broken. Supplier C scores in full on two
criteria. With a price of €252,000, or €72,000 higher than A, he has
the same utility as supplier A. The average monetary compensation
for each of the two criteria he offers is €36,000. Now you could
reason that his first criterion (Technical Capacity) is valued at
€30,000 and his second (SLA) at €42,000 (averaging €36,000) and
that he should simply understand the consequence of the concave
iso-utility curve. Yet, for another supplier offering only SLA, the value
of the SLA is €30,000. Fungibility seems to be broken due to the use
of a formula with a non-linear iso-utility curve, as different bidders can
compensate the same quality dimension with different monetary
values, even though the quality weight for each dimension is exactly
the same. Figure 2 depicts the iso-utility curve in our example.

FORMULAS FOR CHOOSING THE ECONOMICALLY MOST ADVANTAGEOUS TENDER 109
FIGURE 2
Iso-Utility Curve for the Multifunctionals Example
Although we believe that the idea of fungibility of scores on
quality criteria is always implicitly assumed by buyers and suppliers,
fungibility is so far not demanded by public tendering law for EMAT
tenders and hence we cannot argue that formulas with non-linear iso-
utility curves are illegal. However, the use of formulas with non-linear
iso-utility curves is contentious. For example, Nielsen (2014) argues
that non-linear iso-utility could potentially violate the equal treatment
principle. We suggest as a minimum, that buyers using non-linear iso-
utility should be explicit about this in their documentation to
suppliers.
When using a formula with a non-linear iso-utility curve, buyers
should write something like: “As in any EMAT tender, scores on one
quality criterion can be compensated with a similar score on another
quality criterion. In addition, higher prices can be compensated with
higher scores on the various weighted criteria. In this tender, the
price-versus-quality compensation relationship is not linear. If your
offer scores well on a certain criterion, this score influences the price-

110 STILGER, SIDERIUS & VAN RAAIJ
versus-quality compensation for the next criteria. In this tender, the
compensation for your CSR score depends on your score on the
Technical Capacity and the score on the SLA (and vice versa).”
A specific explanation depending on whether the curve is concave
or convex would be even better. Such a clause will make this point
clear which is otherwise hidden, hindering the transparency of the
evaluation of the offers. Taking such a clause into consideration, we
believe buyers do not like to run tenders in which the price-versus-
quality compensation value of one criterion depends on scores of
other criteria, as this seems unfair. Using formulas with a straight iso-
utility curve avoids the loss of implied fungibility and such use is
preferred by the authors, especially since there are so many of such
formulas available.
PROTECTION AGAINST WINNERS WITH EXTREMELY HIGH PRICES
In certain situations, the ranking of a bid may become
independent of its price. For example, when the weight of quality is
very high and one bidder knows that he can offer a level of quality
that gives him a sufficient advantage over other bidders, then he may
win the tender regardless of his price. For instance, let the maximum
quality score be 90 points and the maximum price score be 10 points
out of 100 points. If in this situation, one bidder knows he can score
more than 80 points on quality and that the quality score of the other
bidders will not exceed 70 points, then he can charge anything he
wants and still be ranked number 1. In other words, a formula that
does not provide protection against a winner with an extremely high
price is one for which under certain circumstances, the ranking of the
best bid does not depend on its price. Procurement law protect
buyers against ‘abnormally’ low prices by allowing them to ask
suppliers for an explanation of an ‘abnormally’ low price. Various
countries use the 20% lower than the average rule and there is
considerable experience and jurisprudence on this aspect. Although
buyers may also question ‘abnormally’ high prices, there is little
experience in this area as ‘abnormally high’ priced bids do not tend to
rank first. This is why it is valuable for practitioners to study this
aspect of a formula.
To investigate this issue, we performed another simulation using
our dataset of 382 tenders. We applied 27 formulas to each tender
and generated 27*382 initial rankings. It is impossible to include all

FORMULAS FOR CHOOSING THE ECONOMICALLY MOST ADVANTAGEOUS TENDER 111
38 formulas because eleven of them require some extra input such
as reference price, price range, or user-defined parameters, and this
input is not available in our dataset. Because this phenomenon is
most likely to occur with a high quality weight, we set this weight to
80%, which is not unrealistic as our dataset contained tenders with
this quality weight. Then, we increased the price of the top-ranked bid
50-fold. We recalculated the scores and generated 382 rankings for
each price increase. We compared the initial rankings with the
rankings after the price increase. If the bid ranked as number 1 in the
ranking with the price increase is the same as the bid ranked as
number 1 in the initial ranking, then we count this as one instance of
this formula not providing protection against winners with extremely
high prices. In Table 8, we report the percentage of cases where a
given formula ranked the bid with the 50-fold price increase as the
best bid. Formula 3 does not provide protection against a winner with
an extremely high price in 75.92% of tenders, whereas the average
for all other formulas is 7.93%.
TABLE 8
The Lack of Protection against an Extremely High Price, Measured as
the Percentage of Cases (Out of 382 Tenders) in Which a Formula
Retained the Same Winning Bid after Increasing the Price of That Bid
50-Fold
Formula # No protection
against high price Formula #
No protection
against high price
1 10.47 17 15.97
2 6.81 18 2.88
3 75.92 19 2.36
4 1.57 20 1.57
5 6.81 21 0.52
6 7.07 22 2.62
7 15.97 23 1.57
8 0.52 24 10.99
9 1.57 25 0.52
10 13.09 26-28 N/A
11 1.57 29 2.62
12 10.73 30-31 N/A
13 13.87 32 1.57
14 0.52 33-34 N/A
15 0.79 35 2.62
16 N/A 36-38 N/A

112 STILGER, SIDERIUS & VAN RAAIJ
HOW WEIGHTS OF PRICE AND QUALITY ARE REFLECTED
In this section, we analyse data from four real tenders to show
how formulas differ in the way they emphasize price versus quality.
We selected four tenders from our dataset, each with two bidders. We
selected a tender with one bid with high quality and high price, and
one bid with low quality and low price. We selected three more
tenders, each with two bids with similar prices: One with two low
quality bids, one with two high quality bids, and one with significant
differences in quality. Table 9 shows prices and quality levels (as a
percentage) for all four tenders.
For 26 formulas, we calculated the “tipping point”, defined as the
percentage weight of price, above which the lower price-lower quality
bid becomes the best bid. Note that these are bids A, C, E, and G in
Table 9. As before, we cannot report the “tipping point” for eleven
formulas because they require some extra input such as reference
price or price range, and this input is not available in our dataset.
Moreover, for formula 32 in Appendix A, the “tipping point” is not
defined as the weights of price and quality do not feature in this
formula. For low weights of price, starting at 0% price and 100%
quality, the higher price-higher quality bid will always win. At some
higher weight for price, the lower priced bid will become best bid. For
example, a tipping point of 29.1% means that the higher-quality bid is
ranked best bid if the weight of price is between 0% and 29.1%, and
the lower-price bid is ranked best bid if the weight of price is 29.1% or
higher.
TABLE 9
The Four Real-World Tenders Selected for the Analysis of How
Formulas Reflect Weights of Price and Quality
Bid Quality Price
Tender 1 - HiQ vs. LoQ, different P A 0.4000 352,250
B 0.7000 1,301,500
Tender 2 - Both LoQ, similar P C 0.3784 140,086.34
D 0.3818 142,065.42
Tender 3 - Both HiQ, similar P E 0.9438 533,613
F 0.9688 567,860
Tender 4 - HiQ vs. LoQ, similar P G 0.2863 1.97
H 0.7538 2.05

FORMULAS FOR CHOOSING THE ECONOMICALLY MOST ADVANTAGEOUS TENDER 113
From Table 10, it is clear how for each formula different weights of
price and quality define which bid is ranked as best bid. For example,
in columns 2 and 7, some formulas rank the lower-price bid as best
bid only when the weight of price is higher than 37%, while some
others already do so with a price weight above 10%. In the ‘low
quality, low quality, same price level’ tender (columns 3 and 8) some
formulas rank the lower priced bid as best bid for weights of price
above 1% (i.e. for nearly the entire range of possible price weights)
while some others only from a price weight above 55%.
TABLE 10
Tipping Points, Defined as the Percentage Weight of Price, above
Which the Lower Price-Lower Quality Bid Becomes the Best Bid
(Column Numbers in the Top Row)
(1) (2) (3) (4) (5) (6) (7) (8) (9) (10)
Fo
rmu
la #
HiQ
vs L
oQ
, d
iff
P
Bo
th L
oQ
, sim
P
Bo
th H
iQ,
sim
P
HiQ
vs L
oQ
, sim
P
Fo
rmu
la #
HiQ
vsa
Lo
Q,
dif
f P
Bo
th L
oQ
, sim
P
Bo
th H
iQ,
sim
P
HiQ
vs L
oQ
, sim
P
1 29.1 19.0 29.2 92.3 16 N/A N/A N/A N/A
2 23.1 0.3 2.4 31.9 17 37.0 37.9 29.9 94.1
3 23.1 0.3 2.4 31.9 18 32.2 38.5 29.5 95.8
4 20.7 18.9 28.6 92.1 19 13.0 0.2 1.2 18.9
5 29.1 19.0 29.2 92.3 20 20.7 18.9 28.6 92.1
6 29.1 19.6 29.3 92.3 21 10.0 18.8 27.9 92.0
7 37.0 38.6 29.9 94.1 22 27.2 38.4 29.2 94.0
8 N/A* N/A* N/A* 95.6 23 13.7 38.2 28.6 93.8
9 21.8 38.9 29.2 97.6 24 30.0 0.9 2.5 38.3
10 23.1 18.8 27.9 92.0 25 N/A* N/A* 26.4 91.9
11 20.7 18.9 28.6 92.1 26-28 N/A N/A N/A N/A
12 10.0 18.8 27.9 92.0 29 30.0 38.9 29.6 96.1
13 23.1 0.3 2.4 31.9 30-34 N/A N/A N/A N/A
14 18.2 31.5 43.6 95.8 35 30.0 38.9 29.6 96.1
15 24.1 24.4 35.6 94.2 36-38 N/A N/A N/A N/A
Notes: * N/A = Not applicable – the tipping point is outside the interval
between 0% and 100%.

114 STILGER, SIDERIUS & VAN RAAIJ
This experiment shows that some formulas have an inherent
relative tendency to pick low price bids as winners. For example, let
us look at the ‘high quality, low quality, similar price level’ tender
(columns 5 and 10). In these columns, there are five formulas that
seem much more sensitive to price than the other formulas. In this
tender, one would expect that only a very high weight of price (>90%)
would make the bidder with the much lower quality and slightly lower
price win the tender. Not so for formulas 2, 3, 13, 19, and 24, since
their tipping point is between 18 and 39%! These formulas
incorporate not only the best (lowest) price, but also the worst
(highest) price and therefore depend on a bid spread. The difference
between the best and worst price defines the price evaluation range.
If these best and worst price do not differ much, the formula becomes
very sensitive to price. Only in the ‘high quality, low quality, different
price level’ tender the tipping point of four of these five formulas is
again comparable with the other 21 formulas. In this tender the
highest and lowest price differ a lot, so the price evaluation range
becomes very large making the sensitivity to price much lower. All of
these five formulas show relatively low tipping points (and thus high
price sensitivities) in three of the four tenders.
It is quite understandable that buyers want to include the highest
quality bid and / or the lowest price bid in the EMAT formula. Buyers
generally do not know exactly the highest possible quality, nor the
lowest possible price before starting the tender. Bidders offering the
highest quality or the lowest cost are the buyer’s best approximation
of relevant industry best-in-class standards. The case to include the
highest price or lowest quality bid in formulas or even the average or
the median seems a lot weaker, as our experiment demonstrates the
unwanted side effect (loss of control) of adding such elements in an
EMAT formula.
CONCLUSION
A balanced and properly functioning bid evaluation formula to
choose the economically most advantageous tender is a critical task
for any buyer. Listing and measuring against award criteria is an
intense process getting abundant attention from both buyers and
bidders, often debated and sometimes even contested in court. The
formula itself often gets far less attention; formulas are often chosen
without carefully analysing their properties. Our experience is that

FORMULAS FOR CHOOSING THE ECONOMICALLY MOST ADVANTAGEOUS TENDER 115
most often buyers are unaware of what alternatives exist to a formula
they use.
This research is the first in its kind listing 38 different formulas
used in procurement practice and analysing them on specific
dimensions such as how much the outcome of a tender depends on
which formula is being used, choice between relative and absolute
formula, likelihood of a ranking paradox, shape of iso-utility curves
associated with the formula, likelihood of not providing protection
against a winner with an extremely high price and how a formula
reflects weights of price and quality.
With this paper, we want to show the large variety of bid
evaluation formulas that buyers can use in an EMAT tender
procedure. Despite the efforts expended to identify such formulas
from academic publications, websites and practitioner contacts, we
are sure that the 38 formulas described here are not all that are out
there. Our analyses with data from real tenders show that while each
formula is unique when looking at the details of their behaviour, some
clusters of formulas emerge with very high levels of agreement in
determining the winning bid in these real tenders. Outside of these
clusters, there a few formulas that relatively often choose winners no
other formula chooses. Using the Tables presented in this paper,
practitioners can compare the behavior of the bid evaluation
formula(s) they currently use and do not use, and see the difference it
makes which formula is chosen.
A buyer who is considering what bid evaluation formula to use to
select the economically most advantageous tender, may first want to
consider whether or not a formula offers protection against winners
with extremely high prices. If a formula rewards quality very well and
does not penalize high prices, there are chances that a bidder who
stands out in quality can theoretically charge any price it wants. This
knowledge may be exploited by a bidder. Our analysis has shown that
formula 3 has a strong tendency to maintain the winning bid even if
its price is increased 50-fold. This formula should probably not be
used, or used with extreme care, unless there are external factors
which will prevent bidders from putting in extremely high prices in the
first place. This formula offers relatively little protection against
winners with extremely high prices because it has concave
indifference curve.

116 STILGER, SIDERIUS & VAN RAAIJ
When choosing between an absolute and a relative formula,
buyers should consider the risk of a mismatch between reference
price or price range and market prices against the risk of a ranking
paradox. The ranking paradox is avoided when choosing an absolute
formula, but of 14 absolute formulas we have studied, all except four
need some extra input such as reference price or price range.
Choosing one of these absolute formulas creates the burden for the
tendering entity of requiring pre-tender market price knowledge and
with it, the risk of deviations between expectation and reality.
As for the ranking paradox, we considered a ‘number 1 drop-out
ranking paradox’ and a ‘number n drop-out ranking paradox’. In our
study of 382 real tenders, we show that the practical occurrence of
the ranking paradox for most formulas is small. For most formulas,
ranking paradox seems to be more of a theoretical notion rather than
a real risk in practice. Formulas 3 and 12 show relatively higher risks
of the ranking paradox.
We believe that special attention should be given to formulas with
non-linear iso-utility curves. A linear relationship between price and
quality implies that incremental units of quality have a constant
value. A non-linear relationship implies that units of quality vary in
value depending on the level of quality of the individual offer.
Concave curves imply that the buyer values consecutive units of
quality more and more, while convex curves imply the opposite. We
argue that the various criteria defining quality are implied to be
fungible if the weighted multi-criteria analysis is used to measure
quality. Therefore, we believe it is more clear and fair for buyers and
suppliers to use formulas with straight iso-utility curves.
We also considered four scenarios to demonstrate how different
the 38 formulas are when it comes to reconciling the weights of price
and quality. In this section we also discussed the disadvantages of
including the worst price or quality in the formula, as well as the
average and median price or quality. This analysis clearly showed that
five formulas with such elements of ‘bid spread’ (formulas 2, 3, 13,
19, and 24) are very price sensitive when bid prices do not differ
much.
Obviously, the outcome of the tender does not only depend on the
choice of a formula. In fact, many practitioners rightfully assume that
the outcome depends more so on the choice of weights for price and
quality. However, we found that the choice of a formula and the

FORMULAS FOR CHOOSING THE ECONOMICALLY MOST ADVANTAGEOUS TENDER 117
choice of weights for quality and price interact to determine the
outcome of the tender.
Some formulas could not be tested because they require
information that is particular to the tender. This paper provides
suggestions for the kind of simulations a tendering entity can perform
to study the behaviour of such formulas when such particular
information is known to them. This research should help buyers to
challenge the formula(s) they currently use and/or to discover and
choose a formula that best serves the goals of their organizations.
Lastly, neither the collection of 38 different formulas, nor the
dimensions to evaluate and test EMAT formulas presented in this
paper are likely to be complete. We invite other researchers and
practitioners to add to the pool of formulas as well as to add
evaluative tests and experiments to better understand the behaviour
of various bid evaluation formulas.
NOTES
1. In VBA (Value Based Awarding), the criteria get a monetary value
assigned to them rather than a % weight.
2. In very rare cases, there is only one non-price criterion.
REFERENCES
Aissaoui, N., Haouari, M., & Hassini, E. (2007). “Supplier Selection
and Order Lot Sizing Modeling: A Review.” Computers &
Operations Research, 34 (12): 3516-3540.
Albano, G. L., Dini, F., & Zampino, R. (2008). “Suppliers’ Behavior in
Competitive Tendering: Evidence from the Italian Ministry of
Economy and Finance’s Acquisitions of IT Services.” In
Proceedings of the 3rd International Public Procurement
Conference (pp. 667-705).
Axelsson, B., Rozemeiijer, F., & Wynstra, F. (Eds.) (2005). Developing
Sourcing Capabilities: Creating Strategic Change in Purchasing
and Supply Management. Chichester: Wiley.
Bergman, M. A., & Lundberg, S. (2013). “Tender Evaluation and
Supplier Selection Methods in Public Procurement.” Journal of
Purchasing and Supply Management, 19 (2): 73-83.

118 STILGER, SIDERIUS & VAN RAAIJ
BMI (2012). UfAB V - Unterlage für Ausschreibung und Bewertung
von IT-Leistungen (Ver. 2.0). Bonn, Germany: Beschaffungsamt
des Bundesministeriums des Innern.
Chen, T. H. (2006). “De Economische Dimensie van het Criterium
Economisch Voordeligste Aanbieding.” Tijdschrift Aanbesteding-
srecht, 3: 101-110.
Chen, T. H. (2008). “An Economic Approach to Public Procurement.”
Journal of Public Procurement, 8 (3): 407-430.
De Boer, L., Labro, E., & Morlacchi, P. (2001). “A Review of Methods
Supporting Supplier Selection.” European Journal of Purchasing
and Supply Management, 7 (2): 75-89.
De Boer, L., Linthorst, M. M., Schotanus, F., & Telgen, J. (2006). “An
Analysis of Some Mistakes, Miracles and Myths in Supplier
Selection.” In Proceedings of the 15th IPSERA Conference, San
Diego, CA.
Dimitri, N., Piga, G., & Spagnolo, G. (2006). Handbook of
Procurement. Cambridge, UK: Cambridge University Press.
Dreschler, M. (2009). Fair Competition: How to Apply the
‘Economically Most Advantageous Tender’ (EMAT) Award
Mechanism in the Dutch Construction Industry. (Unpublished
doctoral dissertation). Delft, the Netherlands: Delft University of
Technology.
Kuiper, H. (2009). “De Economisch Meest Voordelige Inschrijving
Gevisualiseerd.” Nederlandse Vereniging Bouw Kostendes-
kundigen, 2: 4-11.
Mateus, R., Ferreira, J. A., & Carreira, J. (2010). “Full Disclosure of
Tender Evaluation Models: Background and Application in
Portuguese Public Procurement.” Journal of Purchasing and
Supply Management, 16 (3): 206-215.
Nielsen, M. (2014). “Legal and Economic Implications of Multi-Criteria
Evaluation Models in Public Tenders.” Paper Presented at the 2nd
European Conference on e-Public Procurement, Lisbon, Portugal.
Pacini, R. (2012). “Pro-Collusion Features of Commonly Used Scoring
Rules in Public Procurement.” In Proceedings of the 5th
International Public Procurement Conference (pp. 2697-2723).

FORMULAS FOR CHOOSING THE ECONOMICALLY MOST ADVANTAGEOUS TENDER 119
Parikka-Alhola, K., Nissinen, A., & Ekroos, A. (2006). “Green Award
Criteria in the Most Economically Advantageous Tender in Public
Purchasing.” In K. V. Thai and G. Piga (Eds.), Advancing Public
Procurement (pp. 257-279). Boca Raton, FL: PrAcademics Press.
Pauw, J. C., & Wolvaardt, J. S. (2009). “Multi-Criteria Decision Analysis
in Public Procurement - A Plan from the South.” Politeia, 28 (1):
66-88.
PSIBouw (2007). Gunnen op Waarde: Hoe Doe Je dat? Praktische
Handreiking voor Bouwopdrachten. Ede, Germany: CROW.
Sciancalepore, F., Falagario, M., Costantino, N., & Pietroforte, R.
(2011). “Multiple-Criteria Bid Evaluation of Public Projects.” Paper
Presented at Conference Management and Innovation for a
Sustainable Built Environment, Amsterdam, the Netherlands.
Smith, P. (2010). “Evaluating Bids and Tenders - The Scoring Trap.”
Danish Purchasing and Logistics Forum, 47: 34-39.
Sykes, M. (2012). “Can the Use of Price versus Non-Price Factors in
the Evaluation of Tenders Undermine the Pursuit of Quality and
Value?” In Proceedings of the 21st IPSERA Annual Conference,
Naples, Italy.
Van Weele, A. J. (2010). Purchasing and Supply Chain Management
(5th ed.). London, UK: Cengage Learning.
Waara, F., & Brochner, J. (2006). “Price and Nonprice Criteria for
Contractor Selection.” Journal of Construction Engineering and
Management, 132 (8): 797-804.
Waters, D. (2002). Operations Management (2nd ed.). Essex, UK:
Pearson Education.
Wu, C., & Barnes, D. (2011). “A Literature Review of Decision-Making
Models and Approaches for Partner Selection in Agile Supply
Chains.” Journal of Purchasing and Supply Management, 17 (4):
256-274.

120 STILGER, SIDERIUS & VAN RAAIJ
APPENDIX A
i - individual bid PAvg - average price of all bids
WQuality - weight of quality WPrice - weight of price
Qi - quality of each individual bid Pi - price of each individual bid
QBest - highest quality of all bids PBest - lowest price of all bids
QRef - reference quality PRef - reference price
QMedian - median quality of all bids PMedian - median price of all bids
QSet Max - highest possible quality PSet Max - upper end of predefined price
range
b - value per quality point, user-
defined parameter
PSet Min - lower end of predefined price
range
n, s, α, β - user-defined
parameters
PMax - highest price of all bids
Note: Some of the formulas are named after an organization, which does
not imply that the organization is still using this particular formula. Some
other formula names refer to the author(s) who have published the formula
in their work. Source for the formula is given in the square brackets.
Formulas
1. Lowest Bid Scoring* [Dimitri, Piga and Spagnolo (2006)]
Qu a lityiice
i
Besti WQW
P
PScore P r
2a. Highest Bid - Lowest Bid Scoring* [Dimitri, Piga and Spagnolo (2006)]
2b. Based on Bid Spread [Waara and Brochner (2006)]
Qual i t yii ce
BestMax
Maxi
i WQWPP
PPScore
Pr
Formula 2b is a variant of 2a leading to exactly the same results in our
analyses. We present both versions to make it as easy as possible for
practitioners to recognize the formula they may be familiar with.
Qual i tyiice
BestMax
iMaxi WQW
PP
PPScore
Pr
FORMULAS FOR CHOOSING THE ECONOMICALLY MOST ADVANTAGEOUS TENDER 121
3. Average Scoring* [Dimitri, Piga and Spagnolo (2006)]
o therwiseWQWPP
PP
PPifWQW
Score
Qu a lityiice
AvgM a x
iM a x
AvgiQu a lityiice
i
P r
P r
4. Based on Average Bid [Waara and Brochner (2006)]
Qu a li tyiice
Avg
ii WQW
P
PScore P r
5. Maximum Price Deviation Model [Waara and Brochner (2006)]
Qu a lityiice
M a x
i
i WQWP
PScore
P r1
6. Utility Index [Negometrix, personal communication]
i
Best
ice
Quality
iBest
iP
PW
WQQ
U
Pr
1
;
N
iNii
UU
UUUPScore
,,max
,,max
1
1
7. Coventry City Council [Coventry City Council, URL no longer available]
Qu a lity
Best
i
ice
i
Best
i WQ
QW
P
PScore P r
8. European Organization for Nuclear Research (CERN) [CERN Engineering
Department, URL no longer available]
Qual i t yi
Best
ii cei WQ
P
PWScore
15.0Pr
9. Domb & Tsur [Uria Domb and Ofer Tsur, personal communication]
i
ice
Quality
WorstiWorst
iP
W
WQQQ
Score Pr

122 STILGER, SIDERIUS & VAN RAAIJ
10. Mercer [Negometrix, personal communication]
o therwiseWQ
P
PPifWQW
P
PP
Score
Qu a lityi
Best
Besti
Qu a lityiice
Best
Besti
i
1 1 P r
11. Scottish Government [Scottish Government]
Qual i t yiice
Avg
Avgi
i WQWP
PPScore
Pr5.0
12. Waterschap Brabantse Delta [Negometrix, personal communication]
Qu a lityiice
Best
Bestii WQW
P
PPScore
P r1
If the price difference between the lowest bid and the 2nd lowest bid is
greater than 20%, then the 2nd lowest bid gets 80% of price points of the
lowest bid and the score of consecutive bids is calculated according to the
formula below.
Qual i t yii ce
Bestnd
Bestndii WQW
P
PPScore
Pr
2
21
13. Score by Rank* [Smith (2010)]
Qual i t yii cei WQWpScore Pr
p is the score on price. The highest price bid earns 0 and the lowest priced
bid 1 point on the price score. All other price scores are placed at equal
increments between 0 and 1 according to their ranking on price.
14. Chen 2* [Chen (2008)]
Qu a lityiice
Best
ii WQW
P
PScore
P r5.01
15. Chen 3* [Chen (2008)]
Qualityiice
Best
i
i WQWP
P
Score
Pr2log
log
5.01

FORMULAS FOR CHOOSING THE ECONOMICALLY MOST ADVANTAGEOUS TENDER 123
16. Chen 4* [Negometrix, personal communication]
Pr Pr
log
1 0.5 . 0log 2
i
Best
ice i Quality ice
i
i Quality
P
PW QW if W
Score
QW otherwise
Formula 16 is a general case of formula 15.
17. UfAB II-Formel [BMI (2012)]
Qual i tyiice
i
BestBesti WQW
P
PQScore Pr
18. UfAB Medianmethode [BMI (2012)]
ice
Median
iQual i ty
Median
ii W
P
PW
Q
QScore Pr
19. Pauw & Wolvaardt* [Pauw and Wolvaardt (2009)]
Qual i t yii ce
AvgMax
iMaxi WQW
PP
PPScore
Pr
20. Based on the Average Price* [PSIBouw (2007)]
Qu a lityiice
Avg
Bestii WQW
P
PPScore
P r1
21. Based on the Lowest Price* [PSIBouw (2007)]
Quali tyiice
Best
iBesti WQW
P
PPScore
Pr
2
22. Quotient Verdeling 1 [Negometrix, personal communication]
Quali ty
Best
iice
Avg
BestiAvg
i WQ
QW
P
PPPScore
Pr
23. Quotient Verdeling 2 [Negometrix, personal communication]
Quality
Best
iice
Best
iBesti W
Q
QW
P
PPScore
Pr
2
24. Quotient Verdeling 3 [Negometrix, personal communication]
Quality
Best
i
ice
BestMax
iMax
i WQ
QW
PP
PPScore
Pr
124 STILGER, SIDERIUS & VAN RAAIJ
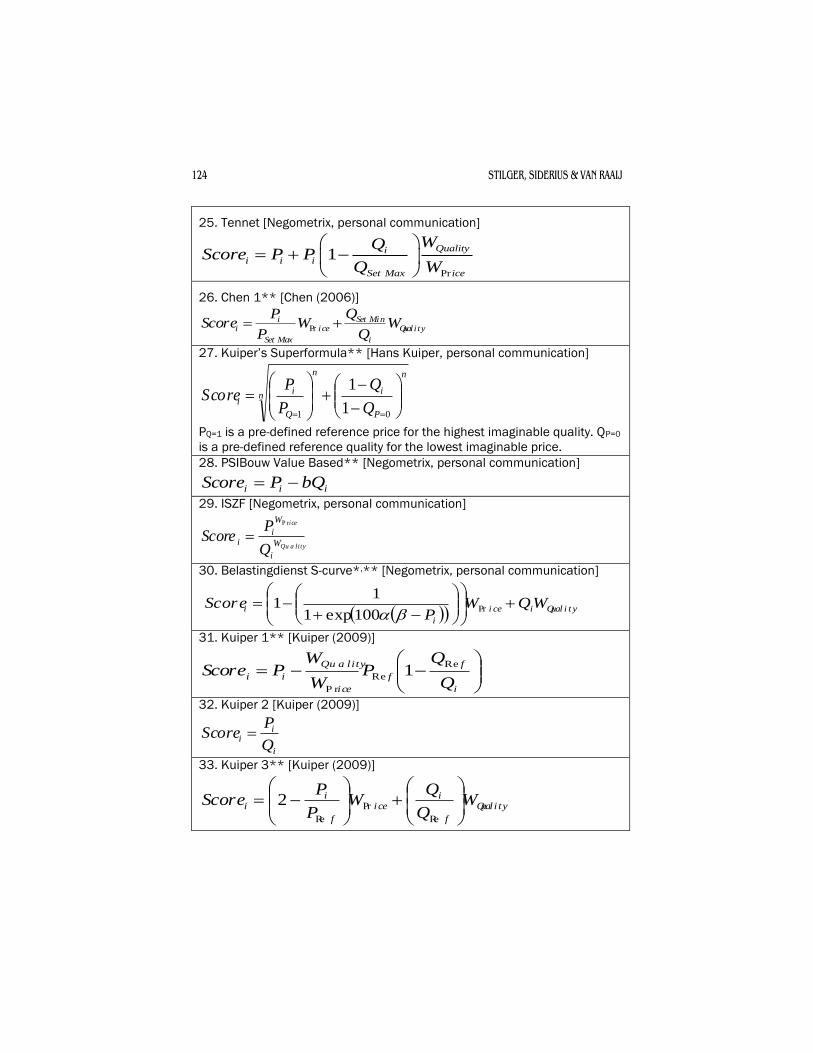
25. Tennet [Negometrix, personal communication]
Pr
1Qualityi
i i i
Set Max ice
WQScore P P
Q W
26. Chen 1** [Chen (2006)]
Quali ty
i
MinSetice
MaxSet
ii W
Q
QW
P
PScore
Pr
27. Kuiper’s Superformula** [Hans Kuiper, personal communication]
n
n
P
i
n
Q
ii
Q
Q
P
PScore
01 1
1
PQ=1 is a pre-defined reference price for the highest imaginable quality. QP=0
is a pre-defined reference quality for the lowest imaginable price.
28. PSIBouw Value Based** [Negometrix, personal communication]
iii bQPScore
29. ISZF [Negometrix, personal communication]
Qu a li ty
ice
W
i
W
ii
Q
PScore
P r
30. Belastingdienst S-curve*,** [Negometrix, personal communication]
Qual i t yii ce
i
i WQWP
Score
Pr
100exp1
11
31. Kuiper 1** [Kuiper (2009)]
i
f
f
ice
Qu a lity
iiQ
QP
W
WPScore
Re
Re
P r
1
32. Kuiper 2 [Kuiper (2009)]
i
ii
Q
PScore
33. Kuiper 3** [Kuiper (2009)]
Qual i ty
f
ii ce
f
ii W
Q
QW
P
PScore
Re
Pr
Re
2
FORMULAS FOR CHOOSING THE ECONOMICALLY MOST ADVANTAGEOUS TENDER 125
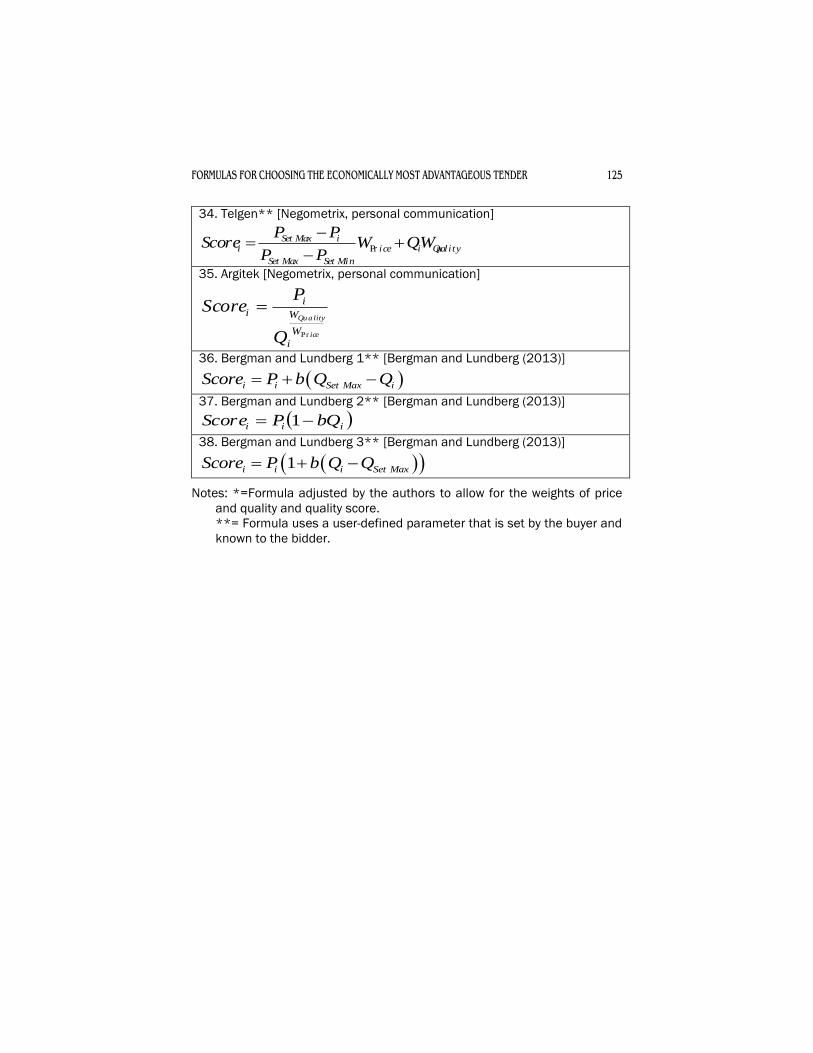
34. Telgen** [Negometrix, personal communication]
Qualityiice
MinSetMaxSet
iMaxSeti WQW
PP
PPScore
Pr
35. Argitek [Negometrix, personal communication]
ice
Qua lity
W
W
i
ii
Q
PScore
Pr
36. Bergman and Lundberg 1** [Bergman and Lundberg (2013)]
i i Set Max iScore P b Q Q
37. Bergman and Lundberg 2** [Bergman and Lundberg (2013)]
iii bQPScore 1
38. Bergman and Lundberg 3** [Bergman and Lundberg (2013)]
1i i i Set MaxScore P b Q Q
Notes: *=Formula adjusted by the authors to allow for the weights of price
and quality and quality score.
**= Formula uses a user-defined parameter that is set by the buyer and
known to the bidder.


![Comparative Study of Ship Resistance between Model Test ... · In their approach to establishing their formulas, Holtrop and Mennen [2,3] assumed that the non-dimensional coefficient](https://img.dokumen.tips/doc/110x75/5e0ab38e13ae20423d428ead/comparative-study-of-ship-resistance-between-model-test-in-their-approach-to.jpg)