Embed Size (px)
Citation preview
International Research Journal of Engineering and Technology (IRJET) e-ISSN: 2395 -0056
Volume: 03 Issue: 05 | May-2016 www.irjet.net p-ISSN: 2395-0072
© 2016, IRJET ISO 9001:2008 Certified Journal Page 1
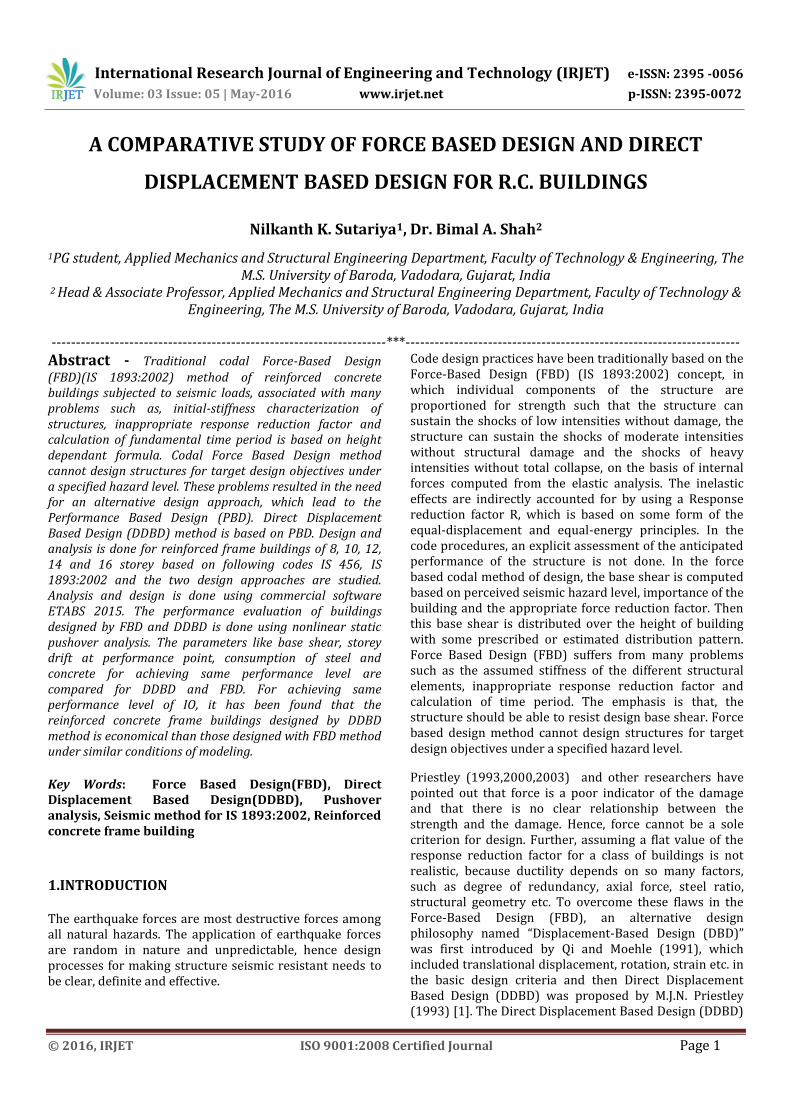
A COMPARATIVE STUDY OF FORCE BASED DESIGN AND DIRECT
DISPLACEMENT BASED DESIGN FOR R.C. BUILDINGS
Nilkanth K. Sutariya1, Dr. Bimal A. Shah2
1PG student, Applied Mechanics and Structural Engineering Department, Faculty of Technology & Engineering, The M.S. University of Baroda, Vadodara, Gujarat, India
2 Head & Associate Professor, Applied Mechanics and Structural Engineering Department, Faculty of Technology & Engineering, The M.S. University of Baroda, Vadodara, Gujarat, India
---------------------------------------------------------------------***---------------------------------------------------------------------
Abstract - Traditional codal Force-Based Design (FBD)(IS 1893:2002) method of reinforced concrete buildings subjected to seismic loads, associated with many problems such as, initial-stiffness characterization of structures, inappropriate response reduction factor and calculation of fundamental time period is based on height dependant formula. Codal Force Based Design method cannot design structures for target design objectives under a specified hazard level. These problems resulted in the need for an alternative design approach, which lead to the Performance Based Design (PBD). Direct Displacement Based Design (DDBD) method is based on PBD. Design and analysis is done for reinforced frame buildings of 8, 10, 12, 14 and 16 storey based on following codes IS 456, IS 1893:2002 and the two design approaches are studied. Analysis and design is done using commercial software ETABS 2015. The performance evaluation of buildings designed by FBD and DDBD is done using nonlinear static pushover analysis. The parameters like base shear, storey drift at performance point, consumption of steel and concrete for achieving same performance level are compared for DDBD and FBD. For achieving same performance level of IO, it has been found that the reinforced concrete frame buildings designed by DDBD method is economical than those designed with FBD method under similar conditions of modeling.
Key Words: Force Based Design(FBD), Direct Displacement Based Design(DDBD), Pushover analysis, Seismic method for IS 1893:2002, Reinforced concrete frame building
1.INTRODUCTION The earthquake forces are most destructive forces among all natural hazards. The application of earthquake forces are random in nature and unpredictable, hence design processes for making structure seismic resistant needs to be clear, definite and effective.
Code design practices have been traditionally based on the Force-Based Design (FBD) (IS 1893:2002) concept, in which individual components of the structure are proportioned for strength such that the structure can sustain the shocks of low intensities without damage, the structure can sustain the shocks of moderate intensities without structural damage and the shocks of heavy intensities without total collapse, on the basis of internal forces computed from the elastic analysis. The inelastic effects are indirectly accounted for by using a Response reduction factor R, which is based on some form of the equal-displacement and equal-energy principles. In the code procedures, an explicit assessment of the anticipated performance of the structure is not done. In the force based codal method of design, the base shear is computed based on perceived seismic hazard level, importance of the building and the appropriate force reduction factor. Then this base shear is distributed over the height of building with some prescribed or estimated distribution pattern. Force Based Design (FBD) suffers from many problems such as the assumed stiffness of the different structural elements, inappropriate response reduction factor and calculation of time period. The emphasis is that, the structure should be able to resist design base shear. Force based design method cannot design structures for target design objectives under a specified hazard level.
Priestley (1993,2000,2003) and other researchers have pointed out that force is a poor indicator of the damage and that there is no clear relationship between the strength and the damage. Hence, force cannot be a sole criterion for design. Further, assuming a flat value of the response reduction factor for a class of buildings is not realistic, because ductility depends on so many factors, such as degree of redundancy, axial force, steel ratio, structural geometry etc. To overcome these flaws in the Force-Based Design (FBD), an alternative design philosophy named “Displacement-Based Design (DBD)” was first introduced by Qi and Moehle (1991), which included translational displacement, rotation, strain etc. in the basic design criteria and then Direct Displacement Based Design (DDBD) was proposed by M.J.N. Priestley (1993) [1]. The Direct Displacement Based Design (DDBD)

International Research Journal of Engineering and Technology (IRJET) e-ISSN: 2395 -0056
Volume: 03 Issue: 05 | May-2016 www.irjet.net p-ISSN: 2395-0072
© 2016, IRJET ISO 9001:2008 Certified Journal Page 2
is based on Performance Based Design (PBD). This philosophy is a very promising design tool that enables a designer to design a structure with predictable performance.
2. DIRECT DISPLACEMENT BASED DESIGN
In the DDBD, the multi degree of freedom structure is converted into equivalent single degree of freedom system. For multi-degree-of-freedom (MDOF) structures the initial part of the design process requires the determination of the characteristics of the equivalent SDOF substitute structure which is shown in fig-1. The required
characteristics are Equivalent mass (me), Design
displacement (d), and Effective damping (eq). When these have been determined, then design base shear of the substitute structure can be determined. The base shear is then distributed between the mass elements of the real structure as inertia forces, and the structure is analyzed under these forces to determine the design moments at locations of potential plastic hinges.
According to Priestley and Pettinga (2005), a full description of the steps needed for applying the DDBD method in the design of reinforced concrete moment resisting frame buildings [1] follows:
Step1: Determine design displacement profile (i)
The assumed design displacement profile, corresponding to the normalized inelastic mode shape δi at the design drift limit 𝞱d where i = 1 to n storeys, is established using the structural and non-structural deformation limits.
∆i = δi (∆𝒄
𝜹𝒄)𝝎θ ….(1)
Where the normalized inelastic mode shape δi depends on the height (Hi) and roof height (Hn) according to the following relationships:
for n ≤ 4 : δi = 𝐻𝑖
𝐻𝑛 ….(2a)
for n >4 : δi = 4
3(
𝐻𝑖
𝐻𝑛) (1 −
𝐻𝑖
4𝐻𝑛) ….(2b)
This normalised inelastic mode shape implies that maximum drift occurs between ground and first floor. So first storey is the critical storey.
𝝎θ = 1.15-0.0034Hn≤ 1.0 (Hn in m) = Drift reduction factor for controlling higher mode effect.
δi = Normalised inelastic mode shape at mass i
δc = value of normalised inelastic mode shape at critical mass
c = Displacement of critical storey = 𝞱d * Hc
𝞱d = Design drift limit
Hc = Height of critical or bottom storey = H1
Hi = Height of ith storey from base
Hn = Height of nthstorey or Top storey height
Step2: Calculate design displacement (d):
∆d = ∑ (𝑚𝑖∆𝑖
2)𝑛𝑖=1
∑ (𝑚𝑖∆𝑖)𝑛𝑖=1
….(3)
Where ,mi =Mass of ith floor in kg , ∆i =Displacement of ith floor.
Step3: Calculate effective height (e):
He = ∑ (𝑚𝑖∆𝑖𝐻𝑖)𝑛
𝑖=1
∑ (𝑚𝑖∆𝑖)𝑛𝑖=1
….(4)
Step4: Calculate yield displacement (y):
∆y= θy * He ….(5)
Where, θy = Yeild drift For reinforced concrete frame structure,
θy = 0.5 * ɛy * 𝐿𝑏
ℎ𝑐 ….(6)
Where, Lb is the beam span and hc is the concrete beam depth.
Step5: Calculate design ductility (µ) and equivalent
viscous damping (eq):
μ = ∆𝑑
∆𝑦 ….(7)
Fig-1: Representation of substitute structure for MDOF structure and the force displacement relation up to failure.

International Research Journal of Engineering and Technology (IRJET) e-ISSN: 2395 -0056
Volume: 03 Issue: 05 | May-2016 www.irjet.net p-ISSN: 2395-0072
© 2016, IRJET ISO 9001:2008 Certified Journal Page 3
equi = 0.05 +0.565 * 𝜇−1
𝜇𝜋 ….(8)
Step6: Determine effective time period (Te) of
substitute structure:
It is the effective time period of the equivalent SDOF system and it is obtained from displacement spectra
corresponding to the curve for equivalent damping (eq)
and the value of design displacement (d) for IS 1893:2002 [2] as shown in chart-1. From consideration of the mass participating in the first inelastic mode of vibration, the effective system mass for the substitute structure is,
me = ∑ (𝑚𝑖∆𝑖)𝑛
𝑖=1
∆𝑑 ….(9)
Ke = 4𝜋2𝑚𝑒
𝑇𝑒2 ….(10)
Step7: Consideration of P-∆ effect: P-∆effect is considered as per Pettinga and Preistley,
(2007) where stability ratio (θP∆), post yield stability ratio
unaffected (ro=0.01, assumed) and affected (rp) by P-∆
effect and overall moment (MB) are given by following equations,
θP∆ = 𝑃∆
𝑉𝐵𝐻𝑒 ….(11a)
rP = 𝑟0−𝜃𝑃∆
1−𝜃𝑃∆ ….(11b)
MB = Ke * ∆d * He + rp[2(1−𝜇)
1−𝑟𝑝(𝜇−1)]P∆d ….(11c)
Step9: Calculation of design base shear (Vb):
Vb = 𝑀𝐵
𝐻𝑒 ….(12)
Step10: Distribution of base shear force to floor levels: The base shear force is distributed to the floor levels in proportion to the product of mass and displacements,
Fi = Ft + 0.9 * Vb*𝑚𝑖∆𝑖
∑ 𝑚𝑖∆𝑖 ….(13)
Where, Here Vb= Design base shear, Ft = 0.1 Vb at roof level
and Ft = 0 at all other floors. Step11: Calculate the straining actions:
Using any Finite element software same as ETABS 2015, the building can be modeled then the forces are assigned at each floor level. Finally the corresponding straining actions and design moments at plastic hinge regions can be calculated.
3. NUMERICAL ANALYSIS For comparison between the two design method (FBD and DDBD), typical plan as shown in fig-2 is considered. The height of buildings are considered as 8, 10, 12, 14 and 16 –storey having typical storey height 3 m in each building model.
Fig-2: Typical plan view of all building models
Chart-1: IS-Displacement spectra for zone-V, medium type soil and DBE.
0
0.2
0.4
0.6
0.8
1
1.2
0 1 2 3 4 5 6 7 8 9
Sp
ect
ral
dis
pla
cem
en
t (m
)
Time period (sec)
Spectral displacement vs time period(IS 1893:2002)
5 % Damping 10 % Damping 15 % Damping 20 % Damping

International Research Journal of Engineering and Technology (IRJET) e-ISSN: 2395 -0056
Volume: 03 Issue: 05 | May-2016 www.irjet.net p-ISSN: 2395-0072
© 2016, IRJET ISO 9001:2008 Certified Journal Page 4
The nomenclature of the all building models and target performance level has been listed in Table-1.
Table-1: Nomenclature of all building models
Building
nomenclature Design Method
Performance
level
ISLS-8,
ISLS-10,
ISLS-12
IS-1893 (FBD)
(Linear static
method)
IO
ISRS-14,
ISRS-16
IS-1893 (FBD)
(Response
spectrum
method)
IO
DDBD-8,
DDBD-10,
DDBD-12,
DDBD-14,
DDBD-16
Direct
Displacement
Based Design
method (DDBD)
IO
Where,
ISLS-8 = ISLS means building design by Linear Static method of Indian Standard 1893:2002, and numerical figure shows the total number of storey in building like here it is 8 then it shows the building has 8-storey.
ISRS-14 = ISRS means building design by Response Spectrum method of Indian Standard 1893:2002, and numerical figure shows the total number of storey in building like here it is 14 then it shows the building has 14-storey.
DDBD-10 = DDBD means building design by Direct Displacement Based Design method and numerical figure shows the total number of storey in building like here it is 10 then it shows the building has 10-storey.
IO = Immediate Occupancy performance level
3.1 Loading data:
Following table-2 shows the loading which considered for analysis of all building models of both design method (FBD and DDBD):
Table -2: Loading data
(1) Dead load
Typical floor level
At terrace level
Floor finish 2 kN/m2 1.5 kN/m2
Wall load 13 kN/m on
all beam 6 kN/m on peripheral
beam
(2) Live load = 2 kN/m2 on all floor
(3) Earthquake
load
As per Is 1893:2002 [2] Considering, Zone Z = V,
Type of Soil = Medium Soil, Importance Factor I = 1 And Response Reduction Factor
R = 5.
3.2 Member size of building: Following table-3 shows the section size of member for all building models. Table-3: Member size of the all building models ISLS-8 DDBD-8
Width (mm)
Depth (mm)
Width (mm)
Depth (mm)
Beam size in X direction 300 600 300 500 Beam size in Y direction 300 650 300 600
column size
In 4 to 8 storey 600 600 400 400 In 1 to 3 storey 650 650 450 450
ISLS-10 DDBD-10
Beam size in X direction 300 700 300 500 Beam size in Y direction 300 700 300 600
column size
In 4 to 10 storey 600 600 450 450 In 1 to 3 storey 700 700 550 550
ISLS-12 DDBD-12 Beam size in X direction 300 700 300 500 Beam size in Y direction 300 750 300 600
column size
In 9 to 12 storey 550 550 450 450 In 6 to 8 storey 650 650 450 450
In storey 5 650 650 550 550 In 1 to 4 storey 750 750 550 550
ISRS-14 DDBD-14 Beam size in X direction 300 750 300 550 Beam size in Y direction 300 750 300 650
column size
In 10 to 14 storey
550 550 450 450
In 5 to 9 storey 650 650 500 500 In 1 to 4 storey 750 750 600 600
ISRS-16 DDBD-16 Beam size in X direction 300 750 300 550 Beam size in Y direction 300 750 300 650
column size
In 11 to 16 storey
550 550 450 450
In 5 to 10 storey 650 650 500 500 In 3 to 4 storey 700 700 600 600 In 1 to 2 storey 800 800 600 600

International Research Journal of Engineering and Technology (IRJET) e-ISSN: 2395 -0056
Volume: 03 Issue: 05 | May-2016 www.irjet.net p-ISSN: 2395-0072
© 2016, IRJET ISO 9001:2008 Certified Journal Page 5
3.3. Parameters for pushover analysis:
For an evaluation of seismic performance, the
mathematical models developed are subjected to push
over analysis as per FEMA-440 [3] provisions using ETABS
2015 software. Default Plastic hinges of four types are
available in the software. Out of them, P-M-M types of
hinges are defined based on FEMA-356 [4] for all column
elements. For all beam elements, flexural plastic hinges M3
are defined based on FEMA-356 [4].The members of the
frame are designed for standard load of combination as
specified in IS 456:2000 [5] and IS 1893:2002 [2] for all
FBD building models. In DDBD, Expected material strength
used in design stage and Load combinations is used as, (1)
DL + IL (2) DL + IL ± EL (3) DL ± EL and hinge locations
[6] of user defined hinge is considered as per fig-3 and
following equations:
Fig-3: Hinge locations at ends of beam and column [6]
l1 = 0.5* LP ….(14a) l2 = Hbeam- 0.5* LP ….(14b) l3 = 0.5 * Hcolumn- 0.5* LP ….(14c)
Where, Lp = It is Plastic hinge length = 0.5*H (Park and Paulay [7]) H = Section depth
Hbeam = Depth of beam
Hcolumn = Depth of column l1 = It is plastic hinge location at i end of column l2 = It is plastic hinge location at j end of column l3 = It is plastic hinge location at i and j end of beam Typical drift value for various performance levels are given in following table-4 as per FEMA 356: Table -4: Drift value for various performance level
Performance level Drift value
Immediate occupancy (IO) 1 %
Life safety (LS) 2 %
Collapse prevention 4 %
4. ANALYTICAL RESULTS
Analysis and design results of all building models for both methods (FBD and DDBD) are discussed and to compare both methods in such type of parameters like, Base shear, Storey drift and Consumption of steel and concrete at performance point. 4.1 Comparison between base shear calculated by FBD and DDBD method: The base shear calculated for all FBD building models by FBD method according to IS 1893:2002 is compared with base shear calculated using DDBD method as described in section 2 for all DDBD building models.
Table-5: Calculated base shear
Building By FBD
(kN)
By DDBD (kN)
Storey-8 3970 2695
Storey-10 4604 2762
Storey-12 4693 3062
Storey-14 4624 3386
Storey-16 4739 3858
Chart-2: Comparison between base shear calculated by FBD and DDBD method Table-5 shows the total base shear for FBD and DDBD building models. It is observed that total base shear calculated by DDBD method is 26.7%, 34.3%, 28.7%, 26.8% and 18.6% less for 8, 10, 12, 14 and 16–storey respectively compared to FBD building models.
4.2 Seismic performance of all FBD and DDBD building models: All FBD and DDBD building models of 8,10,12,14 and 16 storey building are analysed and design in ETABS 2015 and then seismic performance evaluated of all building model by nonlinear static pushover analysis in ETABS 2015. For demand curve we have considered Response spectrum of IS 1893:2002 for medium soil, zone V and Design Basis Earthquake (DBE). Following table 6 shows the seismic performance of all building models.
3970
4604 4693 4624 4739
2695 27623062
33863858
0
1000
2000
3000
4000
5000
STOREY-8 STOREY-10 STOREY-12 STOREY-14 STOREY-16
Ba
se s
he
ar
in k
N
Comparison between base shear calculated by FBD and DDBD method
FBD building model DDBD building model

International Research Journal of Engineering and Technology (IRJET) e-ISSN: 2395 -0056
Volume: 03 Issue: 05 | May-2016 www.irjet.net p-ISSN: 2395-0072
© 2016, IRJET ISO 9001:2008 Certified Journal Page 6
Table-6: Pushover results of all building models at performance point
Building model Applied base shear V (kN)
Base shear at performance
point (kN)
Displacement (mm)
Effective Damping (%)
No. of Hinges in IO
level
Direction X Y X Y X Y X Y X Y
ISLS-8 3970 3970 7097 7186 91.6 92.2 5.02 5.05 94 77
DDBD-8 2695 2695 2540 2768 121.2 108.5 6.77 6.52 208 183
ISLS-10 4604 4368 8386 7797 100.2 108.6 5.01 5.01 120 60
DDBD-10 2762 2762 2597 2823 137.3 121.7 6.99 7.11 266 231
ISLS-12 4693 4452 8648 8371 122.8 122 5.13 5.03 144 168
DDBD-12 3062 3062 2790 2983 167.5 146.7 6.44 6.64 286 275
ISRS-14 4624 4386 7353 7055 128.2 138.6 5.28 5.22 228 196
DDBD-14 3386 3400 3033 3232 175.8 157.9 6.62 6.7 296 302
ISRS-16 4739 4514 7085 6845 140.8 154.3 5.27 5.25 256 239
DDBD-16 3858 3921 3390 3601 200.1 179.9 6.09 6.19 302 301
From table-6, the following points can be concluded:
1. It is observed that effective damping of all FBD building models is nearer to 5% in both directions so its performance is close to yield point it means that extra capacity is available in non-linear region. Hence, FBD method gives conservative design.
2. It is observed that base shear at performance point is more in FBD building models than in DDBD building models. It may be noted that FBD building models are designed with partial load factor and material safety factor so that actual steel is provided for higher force. DDBD is a kind of performance based design hence, DDBD building models are designed without load factor and material safety factor so that its base shear less than in FBD building models at performance point.
3. It is observed that all hinges remain in IO state for both FBD and DDBD building models.
4. As the number of storey increases, the difference in number of hinges formed in FBD and DDBD models at performance point decreases. It means that DDBD method converges to FBD method for higher storey buildings.
4.3 Comparison of consumption of steel and concrete between all FBD and DDBD building models: A comparison of consumption of steel and concrete between all FBD and DDBD building models at performance point is done.
Following table-7 shows the comparison of consumption of steel and concrete in FBD and DDBD building models:
Table-7: Comparison of consumption of steel and concrete in FBD and DDBD building models
Building model
Steel consumption in
tonne
Difference in % 0f
consumption of steel
Concrete consumption
in m3
Difference in % 0f
consumption of concrete
Achieved performance
level
ISLS-8 57.48 54.2
439.65 34.4
IO
DDBD-8 26.31 288.45 IO
ISLS-10 76.8 54.7
596.4 29.3
IO
DDBD-10 34.82 421.5 IO
ISLS-12 89.95 49.5
753.6 31.8
IO
DDBD-12 45.42 514.2 IO
ISRS-14 100.96 42.7
888 26.5
IO
DDBD-14 57.87 652.65 IO
ISRS-16 114.25 36.9
1008.6 26.5
IO
DDBD-16 72.09 741.3 IO
Following points are observed from table 7:
International Research Journal of Engineering and Technology (IRJET) e-ISSN: 2395 -0056
Volume: 03 Issue: 05 | May-2016 www.irjet.net p-ISSN: 2395-0072
© 2016, IRJET ISO 9001:2008 Certified Journal Page 7
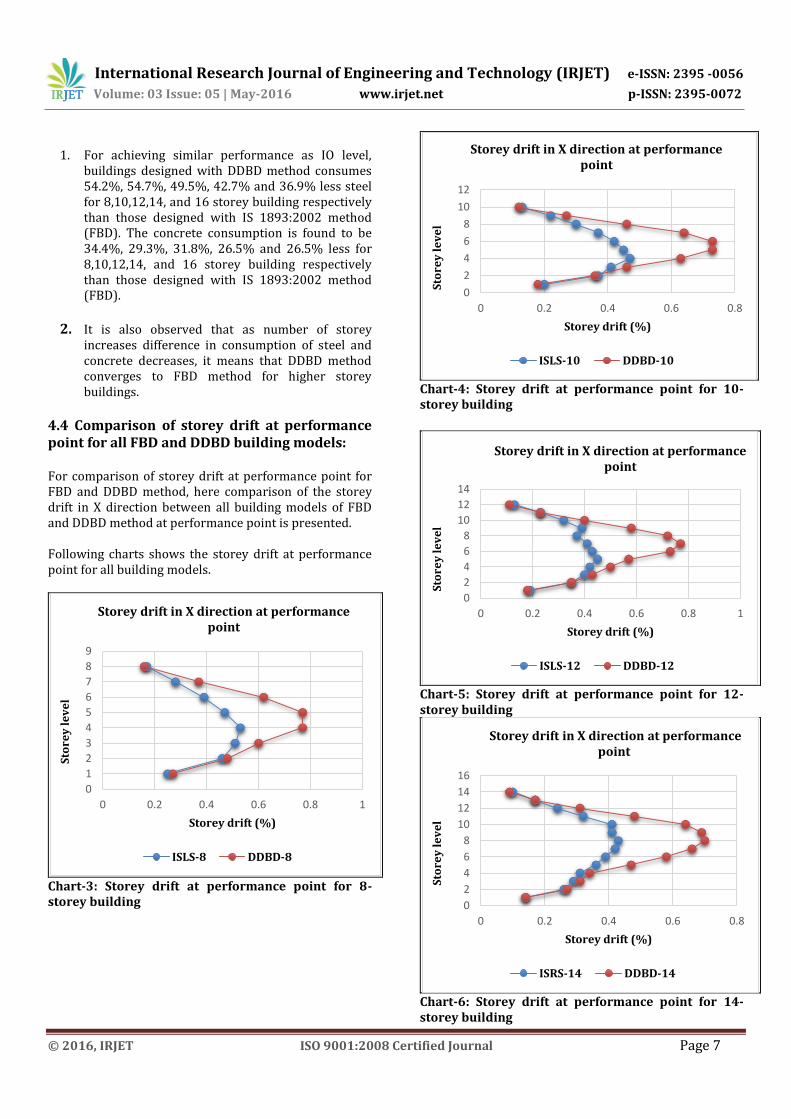
1. For achieving similar performance as IO level,
buildings designed with DDBD method consumes 54.2%, 54.7%, 49.5%, 42.7% and 36.9% less steel for 8,10,12,14, and 16 storey building respectively than those designed with IS 1893:2002 method (FBD). The concrete consumption is found to be 34.4%, 29.3%, 31.8%, 26.5% and 26.5% less for 8,10,12,14, and 16 storey building respectively than those designed with IS 1893:2002 method (FBD).
2. It is also observed that as number of storey
increases difference in consumption of steel and concrete decreases, it means that DDBD method converges to FBD method for higher storey buildings.
4.4 Comparison of storey drift at performance point for all FBD and DDBD building models: For comparison of storey drift at performance point for FBD and DDBD method, here comparison of the storey drift in X direction between all building models of FBD and DDBD method at performance point is presented. Following charts shows the storey drift at performance point for all building models.
Chart-3: Storey drift at performance point for 8-storey building
Chart-4: Storey drift at performance point for 10-storey building
Chart-5: Storey drift at performance point for 12-storey building
Chart-6: Storey drift at performance point for 14-storey building
0
1
2
3
4
5
6
7
8
9
0 0.2 0.4 0.6 0.8 1
Sto
rey
le
ve
l
Storey drift (%)
Storey drift in X direction at performance point
ISLS-8 DDBD-8
0
2
4
6
8
10
12
0 0.2 0.4 0.6 0.8
Sto
rey
le
ve
l
Storey drift (%)
Storey drift in X direction at performance point
ISLS-10 DDBD-10
0
2
4
6
8
10
12
14
0 0.2 0.4 0.6 0.8 1
Sto
rey
le
ve
l
Storey drift (%)
Storey drift in X direction at performance point
ISLS-12 DDBD-12
0
2
4
6
8
10
12
14
16
0 0.2 0.4 0.6 0.8
Sto
rey
le
ve
l
Storey drift (%)
Storey drift in X direction at performance point
ISRS-14 DDBD-14

International Research Journal of Engineering and Technology (IRJET) e-ISSN: 2395 -0056
Volume: 03 Issue: 05 | May-2016 www.irjet.net p-ISSN: 2395-0072
© 2016, IRJET ISO 9001:2008 Certified Journal Page 8
Chart-7: Storey drift at performance point for 16-storey building
Chart-8: Maximum storey drift at performance point between FBD and DDBD building models
From chart-3 to 8, following points can be concluded:
1 Charts-3, 4, 5, 6 and 7 shows that storey drift increases up to 4th storey in ISLS-8 and DDBD-8, 5th storey in ISLS-10 and DDBD-10, 6th storey in ISLS-12 and 7th storey in DDBD-12, 8th storey in ISRS-14 and DDBD-14, 8th storey in ISRS-16 and 9th storey in DDBD-16 and then decreases as number of storey increases, thus maximum storey drift occurs at mid height of the building.
2 From chart-8, the maximum storey drift values for FBD is lesser than that of the DDBD comparing on
their respective storey. This decrease in drift indicates that the FBD structure is more rigid as compared to DDBD structures. For DDBD building models the maximum storey drift at performance point is less than 1% which is well within permissible values.
5. CONCLUSION By comparing various parameters like base shear, storey drift, consumption of steel and concrete at performance point, for all FBD and DDBD building models following conclusions can be drawn: Direct Displacement Based Design gives lower base
shear than Force based method (IS 1893:2002). Base shear obtained by DDBD is 26.7%, 34.3%, 28.7%, 26.8% and 18.6% less for 8, 10, 12, 14 and 16–storey respectively compared to Force Based Method (IS 1893:2002). These results shows that Force based method (IS 1893:2002) is conservative in designing medium rise buildings.
It is observed that as number of storey increases, difference in base shear obtained by FBD and DDBD method decreases. It means that DDBD method converges to FBD method as number of storey increases.
For achieving same performance level, reduction in section size as well as percentage reinforcement in Direct Displacement Based Design is observed. It can be concluded that buildings, designed with Direct Displacement Based Design are economical than those designed with the Force Based Design method (IS 1893:2002).
Non-linear static push-over analysis is carried out
for evaluation of both methods. The performance of all the frames designed by Direct Displacement Based Design and Force Based Design method are satisfactory.
REFERENCES [1] M.J.N. Preistley, G.M. Calvi, M.J. Kowalsky,
“Displacement Based Seismic Design of Structures”, IUSS Press, Pavia, Italy
[2] IS-1893(Part 1):2002. “Criteria for Earthquake Resistant Design of Structures, Part-I, General Provisions and Buildings”, BIS, New Delhi.
[3] FEMA-440 (June 2005), “Improvement of Nonlinear Static Seismic Analysis Procedures”, Department of Homeland Security, Federal Emergency Management Agency, Washington, D.C.
0
2
4
6
8
10
12
14
16
18
0 0.2 0.4 0.6 0.8
Sto
rey
le
ve
l
Storey drift (%)
Comparison of Storey drift in X direction at performance point
ISRS-16 DDBD-16
0.530.47 0.45 0.43 0.43
0.770.73
0.770.7 0.68
STOREY-8 STOREY-10 STOREY-12 STOREY-14 STOREY-16
Sto
rey
dri
ft i
n (
%)
Maximum storey drift in X ditection at performance point
FBD building model DDBD building model

International Research Journal of Engineering and Technology (IRJET) e-ISSN: 2395 -0056
Volume: 03 Issue: 05 | May-2016 www.irjet.net p-ISSN: 2395-0072
© 2016, IRJET ISO 9001:2008 Certified Journal Page 9
[4] FEMA-356 (November-2000), “Pre-standard and Commentary for the Seismic Rehabilitation of Buildings”, Federal Emergency Management Agency, Washington, D.C.
[5] IS 456:2000 “Plain and Reinforced Concrete Code of Practice”, BIS, New Delhi.
[6] Mehmet Inel, Hayri Baytan Ozmen, “Effects of plastic hinge properties in nonlinear analysis of reinforced concrete buildings”, Engineering Structures (ELSEVIER) 28 (2006), P. 1494-1502.
[7] Park R, Pauly T. Reinforced concrete structures. New York: John Wiley & Sons; 1975.769 pages.
[8] B. Massena, R. Bento, H. Degee, “Direct Displacement Based Design of a RC Frame – Case of Study” (2010), ISSN: 0871-7869, Relatorio ICIST.
[9] Applied Technology Council (ATC) 1996, Seismic Evaluation and Retrofit of Concrete Buildings, ATC-40, Volume 1, Report no. SSC 96-01, Seismic Safety Commission, Redwood City California.
[10] Kadid, A. Boumrkik, “Pushover Analysis of Reinforced Concrete Frame Structures” (2008), Asian Journal Of Civil Engineering (Building And Housing) Vol. 9, No. 1
[11] The Pushover Analysis, explained in its Simplicity”, Rahul Leslie, Assistant Director, Building Design, DRIQ Board, Kerala PWD, Trivandrum.
BIOGRAPHIES
Nilkanth K. Sutariya, Post graduate student, Applied Mechanics and Structural Engineering Department, Faculty of Technology & Engineering, The Maharaja
Sayajirao University of
Baroda, Vadodara 390001,
Gujarat, India.
Dr. Bimal A. Shah, Head and
Associate Professor, Applied
Mechanics and Structural
Engineering Department,
Faculty of Technology and
Engineering, The Maharaja
Sayajirao University of
Baroda, Vadodara 390001,
Gujarat, India.