Embed Size (px)
Citation preview
Expert Systems with Applications 40 (2013) 3722–3737
Contents lists available at SciVerse ScienceDirect
Expert Systems with Applications
journal homepage: www.elsevier .com/locate /eswa
A comparative study of dimensionality reduction techniques to enhance traceclustering performances
M. Song a,⇑, H. Yang a, S.H. Siadat a, M. Pechenizkiy b
a School of Technology Management, Ulsan National Institute of Science and Technology, UNIST-GIL 50, 689-798 Ulsan, South Koreab Department of Computer Science, Eindhoven University of Technology, Den Dolech 2, 5612 AZ Eindhoven, The Netherlands
a r t i c l e i n f o
Keywords:Process miningTrace clusteringSingular value decompositionRandom projectionPCA
0957-4174/$ - see front matter � 2012 Elsevier Ltd. Ahttp://dx.doi.org/10.1016/j.eswa.2012.12.078
⇑ Corresponding author. Tel.: +82 52 217 3116.E-mail address: [email protected] (M. Song).
a b s t r a c t
Process mining techniques have been used to analyze event logs from information systems in order toderive useful patterns. However, in the big data era, real-life event logs are huge, unstructured, and com-plex so that traditional process mining techniques have difficulties in the analysis of big logs. To reducethe complexity during the analysis, trace clustering can be used to group similar traces together and tomine more structured and simpler process models for each of the clusters locally. However, a high dimen-sionality of the feature space in which all the traces are presented poses different problems to trace clus-tering. In this paper, we study the effect of applying dimensionality reduction (preprocessing) techniqueson the performance of trace clustering. In our experimental study we use three popular feature transfor-mation techniques; singular value decomposition (SVD), random projection (RP), and principal compo-nents analysis (PCA), and the state-of-the art trace clustering in process mining. The experimentalresults on the dataset constructed from a real event log recorded from patient treatment processes ina Dutch hospital show that dimensionality reduction can improve trace clustering performance withrespect to the computation time and average fitness of the mined local process models.
� 2012 Elsevier Ltd. All rights reserved.
1. Introduction
In order to make operational processes competitive, organiza-tions continuously improve their processes. The starting point ofprocess improvement is to understand processes to be improved.One of the techniques that can be used to understand business pro-cesses is process mining. Process mining aims at extracting usefulinformation about business processes by analyzing event logs thatcontains process execution results (G}unther & van der Aalst, 2007;van der Aalst, Weijters, & Maruster, 2004). Process mining resultsusually contain several information about processes such as pro-cess models, business performance metrics, organizational models,organizational relations, performance characteristics, etc. (G}unther& van der Aalst, 2007; Maruster & Beest, 2009; Song & van derAalst, 2008; van der Aalst et al., 2007). Recently, several organiza-tions such as high-tech companies, hospitals, and municipalitiesutilize process mining techniques to improve their processes(Lemos, Sabino, Lima, & Oliveira, 2011; Mans, Schonenberg, Song,van der Aalst, & Bakker, 2008; Reijers, Song, & Jeong, 2009; Rozinat,Jong, Günther, & van der Aalst, 2009; Song, Gunther, & van derAalst, 2008; van der Aalst et al., 2007).
ll rights reserved.
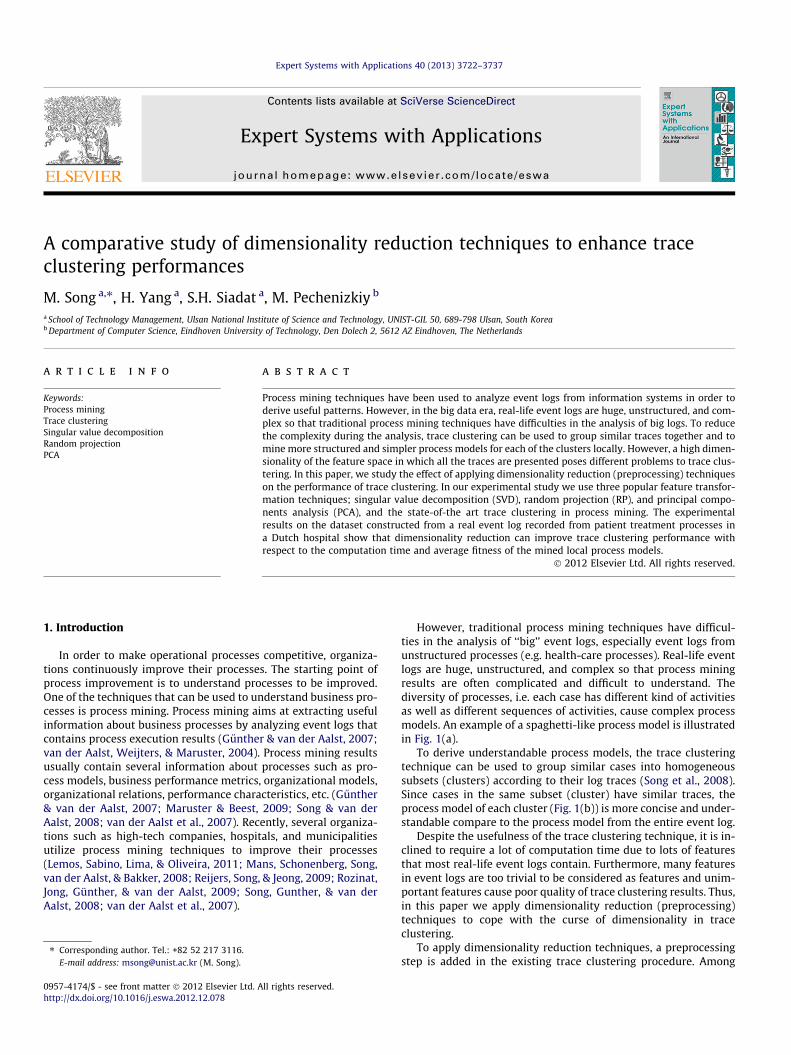
However, traditional process mining techniques have difficul-ties in the analysis of ‘‘big’’ event logs, especially event logs fromunstructured processes (e.g. health-care processes). Real-life eventlogs are huge, unstructured, and complex so that process miningresults are often complicated and difficult to understand. Thediversity of processes, i.e. each case has different kind of activitiesas well as different sequences of activities, cause complex processmodels. An example of a spaghetti-like process model is illustratedin Fig. 1(a).
To derive understandable process models, the trace clusteringtechnique can be used to group similar cases into homogeneoussubsets (clusters) according to their log traces (Song et al., 2008).Since cases in the same subset (cluster) have similar traces, theprocess model of each cluster (Fig. 1(b)) is more concise and under-standable compare to the process model from the entire event log.
Despite the usefulness of the trace clustering technique, it is in-clined to require a lot of computation time due to lots of featuresthat most real-life event logs contain. Furthermore, many featuresin event logs are too trivial to be considered as features and unim-portant features cause poor quality of trace clustering results. Thus,in this paper we apply dimensionality reduction (preprocessing)techniques to cope with the curse of dimensionality in traceclustering.
To apply dimensionality reduction techniques, a preprocessingstep is added in the existing trace clustering procedure. Among
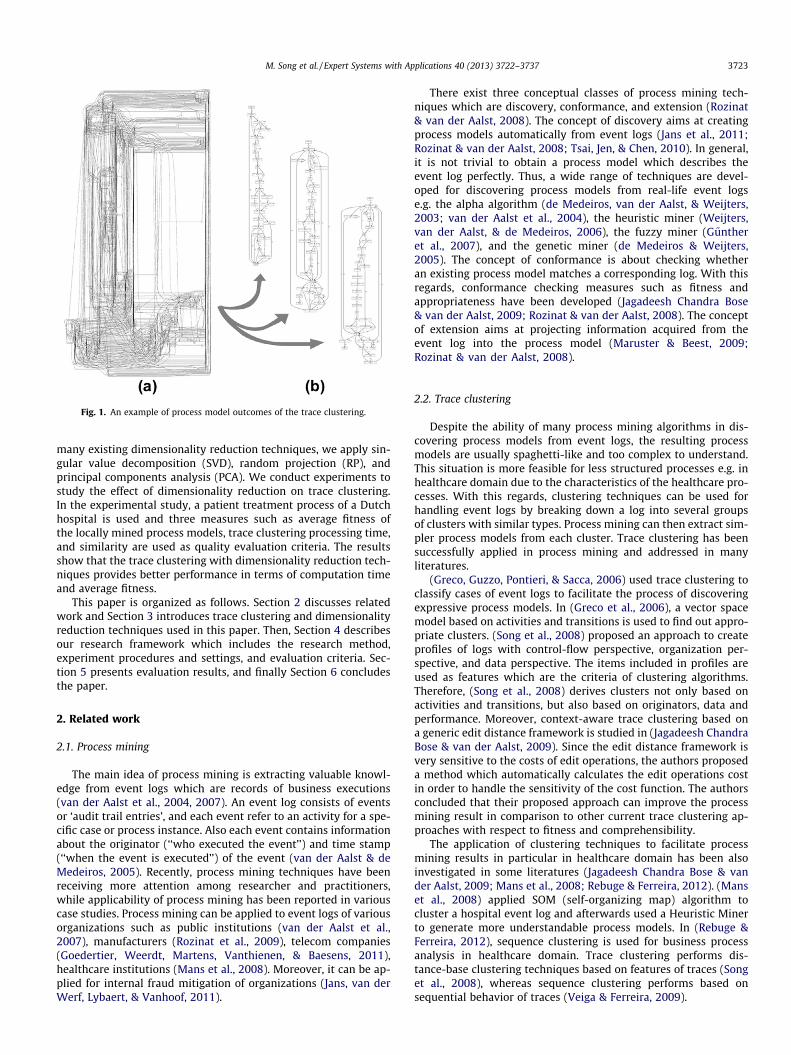
Fig. 1. An example of process model outcomes of the trace clustering.
M. Song et al. / Expert Systems with Applications 40 (2013) 3722–3737 3723
many existing dimensionality reduction techniques, we apply sin-gular value decomposition (SVD), random projection (RP), andprincipal components analysis (PCA). We conduct experiments tostudy the effect of dimensionality reduction on trace clustering.In the experimental study, a patient treatment process of a Dutchhospital is used and three measures such as average fitness ofthe locally mined process models, trace clustering processing time,and similarity are used as quality evaluation criteria. The resultsshow that the trace clustering with dimensionality reduction tech-niques provides better performance in terms of computation timeand average fitness.
This paper is organized as follows. Section 2 discusses relatedwork and Section 3 introduces trace clustering and dimensionalityreduction techniques used in this paper. Then, Section 4 describesour research framework which includes the research method,experiment procedures and settings, and evaluation criteria. Sec-tion 5 presents evaluation results, and finally Section 6 concludesthe paper.
2. Related work
2.1. Process mining
The main idea of process mining is extracting valuable knowl-edge from event logs which are records of business executions(van der Aalst et al., 2004, 2007). An event log consists of eventsor ‘audit trail entries’, and each event refer to an activity for a spe-cific case or process instance. Also each event contains informationabout the originator (‘‘who executed the event’’) and time stamp(‘‘when the event is executed’’) of the event (van der Aalst & deMedeiros, 2005). Recently, process mining techniques have beenreceiving more attention among researcher and practitioners,while applicability of process mining has been reported in variouscase studies. Process mining can be applied to event logs of variousorganizations such as public institutions (van der Aalst et al.,2007), manufacturers (Rozinat et al., 2009), telecom companies(Goedertier, Weerdt, Martens, Vanthienen, & Baesens, 2011),healthcare institutions (Mans et al., 2008). Moreover, it can be ap-plied for internal fraud mitigation of organizations (Jans, van derWerf, Lybaert, & Vanhoof, 2011).
There exist three conceptual classes of process mining tech-niques which are discovery, conformance, and extension (Rozinat& van der Aalst, 2008). The concept of discovery aims at creatingprocess models automatically from event logs (Jans et al., 2011;Rozinat & van der Aalst, 2008; Tsai, Jen, & Chen, 2010). In general,it is not trivial to obtain a process model which describes theevent log perfectly. Thus, a wide range of techniques are devel-oped for discovering process models from real-life event logse.g. the alpha algorithm (de Medeiros, van der Aalst, & Weijters,2003; van der Aalst et al., 2004), the heuristic miner (Weijters,van der Aalst, & de Medeiros, 2006), the fuzzy miner (G}untheret al., 2007), and the genetic miner (de Medeiros & Weijters,2005). The concept of conformance is about checking whetheran existing process model matches a corresponding log. With thisregards, conformance checking measures such as fitness andappropriateness have been developed (Jagadeesh Chandra Bose& van der Aalst, 2009; Rozinat & van der Aalst, 2008). The conceptof extension aims at projecting information acquired from theevent log into the process model (Maruster & Beest, 2009;Rozinat & van der Aalst, 2008).
2.2. Trace clustering
Despite the ability of many process mining algorithms in dis-covering process models from event logs, the resulting processmodels are usually spaghetti-like and too complex to understand.This situation is more feasible for less structured processes e.g. inhealthcare domain due to the characteristics of the healthcare pro-cesses. With this regards, clustering techniques can be used forhandling event logs by breaking down a log into several groupsof clusters with similar types. Process mining can then extract sim-pler process models from each cluster. Trace clustering has beensuccessfully applied in process mining and addressed in manyliteratures.
(Greco, Guzzo, Pontieri, & Sacca, 2006) used trace clustering toclassify cases of event logs to facilitate the process of discoveringexpressive process models. In (Greco et al., 2006), a vector spacemodel based on activities and transitions is used to find out appro-priate clusters. (Song et al., 2008) proposed an approach to createprofiles of logs with control-flow perspective, organization per-spective, and data perspective. The items included in profiles areused as features which are the criteria of clustering algorithms.Therefore, (Song et al., 2008) derives clusters not only based onactivities and transitions, but also based on originators, data andperformance. Moreover, context-aware trace clustering based ona generic edit distance framework is studied in (Jagadeesh ChandraBose & van der Aalst, 2009). Since the edit distance framework isvery sensitive to the costs of edit operations, the authors proposeda method which automatically calculates the edit operations costin order to handle the sensitivity of the cost function. The authorsconcluded that their proposed approach can improve the processmining result in comparison to other current trace clustering ap-proaches with respect to fitness and comprehensibility.
The application of clustering techniques to facilitate processmining results in particular in healthcare domain has been alsoinvestigated in some literatures (Jagadeesh Chandra Bose & vander Aalst, 2009; Mans et al., 2008; Rebuge & Ferreira, 2012). (Manset al., 2008) applied SOM (self-organizing map) algorithm tocluster a hospital event log and afterwards used a Heuristic Minerto generate more understandable process models. In (Rebuge &Ferreira, 2012), sequence clustering is used for business processanalysis in healthcare domain. Trace clustering performs dis-tance-base clustering techniques based on features of traces (Songet al., 2008), whereas sequence clustering performs based onsequential behavior of traces (Veiga & Ferreira, 2009).
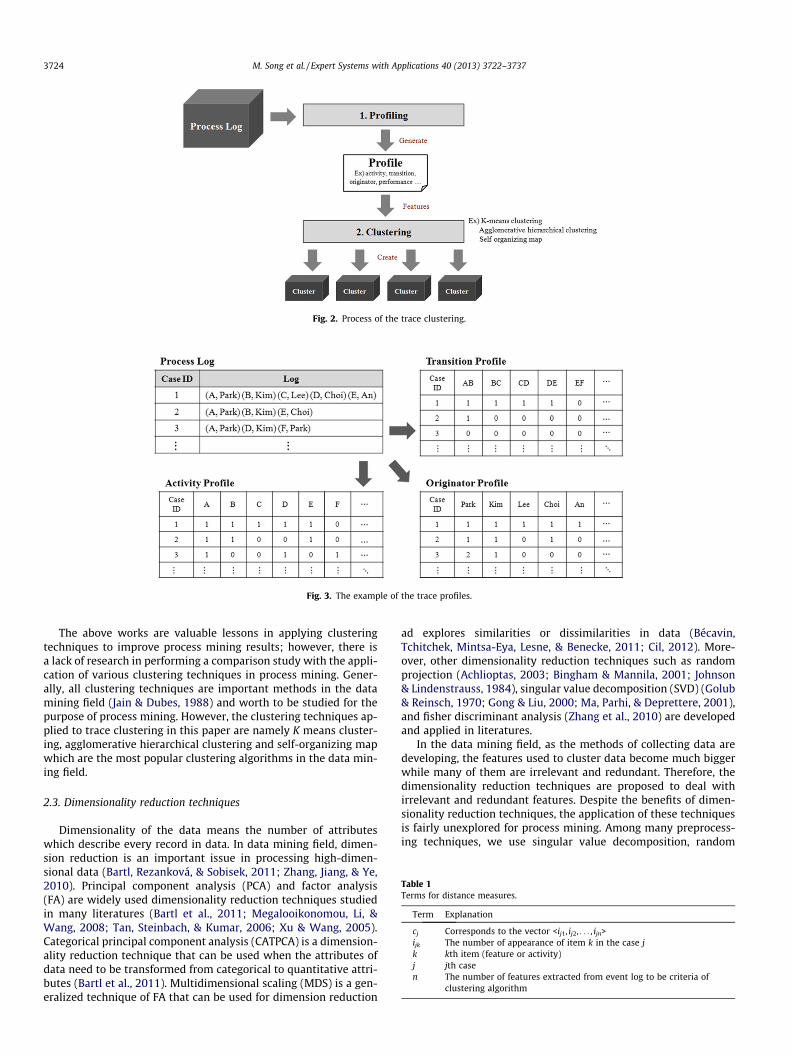
Fig. 2. Process of the trace clustering.
Fig. 3. The example of the trace profiles.
Table 1Terms for distance measures.
Term Explanation
cj Corresponds to the vector <ij1, ij2, . . . , ijn>ijk The number of appearance of item k in the case jk kth item (feature or activity)j jth casen The number of features extracted from event log to be criteria of
clustering algorithm
3724 M. Song et al. / Expert Systems with Applications 40 (2013) 3722–3737
The above works are valuable lessons in applying clusteringtechniques to improve process mining results; however, there isa lack of research in performing a comparison study with the appli-cation of various clustering techniques in process mining. Gener-ally, all clustering techniques are important methods in the datamining field (Jain & Dubes, 1988) and worth to be studied for thepurpose of process mining. However, the clustering techniques ap-plied to trace clustering in this paper are namely K means cluster-ing, agglomerative hierarchical clustering and self-organizing mapwhich are the most popular clustering algorithms in the data min-ing field.
2.3. Dimensionality reduction techniques
Dimensionality of the data means the number of attributeswhich describe every record in data. In data mining field, dimen-sion reduction is an important issue in processing high-dimen-sional data (Bartl, Rezanková, & Sobisek, 2011; Zhang, Jiang, & Ye,2010). Principal component analysis (PCA) and factor analysis(FA) are widely used dimensionality reduction techniques studiedin many literatures (Bartl et al., 2011; Megalooikonomou, Li, &Wang, 2008; Tan, Steinbach, & Kumar, 2006; Xu & Wang, 2005).Categorical principal component analysis (CATPCA) is a dimension-ality reduction technique that can be used when the attributes ofdata need to be transformed from categorical to quantitative attri-butes (Bartl et al., 2011). Multidimensional scaling (MDS) is a gen-eralized technique of FA that can be used for dimension reduction
ad explores similarities or dissimilarities in data (Bécavin,Tchitchek, Mintsa-Eya, Lesne, & Benecke, 2011; Cil, 2012). More-over, other dimensionality reduction techniques such as randomprojection (Achlioptas, 2003; Bingham & Mannila, 2001; Johnson& Lindenstrauss, 1984), singular value decomposition (SVD) (Golub& Reinsch, 1970; Gong & Liu, 2000; Ma, Parhi, & Deprettere, 2001),and fisher discriminant analysis (Zhang et al., 2010) are developedand applied in literatures.
In the data mining field, as the methods of collecting data aredeveloping, the features used to cluster data become much biggerwhile many of them are irrelevant and redundant. Therefore, thedimensionality reduction techniques are proposed to deal withirrelevant and redundant features. Despite the benefits of dimen-sionality reduction techniques, the application of these techniquesis fairly unexplored for process mining. Among many preprocess-ing techniques, we use singular value decomposition, random
Fig. 4. Process of the trace clustering with application of dimensionality reduction technique.
Fig. 5. Design of the experiments.
Table 2The resulting logs after filtering.
Log name Filtering (%) # of events per case # of types of events
Min Average Max
PL1 1.0 3 18 25 25PL2 0.8 3 22 32 32PL3 0.5 3 28 48 49PL4 0.3 3 31 63 65PL5 0 1 33 113 624
M. Song et al. / Expert Systems with Applications 40 (2013) 3722–3737 3725
projection and principal components analysis in this paper. In thefollowing we address related work on these techniques in datamining fields.
Random projection has been applied to various data sourcessuch as text data, image data (Bingham et al., 2001), and cancella-ble biometrics in face recognition (Ying & Jin, 2007), in order to re-duce the dimension of data. SVD is an excellent and powerfultechnique in many fields. For example, it can be implemented insignal modeling, system identification, image reconstruction, real-ization and reliable computations (Ma et al., 2001). In experimentswith actual data, however, the result of separation by size of thesingular values are usually not clear. Therefore, determining thenumber of singular values is very important. An appropriate singu-lar value improves stability of the experiment and lowers the pos-sibility of losing significant signal information (Sano, 1993). SVDhas been used in many fields such as text retrieval (Nicholas &Dahlberg, 1998), video summarization (Gong et al., 2000), andhand gesture recognition (Liu & Kavakli, 2010). PCA uses clusteringto predict user preferences (Goldberg, Roeder, Gupta, & Perkins,2001). PCA has been reviewed and extended because of its poten-tial applications. Categorical PCA and Nonlinear PCA are the
extended versions of PCA, and they are being studied by manyresearchers (Meulman, van der Kooij, & Heiser, 2004).
3. Trace Clustering and dimensionality reduction techniques
3.1. Trace clustering
Trace clustering classifies cases of a log into homogeneous sub-sets (clusters) according to features of the cases. Since cases in thesame cluster are similar to each other, the process models of each
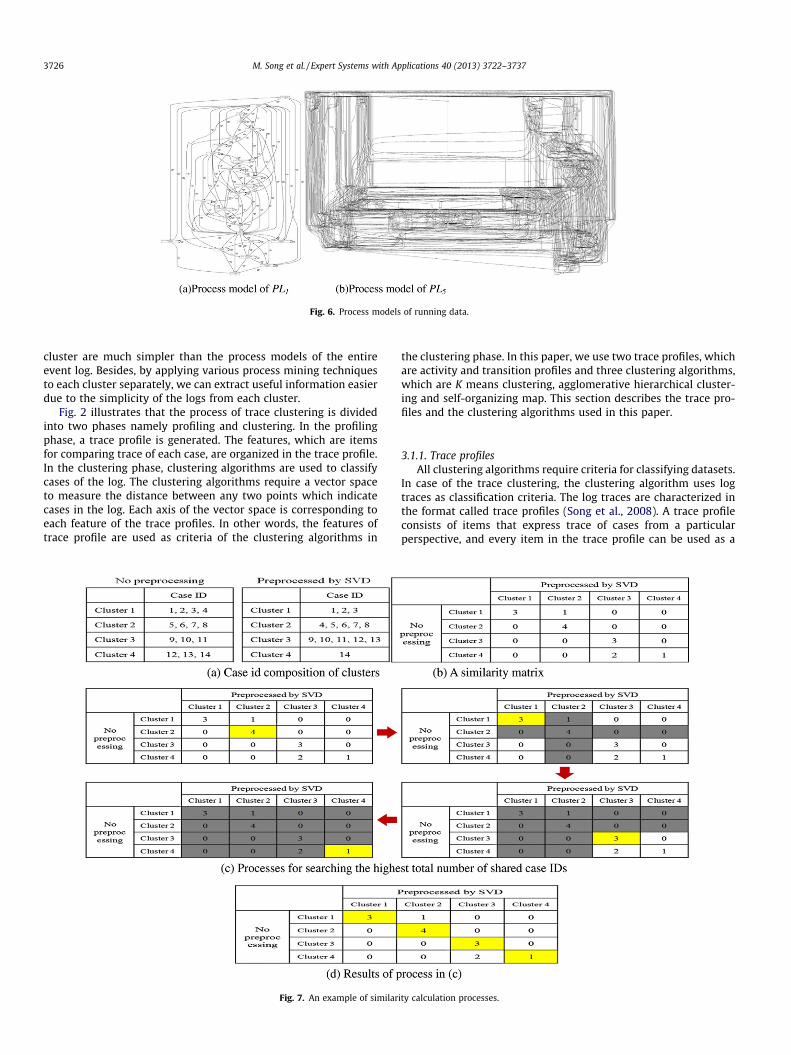
Fig. 6. Process models of running data.
3726 M. Song et al. / Expert Systems with Applications 40 (2013) 3722–3737
cluster are much simpler than the process models of the entireevent log. Besides, by applying various process mining techniquesto each cluster separately, we can extract useful information easierdue to the simplicity of the logs from each cluster.
Fig. 2 illustrates that the process of trace clustering is dividedinto two phases namely profiling and clustering. In the profilingphase, a trace profile is generated. The features, which are itemsfor comparing trace of each case, are organized in the trace profile.In the clustering phase, clustering algorithms are used to classifycases of the log. The clustering algorithms require a vector spaceto measure the distance between any two points which indicatecases in the log. Each axis of the vector space is corresponding toeach feature of the trace profiles. In other words, the features oftrace profile are used as criteria of the clustering algorithms in
Fig. 7. An example of similar
the clustering phase. In this paper, we use two trace profiles, whichare activity and transition profiles and three clustering algorithms,which are K means clustering, agglomerative hierarchical cluster-ing and self-organizing map. This section describes the trace pro-files and the clustering algorithms used in this paper.
3.1.1. Trace profilesAll clustering algorithms require criteria for classifying datasets.
In case of the trace clustering, the clustering algorithm uses logtraces as classification criteria. The log traces are characterized inthe format called trace profiles (Song et al., 2008). A trace profileconsists of items that express trace of cases from a particularperspective, and every item in the trace profile can be used as a
ity calculation processes.
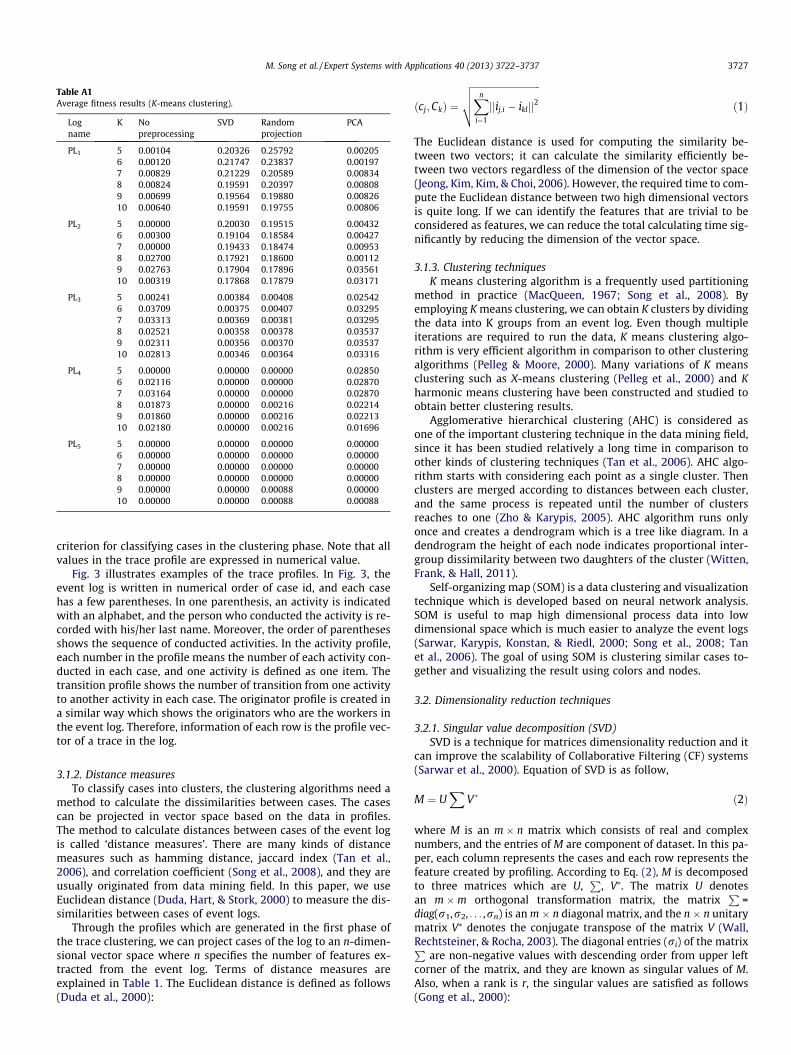
Table A1Average fitness results (K-means clustering).
Logname
K Nopreprocessing
SVD Randomprojection
PCA
PL1 5 0.00104 0.20326 0.25792 0.002056 0.00120 0.21747 0.23837 0.001977 0.00829 0.21229 0.20589 0.008348 0.00824 0.19591 0.20397 0.008089 0.00699 0.19564 0.19880 0.0082610 0.00640 0.19591 0.19755 0.00806
PL2 5 0.00000 0.20030 0.19515 0.004326 0.00300 0.19104 0.18584 0.004277 0.00000 0.19433 0.18474 0.009538 0.02700 0.17921 0.18600 0.001129 0.02763 0.17904 0.17896 0.0356110 0.00319 0.17868 0.17879 0.03171
PL3 5 0.00241 0.00384 0.00408 0.025426 0.03709 0.00375 0.00407 0.032957 0.03313 0.00369 0.00381 0.032958 0.02521 0.00358 0.00378 0.035379 0.02311 0.00356 0.00370 0.0353710 0.02813 0.00346 0.00364 0.03316
PL4 5 0.00000 0.00000 0.00000 0.028506 0.02116 0.00000 0.00000 0.028707 0.03164 0.00000 0.00000 0.028708 0.01873 0.00000 0.00216 0.022149 0.01860 0.00000 0.00216 0.0221310 0.02180 0.00000 0.00216 0.01696
PL5 5 0.00000 0.00000 0.00000 0.000006 0.00000 0.00000 0.00000 0.000007 0.00000 0.00000 0.00000 0.000008 0.00000 0.00000 0.00000 0.000009 0.00000 0.00000 0.00088 0.0000010 0.00000 0.00000 0.00088 0.00088
M. Song et al. / Expert Systems with Applications 40 (2013) 3722–3737 3727
criterion for classifying cases in the clustering phase. Note that allvalues in the trace profile are expressed in numerical value.
Fig. 3 illustrates examples of the trace profiles. In Fig. 3, theevent log is written in numerical order of case id, and each casehas a few parentheses. In one parenthesis, an activity is indicatedwith an alphabet, and the person who conducted the activity is re-corded with his/her last name. Moreover, the order of parenthesesshows the sequence of conducted activities. In the activity profile,each number in the profile means the number of each activity con-ducted in each case, and one activity is defined as one item. Thetransition profile shows the number of transition from one activityto another activity in each case. The originator profile is created ina similar way which shows the originators who are the workers inthe event log. Therefore, information of each row is the profile vec-tor of a trace in the log.
3.1.2. Distance measuresTo classify cases into clusters, the clustering algorithms need a
method to calculate the dissimilarities between cases. The casescan be projected in vector space based on the data in profiles.The method to calculate distances between cases of the event logis called ‘distance measures’. There are many kinds of distancemeasures such as hamming distance, jaccard index (Tan et al.,2006), and correlation coefficient (Song et al., 2008), and they areusually originated from data mining field. In this paper, we useEuclidean distance (Duda, Hart, & Stork, 2000) to measure the dis-similarities between cases of event logs.
Through the profiles which are generated in the first phase ofthe trace clustering, we can project cases of the log to an n-dimen-sional vector space where n specifies the number of features ex-tracted from the event log. Terms of distance measures areexplained in Table 1. The Euclidean distance is defined as follows(Duda et al., 2000):
ðcj;CkÞ ¼
ffiffiffiffiffiffiffiffiffiffiffiffiffiffiffiffiffiffiffiffiffiffiffiffiffiffiffiffiffiXn
i¼1
jjij;i � ikljj2vuut ð1Þ
The Euclidean distance is used for computing the similarity be-tween two vectors; it can calculate the similarity efficiently be-tween two vectors regardless of the dimension of the vector space(Jeong, Kim, Kim, & Choi, 2006). However, the required time to com-pute the Euclidean distance between two high dimensional vectorsis quite long. If we can identify the features that are trivial to beconsidered as features, we can reduce the total calculating time sig-nificantly by reducing the dimension of the vector space.
3.1.3. Clustering techniquesK means clustering algorithm is a frequently used partitioning
method in practice (MacQueen, 1967; Song et al., 2008). Byemploying K means clustering, we can obtain K clusters by dividingthe data into K groups from an event log. Even though multipleiterations are required to run the data, K means clustering algo-rithm is very efficient algorithm in comparison to other clusteringalgorithms (Pelleg & Moore, 2000). Many variations of K meansclustering such as X-means clustering (Pelleg et al., 2000) and Kharmonic means clustering have been constructed and studied toobtain better clustering results.
Agglomerative hierarchical clustering (AHC) is considered asone of the important clustering technique in the data mining field,since it has been studied relatively a long time in comparison toother kinds of clustering techniques (Tan et al., 2006). AHC algo-rithm starts with considering each point as a single cluster. Thenclusters are merged according to distances between each cluster,and the same process is repeated until the number of clustersreaches to one (Zho & Karypis, 2005). AHC algorithm runs onlyonce and creates a dendrogram which is a tree like diagram. In adendrogram the height of each node indicates proportional inter-group dissimilarity between two daughters of the cluster (Witten,Frank, & Hall, 2011).
Self-organizing map (SOM) is a data clustering and visualizationtechnique which is developed based on neural network analysis.SOM is useful to map high dimensional process data into lowdimensional space which is much easier to analyze the event logs(Sarwar, Karypis, Konstan, & Riedl, 2000; Song et al., 2008; Tanet al., 2006). The goal of using SOM is clustering similar cases to-gether and visualizing the result using colors and nodes.
3.2. Dimensionality reduction techniques
3.2.1. Singular value decomposition (SVD)SVD is a technique for matrices dimensionality reduction and it
can improve the scalability of Collaborative Filtering (CF) systems(Sarwar et al., 2000). Equation of SVD is as follow,
M ¼ UX
V� ð2Þ
where M is an m � n matrix which consists of real and complexnumbers, and the entries of M are component of dataset. In this pa-per, each column represents the cases and each row represents thefeature created by profiling. According to Eq. (2), M is decomposedto three matrices which are U,
P, V⁄. The matrix U denotes
an m �m orthogonal transformation matrix, the matrixP
=diag(r1,r2, . . . ,rn) is an m � n diagonal matrix, and the n � n unitarymatrix V⁄ denotes the conjugate transpose of the matrix V (Wall,Rechtsteiner, & Rocha, 2003). The diagonal entries (ri) of the matrixP
are non-negative values with descending order from upper leftcorner of the matrix, and they are known as singular values of M.Also, when a rank is r, the singular values are satisfied as follows(Gong et al., 2000):
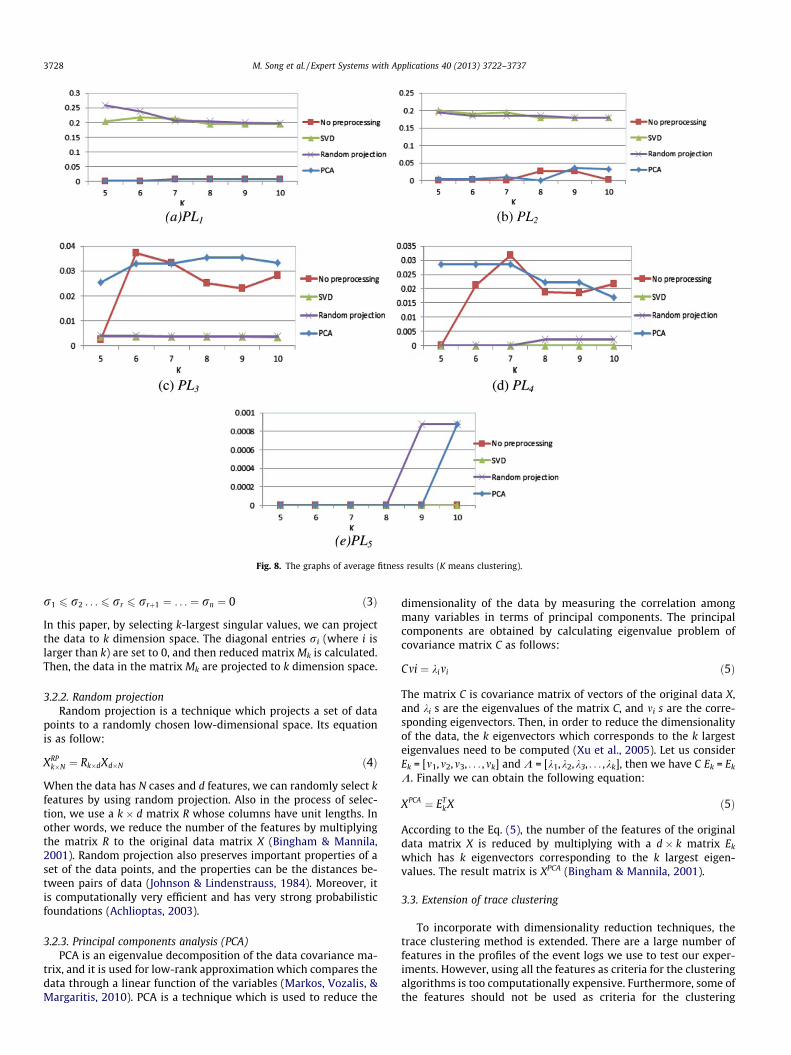
Fig. 8. The graphs of average fitness results (K means clustering).
3728 M. Song et al. / Expert Systems with Applications 40 (2013) 3722–3737
r1 6 r2 . . . 6 rr 6 rrþ1 ¼ . . . ¼ rn ¼ 0 ð3Þ
In this paper, by selecting k-largest singular values, we can projectthe data to k dimension space. The diagonal entries ri (where i islarger than k) are set to 0, and then reduced matrix Mk is calculated.Then, the data in the matrix Mk are projected to k dimension space.
3.2.2. Random projectionRandom projection is a technique which projects a set of data
points to a randomly chosen low-dimensional space. Its equationis as follow:
XRPk�N ¼ Rk�dXd�N ð4Þ
When the data has N cases and d features, we can randomly select kfeatures by using random projection. Also in the process of selec-tion, we use a k � d matrix R whose columns have unit lengths. Inother words, we reduce the number of the features by multiplyingthe matrix R to the original data matrix X (Bingham & Mannila,2001). Random projection also preserves important properties of aset of the data points, and the properties can be the distances be-tween pairs of data (Johnson & Lindenstrauss, 1984). Moreover, itis computationally very efficient and has very strong probabilisticfoundations (Achlioptas, 2003).
3.2.3. Principal components analysis (PCA)PCA is an eigenvalue decomposition of the data covariance ma-
trix, and it is used for low-rank approximation which compares thedata through a linear function of the variables (Markos, Vozalis, &Margaritis, 2010). PCA is a technique which is used to reduce the
dimensionality of the data by measuring the correlation amongmany variables in terms of principal components. The principalcomponents are obtained by calculating eigenvalue problem ofcovariance matrix C as follows:
Cmi ¼ kimi ð5Þ
The matrix C is covariance matrix of vectors of the original data X,and ki s are the eigenvalues of the matrix C, and mi s are the corre-sponding eigenvectors. Then, in order to reduce the dimensionalityof the data, the k eigenvectors which corresponds to the k largesteigenvalues need to be computed (Xu et al., 2005). Let us considerEk = [m1,m2,m3, . . . ,mk] and K = [k1,k2,k3, . . . ,kk], then we have C Ek = Ek
K. Finally we can obtain the following equation:
XPCA ¼ ETk X ð5Þ
According to the Eq. (5), the number of the features of the originaldata matrix X is reduced by multiplying with a d � k matrix Ek
which has k eigenvectors corresponding to the k largest eigen-values. The result matrix is XPCA (Bingham & Mannila, 2001).
3.3. Extension of trace clustering
To incorporate with dimensionality reduction techniques, thetrace clustering method is extended. There are a large number offeatures in the profiles of the event logs we use to test our exper-iments. However, using all the features as criteria for the clusteringalgorithms is too computationally expensive. Furthermore, some ofthe features should not be used as criteria for the clustering
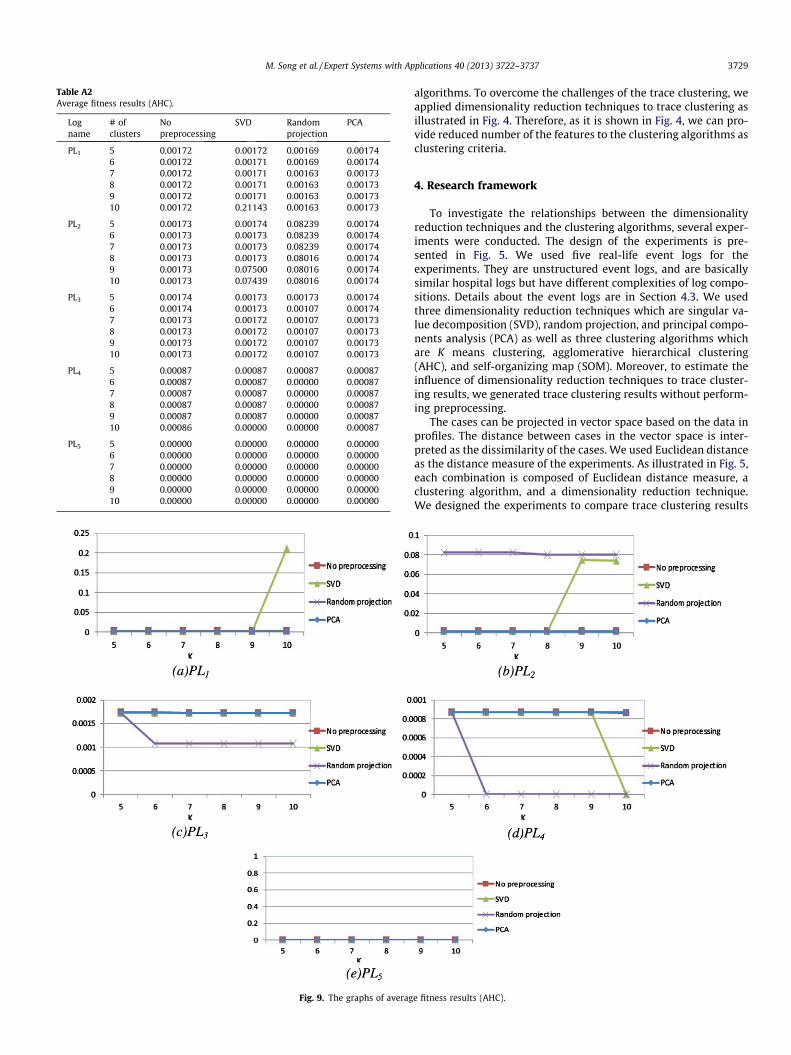
Table A2Average fitness results (AHC).
Logname
# ofclusters
Nopreprocessing
SVD Randomprojection
PCA
PL1 5 0.00172 0.00172 0.00169 0.001746 0.00172 0.00171 0.00169 0.001747 0.00172 0.00171 0.00163 0.001738 0.00172 0.00171 0.00163 0.001739 0.00172 0.00171 0.00163 0.0017310 0.00172 0.21143 0.00163 0.00173
PL2 5 0.00173 0.00174 0.08239 0.001746 0.00173 0.00173 0.08239 0.001747 0.00173 0.00173 0.08239 0.001748 0.00173 0.00173 0.08016 0.001749 0.00173 0.07500 0.08016 0.0017410 0.00173 0.07439 0.08016 0.00174
PL3 5 0.00174 0.00173 0.00173 0.001746 0.00174 0.00173 0.00107 0.001747 0.00173 0.00172 0.00107 0.001738 0.00173 0.00172 0.00107 0.001739 0.00173 0.00172 0.00107 0.0017310 0.00173 0.00172 0.00107 0.00173
PL4 5 0.00087 0.00087 0.00087 0.000876 0.00087 0.00087 0.00000 0.000877 0.00087 0.00087 0.00000 0.000878 0.00087 0.00087 0.00000 0.000879 0.00087 0.00087 0.00000 0.0008710 0.00086 0.00000 0.00000 0.00087
PL5 5 0.00000 0.00000 0.00000 0.000006 0.00000 0.00000 0.00000 0.000007 0.00000 0.00000 0.00000 0.000008 0.00000 0.00000 0.00000 0.000009 0.00000 0.00000 0.00000 0.0000010 0.00000 0.00000 0.00000 0.00000
Fig. 9. The graphs of averag
M. Song et al. / Expert Systems with Applications 40 (2013) 3722–3737 3729
algorithms. To overcome the challenges of the trace clustering, weapplied dimensionality reduction techniques to trace clustering asillustrated in Fig. 4. Therefore, as it is shown in Fig. 4, we can pro-vide reduced number of the features to the clustering algorithms asclustering criteria.
4. Research framework
To investigate the relationships between the dimensionalityreduction techniques and the clustering algorithms, several exper-iments were conducted. The design of the experiments is pre-sented in Fig. 5. We used five real-life event logs for theexperiments. They are unstructured event logs, and are basicallysimilar hospital logs but have different complexities of log compo-sitions. Details about the event logs are in Section 4.3. We usedthree dimensionality reduction techniques which are singular va-lue decomposition (SVD), random projection, and principal compo-nents analysis (PCA) as well as three clustering algorithms whichare K means clustering, agglomerative hierarchical clustering(AHC), and self-organizing map (SOM). Moreover, to estimate theinfluence of dimensionality reduction techniques to trace cluster-ing results, we generated trace clustering results without perform-ing preprocessing.
The cases can be projected in vector space based on the data inprofiles. The distance between cases in the vector space is inter-preted as the dissimilarity of the cases. We used Euclidean distanceas the distance measure of the experiments. As illustrated in Fig. 5,each combination is composed of Euclidean distance measure, aclustering algorithm, and a dimensionality reduction technique.We designed the experiments to compare trace clustering results
e fitness results (AHC).
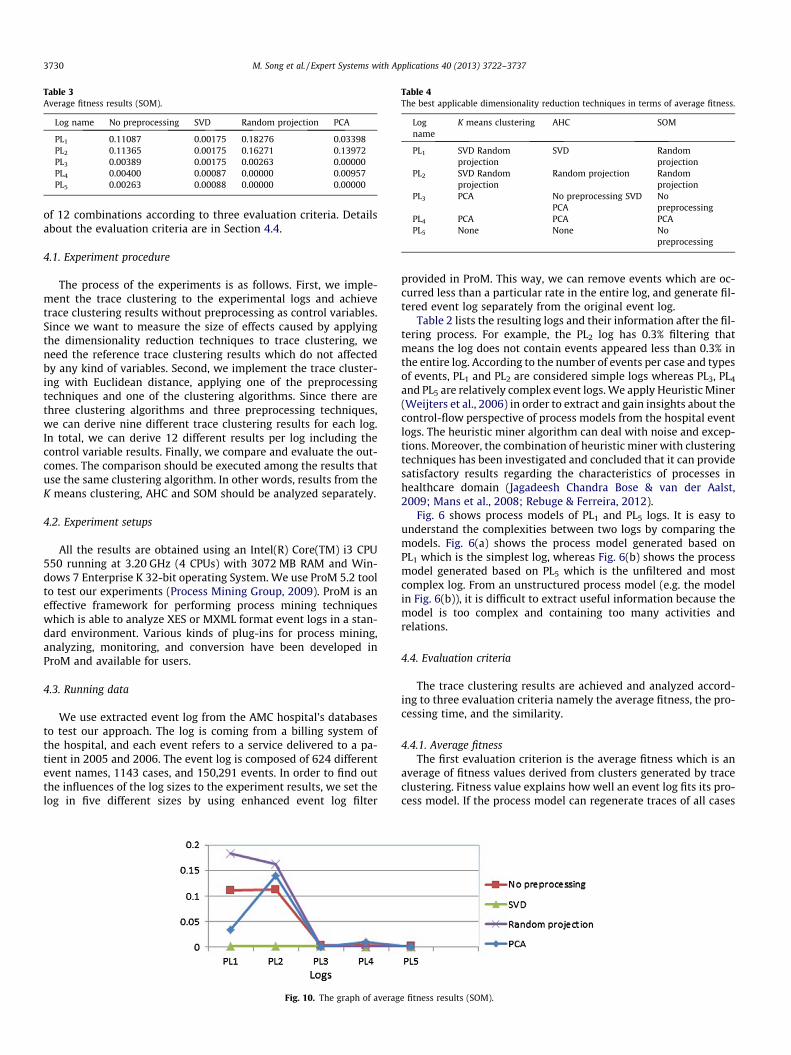
Table 3Average fitness results (SOM).
Log name No preprocessing SVD Random projection PCA
PL1 0.11087 0.00175 0.18276 0.03398PL2 0.11365 0.00175 0.16271 0.13972PL3 0.00389 0.00175 0.00263 0.00000PL4 0.00400 0.00087 0.00000 0.00957PL5 0.00263 0.00088 0.00000 0.00000
Table 4The best applicable dimensionality reduction techniques in terms of average fitness.
Logname
K means clustering AHC SOM
PL1 SVD Randomprojection
SVD Randomprojection
PL2 SVD Randomprojection
Random projection Randomprojection
PL3 PCA No preprocessing SVDPCA
Nopreprocessing
PL4 PCA PCA PCAPL5 None None No
preprocessing
3730 M. Song et al. / Expert Systems with Applications 40 (2013) 3722–3737
of 12 combinations according to three evaluation criteria. Detailsabout the evaluation criteria are in Section 4.4.
4.1. Experiment procedure
The process of the experiments is as follows. First, we imple-ment the trace clustering to the experimental logs and achievetrace clustering results without preprocessing as control variables.Since we want to measure the size of effects caused by applyingthe dimensionality reduction techniques to trace clustering, weneed the reference trace clustering results which do not affectedby any kind of variables. Second, we implement the trace cluster-ing with Euclidean distance, applying one of the preprocessingtechniques and one of the clustering algorithms. Since there arethree clustering algorithms and three preprocessing techniques,we can derive nine different trace clustering results for each log.In total, we can derive 12 different results per log including thecontrol variable results. Finally, we compare and evaluate the out-comes. The comparison should be executed among the results thatuse the same clustering algorithm. In other words, results from theK means clustering, AHC and SOM should be analyzed separately.
4.2. Experiment setups
All the results are obtained using an Intel(R) Core(TM) i3 CPU550 running at 3.20 GHz (4 CPUs) with 3072 MB RAM and Win-dows 7 Enterprise K 32-bit operating System. We use ProM 5.2 toolto test our experiments (Process Mining Group, 2009). ProM is aneffective framework for performing process mining techniqueswhich is able to analyze XES or MXML format event logs in a stan-dard environment. Various kinds of plug-ins for process mining,analyzing, monitoring, and conversion have been developed inProM and available for users.
4.3. Running data
We use extracted event log from the AMC hospital’s databasesto test our approach. The log is coming from a billing system ofthe hospital, and each event refers to a service delivered to a pa-tient in 2005 and 2006. The event log is composed of 624 differentevent names, 1143 cases, and 150,291 events. In order to find outthe influences of the log sizes to the experiment results, we set thelog in five different sizes by using enhanced event log filter
Fig. 10. The graph of averag
provided in ProM. This way, we can remove events which are oc-curred less than a particular rate in the entire log, and generate fil-tered event log separately from the original event log.
Table 2 lists the resulting logs and their information after the fil-tering process. For example, the PL2 log has 0.3% filtering thatmeans the log does not contain events appeared less than 0.3% inthe entire log. According to the number of events per case and typesof events, PL1 and PL2 are considered simple logs whereas PL3, PL4
and PL5 are relatively complex event logs. We apply Heuristic Miner(Weijters et al., 2006) in order to extract and gain insights about thecontrol-flow perspective of process models from the hospital eventlogs. The heuristic miner algorithm can deal with noise and excep-tions. Moreover, the combination of heuristic miner with clusteringtechniques has been investigated and concluded that it can providesatisfactory results regarding the characteristics of processes inhealthcare domain (Jagadeesh Chandra Bose & van der Aalst,2009; Mans et al., 2008; Rebuge & Ferreira, 2012).
Fig. 6 shows process models of PL1 and PL5 logs. It is easy tounderstand the complexities between two logs by comparing themodels. Fig. 6(a) shows the process model generated based onPL1 which is the simplest log, whereas Fig. 6(b) shows the processmodel generated based on PL5 which is the unfiltered and mostcomplex log. From an unstructured process model (e.g. the modelin Fig. 6(b)), it is difficult to extract useful information because themodel is too complex and containing too many activities andrelations.
4.4. Evaluation criteria
The trace clustering results are achieved and analyzed accord-ing to three evaluation criteria namely the average fitness, the pro-cessing time, and the similarity.
4.4.1. Average fitnessThe first evaluation criterion is the average fitness which is an
average of fitness values derived from clusters generated by traceclustering. Fitness value explains how well an event log fits its pro-cess model. If the process model can regenerate traces of all cases
e fitness results (SOM).
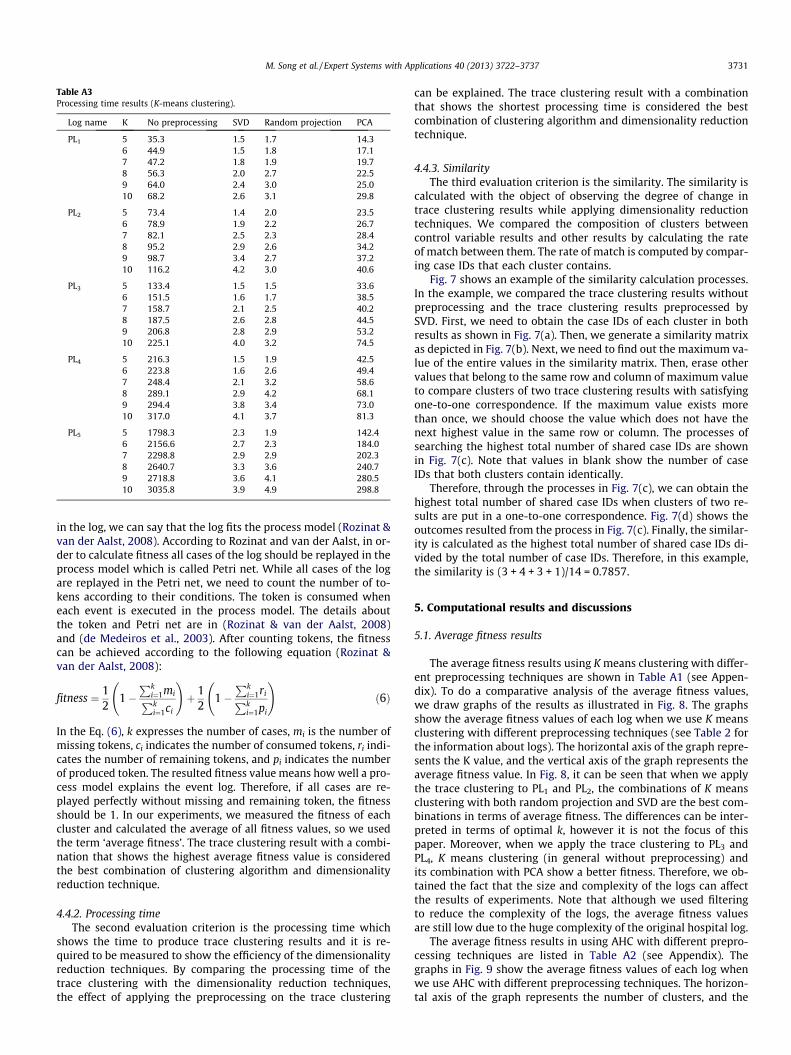
Table A3Processing time results (K-means clustering).
Log name K No preprocessing SVD Random projection PCA
PL1 5 35.3 1.5 1.7 14.36 44.9 1.5 1.8 17.17 47.2 1.8 1.9 19.78 56.3 2.0 2.7 22.59 64.0 2.4 3.0 25.010 68.2 2.6 3.1 29.8
PL2 5 73.4 1.4 2.0 23.56 78.9 1.9 2.2 26.77 82.1 2.5 2.3 28.48 95.2 2.9 2.6 34.29 98.7 3.4 2.7 37.210 116.2 4.2 3.0 40.6
PL3 5 133.4 1.5 1.5 33.66 151.5 1.6 1.7 38.57 158.7 2.1 2.5 40.28 187.5 2.6 2.8 44.59 206.8 2.8 2.9 53.210 225.1 4.0 3.2 74.5
PL4 5 216.3 1.5 1.9 42.56 223.8 1.6 2.6 49.47 248.4 2.1 3.2 58.68 289.1 2.9 4.2 68.19 294.4 3.8 3.4 73.010 317.0 4.1 3.7 81.3
PL5 5 1798.3 2.3 1.9 142.46 2156.6 2.7 2.3 184.07 2298.8 2.9 2.9 202.38 2640.7 3.3 3.6 240.79 2718.8 3.6 4.1 280.510 3035.8 3.9 4.9 298.8
M. Song et al. / Expert Systems with Applications 40 (2013) 3722–3737 3731
in the log, we can say that the log fits the process model (Rozinat &van der Aalst, 2008). According to Rozinat and van der Aalst, in or-der to calculate fitness all cases of the log should be replayed in theprocess model which is called Petri net. While all cases of the logare replayed in the Petri net, we need to count the number of to-kens according to their conditions. The token is consumed wheneach event is executed in the process model. The details aboutthe token and Petri net are in (Rozinat & van der Aalst, 2008)and (de Medeiros et al., 2003). After counting tokens, the fitnesscan be achieved according to the following equation (Rozinat &van der Aalst, 2008):
fitness ¼ 12
1�Pk
i¼1miPki¼1ci
!þ 1
21�
Pki¼1riPki¼1pi
!ð6Þ
In the Eq. (6), k expresses the number of cases, mi is the number ofmissing tokens, ci indicates the number of consumed tokens, ri indi-cates the number of remaining tokens, and pi indicates the numberof produced token. The resulted fitness value means how well a pro-cess model explains the event log. Therefore, if all cases are re-played perfectly without missing and remaining token, the fitnessshould be 1. In our experiments, we measured the fitness of eachcluster and calculated the average of all fitness values, so we usedthe term ‘average fitness’. The trace clustering result with a combi-nation that shows the highest average fitness value is consideredthe best combination of clustering algorithm and dimensionalityreduction technique.
4.4.2. Processing timeThe second evaluation criterion is the processing time which
shows the time to produce trace clustering results and it is re-quired to be measured to show the efficiency of the dimensionalityreduction techniques. By comparing the processing time of thetrace clustering with the dimensionality reduction techniques,the effect of applying the preprocessing on the trace clustering
can be explained. The trace clustering result with a combinationthat shows the shortest processing time is considered the bestcombination of clustering algorithm and dimensionality reductiontechnique.
4.4.3. SimilarityThe third evaluation criterion is the similarity. The similarity is
calculated with the object of observing the degree of change intrace clustering results while applying dimensionality reductiontechniques. We compared the composition of clusters betweencontrol variable results and other results by calculating the rateof match between them. The rate of match is computed by compar-ing case IDs that each cluster contains.
Fig. 7 shows an example of the similarity calculation processes.In the example, we compared the trace clustering results withoutpreprocessing and the trace clustering results preprocessed bySVD. First, we need to obtain the case IDs of each cluster in bothresults as shown in Fig. 7(a). Then, we generate a similarity matrixas depicted in Fig. 7(b). Next, we need to find out the maximum va-lue of the entire values in the similarity matrix. Then, erase othervalues that belong to the same row and column of maximum valueto compare clusters of two trace clustering results with satisfyingone-to-one correspondence. If the maximum value exists morethan once, we should choose the value which does not have thenext highest value in the same row or column. The processes ofsearching the highest total number of shared case IDs are shownin Fig. 7(c). Note that values in blank show the number of caseIDs that both clusters contain identically.
Therefore, through the processes in Fig. 7(c), we can obtain thehighest total number of shared case IDs when clusters of two re-sults are put in a one-to-one correspondence. Fig. 7(d) shows theoutcomes resulted from the process in Fig. 7(c). Finally, the similar-ity is calculated as the highest total number of shared case IDs di-vided by the total number of case IDs. Therefore, in this example,the similarity is (3 + 4 + 3 + 1)/14 = 0.7857.
5. Computational results and discussions
5.1. Average fitness results
The average fitness results using K means clustering with differ-ent preprocessing techniques are shown in Table A1 (see Appen-dix). To do a comparative analysis of the average fitness values,we draw graphs of the results as illustrated in Fig. 8. The graphsshow the average fitness values of each log when we use K meansclustering with different preprocessing techniques (see Table 2 forthe information about logs). The horizontal axis of the graph repre-sents the K value, and the vertical axis of the graph represents theaverage fitness value. In Fig. 8, it can be seen that when we applythe trace clustering to PL1 and PL2, the combinations of K meansclustering with both random projection and SVD are the best com-binations in terms of average fitness. The differences can be inter-preted in terms of optimal k, however it is not the focus of thispaper. Moreover, when we apply the trace clustering to PL3 andPL4, K means clustering (in general without preprocessing) andits combination with PCA show a better fitness. Therefore, we ob-tained the fact that the size and complexity of the logs can affectthe results of experiments. Note that although we used filteringto reduce the complexity of the logs, the average fitness valuesare still low due to the huge complexity of the original hospital log.
The average fitness results in using AHC with different prepro-cessing techniques are listed in Table A2 (see Appendix). Thegraphs in Fig. 9 show the average fitness values of each log whenwe use AHC with different preprocessing techniques. The horizon-tal axis of the graph represents the number of clusters, and the
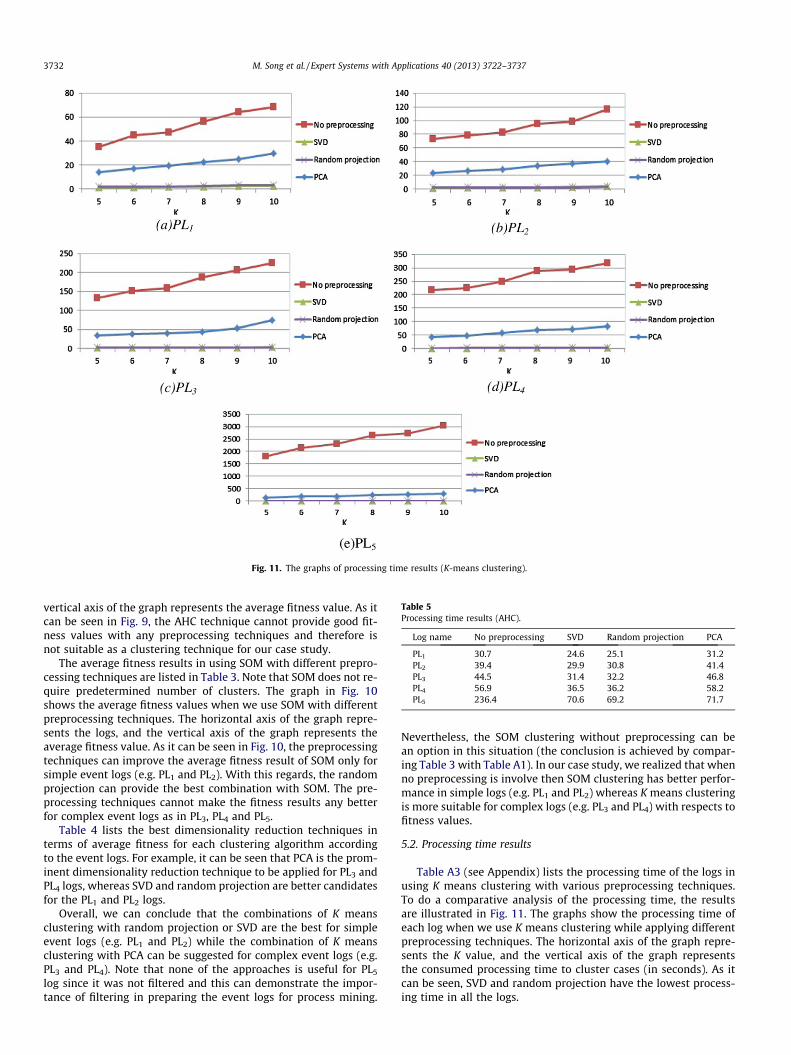
Fig. 11. The graphs of processing time results (K-means clustering).
Table 5Processing time results (AHC).
Log name No preprocessing SVD Random projection PCA
PL1 30.7 24.6 25.1 31.2PL2 39.4 29.9 30.8 41.4PL3 44.5 31.4 32.2 46.8PL4 56.9 36.5 36.2 58.2PL5 236.4 70.6 69.2 71.7
3732 M. Song et al. / Expert Systems with Applications 40 (2013) 3722–3737
vertical axis of the graph represents the average fitness value. As itcan be seen in Fig. 9, the AHC technique cannot provide good fit-ness values with any preprocessing techniques and therefore isnot suitable as a clustering technique for our case study.
The average fitness results in using SOM with different prepro-cessing techniques are listed in Table 3. Note that SOM does not re-quire predetermined number of clusters. The graph in Fig. 10shows the average fitness values when we use SOM with differentpreprocessing techniques. The horizontal axis of the graph repre-sents the logs, and the vertical axis of the graph represents theaverage fitness value. As it can be seen in Fig. 10, the preprocessingtechniques can improve the average fitness result of SOM only forsimple event logs (e.g. PL1 and PL2). With this regards, the randomprojection can provide the best combination with SOM. The pre-processing techniques cannot make the fitness results any betterfor complex event logs as in PL3, PL4 and PL5.
Table 4 lists the best dimensionality reduction techniques interms of average fitness for each clustering algorithm accordingto the event logs. For example, it can be seen that PCA is the prom-inent dimensionality reduction technique to be applied for PL3 andPL4 logs, whereas SVD and random projection are better candidatesfor the PL1 and PL2 logs.
Overall, we can conclude that the combinations of K meansclustering with random projection or SVD are the best for simpleevent logs (e.g. PL1 and PL2) while the combination of K meansclustering with PCA can be suggested for complex event logs (e.g.PL3 and PL4). Note that none of the approaches is useful for PL5
log since it was not filtered and this can demonstrate the impor-tance of filtering in preparing the event logs for process mining.
Nevertheless, the SOM clustering without preprocessing can bean option in this situation (the conclusion is achieved by compar-ing Table 3 with Table A1). In our case study, we realized that whenno preprocessing is involve then SOM clustering has better perfor-mance in simple logs (e.g. PL1 and PL2) whereas K means clusteringis more suitable for complex logs (e.g. PL3 and PL4) with respects tofitness values.
5.2. Processing time results
Table A3 (see Appendix) lists the processing time of the logs inusing K means clustering with various preprocessing techniques.To do a comparative analysis of the processing time, the resultsare illustrated in Fig. 11. The graphs show the processing time ofeach log when we use K means clustering while applying differentpreprocessing techniques. The horizontal axis of the graph repre-sents the K value, and the vertical axis of the graph representsthe consumed processing time to cluster cases (in seconds). As itcan be seen, SVD and random projection have the lowest process-ing time in all the logs.
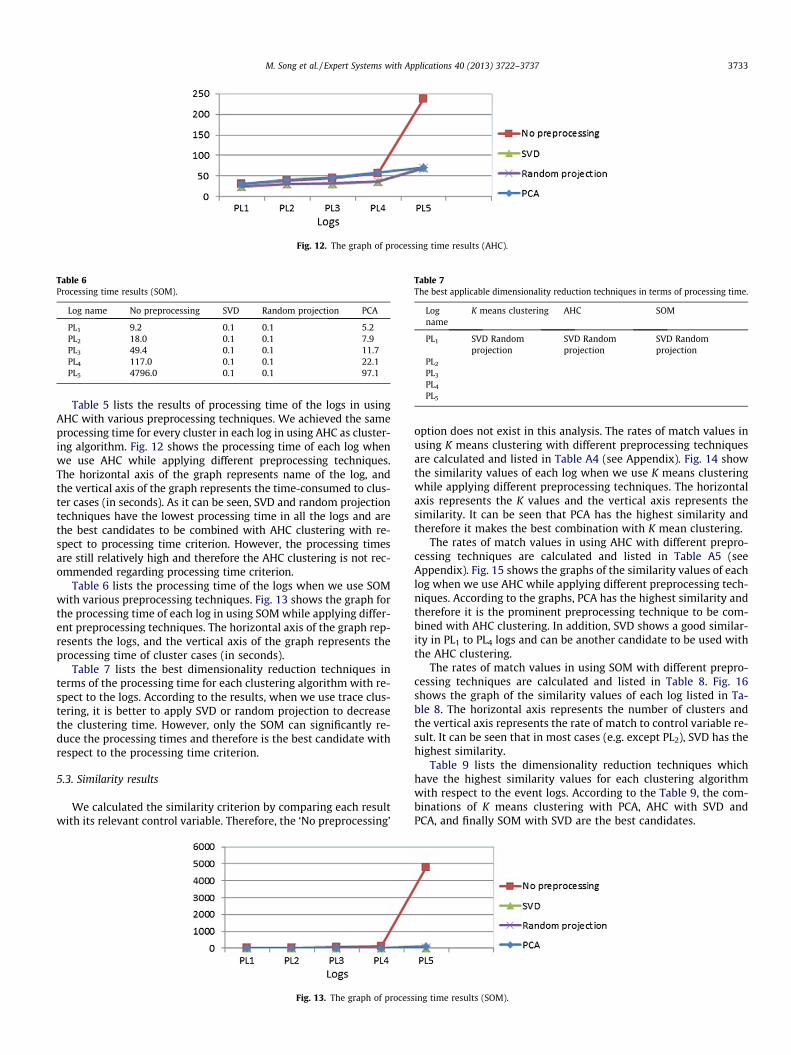
Fig. 12. The graph of processing time results (AHC).
Table 6Processing time results (SOM).
Log name No preprocessing SVD Random projection PCA
PL1 9.2 0.1 0.1 5.2PL2 18.0 0.1 0.1 7.9PL3 49.4 0.1 0.1 11.7PL4 117.0 0.1 0.1 22.1PL5 4796.0 0.1 0.1 97.1
Table 7The best applicable dimensionality reduction techniques in terms of processing time.
Logname
K means clustering AHC SOM
PL1 SVD Randomprojection
SVD Randomprojection
SVD Randomprojection
PL2
PL3
PL4
PL5
M. Song et al. / Expert Systems with Applications 40 (2013) 3722–3737 3733
Table 5 lists the results of processing time of the logs in usingAHC with various preprocessing techniques. We achieved the sameprocessing time for every cluster in each log in using AHC as cluster-ing algorithm. Fig. 12 shows the processing time of each log whenwe use AHC while applying different preprocessing techniques.The horizontal axis of the graph represents name of the log, andthe vertical axis of the graph represents the time-consumed to clus-ter cases (in seconds). As it can be seen, SVD and random projectiontechniques have the lowest processing time in all the logs and arethe best candidates to be combined with AHC clustering with re-spect to processing time criterion. However, the processing timesare still relatively high and therefore the AHC clustering is not rec-ommended regarding processing time criterion.
Table 6 lists the processing time of the logs when we use SOMwith various preprocessing techniques. Fig. 13 shows the graph forthe processing time of each log in using SOM while applying differ-ent preprocessing techniques. The horizontal axis of the graph rep-resents the logs, and the vertical axis of the graph represents theprocessing time of cluster cases (in seconds).
Table 7 lists the best dimensionality reduction techniques interms of the processing time for each clustering algorithm with re-spect to the logs. According to the results, when we use trace clus-tering, it is better to apply SVD or random projection to decreasethe clustering time. However, only the SOM can significantly re-duce the processing times and therefore is the best candidate withrespect to the processing time criterion.
5.3. Similarity results
We calculated the similarity criterion by comparing each resultwith its relevant control variable. Therefore, the ‘No preprocessing’
Fig. 13. The graph of process
option does not exist in this analysis. The rates of match values inusing K means clustering with different preprocessing techniquesare calculated and listed in Table A4 (see Appendix). Fig. 14 showthe similarity values of each log when we use K means clusteringwhile applying different preprocessing techniques. The horizontalaxis represents the K values and the vertical axis represents thesimilarity. It can be seen that PCA has the highest similarity andtherefore it makes the best combination with K mean clustering.
The rates of match values in using AHC with different prepro-cessing techniques are calculated and listed in Table A5 (seeAppendix). Fig. 15 shows the graphs of the similarity values of eachlog when we use AHC while applying different preprocessing tech-niques. According to the graphs, PCA has the highest similarity andtherefore it is the prominent preprocessing technique to be com-bined with AHC clustering. In addition, SVD shows a good similar-ity in PL1 to PL4 logs and can be another candidate to be used withthe AHC clustering.
The rates of match values in using SOM with different prepro-cessing techniques are calculated and listed in Table 8. Fig. 16shows the graph of the similarity values of each log listed in Ta-ble 8. The horizontal axis represents the number of clusters andthe vertical axis represents the rate of match to control variable re-sult. It can be seen that in most cases (e.g. except PL2), SVD has thehighest similarity.
Table 9 lists the dimensionality reduction techniques whichhave the highest similarity values for each clustering algorithmwith respect to the event logs. According to the Table 9, the com-binations of K means clustering with PCA, AHC with SVD andPCA, and finally SOM with SVD are the best candidates.
ing time results (SOM).
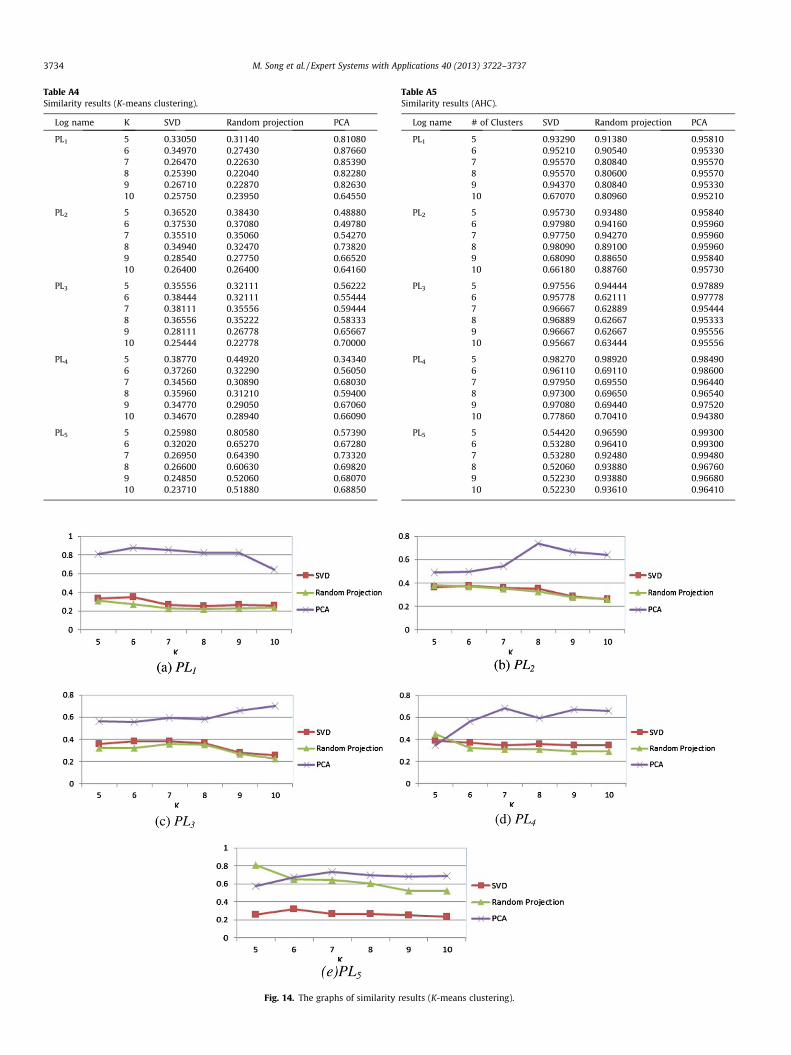
Table A4Similarity results (K-means clustering).
Log name K SVD Random projection PCA
PL1 5 0.33050 0.31140 0.810806 0.34970 0.27430 0.876607 0.26470 0.22630 0.853908 0.25390 0.22040 0.822809 0.26710 0.22870 0.8263010 0.25750 0.23950 0.64550
PL2 5 0.36520 0.38430 0.488806 0.37530 0.37080 0.497807 0.35510 0.35060 0.542708 0.34940 0.32470 0.738209 0.28540 0.27750 0.6652010 0.26400 0.26400 0.64160
PL3 5 0.35556 0.32111 0.562226 0.38444 0.32111 0.554447 0.38111 0.35556 0.594448 0.36556 0.35222 0.583339 0.28111 0.26778 0.6566710 0.25444 0.22778 0.70000
PL4 5 0.38770 0.44920 0.343406 0.37260 0.32290 0.560507 0.34560 0.30890 0.680308 0.35960 0.31210 0.594009 0.34770 0.29050 0.6706010 0.34670 0.28940 0.66090
PL5 5 0.25980 0.80580 0.573906 0.32020 0.65270 0.672807 0.26950 0.64390 0.733208 0.26600 0.60630 0.698209 0.24850 0.52060 0.6807010 0.23710 0.51880 0.68850
Fig. 14. The graphs of similarity results (K-means clustering).
Table A5Similarity results (AHC).
Log name # of Clusters SVD Random projection PCA
PL1 5 0.93290 0.91380 0.958106 0.95210 0.90540 0.953307 0.95570 0.80840 0.955708 0.95570 0.80600 0.955709 0.94370 0.80840 0.9533010 0.67070 0.80960 0.95210
PL2 5 0.95730 0.93480 0.958406 0.97980 0.94160 0.959607 0.97750 0.94270 0.959608 0.98090 0.89100 0.959609 0.68090 0.88650 0.9584010 0.66180 0.88760 0.95730
PL3 5 0.97556 0.94444 0.978896 0.95778 0.62111 0.977787 0.96667 0.62889 0.954448 0.96889 0.62667 0.953339 0.96667 0.62667 0.9555610 0.95667 0.63444 0.95556
PL4 5 0.98270 0.98920 0.984906 0.96110 0.69110 0.986007 0.97950 0.69550 0.964408 0.97300 0.69650 0.965409 0.97080 0.69440 0.9752010 0.77860 0.70410 0.94380
PL5 5 0.54420 0.96590 0.993006 0.53280 0.96410 0.993007 0.53280 0.92480 0.994808 0.52060 0.93880 0.967609 0.52230 0.93880 0.9668010 0.52230 0.93610 0.96410
3734 M. Song et al. / Expert Systems with Applications 40 (2013) 3722–3737
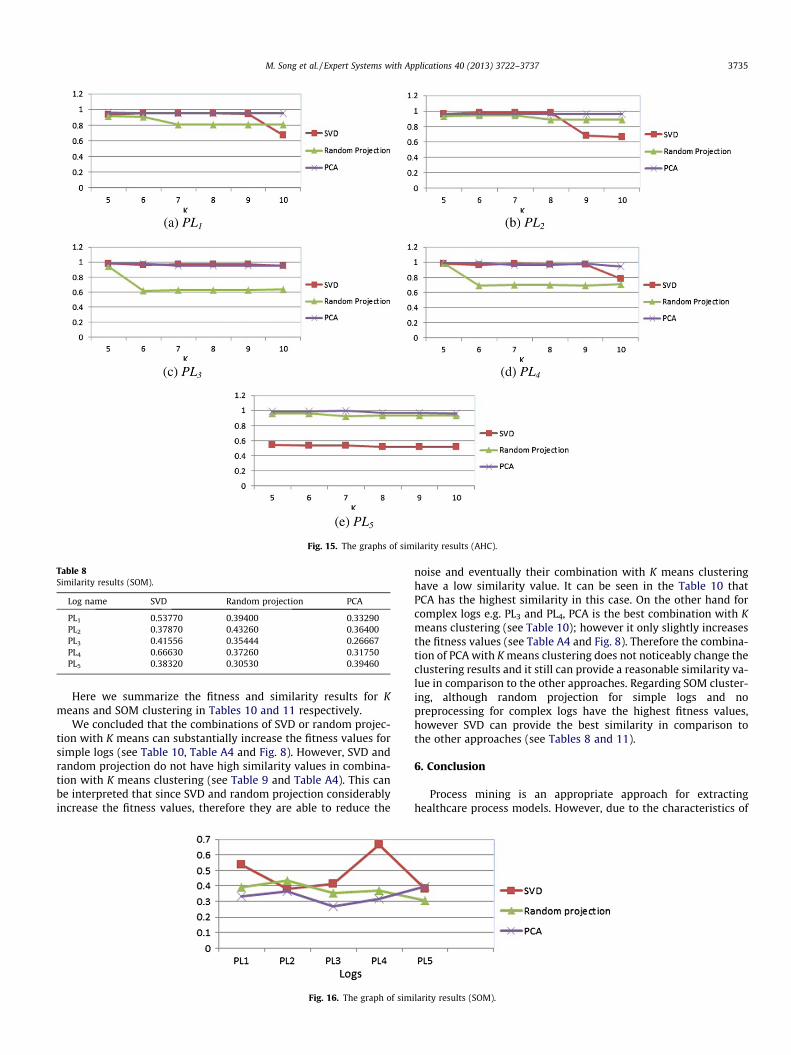
Fig. 15. The graphs of similarity results (AHC).
Table 8Similarity results (SOM).
Log name SVD Random projection PCA
PL1 0.53770 0.39400 0.33290PL2 0.37870 0.43260 0.36400PL3 0.41556 0.35444 0.26667PL4 0.66630 0.37260 0.31750PL5 0.38320 0.30530 0.39460
M. Song et al. / Expert Systems with Applications 40 (2013) 3722–3737 3735
Here we summarize the fitness and similarity results for Kmeans and SOM clustering in Tables 10 and 11 respectively.
We concluded that the combinations of SVD or random projec-tion with K means can substantially increase the fitness values forsimple logs (see Table 10, Table A4 and Fig. 8). However, SVD andrandom projection do not have high similarity values in combina-tion with K means clustering (see Table 9 and Table A4). This canbe interpreted that since SVD and random projection considerablyincrease the fitness values, therefore they are able to reduce the
Fig. 16. The graph of sim
noise and eventually their combination with K means clusteringhave a low similarity value. It can be seen in the Table 10 thatPCA has the highest similarity in this case. On the other hand forcomplex logs e.g. PL3 and PL4, PCA is the best combination with Kmeans clustering (see Table 10); however it only slightly increasesthe fitness values (see Table A4 and Fig. 8). Therefore the combina-tion of PCA with K means clustering does not noticeably change theclustering results and it still can provide a reasonable similarity va-lue in comparison to the other approaches. Regarding SOM cluster-ing, although random projection for simple logs and nopreprocessing for complex logs have the highest fitness values,however SVD can provide the best similarity in comparison tothe other approaches (see Tables 8 and 11).
6. Conclusion
Process mining is an appropriate approach for extractinghealthcare process models. However, due to the characteristics of
ilarity results (SOM).
Table 9The combinations with the highest similarity values.
Log name K means clustering AHC SOM
PL1 PCA PCA SVDPL2 SVD Random projectionPL3 PCA SVDPL4
PL5 PCA SVD PCA
Table 10The dimensionality reduction techniques for K means clustering in terms of fitnessand similarity.
Log name Fitness Similarity
PL1 SVD Random projection PCAPL2
PL3
PL4 PCA PCA
Table 11The dimensionality reduction techniques for SOM clustering in terms of fitness andsimilarity.
Log name Fitness Similarity
PL1, PL2 Random projection SVDPL3, PL4 No preprocessing SVD
3736 M. Song et al. / Expert Systems with Applications 40 (2013) 3722–3737
healthcare processes, the process mining might results complexmodels that are difficult to understand. This motivates the effortsto perform trace clustering techniques to achieve more under-standable process models. In this paper, in order to boast up theperformances of trace clustering algorithms, we applied dimen-sionality reduction techniques. Therefore, we conducted variousexperiments with the patient treatment processes of a Dutch hos-pital to discover relationships and best combinations between thedimensionality reduction techniques and clustering algorithms.
We considered fitness value and processing time as the evalua-tion criteria of clustering results. According to the results, the aver-age fitness value was improved by applying dimensionalityreduction techniques to trace clustering. Moreover, processingtime of trace clustering was effectively reduced with dimensional-ity reduction techniques. In other words, by applying dimensional-ity reduction techniques, we could improve trace clusteringperformances.
The main conclusions can be summarized as follows. First, theresults of using dimensionality reduction techniques in terms offitness could be various depending on the size and complexity ofevent logs as well as the applied clustering algorithms. We realizedthat the combination of K means clustering with SVD or randomprojection has the best fitness value for simple event logs, whereasthe combination of K means with PCA is more suitable for complexevent logs in our case study. Furthermore, when no preprocessingis used SOM performs better for simple logs whereas K means ispreferred for complex event logs. Second, the results show thatthe preprocessing techniques are able to effectively reduce therequired time for trace clustering processes. Among all dimension-ality reduction techniques, SVD and random projection signifi-cantly decrease processing time for trace clustering regardless ofcomplexity of the logs or type of the clustering algorithms.However, the combination of SOM with SVD or random projectionshowed the best processing time. Third, the dimensionalityreduction techniques which result the highest similarity valuesare PCA for K means clustering, SVD and PCA for AHC, and SVDfor SOM.
Acknowledgement
This research was supported by the Basic Science Research Pro-gram through the National Research Foundation of Korea (NRF)funded by the Ministry of Education, Science and Technology(No. 2011-0010561).
References
Achlioptas, D. (2003). Database-friendly random projections: Johnson–Lindenstrauss with binary coins. Journal of Computer and System Sciences,66(4), 671–687.
Bartl, E., Rezanková, H. & Sobisek, L. (2011). Comparison of classical dimensionalityreduction methods with Novel approach based on formal concept analysis. In J.Yao, S. Ramanna, G. Wang, & Z. Suraj, (Eds.), Rough sets and knowledge technology(RSKT 2011), October 9–12 2011, Banff, Canada. Lecture notes in computer science(Vol. 6954, pp. 26–35). Springer.
Bécavin, C., Tchitchek, N., Mintsa-Eya, C., Lesne, A., & Benecke, A. (2011). Improvingthe efficiency of multidimensional scaling in the analysis of high-dimensionaldata using singular value decomposition. Bioinformatics, 27(10), 1413–1421.
Bingham, E., & Mannila, H. (2001). Random projection in dimensionality reduction:applications to image and text data. In Proceedings of the seventh ACM SIGKDDinternational conference on knowledge discovery and data mining (KDD 2001),August 26–29 2001, ACM: San Francisco, CA, USA. pp. 245–250.
Jagadeesh Chandra Bose, R. P. & van der Aalst, W. M. P. (2009). Context Aware TraceClustering: Towards Improving Process Mining Results. In Proceedings of theSIAM international conference on data mining (SDM 2009), April 30–May 2 2009.(pp. 401–412). Sparks, Nevada, USA.
Cil, I. (2012). Consumption universes based supermarket layout through associationrule mining and multidimensional scaling. Expert Systems with Applications,39(10), 8611–8625.
de Medeiros, A. K. A., van der Aalst, W. M. P., & Weijters, A. J. M. M. (2003).Workflow Mining: Current status and future directions. In: R. Meersman, Z. Tari,D. C. Schmidt, (Eds.), On the move to meaningful internet systems 2003: CoopIS,DOA, and ODBASE – OTM confederated international conferences (CoopIS, DOA, andODBASE 2003), November 3–7 2003. Catania, Sicily, Italy, Lecture notes in computerscience (Vol. 2888, pp. 389–406). Springer.
de Medeiros, A. K. A., & Weijters, A. J. M. M. (2005). Genetic process mining. Lecturenotes in computer science (Vol. 3536, pp. 48–69). Springer.
Duda, R. O., Hart, P. E. & Stork, D. G. (2000). Pattern classification (2nd ed.). JohnWiely and Sons: New York.
Goedertier, S., Weerdt, J. D., Martens, D., Vanthienen, J., & Baesens, B. (2011). Processdiscovery in event logs: An application in the telecom industry. Applied SoftComputing, 11(2), 1697–1710.
Goldberg, K., Roeder, T., Gupta, D., & Perkins, C. (2001). Eigentaste: A constant timecollaborative filtering algorithm. Information Retrieval Journal, 4(2), 133–151.
Golub, G. H., & Reinsch, C. (1970). Singular value decomposition and least squaressolution. Numerische Mathematik, 14(5), 403–420.
Gong, Y. & Liu, X. (2000). Video Summarization using Singular Value Decomposition.In 2000 conference on computer vision and pattern recognition (CVPR 2000), June13–15 2000, (Vol. 1, pp. 174–180). Hilton Head, SC, USA: IEEE Computer Society.
Greco, G., Guzzo, A., Pontieri, L., & Sacca, D. (2006). Discovering expressive processmodels by clustering log traces. IEEE Transactions on Knowledge and DataEngineering, 18(8), 1010–1027.
G}unther, C. W. & van der Aalst, W. M. P. (2007). Fuzzy Mining – Adaptive ProcessSimplification Based on Multi-Perspective Metrics. In G. Alonso, P. Dadam, & M.Rosemann (Eds.), Business process management, 5th international conference(BPM 2007), September 24–28 2007, Brisbane, Australia: Proceedings. Lecturenotes in computer science (Vol. 4714, pp. 328–343). Springer.
Jain, A. K., & Dubes, R. C. (1988). Algorithms for clustering data. Englewood Cliffs:Prentice-Hall Inc.
Jans, M., van der Werf, J. E. M., Lybaert, N., & Vanhoof, K. (2011). A business processmining application for internal transaction fraud mitigation. Expert Systems withApplications, 38(10), 13351–13359.
Jeong, S., Kim, S. W., Kim, K. & Choi, B. U. (2006). An effective method forapproximating the euclidean distance in high-dimensional space. In S. Bressan, J.Küng, & R. Wagner (Eds.), Database and expert systems applications 17thinternational conference (DEXA 2006) September 4–8 2006. Kraków, Poland:Proceedings. Lecture notes in computer science (Vol. 4080, pp. 863–872). Springer.
Johnson, W. B., & Lindenstrauss, J. (1984). Extensions of lipshitz mapping intoHilbert space. Contemporary Mathematics, 26, 189–206.
Lemos, A. M., Sabino, C. C., Lima, R. M. F., & Oliveira, C. A. L. (2011). Using processmining in software development process management: A case study. InProceedings of the IEEE international conference on systems, man and cybernetics(SMC 2011). October 9–12 2011. (pp. 1181–1186). Anchorage, Alaska, USA.
Liu, J., & Kavakli, M. (2010). Hand gesture recognition based on segmented singularvalue decomposition. In R. Setchi, I. Jordanov, R. J. Howlett, & L. C. Jain (Eds.),Knowledge-based and intelligent information and engineering systems – 14thinternational conference (KES 2010), September 8–10 2010. (pp. 214–223)Cardiff, UK.
Ma, J., Parhi, K. K., & Deprettere, E. F. (2001). A unified algebraic transformationapproach for parallel recursive and adaptive filtering and SVD algorithms. IEEETransactions on Signal Processing, 49(2), 424–437.

M. Song et al. / Expert Systems with Applications 40 (2013) 3722–3737 3737
MacQueen, J. (1967). Some methods for classification and analysis of multivariateobservation. In Proceedings of the 5th berkeley symp. on mathematical statisticsand probability. (pp. 281–297). University of California Press.
Mans, R. S., Schonenberg, M. H., Song, M., van der Aalst, W. M. P., & Bakker, P. J. M.(2008). Process mining in healthcare – a case study. In L. Azevedo & A. R.Londral (Eds.), Proceedings of the first international conference on healthinformatics (HEALTHINF’08), January 28–31 2008. Funchal, Madeira, Portugal:Institute for Systems and Technologies of Information, Control andcommunication. (pp. 118–125). IEEE Computer Society.
Markos, A. I., Vozalis, M. G. & Margaritis, K. G. (2010). An optimal scaling approachto collaborative filtering using categorical principal component analysis andneighborhood formation. In H. Papadopoulos, A. S. Andreou, & M. Bramer (Eds.),Artificial intelligence applications and innovations (AIAI 2010), October 6–7 2010.Larnaca, Cyprus: Proceedings. IFIP Advances in information and communicationtechnology (Vol. 339, pp. 22–29). Springer.
Maruster, L., & Beest, N. R. T. P. (2009). Redesigning business processes: Amethodology based on simulation and process mining techniques. KnowledgeInformation Systems, 21, 267–297. v.
Megalooikonomou, V., Li, G., & Wang, Q. (2008). A dimensionality reductiontechnique for efficient time series similarity analysis. Information Systems, 33(1),115–132.
Meulman, J., van der Kooij, A., & Heiser, W. (2004). Principal components analysiswith nonlinear optimal scaling transformations for ordinal and nominal data. InD. Kaplan (Ed.), Handbook of quantitative methods in the social sciences. NewburyPark: Sage Publications.
Nicholas, C. K., & Dahlberg, R. (1998). Spotting Topics with the Singular ValueDecomposition. In E. V. Munson, C. K. Nicholas, & D. Wood (Eds.), Principles ofdigital document processing, 4th International workshop (PODDP’98), March 29–30 1998. Saint Malo, France: Proceedings. Lecture notes in computer science (Vol.1481, pp. 82–91). Springer.
Pelleg, D., & Moore, A. W. (2000). X-means: Extending K means with efficientestimation of the number of clusters. In P. Langley (Eds), Proceedings of theseventeenth international conference on machine learning (ICML 2000), June 29–July 2, 2000. Stanford University: Stanford, CA, USA. (pp. 727–734). MorganKaufmann.
Process Mining Group, Math&CS department, Eindhoven University of Technology(2009). <http://www.processmining.org/prom/start>.
Rebuge, A., & Ferreira, D. R. (2012). Business process analysis in healthcareenvironments: A methodology based on process mining. Information Systems,37(2), 99–116.
Reijers, H. A., Song, M., & Jeong, B. (2009). Analysis of a collaborative workflowprocess with distributed actors. Information Systems Frontiers, 11(3), 307–322.
Rozinat, A., Jong, I. S. M. d., Günther, C. W., & van der Aalst, W. M. P. (2009). Processmining applied to the test process of wafer scanners in ASML. In IEEETransactions on Systems, Man, and Cybernetics, Part C (RSMC), 39, 474–479.
Rozinat, A., & van der Aalst, W. M. P. (2008). Conformance checking of processesbased on monitoring real behavior. Information Systems, 33(1), 64–95.
Sano, A. (1993). Optimally regularized inverse of singular value decomposition andapplication to signal extrapolation. Signal Processing, 30, 163–176.
Sarwar, B. M., Karypis, G., Konstan, J. A. & Riedl, J. T. (2000). Application ofdimensionality reduction in recommender systems – a case study. ACMWebKDD 2000 web mining for E-commerce, Workshop. (pp. 82–90).
Song, M., Gunther, C. W., & van der Aalst, W. M. P. (2008). Trace clustering in processmining. In D. Ardagna, M. Mecella, & J. Yang (Eds.), Business process managementworkshops (BPM 2008), September 1–4 2008. Milano, Italy. Lecture notes inbusiness information processing (Vol. 17, pp. 109–120). Springer.
Song, M., & van der Aalst, W. M. P. (2008). Towards comprehensive support fororganizational mining. Decision Support Systems, 46(1), 300–317.
Tan, P.-N., Steinbach, M., & Kumar, V. (2006). Introduction to data mining. Boston,MA, USA: Pearson Addison Wesley.
Tsai, C.-Y., Jen, H., & Chen, I.-C. (2010). Time-interval process model discovery andvalidation – a genetic process mining approach. Applied Intelligence, 33(1),54–66.
van der Aalst, W. M. P., & de Medeiros, A. K. A. (2005). Process mining and security:Detecting anomalous process executions and checking process conformance.Electronic Notes in Theoretical Computer Science, 121, 3–21.
van der Aalst, W. M. P., Reijers, H. A., Weijters, A. J. M. M., van Dongen, B. F., deMedeiros, A. K. A., Song, M., et al. (2007). Business process mining: an industrialapplication. Information Systems, 32(5), 713–732.
van der Aalst, W. M. P., Weijters, A. J. M. M., & Maruster, L. (2004). Workflowmining: Discovering process models from event logs. IEEE Transactions onKnowledge and Data Engineering, 16(9), 1128–1142.
Veiga, G. M., & Ferreira, D. R. (2009). Understanding spaghetti models withsequence clustering for ProM. In Business Process Management Workshops (BPI2009) (pp. 92–103). Germany: Ulm.
Wall, M., Rechtsteiner, A., & Rocha, L. M. (2003). Singular value decomposition andprincipal component analysis. In I. D. P. Berrar, W. Dubitzky, & M. Granzow(Eds.), A practical approach to microarray data analysis. Norwell, MA: Springer,Kluwer.
Weijters, A., van der Aalst, W. M. P., & de Medeiros, A. K. A. (2006). Process miningwith the heuristics miner algorithm. In BETA working paper series WP 166.Eindhoven University of Technology: Eindhoven.
Witten, I. H., Frank, E., & Hall, M. A. (2011). Data mining: Practical machine learningtools and techniques. San Francisco: Morgan Kaufmann Publishers Inc..
Xu, X., & Wang, X. (2005). An adaptive network intrusion detection method basedon PCA and support vector machines. In X. Li, S. Wang, Z. Y. Dong (Eds.),Advanced data mining and applications, first international conference (ADMA2005), July 22–24, 2005. Wuhan, China: Proceedings. Lecture notes in computerscience (Vol. 3584, pp. 696–703). Springer.
Ying, C. L. & Jin, A. T. B. 2007. Probabilistic random projections and speakerverification. In S. -W. Lee & S. Z. Li (Eds.), Advances in biometrics, Internationalconference (ICB 2007). August 27–29 2007. Seoul, Korea: Proceedings. Lecturenotes in computer science (Vol. 4642, pp. 445–454). Springer.
Zhang, Z., Jiang, M., & Ye, N. (2010). Effective multiplicative updates for non-negative discriminative learning in multimodal dimensionality reduction.Artificial Intelligence Review, 34(3), 235–260.
Zho, Y., & Karypis, G. (2005). Hierarchical clustering algorithms for documentdatasets. Data Mining and Knowledge Discovery, 10(2), 141–168.
![Dimensionality Reduction and Clustering on Statistical ... › ~ftorre › ca › ca_final_version › p27.pdf · Statistical manifold [16] is a 2D Riemannian manifold which is statistically](https://img.dokumen.tips/doc/110x75/5f1061ff7e708231d448d659/dimensionality-reduction-and-clustering-on-statistical-a-ftorre-a-ca-a.jpg)


![NGCRC_Final_Report_Template.docx - cs.purdue.edu · Web viewalgorithms [53], and advanced . clustering. techniques to achieve high dimensionality and to label the data and prepare](https://img.dokumen.tips/doc/110x75/5c165b2209d3f252588c8181/ngcrcfinalreport-cspurdueedu-web-viewalgorithms-53-and-advanced-clustering.jpg)


![Schmidt Futures arXiv:2003.11755v1 [cs.LG] 26 Mar 2020 · In Section7.2.2, we discuss how dimensionality reduction and clustering can be used on the hidden representationsofneuralnetworks](https://img.dokumen.tips/doc/110x75/5f2b22697194081597293ae5/schmidt-futures-arxiv200311755v1-cslg-26-mar-2020-in-section722-we-discuss.jpg)


![The Challenges of Clustering High Dimensional Datakumar/papers/high_dim_clustering_1… · dimensional data must deal with the “curse of dimensionality” [Bel61], which, in general](https://img.dokumen.tips/doc/110x75/5f07557f7e708231d41c77f8/the-challenges-of-clustering-high-dimensional-data-kumarpapershighdimclustering1.jpg)