Embed Size (px)
Citation preview
Loughborough UniversityInstitutional Repository
A comparative study ofcoupled preferential
crystallizers for the efficientresolution of
conglomerate-formingenantiomers
This item was submitted to Loughborough University's Institutional Repositoryby the/an author.
Citation: MAJUMDER, A. and NAGY, Z.K., 2017. A comparative studyof coupled preferential crystallizers for the efficient resolution of conglomerate-forming enantiomers. Pharmaceutics, 9 (4), 55.
Additional Information:
• This is an Open Access Article. It is published by MDPIunder the Creative Commons Attribution 4.0 International Li-cence (CC BY). Full details of this licence are available at:http://creativecommons.org/licenses/by/4.0/
Metadata Record: https://dspace.lboro.ac.uk/2134/28415
Version: Published
Publisher: MDPI c© The Authors
Rights: This work is made available according to the conditions of the CreativeCommons Attribution 4.0 International (CC BY 4.0) licence. Full details of thislicence are available at: http://creativecommons.org/licenses/ by/4.0/
Please cite the published version.

pharmaceutics
Article
A Comparative Study of Coupled PreferentialCrystallizers for the Efficient Resolution ofConglomerate-Forming Enantiomers
Aniruddha Majumder 1,2,* and Zoltan K. Nagy 2,3
1 School of Engineering, University of Aberdeen, Aberdeen AB24 3UE, UK2 Department of Chemical Engineering, Loughborough University, Loughborough LE11 3TU, UK;
[email protected] Davidson School of Chemical Engineering, Purdue University, West Lafayette, IN 47907-2100, USA* Correspondence: [email protected]; Tel.: +44-(0)1224-272499
Received: 21 September 2017; Accepted: 23 November 2017; Published: 5 December 2017
Abstract: The separation of enantiomers is of great importance due to their possible differencesin therapeutic properties. Preferential crystallization in various configurations of coupled batchcrystallizers is used as an attractive means to separate the conglomerate-forming enantiomers fromracemic mixtures. However, the productivity of such batch processes can be limited by the nucleationof the counter enantiomer and consumption of the supersaturation. In this work, a recently proposedprocess configuration, which uses coupled mixed suspension mixed product removal (MSMPR)with liquid phase exchange, is investigated by simulation studies. A detailed study on the effect ofprocess parameters (e.g., feed flow rate, seed mass, and liquid phase exchange) on the productivityand yield of the coupled MSMPR has been presented. Moreover, a comparison of various coupledcrystallizer configurations is carried out. It is shown through simulation studies that the productivityof the enantiomeric separation can be significantly improved compared to the previously proposedbatch modes when the continuous configuration is used. The effect of nucleation kinetic parameterson the performances of various crystallizer configurations is studied as well. A set of coupledpopulation balance equations (PBEs) was used to describe the evolution of the crystal phase of theboth enantiomers in each vessel. These equations were solved numerically using the quadraturemethod of moments. The insights obtained in this study will be useful in the process design ofcoupled crystallizer systems.
Keywords: chiral resolution; coupled crystallizer; crystallization modelling; enantioseparation; MSMPR
1. Introduction
Enantiomers are the result of the chirality or handedness of molecules which are thenon-superimposable mirror images of each other. Enantiomers are widely found in organic compoundsand their separation is a major concern in the modern pharmaceutical, food, and agricultural industries.Separation of the enantiomorphs is particularly important in pharmaceutical industry, since very oftenone of the enantiomers exhibits the intended therapeutic activity while the other is inert. Moreover,in some cases the counter enantiomer can cause toxicity or adverse effects. For example, S(−)-fluoxetineshows remarkable therapeutic effects in preventing migraines, while the racemic (equimolar mixtureof both enantiomers) drug (the antidepressant Prozac) has no effect [1]. Thalidomide consisting of S(−)and R(+) enantiomers can interconvert under physiological conditions. R(+)-thalidomide seems toact as a sedative while S(−)-thalidomide and its derivatives are reported to be teratogenic (causingmalformations of an embryo or fetus) [2]. Thus, it is demanded by the regulating authorities thatthe chiral drugs are administered in an optically pure form [3]. This stringent regulatory policy has
Pharmaceutics 2017, 9, 55; doi:10.3390/pharmaceutics9040055 www.mdpi.com/journal/pharmaceutics

Pharmaceutics 2017, 9, 55 2 of 19
intensified efforts in industrial and academic research to develop processes that are able to producepure enantiomers.
There are two major strategies to obtain a single pure enantiomer: (1) the ‘chiral approach’ is basedon developing the asymmetric synthesis of the selected enantiomer; and (2) the ‘racemic approach’is based on the separation of the mixture of two enantiomers [4]. Although ideal, the asymmetricsynthesis route can be time-consuming to develop. Moreover, the number of highly selective reactionsthat supply pure enantiomers on an industrially relevant scale is still limited [4]. Conversely, the latteris the most widely used approach to produce preferred enantiomers, since the enantiomers aretypically readily available in racemic composition. Various means available for the resolution ofenantiomers include classical chiral separation techniques such as preferential crystallization [5–13],Viedma ripening [14–16], chromatography [1,17–19], and membrane separation [20,21]. Some hybridtechniques coupling chromatography and crystallization are also proposed [22–24]. A more detailedreview of the various techniques can be found in Lorenz and Seidel-Morgenstern [4].
Among various means, preferential crystallization is an attractive and efficient way to separatethe racemic mixtures since no auxiliaries and reagents other than solvent are needed [10]. However,preferential crystallization can only be used for conglomerate-forming systems (which make up 10%of the available enantiomers [5]). In such systems the stable crystalline phases consist of either thepure S enantiomer or pure R enantiomer. This is in contrast to the racemic compound-forming systemwhere there is an additional racemic phase consisting of equal amounts of R and S enantiomers.Crystallization can be carried out in standard equipment readily available in pharmaceutical andfine chemical industries. Manufacturing methods of the enantiomorphic drug are still dominatedby crystallization [4]. In preferential crystallization, the process is operated in the metastablezone, i.e., a region in the phase diagram where the solution is thermodynamically unstable butkinetically inhibited based on different initial surface areas [25]. Addition of the homochiralseeds at this stage favours the crystallization of a particular enantiomer which can be harvestedas solid phase thus providing enantioseparation. In particular, it has been shown that batchcoupled preferential crystallizer (CPC) with liquid exchange can be used as an attractive means ofenantioseparation [9,10,25]. However, the productivity of the regular CPC is limited by the depletionof the supersaturation. Moreover, it has been shown that a variant of the CPC configuration, coupledpreferential crystallization-dissolution (CPC-D), can increase the productivity [11,26]. This alternativeconfiguration is based on coupling preferential crystallization in one vessel, with selective dissolutionof the solid racemate in the other. However, in this process configuration, one needs to collect thepure crystals within a window of time determined by the appearance of the counter enantiomer in thecrystallization vessel and complete dissolution of one enantiomer in the dissolution vessel [11,26].
Recently, a continuous version of the CPC configuration was proposed [27–29]. This configurationutilizes two mixed suspension mixed product removal (MSMPR) crystallizers which are coupledthrough solid free liquid phase exchange, henceforth referred as CPC-MSMPR. Theoretical andexperimental investigations demonstrate the efficiency and increased productivity of the CPC-MSMPRconfiguration [27,28,30]. However, a thorough comparison of the various coupled crystallizerconfigurations for the separation of enantiomorphs has not been performed. The objective of this studyis to compare the performance of CPC, CPC-D, and CPC-MSMPR in terms of productivity and yield.Furthermore, the effect of various process parameters (e.g., feed flow rate, seed mass, and liquid phaseexchange rate) on the productivity and yield of the CPC-MSMPR is studied. The details of the coupledcrystallizer configurations are discussed next.
2. Coupled Preferential Crystallizer Configurations
2.1. CPC-MSMPR Configuration
As shown in Figure 1a, the process configuration involves two mixed suspension mixed productremoval (MSMPR) crystallizers maintained at a temperature lower than the saturation temperature

Pharmaceutics 2017, 9, 55 3 of 19
and coupled through liquid phase exchange. The MSMPR crystallizers are mixed well enough toensure uniform conditions. The process starts with a supersaturated racemic solution in both thevessels. Slurry containing racemic solution and seeds of the opposite homochiral enantiomers iscontinuously fed into two different vessels. The continuous supply of seeds can be maintained byultrasonic comminution of crystals, withdrawn from the bottom of the MSMPR crystallizers [12].This slurry addition allows growth and nucleation of the opposite enantiomers in the different MSMPRcrystallizers while almost completely suppressing the nucleation of the counter enantiomers. The equalvolume of slurry will be continuously taken out of each crystallizer as a product stream in order tomaintain the same slurry volume within the crystallizers. Due to selective crystallization in each vessel,e.g., E1 in Tank 1 and E2 in Tank 2, the concentration of the preferred enantiomer in the liquid phasedecreases. The liquid phase exchange between the vessels makes up this depletion of the preferredenantiomer to some extent while reducing the concentration of the counter enantiomer, and thus helpsto prevent the primary nucleation of counter enantiomer.
2.2. CPC Configuration
This configuration, shown in Figure 1b, is the batch version of the CPC-MSMPR, i.e., there areno continuous feed and product removals. The process starts when homochiral seeds are introducedin the vessels containing racemic solution at a temperature lower than the saturation temperature(i.e., in the metastable zone). As a result, preferential crystallization of seeded enantiomers takes placein each tank. The solid free liquid phases are exchanged between the two vessels. The process can berun until the supersaturation is depleted or the counter enantiomorph appears in any vessel due tonucleation. The product crystals are obtained at the end of the batch.
2.3. CPC-D Configuration
This configuration is run in batch mode. However, the two tanks are maintained at two differenttemperatures as shown in Figure 1c. At first, both the tanks are fed with racemic liquid solution.The temperature of Tank 1 is lower than the saturation temperature but within the metastable zone.Tank 2 is maintained at the saturation temperature and a racemic solid mixture is added to Tank 2.The process begins when Tank 1 is seeded with enantiopure seeds, E1. Since the liquid phase issupersaturated in Tank 1, preferential crystallization of the seeded enantiomorph E1 takes place andsolid mass increases. Due to the exchange of solid free liquid phase, the solution in Tank 2 becomesunder-saturated with respect to E1. This leads to the selective dissolution of E1 in Tank 2. As a result,concentration of E1 in Tank 2 increases until saturation concentration is reached. The liquid phaseexchange also ensures that depletion of E1 in Tank 1 is partially compensated. The counter enantiomerE2 remains in solid form in Tank 2 as the concentration of E2 is not affected by the crystallization ofE1. The process can be run until primary nucleation for E2 is detected in Tank 1 or dissolution of E1 iscomplete in Tank 2.
In this study, the preferential crystallization of amino acid threonine dissolved in water is used asa model system. The process is modeled using widely used population balance equation (PBE) [28,30]coupled with the mass balance equation. The required growth and nucleation kinetic parameters areexperimentally estimated and validated [10,11], and are presented in tabular form in the Appendix.

Pharmaceutics 2017, 9, 55 4 of 19
Feed(E1 seed)
Feed(E2 seed)
MSMPR 1 MSMPR 2
E1 Product
E2 Product
T<Tsat T<Tsat
(a)
T<Tsat T<Tsat
Tank 1 Tank 2Crystallization of E1 Crystallization of E2
(b)
T<Tsat T=Tsat
Tank 1 Tank 2Crystallization of E1 Dissolution of E1
(c)
Figure 1. (a) Coupled preferential crystallization in MSMPR crystallizers (CPC-MSMPR), where eachvessel initially containing supersaturated racemic solution is continuously fed with a slurry containingthe seed of the specific enatiomorph. Exchange of liquid phase makes use of the depletion of the counterenantiomer in the other vessel; (b) The coupled preferential crystallizer (CPC) configuration, which issimilar to CPC-MSMPR except that there is no continuous feed and product removal; (c) The coupledpreferential crystallization-dissolution (CPC-D) configuration, which is similar to CPC except thatTank 2 (seeded with racemic solid) is maintained at saturation temperature so that dissolution ofcounter enantiomorph E1 takes place.
3. Model of the Coupled Crystallization Process
The model presented here is based on Eicke et al. [11] and has been verified experimentally. In acrystallizer, crystals are dispersed in a continuous phase or solution phase. The population balanceequation (PBE) is used to describe the evolution of the crystal size distribution (CSD) in MSMPRas follows
∂ f (j)k
∂t+
∂
∂L(R(j)
k f (j)k ) =
qV( f (j)
k, f eed − f (j)k ); j ∈ {T1, T2}, k ∈ {E1, E2}, (1)
where f (j)k is the number density or CSD of enantiomer k in Tank j where T1 and T2 stand for Tank 1
and Tank 2, respectively, L is the characteristic size of the crystals, R(j)k is either the size-dependent
growth rate, G(j)k , or dissolution rate, D(j)
k , depending on the degree of supersaturation, S(j)k
R(j)k =
G(j)
k for S(j)k > 1,
0 for S(j)k = 0,
D(j)k for S(j)
k < 1,
j ∈ {T1, T2}, k ∈ {E1, E2}, (2)

Pharmaceutics 2017, 9, 55 5 of 19
q is the volumetric flow rate for the feed (q = 0 for batch configuration) and product stream, and V isthe volume of the crystallizer. The necessary initial and boundary conditions required are
f (j)k (L, t)|t=0 = f (j)
k,seed(L, t), (3)
f (j)k (L, t)|L=L0 =
B(j)
k
G(j)k
for S(j)k ≥ 1,
0 for S(j)k < 1,
j ∈ {T1, T2}, k ∈ {E1, E2}, (4)
where B(j)k is the rate of nucleation which is assumed to be taking place at size L0. It is further assumed
that the particles vanish at size L0 during dissolution. In this technique, both the MSMPR crystallizersare fed with one pure enantiomer of an opposite kind
f (T1)k, f eed =
f (T1)E1,seed
for k = E1,
0 for k = E2,(5)
f (T2)k, f eed =
0 for k = E1,
f (T2)E2,seed
for k = E2,(6)
The measured CSDs of threonine-controlled samples (sample size >500 particles) can beapproximated by a log-normal distribution with sufficient accuracy in terms of the characteristic length
f (j)k,seed = A(j)
k,seed1
√2πσ
(j)ln,kL
exp
−12
ln
L
L(j)mean,k
1
σ(j)ln,k
2 . (7)
The parameter A(j)k,seed is the ratio of the mass of seeds and the mass of the control sample given by
A(j)k,seed =
m(j)k,seed
kvρs∫ ∞
0 L3 f (j)k,csdL
=m(j)
k,seed
kvρsµ(j)3,k,cs
, (8)
where f (j)k,cs and µ
(j)3,k,cs are the CSD and third moment of the control sample, respectively.
In order to track the liquid phase concentration the mass balance has to be considered as follows
dm(j)k,L
dt= Fexρ
(j∗)L w(j∗)
k,L − Fexρ(j)L w(j)
k,L − 3kvρs
∫ ∞
0L2R(j)
k f (j)k dL
+qρ(j)L, f eedw(j)
k,L, f eed − qρ(j)L w(j)
k,L, (9)
j∗ 6= j with j, j∗ ∈ {T1, T2}
where m(j)k,L is the mass of enantiomorph k at the liquid phase in Tank j, Fex is the volumetric liquid
phase exchange rate, ρL is the current density of the liquid phase, and w(j)k,L is the mass fraction of each
component defined as
w(j)k,L =
m(j)k,L
∑k m(j)k,L + mH2O
. (10)

Pharmaceutics 2017, 9, 55 6 of 19
The mass of water mH2O is assumed to be constant in both the tanks. The density of the liquidphase can be calculated by an empirical formula taking into account the composition as follows
ρ(j)L (t) = ρ
(j)H2O(T
(j)) + K3 ∑k
w(j)L (t), (11)
ρ(j)H2O(T
(j)) =1
K1 + K2(T(j))2, (12)
where ρ(j)H2O denotes the density of water at a given temperature and K1, K2, and K3 are constants.
The supersaturation driving force is expressed as a ratio of the present mass fraction and theequilibrium mass fraction as
S(j)k (t) =
w(j)k,L(t)
w(j)k,L,eq(T
(j)). (13)
The solubility of the DL-threonine in water for a relatively wide temperature and compositionrange is given by the following expression
w(j)k,L,eq(T
(j)) = a2sol
[w(j)
k∗,L(t)]2
+ a1solw(j)k∗,L(t) + msolT + bsol , (14)
k∗ 6= k with k, k∗ ∈ {E1, E2}. (15)
The empirical size-dependent growth rate expression is found to be as follows
G(j)k (t, L) = k(j)
g (T(j))[S(j)
k (t)− 1]g
(1 + aASLL)γ, (16)
where k(j)g is the temperature-dependent rate constant
k(j)g (T(j)) = kg,e f f exp
(−
EA,g
RgT(j)
), (17)
where the pre-exponential factor kg,e f f , is a constant model parameter. On the other hand, the dissolutionrate in undersaturated solution is found to be
D(j)k (t, L) = kdiss [S− 1] . (18)
New particles are born in a supersaturated solution due to primary and secondary nucleation.The secondary nucleation of enantiomer k takes place predominantly if crystals of that enantiomer arealready present. It can be expressed as
B(j)sec(t) = k(j)
b,sec(T)[S(j)
k − 1]b,sec [
µ(j)3,k(t)
]nµ3, (19)
k(j)b,sec(T) = kb,sec,e f f exp
(−
EA,b
RgT(j)
), (20)
where µ3,k is the third moment of the enantiomer k. The temperature-dependent rate constant kb,sec isexpressed by an Arrhenius-type equation. The primary nucleation takes place in the clear solution
B(j)k,prim = knuc
[S(j)
k − 1]bnuc
Ψ(tind), (21)

Pharmaceutics 2017, 9, 55 7 of 19
where induction time tind, defined as the time difference between reaching the initial degree ofsupersaturation and the point of first measured concentration decrease in the liquid phase underseeded conditions, is introduced that describes the experimental observations reasonably well [11].Ψ is the sigmoid function where the steepness is determined by the second parameter φ
Ψ(tind) =12+
1π
arctan[φ(t− tind)]. (22)
All the required parameters are listed in Table A1 in the Appendix. The resulting PBEs are solvednumerically for the moments of distribution using quadrature method of moments (QMOM) [31].QMOM transforms the PBEs to a set of ordinary differential equations (ODEs) describing the evolutionof moments of distribution. QMOM has been chosen for solving the PBEs as the method of moments(MOM) is not able close the moment chain for this system, a common issue encountered when growthrate is a nonlinear function of crystal size. The resulting set of ODEs coupled with the mass balanceequation are solved in Matlab using standard ODE solvers.
4. Results and Discussion
4.1. DL-threonine/H2O as Model System
The well-investigated DL-threonine/H2O is chosen as a model system for these studies [11].The kinetic parameters for DL-threonine are identical for both the enantiomers. For the CPC-MSMPRconfiguration, two MSMPR vessels of volume V = 0.45 L are connected together with exchange ofliquid phase. The vessels contain racemic liquid phase at 36 ◦C (Tsat = 45 ◦C) with homochiral solidphase. The feed streams with the same conditions are fed to each vessel. In order to the keep slurryvolume constant, the same amount of slurry as the feed stream is taken out of the vessels as the productstream. The results obtained from CPC-MSMPR are compared with the conventional CPC and CPC-Dconfigurations. The condition for CPC configuration is similar to CPC-MSMPR except that there are nofeed and product streams. For CPC-D, the condition for the crystallization vessel (Tank 1) is same asCPC. However, the dissolution vessel (Tank 2) is at saturation temperature Tsat = 45 ◦C and it containsa racemic solid phase. The process conditions are summarized in Table 1.
Table 1. Process conditions used in simulation studies for coupled preferential crystallization inMSMPR crystallizers (CPC-MSMPR), coupled preferential crystallization (CPC) in batch mode andcoupled preferential crystallization-dissolution (CPC-D) in batch mode.
CPC-MSMPR CPC CPC-D
Variable Tank 1 Tank 2 Tank 1 Tank 2 Tank 1 Tank 2
Liquid phase mrac,L 97.48 g 97.48 g 97.48 g 97.48 g 97.48 g 97.48 gmH2O 369.83 g 369.83 g 369.83 g 369.83 g 369.83 g 369.83 g
Solid phase mE1,S (L-threonine) 2.00 g − 2.00 g − 2.00 g 35.00 gmE2,S (D-threonine) − 2.00 g − 2.00 g − 35.00 g
Temperatures T(T1)cryst; T(T2)
cryst 36 ◦C 36 ◦C 36 ◦C 36 ◦C 36 ◦C 45 ◦CExchange rate Fex 80 mL min−1 80 mL min−1 80 mL min−1
Feed rate q 80 mL min−1 80 mL min−1 − − − −Removal rate q 80 mL min−1 80 mL min−1 − − − −
Eicke et al. [11] have shown the ability of the model to predict the preferential crystallizationprocess within the temperature range considered in these studies. Here, we first investigate theevolution of the solute mass in the liquid and solid phases for all the process configurations. We alsoinvestigate and compare the performance of each configuration in terms of productivity and yield.The productivity of the CPC-MSMPR is defined as

Pharmaceutics 2017, 9, 55 8 of 19
Pr(j)k =
(m(j)
k,S,prod − m(j)k,S, f eed
)ee(j)
S , (23)
k =
{E1(L-threonine) for j = T1
E2(D-threonine) for j = T2(24)
where m(j)k,S,prod and m(j)
k,S, f eed are the solid crystal mass flow rates in the product stream and feed stream,
respectively, and ee(j)S is the enantiomeric excess, which is used as a weighting factor in the definition
of productivity so that purity of the products is taken into account. eeS is defined as
ee(j)S =
∣∣∣m(j)k,S −m(j)
k∗,S
∣∣∣m(j)
k,S + m(j)k∗,S
× 100%, (25)
k∗ 6= k with k, k∗ ∈ {E1, E2},
where m(j)k,S is the mass of the solid phase of enantiomorph k in the crystallizer. For the CPC and CPC-D
configurations the equivalent productivity for comparison is defined as
Pr(j)k =
m(j)k,S −m(j)
k,seed
t
ee(j)S . (26)
It is to be noted that for the CPC-D configuration, mk,seed = 0 for j = T2, as seed is only used inthe crystallization tank. In the dissolution tank, a racemic solid is used which is not considered asinvestment while calculating productivity. The another performance indicator used is the yield of theprocess which is defined for the CPC-MSMPR configuration as
Y(j)k =
m(j)k,L, f eed − m(j)
k,L
m(j)k,L, f eed
ee(j)S , (27)
where m(j)k,L, f eed and m(j)
k,L, f eed are mass flow rates of the enantiomorph k in the liquid phase in the feedstream and in the product stream, respectively. For the CPC and CPC-D configurations, the yield isdefined as follows
Y(j)k =
m(j)k,L, f eed + mk,R −m(j)
k,L
m(j)k,L, f eed + mk,R
ee(j)S , (28)
where mk,R is the mass of the enantiomorph k in the racemate. mk,R is nonzero only for Tank 2 in theCPC-D configuration.
4.2. Liquid and Solid Phase Mass Evolution
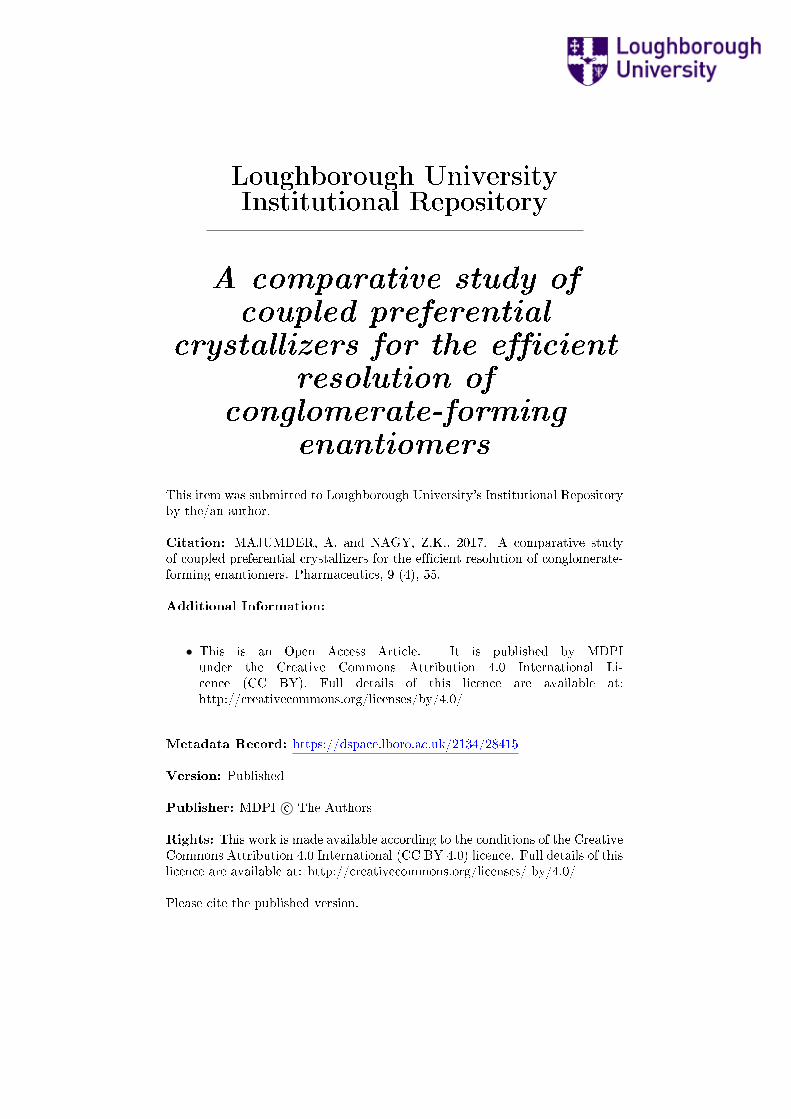
The simulation results for various process configurations are presented in this section. In Figure 2,the results for CPC-MSMPR are presented where the feed and product removal rate used is80 mL min−1. The solid mass of pure enantiomer increases from seed mass of 2 g to the steadystate value of 3.7 g in both the tanks. The nucleation of the counter enantiomer is almost completelysuppressed. The racemic liquid phase starts with equal amount of both the eanatiomers. In a timeof about 0.5 h, the mass of the enantiomers in the liquid phase reaches a steady state of two differentvalues. The enantiomer which is being enriched in the solid phase has a lower steady sate mass in theliquid phase. The mass evolution profiles for the CPC configuration, shown in Figure 3, is similar to

Pharmaceutics 2017, 9, 55 9 of 19
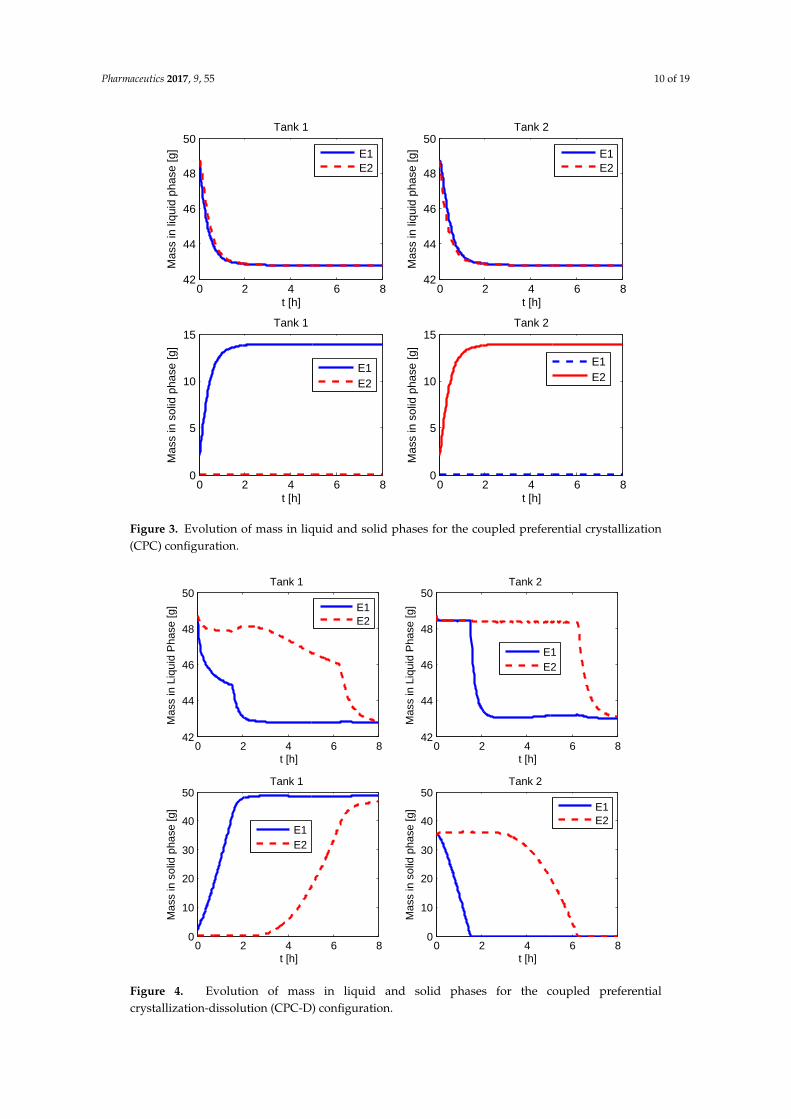
the CPC-MSMPR except the steady sate mass in the liquid phases is the same for both the enantiomers.This is because there are no feed and product streams in this configuration and thus the sufficientlyhigh exchange of liquid phases ensures that the mass of the two enantiomers is the same in the liquidphases. In Figure 4, the mass evolution for CPC-D is presented. The mass of E1 in the solid phaseof Tank 1 increases with time due to nucleation and growth until it reaches the steady state valueat around 2.5 h. As a result, mass in the liquid phase for E1 in Tank 1 decreases which is partiallycompensated due to dissolution of E1 in Tank 2. The E1 solid in Tank 2 completely dissolves at about1.5 h, and this results in a sudden increase of depletion rate of E1 in the liquid phases at Tank 1 andTank 2. On the other hand, E2 appears in Tank 1 due to primary nucleation after about 2.5 h whichresults in a decrease of E2 concentration in the liquid phase in Tank 1. The rate of depletion of E2 inthe liquid phases further increases in both the tanks at about 6 h when E2 in solid phase in Tank 2dissolves completely.
0 2 4 6 847
47.5
48
48.5
49
t [h]
Mas
s in
Liq
uid
Pha
se [g
]
Tank 1
E1E2
0 2 4 6 847
47.5
48
48.5
49
t [h]
Mas
s in
Liq
uid
Pha
se [g
]
Tank 2
E1E2
0 2 4 6 80
1
2
3
4
t [h]
Mas
s in
sol
id p
hase
[g]
Tank 1
E1E2
0 2 4 6 80
1
2
3
4
t [h]
Mas
s in
sol
id p
hase
[g]
Tank 2
E1E2
Figure 2. Evolution of mass in liquid and solid phases for the coupled preferential crystallization inMSMPR crystallizers (CPC-MSMPR).
Pharmaceutics 2017, 9, 55 10 of 19
0 2 4 6 842
44
46
48
50
t [h]
Mas
s in
liqu
id p
hase
[g]
Tank 1
E1E2
0 2 4 6 842
44
46
48
50
t [h]
Mas
s in
liqu
id p
hase
[g]
Tank 2
E1E2
0 2 4 6 80
5
10
15
t [h]
Mas
s in
sol
id p
hase
[g]
Tank 1
E1E2
0 2 4 6 80
5
10
15
t [h]
Mas
s in
sol
id p
hase
[g]
Tank 2
E1E2
Figure 3. Evolution of mass in liquid and solid phases for the coupled preferential crystallization(CPC) configuration.
0 2 4 6 842
44
46
48
50
t [h]
Mas
s in
Liq
uid
Pha
se [g
]
Tank 1
E1E2
0 2 4 6 842
44
46
48
50
t [h]
Mas
s in
Liq
uid
Pha
se [g
]
Tank 2
E1E2
0 2 4 6 80
10
20
30
40
50
t [h]
Mas
s in
sol
id p
hase
[g]
Tank 1
E1E2
0 2 4 6 80
10
20
30
40
50
t [h]
Mas
s in
sol
id p
hase
[g]
Tank 2
E1E2
Figure 4. Evolution of mass in liquid and solid phases for the coupled preferentialcrystallization-dissolution (CPC-D) configuration.

Pharmaceutics 2017, 9, 55 11 of 19
4.3. Effect of Feed Flow Rate on CPC-MSMPR Productivity and Yield
The effect of feed flow rates on productivity and yield is investigated first for the CPC-MSMPRconfiguration. The simulation results for Tank 1 are presented in Figure 5. It is to be noted that dueto the identical kinetic parameters obtained for both the enantiomers and similar process conditions,the productivity and yield in both the vessels are similar for CPC-MSMPR (and also for CPC)configuration. As can be seen in Figure 5a, the system reaches steady state in about 1.5 h. The incrementof feed flow rate up to 80 mL min−1 increases the productivity to a certain level. A further increasein feed flow is accompanied by a negligible increase in productivity. Another important feature inFigure 5a is that the productivity sharply reduces to zero after about 5 h when the feed flow rate is10 mL min−1. This occurs due to the fact that at low feed flow rates, the residence time of the slurryincreases and appearance of the counter enantiomer takes place due to nucleation. This eventuallyreduces the purity of the crystal product under the specified value of eeS = 99%. The optimal feed flowrate is related to the residence time of the seed crystals needed to grow by consuming supersaturationin the MSMPR. Conversely, the yield of the process decreases as the feed flow rate increases as shownin Figure 5b. This is because the increase of feed flow rate decreases the mean residence time and thesolution spends less time crystallizing in the crystallizer. Moreover, if the residence time is too long(e.g., with feed flow rate of 10 mL min−1), the purity of the product crystals can be adversely affectedby the nucleation of the counter enantiomer. Like many other processes, a trade-off exists between theproductivity and yield for the CPC-MSMPR configuration. The feed flow rate of 80 mL min−1 is usedwhile comparing with other configurations as this flow rate provides high productivity. The low yieldcan be compensated to some extent by recycling the product solution from the crystallizer to the feedstream after racemization so that overall yield increases [32,33].
0 2 4 6 8−5
0
5
10
15
20
t [h]
Pro
duct
ivity
[g/h
]
Feed rate 10 mL/min
Feed rate 20 mL/min
Feed rate 40 mL/min
Feed rate 60 mL/min
Feed rate 80 mL/min
Feed rate 100 mL/min
Feed increment
(a)
0 2 4 6 80
2
4
6
8
10
t [h]
Yie
ld [%
]
Feed increment
(b)
Figure 5. Simulation results showing effect feed flow rate on the productivity and yield for thecoupled preferential crystallization in MSMPR crystallizers (CPC-MSMPR) (seed mass 2 g, liquid phaseexchange rate 80 mL min−1). (a) Increase in feed flow rate up to 80 mL min−1 causes an increase inproduction to a certain level, beyond which no significant improvement in production is achieved;(b) Yield of the process decreases while feed flow rate increases, as increase of feed flow rate reducesthe residence time of the solution (for legend please refer to (a)).
4.4. Effect of Liquid Phase Exchange Rate on CPC-MSMPR Productivity and Yield
The liquid phase exchange between the coupled crystallizers helps to compensate the depletionof the preferred enantiomer concentration. The effects of liquid phase exchange rate on productivityand yield are shown in Figure 6. The trends observed are similar to the effect of feed flow rate. As theexchange rate increases, the productivity increases as it enhances the amount of product crystals in thesolid phase due to higher rate of crystallization. The return on increased exchange rate diminishes

Pharmaceutics 2017, 9, 55 12 of 19
gradually. However, a higher exchange rate would also mean the depletion of the preferred enantiomerin the liquid phase due to crystallization being compensated at a higher rate. The net effect observed isthe decrease in yield with the increase of exchange rate.
0 2 4 6 80
5
10
15
20
t [h]
Pro
duct
ivity
[g/h
]
Exchange rate 10 mL/minExchange rate 20 mL/minExchange rate 40 mL/minExchange rate 60 mL/minExchange rate 80 mL/minExchange rate 100 mL/min
Exchang rate increment
(a)
0 2 4 6 80
0.5
1
1.5
2
2.5
3
3.5
t [h]Y
ield
[%]
Exchange rate 10 mL/minExchange rate 20 mL/minExchange rate 40 mL/minExchange rate 60 mL/minExchange rate 80 mL/minExchange rate 100 mL/min
Exchange rate increment
(b)
Figure 6. Simulation results showing the effect of the liquid phase exchange rate on the productivityand yield of the coupled preferential crystallization in MSMPR crystallizers (CPC-MSMPR) (feed flowrate 80 mL min−1, seed mass 2 g). (a) Increase of liquid phase exchange increases productivity; (b) Yieldof the processes decreases while the feed flow rate increases, as an increase of the feed flow rate reducesthe residence time of the solution.
4.5. Effect of Seed Mass on CPC-MSMPR Productivity and Yield
Here, we investigate the effect of seed mass on the productivity and yield for the CPC-MSMPRconfiguration. The simulation results are presented in Figure 7 where the seed mass starting from 1 gis increased to 8 g. As can be seen, both the productivity and yield increase with the increase of seedmass. This can be attributed to the fact that increased seed mass provides increased surface area forthe crystal growth. Thus, for the same residence time, more supersaturation will be consumed by theseeds with larger surface area. This has beneficial effect on both the productivity and yield.
0 2 4 6 8−10
0
10
20
30
40
t [h]
Pro
duct
ivity
[g/h
]
Seed 1 gSeed 2 gSeed 4 gSeed 6 gSeed 8 g
Seed mass increment
(a)
0 2 4 6 80
1
2
3
4
5
6
7
t [h]
Yie
ld [%
]
Seed mass increment
(b)
Figure 7. Simulation results showing the effect of seed mass on the productivity and yield of thecoupled preferential crystallization in MSMPR crystallizers (CPC-MSMPR) (feed flow rate 80 mL min−1,exchange rate 80 mL min−1). (a) Productivity increases with seed mass; (b) Yield increases with seedmass (for legend please refer to (a)).

Pharmaceutics 2017, 9, 55 13 of 19
4.6. Productivity and Yield of CPC and CPC-D Configurations
In Figure 8, the effect of seed mass on the productivity and yield for the CPC batch configurationis presented. The liquid exchange rate is kept at 80 mL min−1. Here the downtime (time needed toprepare the vessel for the next batch) is assumed to be td = 1 h, and thus productivity and yield arezero before 1 h. It can be seen that although after 1 h there are indications of a marginal incrementin the productivity and yield, soon the differences become less obvious and after about 3 h there arehardly any differences. This observation is due to the fact that once the supersaturation is consumed atthe initial stages of the batch process, the effect of seed mass becomes insignificant as there is not muchdriving force left. Similar observations were found when the effect of liquid phase exchange rate wasinvestigated (not presented here) for the CPC configuration, i.e., it has insignificant effect on the finalproductivity and yield.
0 2 4 6 8 100
1
2
3
4
5
6
7
8
t [h]
Pro
duct
ivity
[g/h
]
Seed 1 gSeed 2 gSeed 4 gSeed 6 gSeed 8 g
(a)
0 2 4 6 8 100
2
4
6
8
10
12
14
t [h]
Yie
ld [%
]
Seed 1 gSeed 2 gSeed 4 gSeed 6 gSeed 8 g
(b)
Figure 8. Simulation results showing the effect of seed mass on the productivity and yield of the coupledpreferential crystallization (CPC) configuration (exchange rate 80 mL min−1). Final productivity andyield are not affected by seed mass. (a) Productivity evolution; (b) Yield evolution.
Next, in Figure 9 we present the effect of racemate mass on the dissolution tank of the CPC-Dconfiguration. The downtime is taken to be 1 h. The racemate mass is varied from 20 g to 70 gwhile keeping seed mass at 2 g and liquid phase exchange rate at 80 mL min−1. For each of theseconsiderations, two different curves are obtained in each vessel for both the productivity and yield,since unlike the previous configurations, the process conditions are different in the two vessels in theCPC-D configuration. The sharp changes in the curves are due to the purity requirement of the crystalproduct which is set to eeS = 99%. In Tank 1, the productivity and yield suddenly change to zerobecause at this time the purity (eeS) of the preferred enantiomer goes below 99% due to the nucleationof the counter enantiomer. Conversely, the productivity and yield at Tank 2 suddenly jump from zeroto a certain value because the purity of the preferred enantiomer at that tank has just reached 99% dueto the dissolution of the counter enantiomer. Thus, in order to ensure the supply of the product crystalsfrom both the vessels, the CPC-D configuration should be harvested during the period enclosed bythe time when the product crystal with required purity appears in the dissolution vessel and the timewhen the purity of the product crystals in the crystallization vessel goes below the required level, asshown in Figure 9a. The productivity and yield increase with the increment of the racemic solid used.However, this increment is accompanied by the decrease in the length of the time period available forproduct crystal removal. Thus, there is a trade-off between the increase of productivity and the lengthof harvest period. The effect of seed mass is also investigated (not reported here) and no significanteffect is found for the same reason explained for the CPC configuration.

Pharmaceutics 2017, 9, 55 14 of 19
0 2 4 6 8 10t [h]
0
5
10
15
20P
rodu
ctiv
ity [g
/h]
20 g (Tank 1)40 g (Tank 1)70 g (Tank 1)20 g (Tank 2)40 g (Tank 2)70 g (Tank 2)
Harvest period
(a)
0 2 4 6 8 100
10
20
30
40
50
60
70
80
t [h]
Yie
ld [%
]
20 g (Tank 1)40 g (Tank 1)70 g (Tank 1)20 g (Tank 2)40 g (Tank 2)70 g (Tank 2)
Racemate increment
(b)
Figure 9. Simulation results showing effect of racemate mass on the productivity and yield ofcoupled preferential crystallization-dissolution (CPC-D) configuration (seed mass 2 g, exchange rate80 mL min−1). (a) Productivity for Tank 1 and Tank 2; (b) Yield for Tank 1 and Tank 2.
4.7. Comparison of Productivities and Yields for Various Configurations
In Figure 10, a comparison of all three configurations is shown in terms of productivity andyield. In this comparison, the process parameters used are seed mass 8 g, feed flow rate 80 mL min−1,and exchange rate 80 mL min−1, for which higher productivities are found in various configurations.The amount of racemic solid used in Tank 2 for CPC-D configuration is 70 g, so that the productivity ishigh and harvest period is long enough to collect the product crystals with ease.
As can be seen in this figure, the productivity of CPC-D is higher than in the CPC configuration.This result is consistent with Eicke et al. [11]. The sharp decrease of productivity in Tank 1 at about3.7 h is due to the appearance of the counter enantiomer resulting from nucleation. Conversely, thesudden rise in productivity in Tank 2 at about 3 h indicates the dissolution of the counter enantiomer(E1) in Tank 2 so that ees = 99%. In order to ensure that pure enantiomers can be achieved from both thecrystallizers of CPCD configuration, the window of time between the dissolution of counter enantiomerin dissolution tank (ees = 99%) and the appearance of the counter enantiomer in the crystallizationtank (ees = 99%) should be long enough to allow collection of products. In some process conditions,for example when the seed crystal surface area is not large enough to consume the supersaturation at agiven rate, primary nucleation of the counter enantiomer can occur at the crystallization tank beforethe required dissolution of the counter enantiomer for ees = 99% (Eicke et al. [11]). Such phenomenalead to the shrinkage of the harvest period to zero and this essentially means that pure enantiomerscan be collected from only one tank. In other words, such an operating condition will lead the processto an unattractive region of operation. However, the other two configurations CPC and CPC-MSMPRdo not suffer from such limitations. This is due to the fact that both the enantiomers crystallize inseparate coupled vessels in CPC and CPC-MSMPR configurations which depletes the supersaturationof the respective enantiomers.
In Figure 10, we can further see that the CPC-MSMPR configuration provides the highestproductivity. The increase of productivity found in CPC-MSMPR is almost two-fold compared to themaximum productivity for CPC-D configuration and five-fold compared to the maximum productivityfor CPC. Due to the batch configuration, the productivities for CPC and CPC-D configurations arelimited by the consumption of the supersaturation which has no provisions to replenish from feedstreams. However, this is not the case for the CPC-MSMPR crystallizer where there is a steady supplyof racemic solution to the tanks. This also allows the CPC-MSMPR configuration to maintain the highlevel of productivity and purity for about 8 h, indicating that the process has reached a steady state.Thus, the superiority of the continuous configuration in terms of productivity as compared to the batch

Pharmaceutics 2017, 9, 55 15 of 19
configurations has been shown by these simulation results for the system considered. Nonetheless,as can be seen in Figure 10b, this high productivity comes at the cost of low yield. When it comesto yield, CPC and CPC-D configurtions perform better than the CPC-MSMPR configuration. Thiscan be explained by considering the residence time for each configuration. Since the CPC-MSMPRconfiguration has steady feed flow and product removal, the residence time for the slurry is muchshorter (5.64 min) as compared to the CPC and CPC-D configurations (8 h). As a result, the timeavailable for the seed crystals to grow is much shorter for CPC-MSMPR crystallizer and thus a loweryield is obtained. One can choose an appropriate feed flow rate for CPC-MSMPR configuration bybalancing productivity and yield based on the priority. However, if there is a provision for recyclingthe solution obtained from the product stream after filtering the product crystals and subsequentracemization, the low yield of the CPC-MSMPR configuration can be compensated. The overallyield that can be obtained with recycle is equivalent to that of the equilibrium batch process or evengreater [32]. However, the increase of yield by using recycle stream can be limited if there is a build-upof impurities within the system [32].
0 2 4 6 8 10
t [h]
0
5
10
15
20
25
30
35
40
Pro
duct
ivity
[g/h
]
CPC-MSMPRCPC-D (Tank 1)CPC-D (Tank 2)CPC
(a)
0 2 4 6 8 10t [h]
0
10
20
30
40
50Y
ield
[%]
CPC-MSMPRCPCCPC-D (Tank 1)CPC-D (Tank 2)
(b)
Figure 10. (a) Comparison of productivities for various process configurations. Process parametersused are seed mass 8 g, feed flow rate rate 80 mL min−1, exchange rate 80 mL min−1, and racemate mass70 g. The productivity for coupled preferential crystallization in MSMPR crystallizers (CPC-MSMPR)is found to be the highest. The sudden rise and fall of productivities for the coupled preferentialcrystallization-dissolution (CPC-D) configuration is due to the use of cut-off purity of eeS = 99%;(b) Curves showing comparison of yields. The yield of CPC-MSMPR is the lowest. The relatively highyield of CPC-D configuration in Tank 2 is due to the use large amount of racemic solid.
4.8. Effect of Nucleation Kinetics on the Performances of Various Configurations
In the previous sections, experimentally determined kinetic parameters for the DL-threonine-H2Osystem were used in the simulation results. Here we investigate how the nucleation kinetic parametersaffect the performance of the various configurations. The secondary and primary nucleation ratesfor this system are given by Equations (19) and (21), respectively. A scaling factor α is used to scalethe parameters k(j)
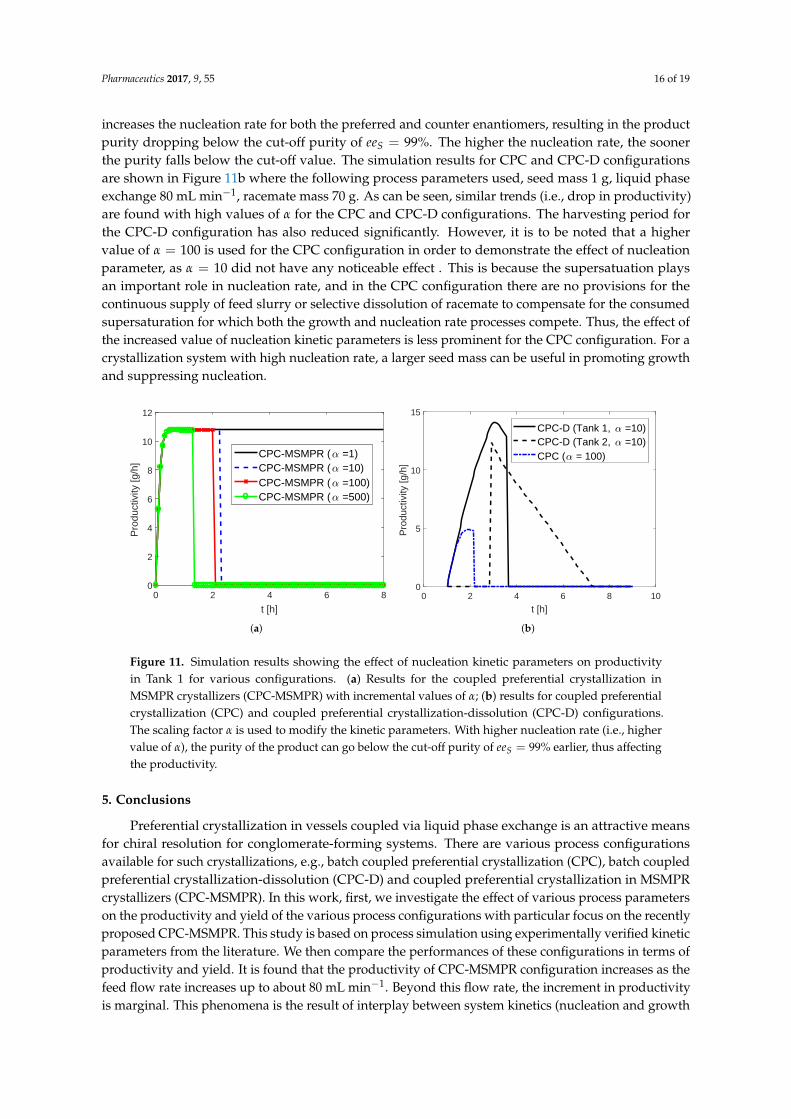
b,sec and knuc appearing in those equations. For instance, when α = 1, we have theoriginal values of the parameters as shown in Table A1 and when α = 10, these two parameters areincreased ten-fold. This essentially means that with α = 10 the primary and secondary nucleationrates are increased ten-fold in the same process condition. Such a study will be useful in predictingprocess performance for systems with higher nucleation rates. The simulation results using variousvalues of α for the CPC-MSMPR configuration are shown in Figure 11a where the process parametersused are seed mass 1 g, feed rate 80 mL min−1, and liquid phase exchange 80 mL min−1. As can beseen, the productivities plummet to zero between 1 h and 3 h for α = 10, 100, 500 as it significantly
Pharmaceutics 2017, 9, 55 16 of 19
increases the nucleation rate for both the preferred and counter enantiomers, resulting in the productpurity dropping below the cut-off purity of eeS = 99%. The higher the nucleation rate, the soonerthe purity falls below the cut-off value. The simulation results for CPC and CPC-D configurationsare shown in Figure 11b where the following process parameters used, seed mass 1 g, liquid phaseexchange 80 mL min−1, racemate mass 70 g. As can be seen, similar trends (i.e., drop in productivity)are found with high values of α for the CPC and CPC-D configurations. The harvesting period forthe CPC-D configuration has also reduced significantly. However, it is to be noted that a highervalue of α = 100 is used for the CPC configuration in order to demonstrate the effect of nucleationparameter, as α = 10 did not have any noticeable effect . This is because the supersatuation playsan important role in nucleation rate, and in the CPC configuration there are no provisions for thecontinuous supply of feed slurry or selective dissolution of racemate to compensate for the consumedsupersaturation for which both the growth and nucleation rate processes compete. Thus, the effect ofthe increased value of nucleation kinetic parameters is less prominent for the CPC configuration. For acrystallization system with high nucleation rate, a larger seed mass can be useful in promoting growthand suppressing nucleation.
0 2 4 6 8
t [h]
0
2
4
6
8
10
12
Pro
duct
ivity
[g/h
]
CPC-MSMPR ( =1)CPC-MSMPR ( =10)CPC-MSMPR ( =100)CPC-MSMPR ( =500)
(a)
0 2 4 6 8 10
t [h]
0
5
10
15P
rodu
ctiv
ity [g
/h]
CPC-D (Tank 1, =10)CPC-D (Tank 2, =10)CPC ( = 100)
(b)
Figure 11. Simulation results showing the effect of nucleation kinetic parameters on productivityin Tank 1 for various configurations. (a) Results for the coupled preferential crystallization inMSMPR crystallizers (CPC-MSMPR) with incremental values of α; (b) results for coupled preferentialcrystallization (CPC) and coupled preferential crystallization-dissolution (CPC-D) configurations.The scaling factor α is used to modify the kinetic parameters. With higher nucleation rate (i.e., highervalue of α), the purity of the product can go below the cut-off purity of eeS = 99% earlier, thus affectingthe productivity.
5. Conclusions
Preferential crystallization in vessels coupled via liquid phase exchange is an attractive meansfor chiral resolution for conglomerate-forming systems. There are various process configurationsavailable for such crystallizations, e.g., batch coupled preferential crystallization (CPC), batch coupledpreferential crystallization-dissolution (CPC-D) and coupled preferential crystallization in MSMPRcrystallizers (CPC-MSMPR). In this work, first, we investigate the effect of various process parameterson the productivity and yield of the various process configurations with particular focus on the recentlyproposed CPC-MSMPR. This study is based on process simulation using experimentally verified kineticparameters from the literature. We then compare the performances of these configurations in terms ofproductivity and yield. It is found that the productivity of CPC-MSMPR configuration increases as thefeed flow rate increases up to about 80 mL min−1. Beyond this flow rate, the increment in productivityis marginal. This phenomena is the result of interplay between system kinetics (nucleation and growth

Pharmaceutics 2017, 9, 55 17 of 19
rates) and the residence time of the process. Conversely, the yield of CPC-MSMPR configurationdecreases as the feed flow rate increases. Such observations can be attributed to the fact that high flowrate leads to smaller residence time, and the slurry has less time to crystallize. The similar trends areobserved when the effect of liquid phase exchange is investigated. It is found that productivity ofCPC-MSMPR increases up to an exchange rate of 80 mL min−1, beyond which the return on increasedexchanged rate is very limited, while yield decreases with the increase of exchange rate. In the caseof the seed mass, it is found that both the productivity and yield increase with the increase of theseed mass as it provides more crystal surface area for the solute molecules in the solution to attach.However, for the CPC and CPC-D configurations, the effect of seed mass is found to be insignificantas the driving force (supersaturation) becomes similar after some time in these batch configurations.A study on the influence of racemic mass in Tank 2 for CPC-D configuration is also performed. As themass is increased, the productivity increases. However, the time period during which the productcrystal has to be collected (after the counter enantiomer dissolves in Tank 2 and before the appearanceof counter enantiomer in Tank 1 so that eeS ≥ 99% is maintained in both tanks) narrows down.Thus, one needs to choose the mass of the racemic solid such that productivity can be maximizedwhile the harvest period is long enough for collecting product crystals. Next, the performances ofall the process configurations in terms of productivity and yield are compared. The CPC-MSMPRconfiguration is found to be the most productive among the three configurations, however, with lowestyield. Like many other engineering problems, here is a trade-off relationship between productivityand yield. Nonetheless, based on the priority one can choose appropriate process parameters thatserve the required productivity and yield as closely as possible. Moreover, the provision of recyclingthe solution from product stream to the feed after racemization can be employed to increase the overallyield. Finally, the effect of a growth kinetics parameter is studied to investigate how the systems withhigh nucleation rates influence the performances of various crystallizer configurations. It is found thatthe higher nucleation rate of the counter enantiomer can lead to the loss of productivity due to thedrop in purity of the product crystals. However, the CPC configuration is found to be less affected asthe supersaturation in this configuration is usually lower due to the absence of feed stream.
The insights obtained in these results can be useful in designing a particular process configurationor improving the existing one by manipulating the appropriate process parameters. The presentedresults will also be helpful in choosing suitable process configuration. For instance, when a continuoussupply of pure enantiomers is required, CPC-MSMPR configuration will be preferred. Conversely,if there is no provision for recycle and the separation yield is more important, then the CPC-Dconfiguration will be preferred. Moreover, the analysis presented will be useful in deciding theappropriate feed flow rate, liquid phase exchange rate, and seed mass at the design stage of the processso that the performance of the process can be improved in terms productivity, purity, and yield.
Acknowledgments: Funding is acknowledged from the European Research Council under the European Union’sSeventh Framework Programme (FP7/2007–2013)/ERC grant agreement No. (280106-CrySys). The authors wouldlike to thank Andreas Seidel-Morgenstern of Max Planck Institute for Dynamics of Complex Technical Systems,Magdeburg for his comments on the manuscript.
Author Contributions: Aniruddha Majumder and Zoltan K. Nagy conceived the idea of the paper.Aniruddha Majumder carried out the simulation works with technical inputs from Zoltan K. Nagy.Aniruddha Majumder and Zoltan K. Nagy analyzed the simulation work. Aniruddha Majumder wrote thepaper. Zoltan K. Nagy edited it.
Conflicts of Interest: The authors declare no conflict of interest. The funding sponsors had no role in the designof the study; in the collection, analyses, or interpretation of data; in the writing of the manuscript, and in thedecision to publish the results.

Pharmaceutics 2017, 9, 55 18 of 19
Appendix. Model Parameters
Table A1. Kinetic and simulation parameters for the ternary system DL-threonine/H2O [10,11].CSD: crystal size distribution.
Parameter Symbol Value Units
constant for density K1 1.00023× 10⁻³ m3 kg−1
constant for density K2 4.68× 10⁻⁹ m3 (kg ◦C)−1
constant for density K3 0.3652× 10⁻³ m3 kg−1
volume shape factor kv 0.1222 -density of solid threonine ρs 1250 kg m−3
ideal gas constant Rg 8.314 J (K mol)−1
activation energy for growth EA,g 7.55× 10⁴ J mol−1
activation energy for secondary nucleation EA,bsec 6.38× 10⁴ J mol−1
dissolution rate constant kdiss 3× 10⁻⁵ m s−1
growth rate constant kg,e f f 1.24× 10⁷ m s−1
growth exponent g 1.19 -growth parameter (size-dependent term) aASL 2× 10⁴ m−1
growth exponent (size-dependent term) γ −0.4 -secondary nucleation rate constant kbsec,e f f 3.97× 1024 m−3 s−1
exponent for third moment nµ3 3.0258 -secondary nucleation exponent bsec 4.8 -primary nucleation rate constant knuc 1000 s−1
primary nucleation exponent bnuc 1 -nucleation induction time tind 7200 sslope of sigmoidal function φ 0.01 -solubility parameter msol 1.2× 10⁻³ ◦Csolubility parameter bsol 0.059013 -solubility parameter a1sol −0.0780 -solubility parameter a2sol −0.1043 -mean seed size of enantiomer E1 (L-threonine) Lmean,E1 27,95 µmstandard deviation of seed CSD σln,E1
0.3, 0.34 -mean size of racemate Lmean,rac 9 µmstandard deviation of racemate CSD σln,rac 0.5 -
References
1. Maier, N.M.; Franco, P.; Lindner, W. Separation of enantiomers: Needs, challenges, perspectives.J. Chromatogr. A 2001, 906, 3–33.
2. Heger, W.; Schmahl, H.J.; Klug, S.; Felies, A.; Nau, H.; Merker, H.J.; Neubert, D. Embryotoxic effects ofthalidomide derivatives in the non-human primate Callithrix jacchus. IV. Teratogenicity of µg/kg doses ofthe EM12 enantiomers. Teratog. Carcinog. Mutagen. 1994, 14, 115–122.
3. Lin, G.Q.; You, Q.D.; Cheng, J.F. Chiral Drugs: Chemistry and Biological Action; John Wiley & Sons:Hoboken, NJ, USA, 2011.
4. Lorenz, H.; Seidel-Morgenstern, A. Processes to Separate Enantiomers. Angew. Chem. Int. Ed. 2014,53, 1218–1250.
5. Jacques, J.; Collet, A.; Wilen, S.H. Enantiomers, Racemates, and Resolutions; John Wiley & Sons:Hoboken, NJ, USA, 1981.
6. Collet, A. Separation and purification of enantiomers by crystallisation methods. Enantiomer 1999, 4, 157–172.7. Beilles, S.; Cardinael, P.; Ndzié, E.; Petit, S.; Coquerel, G. Preferential crystallisation and comparative crystal
growth study between pure enantiomer and racemic mixture of a chiral molecule: 5-Ethyl-5-methylhydantoin.Chem. Eng. Sci. 2001, 56, 2281–2294.
8. Coquerel, G. Preferential crystallization. In Novel Optical Resolution Technologies; Springer: Berlin/Heidelberg,Germany, 2007; pp. 1–51.
9. Elsner, M.P.; Ziomek, G.; Seidel-Morgenstern, A. Efficient separation of enantiomers by preferentialcrystallization in two coupled vessels. AIChE J. 2009, 55, 640–649.
10. Elsner, M.P.; Ziomek, G.; Seidel-Morgenstern, A. Simultaneous preferential crystallization in a coupled batchoperation mode. Part II: Experimental study and model refinement. Chem. Eng. Sci. 2011, 66, 1269–1284.

Pharmaceutics 2017, 9, 55 19 of 19
11. Eicke, M.J.; Levilain, G.; Seidel-Morgenstern, A. Efficient Resolution of Enantiomers by Coupling PreferentialCrystallization and Dissolution. Part 2: A Parametric Simulation Study to Identify Suitable ProcessConditions. Cryst. Growth Des. 2013, 13, 1638–1648.
12. Binev, D.; Seidel-Morgenstern, A.; Lorenz, H. Continuous Separation of Isomers in Fluidized BedCrystallizers. Cryst. Growth Des. 2016, 16, 1409–1419.
13. Suwannasang, K.; Flood, A.E.; Coquerel, G. A Novel Design Approach to Scale-Up of the Temperature CycleEnhanced-Deracemization Process: Coupled Mixed-Suspension Vessels. Cryst. Growth Des. 2016, 16, 6461–6467.
14. Viedma, C. Chiral Symmetry Breaking During Crystallization: Complete Chiral Purity Induced by NonlinearAutocatalysis and Recycling. Phys. Rev. Lett. 2005, 94, 65504.
15. Iggland, M.; Mazzotti, M. A Population Balance Model for Chiral Resolution via Viedma Ripening.Cryst. Growth Des. 2011, 11, 4611–4622.
16. Xiouras, C.; Ter Horst, J.H.; Van Gerven, T.; Stefanidis, G.D. Coupling Viedma Ripening with RacemicCrystal Transformations: Mechanism of Deracemization. Cryst. Growth Des. 2017, 17, 4965–4976.
17. Subramanian, G. A Practical Approach to Chiral Separations by Liquid Chromatography; VCH: Weinheim,Germany, 1994.
18. Schurig, V. Separation of enantiomers by gas chromatography. J. Chromatogr. A 2001, 906, 275–299.19. Rajendran, A.; Paredes, G.; Mazzotti, M. Simulated moving bed chromatography for the separation of
enantiomers. J. Chromatogr. A 2009, 1216, 709–738.20. Keurentjes, J.; Nabuurs, L.; Vegter, E. Liquid membrane technology for the separation of racemic mixtures.
J. Membr. Sci. 1996, 113, 351–360.21. Lee, S.B.; Mitchell, D.T.; Trofin, L.; Nevanen, T.K.; Söderlund, H.; Martin, C.R. Antibody-based bio-nanotube
membranes for enantiomeric drug separations. Science 2002, 296, 2198–2200.22. Lorenz, H.; Sheehan, P.; Seidel-Morgenstern, A. Coupling of simulated moving bed chromatography and
fractional crystallisation for efficient enantioseparation. J. Chromatogr. A 2001, 908, 201–214.23. Ströhlein, G.; Schulte, M.; Strube, J. Hybrid Processes: Design Method for Optimal Coupling of
Chromatography and Crystallization Units. Sep. Sci. Technol. 2003, 38, 3353–3383.24. Amanullah, M.; Abel, S.; Mazzotti, M. Separation of Tröger’s Base Enantiomers through a Combination of
Simulated Moving Bed Chromatography and Crystallization. Adsorption 2005, 11, 893–897.25. Elsner, M.P.; Ziomek, G.; Seidel-Morgenstern, A. Simultaneous preferential crystallization in a coupled,
batch operation mode—Part I: Theoretical analysis and optimization. Chem. Eng. Sci. 2007, 62, 4760–4769.26. Levilain, G.; Eicke, M.J.; Seidel-Morgenstern, A. Efficient Resolution of Enantiomers by Coupling Preferential
Crystallization and Dissolution. Part 1: Experimental Proof of Principle. Cryst. Growth Des. 2012, 12, 5396–5401.27. Galan, K.; Eicke, M.J.; Elsner, M.P.; Lorenz, H.; Seidel-Morgenstern, A. Continuous Preferential
Crystallization of Chiral Molecules in Single and Coupled Mixed-Suspension Mixed-Product-RemovalCrystallizers. Cryst. Growth Des. 2015, 15, 1808–1818.
28. Qamar, S.; Galan, K.; Elsner, M.P.; Hussain, I.; Seidel-Morgenstern, A. Theoretical investigation ofsimultaneous continuous preferential crystallization in a coupled mode. Chem. Eng. Sci. 2013, 98, 25–39.
29. Köllges, T.; Vetter, T. Model-Based Analysis of Continuous Crystallization/Reaction Processes SeparatingConglomerate Forming Enantiomers. Cryst. Growth Des. 2017, 17, 233–247.
30. Vetter, T.; Burcham, C.L.; Doherty, M.F. Separation of conglomerate forming enantiomers using a novelcontinuous preferential crystallization process. AIChE J. 2015, 61, 2810–2823.
31. Marchisio, D.L.; Pikturna, J.T.; Fox, R.O.; Vigil, R.D.; Barresi, A.A. Quadrature method of moments forpopulation-balance equations. AIChE J. 2003, 49, 1266–1276.
32. Ferguson, S.; Ortner, F.; Quon, J.; Peeva, L.; Livingston, A.; Trout, B.L.; Myerson, A.S. Use of ContinuousMSMPR Crystallization with Integrated Nanofiltration Membrane Recycle for Enhanced Yield and Purity inAPI Crystallization. Cryst. Growth Des. 2014, 14, 617–627.
33. Schaber, S.D.; Gerogiorgis, D.I.; Ramachandran, R.; Evans, J.M.B.; Barton, P.I.; Trout, B.L. Economic Analysisof Integrated Continuous and Batch Pharmaceutical Manufacturing: A Case Study. Ind. Eng. Chem. Res.2011, 50, 10083–10092.
c© 2017 by the authors. Licensee MDPI, Basel, Switzerland. This article is an open accessarticle distributed under the terms and conditions of the Creative Commons Attribution(CC BY) license (http://creativecommons.org/licenses/by/4.0/).