Embed Size (px)
Citation preview

The Lahore Journal of Business 9 : 2 (Spring 2021): pp. 41–78
A Comparative Study of Banking Sectors of Pakistan and India: An Application of Data Envelopment Analysis
Aamir Shahzad*, Tahir Mahmood** and Mehwish Shahzad***
Abstract
The main aim of this paper is to investigate the efficiency, change in productivity, and the sources of efficiency in the commercial banking sector of Pakistan and India. For this purpose, the performance analysis has been referred to, so as to verify the core-essence of the technical gains in efficiency, the role of managerial practices adopted, and the utilization of resources by the banking sectors in these two jointly bordered countries of South Asia. The time span that has been referred to for this study, spans from 2013 to 2017. Therefore, the Data Envelopment Analysis (DEA), equipped with its two basic models, which serve the input orientation and Malmquist Productivity Index (MPI) have been used, in order to submit the findings of this study. As compared to the situation in Pakistan, during the time span that has been taken into consideration for the purpose of this study, the Indian banking sector has been able to maintain higher scores, in the three levels of efficiency measures that have been observed. Moreover, the returns to scale analysis suggests that the banks operate at Constant Returns to Scale (CRS), or Increasing Return to Scale (IRS), thus making a positive contribution towards the average efficiency gains. Whereas, the banks that have been functioning at Decreasing Returns to Scale (DRS) happen to cause a decline in the efficiency measures. As far as productivity is concerned, both the countries have shown a positive improvement in the Total Factor Productivity (TFP), over the years. In a gist, the three levels of efficiency, and their sources of inefficiencies, make up the extract of the study. These findings should ideally be focused upon by the managers, practitioners, and policymakers, particularly while designing their operational strategies.
Keywords: Data envelopment analysis, malmquist productivity index, constant return to scale, variable return to scale, decreasing return to scale
JEL Classification: G21, M10, M11.
* M.Phil Scholar, Department of Economics and Business Management Sciences, UVAS, Lahore,
Pakistan. ** Associate Professor, Department of Economics and Business Management Sciences, UVAS,
Lahore, Pakistan. *** Lecturer, Department of Economics and Business Administration, UE, Lahore, Pakistan.

Aamir Shahzad, Tahir Mahmood, Mehwish Shahzad 42
1. Introduction
In developing economies, the financial system is a major determinant of economic growth. Having noted this, it is also common knowledge that the performance of any economy exceedingly depends upon the performance of the financial sector. This is primarily because the association among the economic constructs has been empirically investigated by the researchers, due to a deep rooted interest in the discipline (Baily & Elliott, 2013; Khalifa Al‐Yousif, 2002; Levine, 1999). In this regard, due to a lack of established financial capital, and in an effort to save markets in developing countries (Menyah, Nazlioglu, & Wolde-Rufael, 2014), the banking sector serves as a trusted and effective financial intermediary (He, Kelly, & Manela, 2017). Through the transformation of savings into investments, financial institutions execute the monetary and financial governance system, mainly by relying on the efficient allocation of resources (Ayadi, Arbak, Naceur, & De Groen, 2015; Masoud & Hardaker, 2012). It is also commonly believed that the banking sector diagnoses the financial illnesses of the developing nations. Therefore, in this regard, the banking sector serves as an active partner that participates to ensure the financial soundness of developing countries, all across the world. Among the branches of the banking sector, the commercial banks are involved in accepting deposits, advancing loans, providing general utility services, making investments, promoting capital formulation, facilitating foreign assistance, and creating and distributing the securities with the ultimate purpose of earning profit. Therefore, a well-established operation of commercial banks tends to excel in a first-order impact, not only in terms of economic growth, but also in the context of accelerating financial development in general.
For a long time, the efficient performance of the banking industry has been a critical research stream that draws a considerable amount of attention from both, academicians, as well as policymakers (Bhattacharyya & Pal, 2013; Dong, Hamilton, & Tippett, 2014; Fernandes, Stasinakis, & Bardarova, 2018). In the previous literature, a survey by (Berger & DeYoung, 1997) showed that the discipline of banking efficiency was mostly concerned with developed countries such as the US and UK. Then, this trend eventually shifted towards the European settings as well (Casu & Girardone, 2010; Fang, Hasan, & Marton, 2011). In more recent time, however, its popularity has infiltrated into the Asian territory as well. Thus, the researchers of this particular field of study have been explicitly focused on measuring the efficiency of the banking sector, mostly through the Data Envelopment Analysis (DEA) (Beck, Demirgüç-Kunt, &

A Comparative Study of Banking Sectors of Pakistan and India 43
Merrouche, 2010; Das & Drine, 2011b; Sathye, 2005; Seelanatha, 2010; Thagunna & Poudel, 2012).
It is noteworthy that the Pakistani and Indian banking sectors are reluctant to follow the footprints of the World’s top, developed economies. In this regard, the evidence shows that the impressive performance of developed economies has gradually helped to move the industry towards a bright future. From the era of independence till now, there are several commonalties that exist in the changes that have taken place in the banking structures of both the economies (Ataullah*, Cockerill, & Le, 2004). Hence, an efficiency study of both the countries is a viable decision, and also, the fear of country heterogeneity is less likely to be affected by the analysis. Therefore, the present study is an attempt to estimate the efficiency of the private commercial banks of Pakistan and India, and making a comparison of the two thereon. The existing inquiry will add quantitative evidence to the existing cross-cultural banking literature.
For the purpose of this study, we have used two classic models of the Data Envelopment Analysis. This has been undertaken primarily in order to estimate the scores of efficiency through separate country and joint country frontier analysis. Other than that, the detection of the main sources of gain and reduction in efficiency, along with the decomposed components of variation in the efficiency estimates are also measures that have been taken into consideration. The research manuscript also analyzes how major returns of efficiency estimates respond to the efficiency of the private commercial banks of Pakistan and India.
Most of the previous cross-country studies have used a common frontier for all the countries that have been included in their researches, respectively. This, however, only allows for the access to the results that pertain to the relative comparison of all the banks, of all the countries, at one point in time. But a bank that has performed efficiently in its own country, may not perform in the same manner, in the cross-country comparative analysis (Sathye, 2005). On the other hand, a Single Context Analysis facilitates the underperformed domestic banks, so as to make some suitable adjustments in their policies for the improvement of their efficiency centric results. However, this measure is not robust enough for the banks, in order for them to compete in relative countries, in the international market. In the light of this scenario, the current study aims to fill in the gaps, and demonstrate cross-country evidence that enhances the scope, and helps the countries to rectify the policies at an international level, in order to create a sound and healthy banking system.

Aamir Shahzad, Tahir Mahmood, Mehwish Shahzad 44
From the lens of theoretical implications, this study contributes towards a novel thought and idea, in the context of determining the relationship of efficiency, changes in productivity, as well as identifying a source of efficiency, by making use of the Data Envelope Analysis. On the theoretical side, this study also elaborates upon the unique relationship of the constant returns to scale, increasing returns to scale, decreasing returns to scale, and the total factor productivity, in the commercial banking sector of Pakistan and India. In parallel with the theoretical implications, this study is likely to be suitable and effective on the practical side as well. The three levels of efficiency, and their sources of inefficiencies, make up the extract of the study. These extracts should ideally be focused upon by the managers, practitioners, and policymakers, while designing their operational strategies.
The rest of the research is carried out as follows. The next section will provide a concise review of the literature. The fourth section confirms the methodology that is to be utilized, in-line with the core objectives of the study. The findings are presented in section fifth, and the conclusion & limitations are have been presented in the sixth section. Finally, the references used in the investigation have been listed in the last section of the paper.
2. Literature Review
This section will highlight the extant literature that has been written on the discipline banking efficiency, in a single and cross- country context. This is because DEA has gained exponential growth over time, and also possesses the intrinsic potential to provide unique findings, while engaging in different settings. (Berger & Humphrey, 1997) conducted a comprehensive survey of 130 international financial studies that had been undertaken in 26 countries. The survey results reflected that approximately 75% of the banking literature belongs to developed countries (USA in particular). The study also pointed out that a total of 69 studies were performed through the non-parametric method, while the rest of them were looked at with the parametric method. Moreover, a survey of the research also explained that all these empirical studies have the core purpose of estimating the performance of the banking territories, in different economic settings. At the country level, certain banking efficiency measures have been used, so as to contribute to the existing literature at different spans of times. These empirical evidences have been able to support government agencies, policymakers, and economists, in order for them to develop the strategies that will extensively move the sector on the

A Comparative Study of Banking Sectors of Pakistan and India 45
road of consistent development, especially through managerial performance (Berger & Humphrey, 1997). A recent survey conducted by (Emrouznejad & Yang, 2018) highlights the extended popularity of DEA. The study reported that from the year 1978 to 2016, there have been 10, 300 articles published, employing DEA as a tool for measuring efficiency.
Moreover, (Fernandes et al., 2018) also measured the efficiency, along with the productivity, through the Malmquist Productivity Index MPI of 64 banks, in Five Periphery European Economies for a period spanning from 2007 to 2014. The results exhibited an increase in the banking efficiency of the domestic banking industry of Periphery European Economies, over time. With a productivity growth score of 2.5%, Portuguese banks are ranked higher among the banking sector of Spain, Italy, Greece, and Ireland.
Other than that, (Sathye, 2005) also incorporated an investigation, with the core objective of measuring technical efficiency, and its decomposed components. The study targeted the commercial banks of the developing and developed countries of Asia Pacific. It also included 458 banks, from 18 countries of the Asia Pacific. The results were analyzed by finding the efficiency scores of each country separately, and then these were examined under a regional setting. The results revealed that out of the selected countries, ten countries in the regional frontier had showed lower scores of TE and PTE, as compared to the mean value of the region. On the other hand, six countries scored a lower SE than the average value.
(Banya & Biekpe, 2018) also extended the banking literature by measuring the banking efficiency of African countries. The research was aimed towards analyzing the banking efficiency of ten African countries, for a period spanning from 2008 to 2012. The study identified two major sources of inefficiency. The first one of these was the poor utilization of inputs, and the second one was the inability to carry out the operations, so as to realize the most productive scale size.
The banking efficiency of six GCC economies of the gulf block were also investigated by (Aghimien, Kamarudin, Hamid, & Noordin, 2016). The analysis for this study was undertaken by calculating the efficiency of 43 banks, from the years spanning from 2007 to 2011. In addition to this, the composite components of efficiency were treated as potential factors, primarily because they exert a significant influence on the GCC banking network. The frontiers were also separately constructed for each year, because the banks that had proven as efficient in one year, may be

Aamir Shahzad, Tahir Mahmood, Mehwish Shahzad 46
potentially proven as inefficient for another year, due to technical, technological or environmental reasons. Overall, the results reflected an increasing trend of banking efficiency in the GCC countries. Concisely, the results suggested that the resources were not fully utilized, mainly due to the managerial inefficiencies experienced in the GCC countries. Regarding the returns to scale analysis, the total sample was further divided into two categories. It was found that out of the 22 largest banks, most were operating at DRS. Whereas, 42.57% of the banks, out of the total count of the smallest banks were operating at IRS. Although the banks exhibited an increasing trend of efficiency, yet, the managerial inefficiency could potentially be reduced through the full utilization of the resources.
(Kamarudin, Sufian, Loong, & Anwar, 2017) also examined, and compared the three basic levels of efficiency of local and foreign Islamic banks, of the Southeast Asian Economies. In order to gauge the required goal, data from 2006 to 2014 was obtained from the Bankscope database, against 29 Islamic banks. The banks of Brunei, Indonesia, and Malaysia were shortlisted for the investigation. The Data Envelopment Analysis DEA was the core technique that was selected, and supported by the input orientation. The study explored that foreign banks tend to be less efficient, due to their smaller size, and therefore, the domestic Islamic banks gained the home advantage, as described in the home field advantage theory.
A study conducted by (Ataullah* et al., 2004) also analyzed the banking efficiency of Pakistan and India. A period spanning from 1988 to 1998 was targeted, in order to analyze the scores of the three related components of efficiency. The best relative efficiency comparison approach of DEA was utilized and executed, by employing both the historical models of CCR and BCC. The results showed that both countries had lower OTE scores, which contributed as the most significant reason behind the low scale efficiency. The mean overall technical efficiency score of Indian commercial banks had come out to be higher.
(Stewart, Matousek, & Nguyen, 2016) also squeezed the efficiency of the Vietnamese Commercial Banks. A sample of 48 banks, ranging from a time span from 1999 to 2009, was taken into account. The study categorized the sampled banks into state-owned (SOCBs) & non-state-owned (NSOCBs) commercial banks. The results concluded that large banks that had higher profits over the asset ratio tend to be comparatively more efficient than the smaller ones. On the other hand, as per the ownership structure, SOCBs are less efficient than NSOCBs.

A Comparative Study of Banking Sectors of Pakistan and India 47
(Sakouvogui, 2020) also elaborated on the SFA and DEA analysis, by using the data from 650 banks, in the United States of America. Moreover, the cluster approach was considered for this initiative. The study results revealed that the clustering approach has played a vital role in the rankings of US banks. In addition to this, the values of SFA, as well as the DEA efficiency analysis, based on the homogeneous banks were considerably greater than those of the heterogeneous banks.
(Dutta, Jain, & Gupta, 2020) highlighted that efficiency analysis of the banking companies, in the context of the Indian banking sector, by making use of the panel data spanning from 2014 to 2018. In this context, the executives did not to think about ROE as a critical marker of effectiveness, and should have ideally preferred to focus on the perspectives, for instance, the ROA and pay assortment. In the course of Malmquist examination, the executives have the capability to separate the profitability change, into specialized and effective shifts for additional examination.
The examination estimated the degree of provincial and local area banks' (RCBs) effectiveness in Ghana. This was done in order to learn their local inconsistencies, in the degrees of proficiency, utilizing (CCR) and (BCC) models, by making use of the information collected from 127 banks (2014 to 2017). We found efficient and scales collapse irregularities, across the nearby local banks in Ghana, during the efficiency analysis. In the context of country development, improving money, and incorporating custom fitted strategies for resource choice, ought to be sanctioned in order to shield the banks from the hazards that are related to choosing an excessive number of terrible resources. Additionally, the work of bleeding edge advancements, and intra-territorial data sharing would also ensure the banks against local explicit dangers, and in this manner ultimately improve effectiveness as well (Say et al., 2020).
3. Research Methodology
There have been certain techniques that have been employed in the reformulation of the (Farrell, 1957) measures that pertain to the technical efficiency, by using a single input and single output approach. The primary reason for the selection of the DEA, as a measure of efficiency, is the replacement of the traditional method of performance evaluation of the financial data. This method is commonly known as the ‘Ratio Analysis’. Also, DEA is a non-parametric approach that is based on various mathematical models. In this regard, the empirical evidences have proved that DEA is an easy and flexible approach towards finding different levels

Aamir Shahzad, Tahir Mahmood, Mehwish Shahzad 48
of efficiency, at the same point. This is mainly because the approach utilizes and envelops the data, and addresses the random noises that are put forth by the production technology, via different applications (Porcelli, 2009). Thus, DEA has been deemed to be the most effective technique for modeling the operational processes, in order to effectively access the large-scale frontier analysis performance level (Seiford & Thrall, 1990).
In their time, (Sherman & Gold, 1985) were the pioneers who stepped up to apply the DEA technique to the banking sector. When applying this technique to the sampled Decision Making Unit DMUs (in our case, the banks), the DEA tends to assign a score of unity to the efficient DMU(s). The score of the inefficient DMUs thus lies between 0 and 1, on the efficient frontier or the best practices frontier. The efficient DMU(s) on the efficient frontier have a relative comparison with the other DMU(s) in the sample, and are called the best practice performers, the reference units or the peer units of the sample (Das & Drine, 2011a; Fethi & Pasiouras, 2010; Kumar & Gulati, 2008; Pasiouras, 2008).
Among a wide variety of the DEA models, the CCR and BBC models are also the most repeatedly used for the efficiency estimation of banks, as found in the extant literature. The classical CCR model follows the assumptions that are similar with the Constant Return to Scale CRS (Charnes, Cooper, & Rhodes, 1978). This is then further extended by (Banker, Charnes, & Cooper, 1984) into the BBC model, followed by the assumption made in the Variable Return to Scale (VRS). Any increase or decrease in the efficiency scores depend upon the changes experienced in the level of inputs and outputs. In other words, the changes experienced in the relationship of the inputs and outputs, represent and reaffirm the concept of returns to scale (W. W. Cooper, Seiford, & Tone, 2000). Furthermore, the CCR model indicates that an increase in input(s) causes a proportionate increase in the output(s). While, the VRS model assumes that there is an increase or decrease in the outputs(s), due to an increase in the input(s) (Lampe & Hilgers, 2015). It is noteworthy that the objective of the CCR model is to find out the Overall Technical Efficiency (OTE), while the VRS is commonly known to dig out the Pure Technical Efficiency (PTE), and the Scale Efficiency (SE) (Majeed & Zanib, 2016). Here, it is essential to know that these models follow the input and output-oriented approach for the estimation of technical efficiency. The input-oriented model is used to retain the same level of output by minimizing the inputs, while the output-oriented model maximizes the output, by utilizing the existing level of inputs (Rahman, Lambkin, & Hussain, 2016).

A Comparative Study of Banking Sectors of Pakistan and India 49
In this regard, assuming if s outputs are produced by r inputs, for n DMUs (in our case, the banks), then the efficiency ratio can be measured by the following equation;
𝐸𝑙 =∑ 𝑢𝑖𝑦𝑖𝑙𝑠𝑖=1
∑ 𝑣𝑗𝑥𝑗𝑙𝑟𝑗=1
(i)
Where “𝐸𝑙” is the relative efficiency estimated by the DMUs, by employing r different inputs, to produce s different outputs. yi is the i th output produced by the DMU, xj is the j th input employed by the DMU, ui is s x 1 vector of the output weights, and finally, vj is the r x 1 vector of the input weights.
The above mentioned equation (i) is nonlinear in nature, and therefore, we had to renovate it, in order for it to be converted into a linear equation. For this reason, it was revamped as a fractional programming function, and is able to be changed afterwards into linear programming, as done by (Charnes et al., 1978). Therefore, the modified equation that was had was;
max𝐸𝑙 = ∑ 𝑢𝑖𝑦𝑖𝑙𝑠𝑖=1 (ii)
Subject to
∑ 𝑣𝑗𝑥𝑗𝑙𝑟𝑗=1 = 1 (iii)
∑𝑢𝑖𝑦𝑖𝑚
𝑠
𝑖=1
−∑𝑣𝑗𝑥𝑗𝑚
𝑟
𝑗=1
≤ 0,𝑚 = 1,…… , 𝑛.
The efficiency computed from the CRS model in equation (ii) is an aggregate measure of technical efficiency of the DMUs (in our case, the banks). In this regard, the obtained results from equation (iii) group the banks into a category of efficient and inefficient banks.
However, the application of the CCR model requires the DMUs to be operated and treated at the optimal level. Due to the imperfect competition in the market, and other constraints in the banking industry, the results of the technical efficiency, followed by the CRS assumption are more likely to be caught up with the scale efficiency. In order to remove this delinquency, the extended model formulated by (Banker et al., 1984), containing the assumption of Variable Returns to Scale VRS will is referred to. Moreover, the extended BCC model estimates the Technical Efficiency,
Aamir Shahzad, Tahir Mahmood, Mehwish Shahzad 50
by avoiding the Scale Efficiency effects. The formation of the BCC model, by taking into account the convexity constraint c can therefore be written as;
maximise𝐸𝑙 = ∑ 𝑢𝑖𝑦𝑖𝑙𝑠𝑖=1 − 𝑐𝑙 (iv)
Subject to;
∑ 𝑣𝑗𝑥𝑗𝑙𝑟𝑗=1 = 1
∑𝑢𝑖𝑦𝑖𝑚
𝑠
𝑖=1
−∑𝑣𝑗𝑥𝑗𝑚
𝑟
𝑗=1
− 𝑐𝑙 < 0,𝑚 = 1,…… ,𝑁.
The present study has utilized the CCR and BCC models, containing the CRS and VRS assumptions of scale, by following an input orientation. This is so because it is assumed that the inputs can easily control by the bank managers (Fethi & Pasiouras, 2010). Whereas, a change in the total factor productivity of the private banks has been captured through the DEA, Malmquist Productivity Index (MPI), which is specially designed to evaluate the variations in the efficiency, with respect to time. This concept was originally coined in by Prof. Sten Malmquist in 1953. Later on, it was contemplated and incorporated into a non-parametric framework, by several authors (Caves, Christensen, & Diewert, 1982; Färe, Grosskopf, Lindgren, & Roos, 1994; Färe, Grosskopf, Lovell, & Pasurka, 1989; Thrall, 2000). It is noteworthy that this model is based upon a comparative production function, and completely resembles the “comparative static” analysis.
This research has been carried out by having the total utility to deal with the secondary data that has been obtained for the purpose of this study. The financial data has been acquired to gain access to the efficiency and productivity of private banks. The time span encompasses a period from 2013 to 2017, thus avoiding any abnormal changes that might have occurred in the overall structure of the private banks of Pakistan and India. Moreover, the data has been thoroughly been scrutinized, in order to avoid any possible inconsistencies, reporting errors and double counting. The data that has been collected, has then been converted into a dollar value, in order to make an analysis that is premium, as well as uniform in nature. The DEAP 2.1 software was then used at three levels of efficiency. In this regard, TE has been taken to be the firm’s realization to yield the maximum output, by consuming the available set of inputs (Banya & Biekpe, 2018).

A Comparative Study of Banking Sectors of Pakistan and India 51
The PTE has been considered to be a measure that confirms the level of inefficiency, due to the underperformance of the managerial functions (Ataullah* et al., 2004). The SE is a variable that is known to reflect where the firm lies in the most productive scale size, for the given period of analysis (Kounetas & Tsekouras, 2007). Also, the value of TE is computed by considering the multiple impact of PTE and SE.
3.1. Malmquist Productivity Index MPI
The DEA-based MPI measures the productivity tend to change, or on the other hand, there are changes experienced in the Total Factor Productivity (TFP), of the banking sector. The value of TFP has experienced changes, and any of its decomposed components, particularly in this empirical setting, has provided information regarding the sources of change in productivity. It is understood that researchers and the practitioners can extract valuable information from the MPI scores. Any value of the MPI score that is greater than one indicates that there is an improvement in the TFP, while a value less than one refers to a decline in the efficiency growth (Coelli, 1998; Fernandes et al., 2018). The rise in the overall efficiency is the result of pure technical efficiency or scale efficiency. Whereas, the rise in technical efficiency shifts the productivity movement in an upward direction. Any value associated with the change in total factor productivity, and its associated components that have been greater than one, indicates an enhancement in the productivity movement. In this regard, the results of the MPI have been derived from the software package DEAP 2.1 of (Coelli, 1996).
3.2. Data Source And Selection Criteria
When referring to the sources of data and selection criteria, for this particular study, the data has been gathered from the annual financial statements of each bank. These statements have been made available, in order to maintain the transparency of accounts, of the banking company. In this regard, the main justified conditions that are adhered to, in order to gather the panel data, are mentioned below:
1. The bank should be a private commercial bank.
2. The selected bank should be a fully operating bank.
3. The data for all the variables included should be available.
4. The financial statement should be available, and published internationally.

Aamir Shahzad, Tahir Mahmood, Mehwish Shahzad 52
5. The data corresponding to the entire selected period of all the banks should be available.
As per the aforementioned criteria, out the twenty banks taken into consideration, nineteen of the private commercial banks from Pakistan, and out of twenty-one, nineteen private commercial banks from India were able to fulfill the desired criteria. The reason for leaving out NIB Bank Limited, from Pakistan, was due to its merger with MCB in the year 2017. In the case of India, Bandhan Bank, and IDFC Bank did not make it to the selection criteria, as they were established in 2015. It means that more than 90% of the private commercial banks were taken into account for the analysis
3.3. Inputs And Outputs Of The Study
While dealing with DEA, the choice of the most desired inputs and outputs is a contentious issue. In order to address this issue, the selection purpose production approach, and the intermediation approach are the most commonly used approaches, as observed in the banking literature. Under the production approach, banks are considered as producers of loans and depositors of account services. This is in contrast with the intermediation approach, which considers banks to serve as financial intermediaries between the savers and investors (Davutyan & Yildirim, 2017; Fujii, Managi, & Matousek, 2014; Wanke, Barros, & Emrouznejad, 2016).
The current study is following the intermediation approach, primarily because it was argued, and justified that it is the most suitable approach for analyzing the bank level efficiency. Whereas, the branch level efficiency is well measured through the production approach as well (Berger & Humphrey, 1997). Under the intermediation approach, research is typically carried on by taking into account the total deposits (deposit and other accounts), and the total capital as inputs, that are then utilized for the production of investments, and making loans & advances (advances net of provision) as the outputs.
It is noteworthy here that the deposits are taken to be the total deposits that come forth from the corporate and private customers. This is considered to be a measure that has an authenticated input for efficiency, as evident in the literature (Banya & Biekpe, 2018; Stewart et al., 2016). Moreover, the total capital includes inputs such as the ordinary share capital, reserves, un-appropriated profit or loss, and other inputs that are
A Comparative Study of Banking Sectors of Pakistan and India 53
needed to create wealth. Moreover, it has a reputation of authenticity in the literature as well (Fernandes et al., 2018; Sathye, 2015). Moving forward, investment is the sum of all securities, along with equity, and other investments. It is considered to be a highly sophisticated output, that is to be used for measuring efficiency, as expressed in the extant literature (Kamarudin et al., 2017; Sufian & Habibullah, 2012). In addition to this, in this regard, loans and advances include the loans to the other banks and customers (Sathye, 2015; Sufian & Akbar Noor Mohamad Noor, 2009).
The selection of these inputs and outputs has been influenced by extending the literature review on the DEA application on the banking industry, and as per the availability of the data. The number of inputs and outputs to be used in the study are in accordance with the well-accepted rule of thumb as suggested by (W. Cooper, Seiford, Tone, & Zhu, 2007), who claim that the number of DMUs must be greater than three times of the sum of the inputs and outputs. Therefore, this study fulfills the required criteria to do so. The statistics of the included inputs and outputs are tabulated below;
4. Results and Discussion
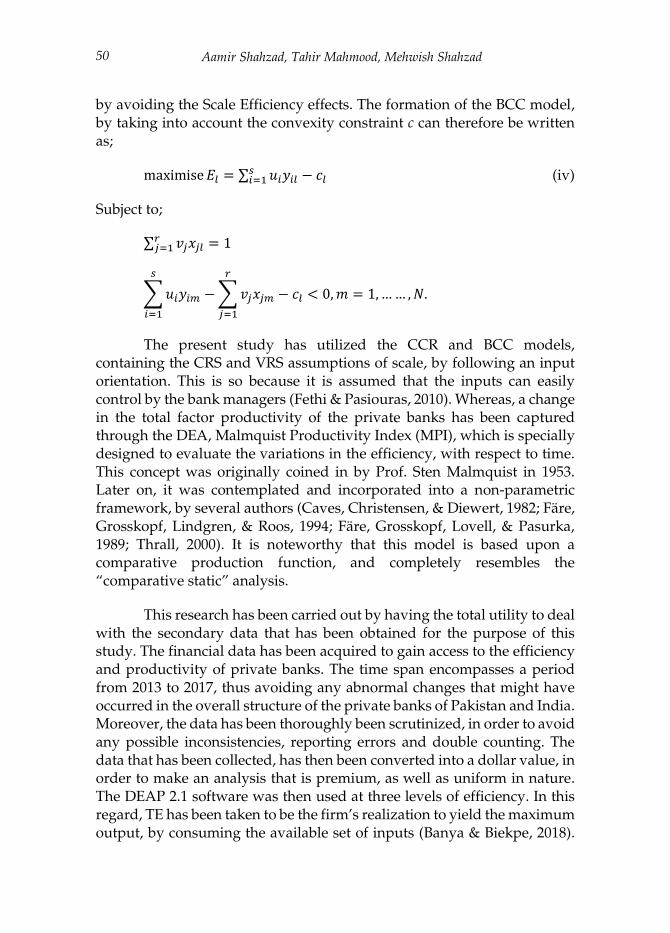
When referring to the results of the study, and the discussion around it, Table 1 presents the descriptive statistics analysis of Pakistani and Indian banks. In the descriptive analysis, the mean, median and standard deviation values have been highlighted. The results reveal that the inputs values, in the shape of the total deposits and total equity, for Indian banks are bigger than those of the Pakistani banks. The results also describe that the outputs of Indian banks is also superior to that of Pakistani banks.
Table 1: Descriptive statistics of DEA inputs & outputs (in US $)
Pakistan India
Mean Median Std. Dev. Mean Median Std. Dev.
Inputs Total deposits 3128.811 2287.632 2994.928 14478.200 7638.915 19775.200 Total equity 295.903 167.147 307.111 2182.868 726.337 3498.183 Outputs Total investment 1935.802 1109.756 2163.943 5987.725 2126.630 9730.655 Loans and advances 1476.454 1045.607 1252.223 12746.370 5654.091 18779.470

Aamir Shahzad, Tahir Mahmood, Mehwish Shahzad 54
4.1. Efficiency Analysis
In the separate country analysis, the efficiency scores of the banking sector of each country that has been considered for this study, have been calculated separately. This permits the researchers to find out the most efficiently performing bank, along with the overall performance of the banking sector in its own trajectory. On the other hand, in the joint country analysis, all the sampled banks of both the countries are combined under a single umbrella. This experiment permits the access to a more efficient banking sector in the case of Pakistan and India.
Moving on, Table 2 presents the average year-wise efficiency scores of Pakistani banks. The results also report that the three efficiency levels gradually increase after the year 2014. In accordance to this, the TE ranges from 63% to 100%. The average technical scores of the nineteen private banks, of the Pakistani banking industry, is about 91.1%. Thus, there is still an inefficiency of approximately 8.9% that needs to be addressed and improved accordingly. Annexure-A presents the bank-wise results of the sampled banks. As observed, Samba Bank and Summit Bank have been considered to show efficiency throughout the years of the analysis.
Table 2: Separate country analysis of Pakistan. A Year-wise efficiency
summary (in %)
Year TE PTE SE T-INE PT-INE S-INE No. / % of Efficient
Banks
2013 92.432 96.547 95.632 7.568 3.453 4.368 6 (31%) 2014 87.768 95.863 91.402 12.232 4.137 8.598 5 2015 89.247 95.884 93.013 10.753 4.116 6.987 5 2016 91.747 96.558 94.957 8.253 3.442 5.043 5 2017 94.505 98.195 96.130 5.495 1.805 3.870 10
Average 91.140 96.609 94.227 8.860 3.391 5.773
Source: Author’s own estimates Note: TE is the Technical efficiency, PTE is the Pure technical efficiency, SE is the Scale efficiency, T-INE is the Technical inefficiency, PT-INE is the Pure technical inefficiency, and S-INE is the Scale inefficiency.

A Comparative Study of Banking Sectors of Pakistan and India 55
Figure 1: Efficiency Trend of Pakistani Private Banks
The overall analysis of Pakistani banks indicates that the major source of technical inefficiency is scale inefficiency. In that context, the average score obtained for SE, for the five years of analysis that have been taken into consideration, is 94.2%. This primarily means that the divergence from the most productive scale size is 5.8%, which is more than the average inefficiency that has been recorded (100-96.6=3.4%). It also implies that on average, nineteen banks could produce the same output by using 3.4% lesser resources, than they consume in actuality. The year 2017 was the best year for Pakistani banks, mainly because it recorded the maximum number of efficient banks i.e. 10. Moreover, there were minimum scores of scale inefficiency i.e. 3.87%, and maximum scores of TE, PTE, and SE, as well.
As far as the Indian banking sector is concerned, it performed significantly better than Pakistani banks. The results have been mentioned in Table 3. On an average, these banks scored 93.8% in terms of the technical grounds, and 97.4% in terms of their managerial capabilities, and 96.3% in maintaining the productive scale size. That is to say, all the three standards experienced an upward directional trend, as the year passed after 2015. The detailed results have been presented in Annexure-A1. It is evident that the ICICI bank, Tamilnad Mercantile bank, Catholic Syrian bank, and the Lakshmi Vilas Bank are the respective banks that are seen to be performing exceptionally well in all three departments of efficiency estimates from the years 2013 to 2017.
80.000
85.000
90.000
95.000
100.000
2013 2014 2015 2016 2017
TE PTE SE

Aamir Shahzad, Tahir Mahmood, Mehwish Shahzad 56
Table 3: Separate Country Analysis of India. A Year-Wise Efficiency
Summary
Year TE PTE SE T-INE PT-INE S-INF No. of Efficient
Banks
2013 94.342 97.711 96.601 5.658 2.289 3.399 8 2014 92.632 96.742 95.819 7.368 3.258 4.181 6 2015 92.453 97.189 95.166 7.547 2.811 4.834 6 2016 94.100 97.195 96.879 5.900 2.805 3.121 7 2017 95.632 98.389 97.232 4.368 1.611 2.768 8
Average 93.832 97.445 96.339 6.168 2.555 3.661 7.000
Source: Author’s own estimates Note: TE is the Technical efficiency, PTE is the Pure technical efficiency, SE is the Scale efficiency, T-INE is the Technical inefficiency, PT-INE is the Pure technical inefficiency, and S-INE is the Scale inefficiency.
Figure 2: Efficiency Trend of Indian Private Banks
As seen from the results, on an average scale, the sampled banks deviated (100-96.3=3.7%) from their optimal size of the scale. If a comparison was made between the average efficiency scores, and the number of efficient banks of both countries, it would be evident that the win would be for India. Moreover, if we consider the level of inefficiency, Indian banks showed a lower average percentage, as compared to Pakistani banks, in the separate country analysis.
The findings of the joint country analysis were quite interesting, and completely in line with a study conducted by (Sathye, 2015). The score of efficiency declined as the frontier got wider. Moreover, the average efficiency showed a decrease, because each bank that was taken into consideration, from each of the countries, was relatively compared with all the banks that were included in the analysis. Moreover, the cross-country frontier analysis broadened the scope of the comparison that resulted the
88.000
90.000
92.000
94.000
96.000
98.000
100.000
2013 2014 2015 2016 2017
TE PTE SE

A Comparative Study of Banking Sectors of Pakistan and India 57
reduction of the efficiency estimates, as seen in Table 4. On an overall scale, both the countries excelled by 89.2% in technological utilization, with a 94.7% win in terms of the managerial competences, and 94.1% win in keeping the optimal size of the productively intact, throughout the period of analysis. In addition to this, we can clearly observe that the private banks of both the countries reacted, by performing consistently well after the year 2015. The efficiency lines seen in the Figure 3 have been seen to be moving faster in an upward direction, so as to achieve the maximum level of efficiency. It is also worth noticing that after 2015, the number of efficient banks tended to increase, and the levels of inefficiency decreased, as clearly seen in Annexure-B of this paper.
Table 4: Joint Country Analysis of Pakistan & India. Year-Wise
Efficiency Summary
YEAR TE PTE SE T-INE PT-INE S-INF No. of Efficient
Banks
2013 89.805 95.063 94.443 10.195 4.937 5.557 9 2014 86.563 92.579 93.552 13.437 7.421 6.448 5 2015 86.489 93.600 92.419 13.511 6.400 7.581 5 2016 90.595 95.568 94.819 9.405 4.432 5.181 8 2017 92.561 96.903 95.496 7.439 3.097 4.504 12
Average 89.203 94.743 94.146 10.797 5.257 5.854 7.800
Source: Author’s own estimates Note: TE is the Technical efficiency, PTE is the Pure technical efficiency, SE is the Scale efficiency, T-INE is the Technical inefficiency, PT-INE is the Pure technical inefficiency, and S-INE is the Scale inefficiency.

Aamir Shahzad, Tahir Mahmood, Mehwish Shahzad 58
Figure 3: Efficiency Trend of Pakistani and Indian Private Banks
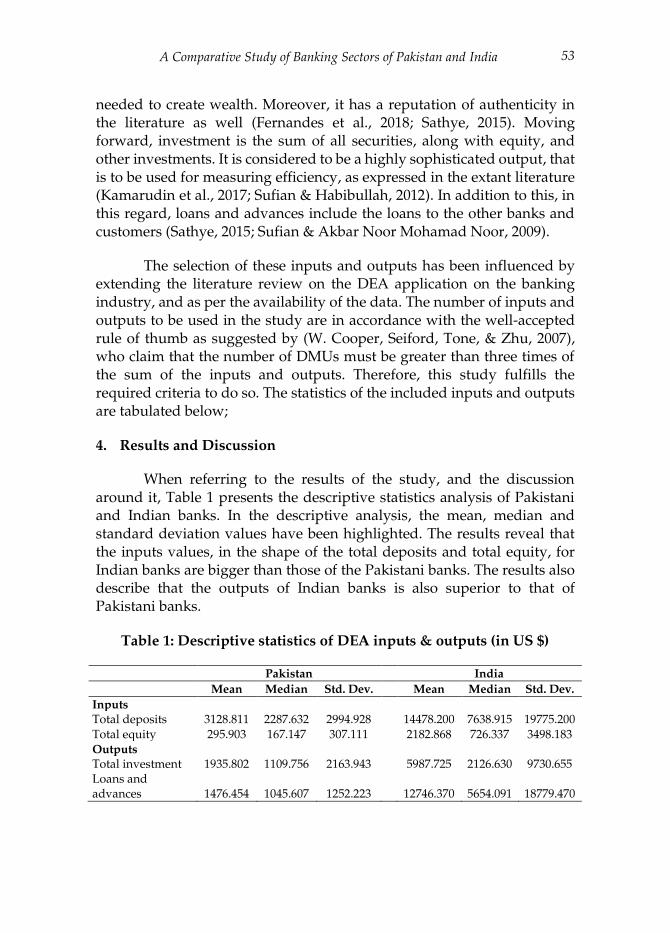
Had we penetrated deeper, and distributed the joint frontier analysis between the two countries, the performance of each country could then be judged separately. The country-wise average efficiency scores have been given in Table 5. The average TE, PTE and SE of the private banks in India, for the five years taken into consideration, encompassing a time frame from the year 2013 to 2017, came out to be 91%, 95.7% and 95.3%, respectively. These values were clearly more than the 87.4%, 93.8% and 93% of the Pakistani banks.
Table 5: Joint country analysis of India and Pakistan. Country-wise
efficiency summary
Country AV. TE AV. PTE AV. SE
India 91.032 95.661 95.251 Pakistan 87.374 93.844 93.040
Source: Author’s own estimates Note: AV. TE is the Average Technical Efficiency, AV. PTE is the Average Pure Technical Efficiency, and AV. SE is the Average Scale Efficiency
80.000
85.000
90.000
95.000
100.000
2013 2014 2015 2016 2017
TE PTE SE
A Comparative Study of Banking Sectors of Pakistan and India 59
Figure 4: Efficiency Bars of Pakistani and Indian Private Banks
The heights of the average scores of the three efficiency levels in the Figure 4 also proved the evidence confirming the superior position of Indian banks over Pakistani banks.
Here, it is noteworthy that the banks that have been considered, either in the separate country analysis, or in the joint country analysis, have shown 100% TE scores. Moreover, they have always reflected the same scores for PTE and SE as well. But some banks that have been highlighted in the Annexures have shown 100% scores of PTE, but they have not shown 100% scores of TE. This primarily means that the banks that failed to influence the grand efficiency frontier, while operating with the VRS, were declared to be inefficient. This inefficiency was either due to the PTE or SE that should have ideally been improved in order to meet the highest level of efficiency. It also means that if a bank operates at a level that is more than the productive scale size, or operates at a level that is less than that scale, it will be considered as an inefficient bank. To analyze this revelation more closely, the study looked into a returns to scale analysis.
4.2. Returns To Scale Analysis
The applied models restrict the sampled banks of Pakistan and India, to operate according to either the CRS or the VRS framework. While functioning with the CRS, it was noticed that an increase in the input required a same, proportionate increase in the output. Contrary to this however, an increase in the input demands a disproportionate growth in the output, particularly when the banks operate under the VRS. Therefore, while working with the VRS, the returns to scale that were experienced over the years that have been taken into consideration may either be an
80.000
85.000
90.000
95.000
100.000
AV. TE AV. PTE AV. SE
INDIA PAKISTAN

Aamir Shahzad, Tahir Mahmood, Mehwish Shahzad 60
increasing, decreasing or constant return to scale (CRS, IRS, DRS). Moreover, when a bank’s measured output of relative efficiency returns at the level of the CRS, it means that it is operating at a 100% level of efficiency. Furthermore, when the efficiency level increases with the passage of time, it indicates towards an operation at the IRS, and vice versa. The return to scale analysis provides a much delegated picture of the analysis. There are a total of 38 banks that have been taken into consideration in the experiment, and every bank has to operate at least one scale of return, for each year.
When discussing the country level analysis, the results of the returns to scale of Pakistani private banks, are presented in Table 6. As it is evident, from the total sampled banks, 52% were operational at the DRS, 16% at IRS and, 33% at CRS. In this regard, Samba Bank and Summit Bank were banks that were fully efficient, with 100% efficiency scores at all the levels of efficiency, and showing their operational returns at CRS, as seen in Table 7. Furthermore, the same in the case for Indian banks. ICICI Bank, Tamilnad Mercantile Bank, Catholic Syrian Bank, and Lakshmi Vilas Bank were banks that were functioning at CRS. This is the primary reason why these banks were nominated as fully efficient banks, particularly in their own country’s efficiency frontier analysis. It also means that these banks established the optimal combination of inputs and outputs in their operations, while always operating at CRS.

A Comparative Study of Banking Sectors of Pakistan and India 61
Ta
ble
6: S
ep
ara
te C
ou
ntr
y A
nal
ysi
s o
f P
ak
ista
n. R
etu
rns
to S
cale
An
aly
sis
Ba
nk
s 2
013
2
014
2
015
2
016
2
017
C
ou
nt
ban
k i
n n
o.
Co
un
t b
an
k %
RE
TU
RN
TO
SC
AL
E
CR
S
IRS
D
RS
C
RS
IR
S
DR
S
Alb
ara
ka B
an
k (
Pak
ista
n)
Ltd
. ir
s ir
s ir
s ir
s ir
s 0
5
0
0
1
00
0
All
ied
Ba
nk
Ltd
. d
rs
drs
d
rs
drs
d
rs
0
0
5
0
0
10
0
Ask
ari
Ba
nk
Ltd
. d
rs
drs
d
rs
drs
-
1
0
4
20
0
80
Ba
nk
Al-
Ha
bib
Ltd
. -
- d
rs
- -
4
0
1
80
0
20
Ba
nk
Alf
ala
h L
td.
drs
d
rs
drs
d
rs
drs
0
0
5
0
0
1
00
Ba
nk
isla
mi
Pak
ista
n L
td.
irs
irs
irs
irs
irs
0
5
0
0
10
0 0
D
ub
ai
Isla
mi
Ba
nk
Pa
kis
tan
Ltd
. ir
s ir
s -
- -
3
2
0
60
40
0
Fa
ysa
l B
an
k L
td.
- d
rs
drs
d
rs
drs
1
0
4
2
0 0
8
0 H
ab
ib B
an
k L
td.
drs
d
rs
drs
d
rs
drs
0
0
5
0
0
1
00
Ha
bib
Me
tro
po
lita
n B
an
k L
td.
drs
d
rs
drs
d
rs
- 1
0
4
2
0 0
8
0 JS
Ba
nk
Ltd
. ir
s -
- d
rs
- 3
1
1
6
0 2
0 2
0 M
CB
Ba
nk
Ltd
. -
drs
d
rs
drs
d
rs
1
0
4
20
0
80
Me
eza
n B
an
k L
td.
irs
drs
d
rs
drs
-
1
1
3
20
20
60
Sa
mb
a B
ank
Ltd
-
- -
- -
5
0
0
10
0 0
0
S
ilk
ba
nk
Lim
ite
d
- -
- -
irs
4
1
0
80
20
0
So
ne
ri B
an
k L
td.
drs
d
rs
drs
d
rs
- 1
0
4
2
0 0
8
0 S
tan
da
rd C
ha
rte
red
Ba
nk
(P
ak
ista
n)
Ltd
. d
rs
drs
d
rs
drs
d
rs
0
0
5
0
0
10
0 S
um
mit
Ba
nk
Ltd
. -
- -
- -
5
0
0
10
0 0
0
U
nit
ed
Ba
nk
Ltd
. d
rs
drs
d
rs
drs
-
1
0
4
20
0
80
31
15
49
33
16
52
Sou
rce:
Au
tho
r’s
ow
n e
stim
ate
s N
ote:
CR
S I
s th
e C
on
sta
nt
Ret
urn
to
Sca
le, I
RS
Is
the
Incr
easi
ng
Ret
urn
to
Sca
le, A
nd
DR
S I
s th
e D
ecre
asi
ng
Ret
urn
to
Sca
le

Aamir Shahzad, Tahir Mahmood, Mehwish Shahzad 62
Whereas, when observing Table 7 at a glance, Indian banks exhibited percentages of 37%, 31% and 33% of the operating returns, when it came to the CRS, IRS, and the DRS measures consecutively. While making a comparison of the efficiency scores with the returns to scale results, in the separate country analysis, it can be clearly inferred that the overall Indian private banks have maintained higher efficiency scores (Table 2&3), as compared to Pakistani banks. Moreover, they also preserved the same position in their returns to scale analysis as well. Moreover, it can also be seen that 37% of the Indian banks were operating at CRS, and 31% of them were at IRS. However, the percentage of the Pakistani banks operating with CRS was at 33%, and the IRS was at a 16% level, which was observed to be lower than Indian banks.

A Comparative Study of Banking Sectors of Pakistan and India 63
Ta
ble
7: S
ep
ara
te C
ou
ntr
y A
nal
ysi
s o
f In
dia
. R
etu
rns
to S
cale
An
aly
sis
Ba
nk
s 2
01
3 2
01
4 2
01
5
20
16
20
17
Co
un
t b
an
k i
n n
o.
Co
un
t b
an
k %
RE
TU
RN
TO
SC
AL
E
CR
S
IRS
D
RS
C
RS
IR
S
DR
S
Ax
is B
an
k L
td.
drs
d
rs
drs
-
- 2
0
3
4
0 0
6
0 C
ity
Un
ion
Ba
nk
Ltd
. ir
s ir
s ir
s ir
s ir
s 0
5
0
0
1
00
0
DC
B B
an
k L
td.
irs
irs
irs
irs
irs
0
5
0
0
10
0 0
D
ha
nla
xm
i B
an
k L
td
- ir
s -
- -
4
1
0
80
20
0
HD
FC
Ba
nk
Ltd
.
drs
d
rs
drs
d
rs
drs
0
0
5
0
0
1
00
ICIC
I B
an
k L
td.
- -
- -
- 5
0
0
1
00
0
0
Ind
usi
nd
Ba
nk
Ltd
. ir
s ir
s ir
s ir
s ir
s 0
5
0
0
1
00
0
Ko
tak
Ma
hin
dra
Ba
nk
Ltd
. -
irs
irs
drs
ir
s 1
3
1
2
0 6
0 2
0 N
ain
ita
l B
an
k L
td.
ir
s ir
s ir
s ir
s ir
s 0
5
0
0
1
00
0
RB
L B
an
k
- ir
s ir
s -
- 3
2
0
6
0 4
0 0
T
am
iln
ad
Me
rca
nti
le B
an
k L
td.
-
- -
- -
5
0
0
10
0 0
0
T
he
Ca
tho
lic
Sy
ria
n B
an
k L
td.
- -
- -
- 5
0
0
1
00
0
0
Th
e F
ed
era
l B
an
k L
td.
irs
irs
drs
d
rs
drs
0
2
3
0
4
0 6
0 T
he
Ja
mm
u &
Ka
shm
ir B
an
k L
td.
drs
d
rs
drs
d
rs
drs
0
0
5
0
0
1
00
Th
e K
arn
ata
ka
Ba
nk
Ltd
. d
rs
drs
d
rs
drs
d
rs
0
0
5
0
0
10
0 T
he
Ka
rur
Vy
sya
Ba
nk
Ltd
. d
rs
irs
drs
d
rs
drs
0
1
4
0
2
0 8
0 T
he
La
ksh
mi
Vil
as
Ba
nk
Ltd
. -
- -
- -
5
0
0
10
0 0
0
Th
e S
ou
th I
nd
ian
Ba
nk
Ltd
. d
rs
- -
drs
d
rs
2
0
3
40
0
60
YE
S B
an
k
- -
drs
d
rs
- 3
0
2
6
0 0
4
0
35
29
31
37
31
33
Sou
rce:
Au
tho
r’s
ow
n e
stim
ate
s N
ote:
CR
S i
s th
e C
on
sta
nt
Ret
urn
to
Sca
le, I
RS
is
the
Incr
easi
ng
Ret
urn
to
Sca
le, a
nd
DR
S i
s th
e D
ecre
asin
g R
etu
rn t
o S
cale

Aamir Shahzad, Tahir Mahmood, Mehwish Shahzad 64
The results obtained from the table display that in India, a greater number of banks exhibit 100% efficiency scores (CRS), or increasing efficiency levels (IRS) as compared to Pakistani banks. While discussing about the DRS, the proportion of Pakistani banks is 52%, which is higher than the Indian banks. This essentially implies that Pakistani banks, operating with DRS, have shown lower efficiency scores. It can also be inferred from the comparison that working with CRS or IRS always enhances the efficiency. On the other hand, operating with DRS tends to reduce the efficiency level as well.
In the joint country analysis, the results of the returns to scale are tabulated in Table 8. On an overall level, the percentage of the total banks sampled that contained the DRS, IRS and CRS scores of both the countries were at 47%, 32%, and 22%, respectively. This happens to be a consolidated, unfavorable level of operating returns, as the value of the DRS is deemed to be higher. This is primarily because when we combined both the countries under the joint country analysis umbrella, the efficiency tended to decrease, which caused more banks to operate with DRS.

A Comparative Study of Banking Sectors of Pakistan and India 65
Table 8: Joint Country Analysis of Pakistan and India. Return to Scale
Analysis
Banks 2013 2014 2015 2016 2017 Count bank in no. Count bank %
RETURN TO SCALE CRS IRS DRS CRS IRS DRS
India
Axis Bank Ltd. drs drs drs - - 2 0 3 40 0 60 City Union Bank Ltd. irs irs irs Irs irs 0 5 0 0 100 0 DCB Bank Ltd. irs irs irs Irs irs 0 5 0 0 100 0 Dhanlaxmi Bank Ltd irs irs irs Irs irs 0 5 0 0 100 0 HDFC Bank Ltd. drs drs drs Drs drs 0 0 5 0 0 100 ICICI Bank Ltd. - - - - drs 4 0 1 80 0 20 Indusind Bank Ltd. irs irs drs Irs drs 0 3 2 0 60 40 Kotak Mahindra Bank Ltd. - irs irs Drs drs 1 2 2 20 40 40 Nainital Bank Ltd. irs irs irs Irs irs 0 5 0 0 100 0 RBL Bank - irs irs - irs 2 3 0 40 60 0 Tamilnad Mercantile Bank Ltd. - - drs - - 4 0 1 80 0 20 The Catholic Syrian Bank Ltd. irs irs irs Irs irs 0 5 0 0 100 0 The Federal Bank Ltd. irs drs drs Drs drs 0 1 4 0 20 80 The Jammu & Kashmir Bank Ltd.
drs drs drs Drs drs 0 0 5
0 0 100
The Karnataka Bank Ltd. drs drs drs Drs drs 0 0 5 0 0 100 The Karur Vysya Bank Ltd. drs drs drs Drs drs 0 0 5 0 0 100 The Lakshmi Vilas Bank Ltd. - drs drs - - 3 0 2 60 0 40 The South Indian Bank Ltd. drs drs drs Drs drs 0 0 5 0 0 100 YES Bank - drs drs Drs drs 1 0 4 20 0 80
17 34 44 18 36 46
Pakistan
Albaraka Bank (Pakistan) Ltd. irs irs irs Irs irs 0 5 0 0 100 0 Allied Bank Ltd. drs drs drs Drs drs 0 0 5 0 0 100 Askari Bank Ltd. drs drs drs Drs - 1 0 4 20 0 80 Bank Al-Habib Ltd. - - drs - - 4 0 1 80 0 20 Bank Alfalah Ltd. drs drs drs Drs drs 0 0 5 0 0 100 Bankislami Pakistan Ltd. irs irs irs Irs irs 0 5 0 0 100 0 Dubai Islami Bank Pakistan Ltd.
irs irs - Irs irs 1 4 0
20 80 0
Faysal Bank Ltd. - drs drs Drs drs 1 0 4 20 0 80 Habib Bank Ltd. drs drs drs Drs drs 0 0 5 0 0 100 Habib Metropolitan Bank Ltd. irs drs drs Drs - 1 1 3 20 20 60 JS Bank Ltd. irs - - Drs - 3 1 1 60 20 20 MCB Bank Ltd. - drs drs Drs drs 1 0 4 20 0 80 Meezan Bank Ltd. irs drs drs Drs - 1 1 3 20 20 60 Samba Bank Ltd irs irs - - - 3 2 0 60 40 0 Silkbank Limited irs irs irs Irs irs 0 5 0 0 100 0 Soneri Bank Ltd. irs irs - Drs - 2 2 1 40 40 20 Standard Chartered Bank (Pakistan) Ltd.
drs drs drs Drs drs 0 0 5
0 0 100
Summit Bank Ltd. - - - - - 5 0 0 100 0 0 United Bank Ltd. drs drs drs Drs - 1 0 4 20 0 80 24 26 45 25 27 47 41 60 89 22 32 47
Source: Author’s own estimates Note: CRS is the Constant Return to Scale, IRS is the Increasing Return to Scale, and DRS is the Decreasing Return to Scale.

Aamir Shahzad, Tahir Mahmood, Mehwish Shahzad 66
If we were to analyze the results more deeply, and split the joint analysis, the efficiency of Indian banks tended to remain higher than that in Pakistani banks. Although the proportion of Pakistani banks, operating under the CRS has been higher than the Indian banks, yet, the percentage of Indian banks working with IRS happens to be much higher than that in Pakistani banks. As the increase in the efficiency acts as a factor, contributing towards an additive impact of CRS and IRS, it is also negatively associated with the increase in the DRS. Therefore, 18% of Indian banks tend to operate with CRS, and 36% with IRS. Whereas, 25% banks of Pakistan exhibit CRS, 27% work with IRS, and 47% operate with DRS. Moreover, the percentage of Pakistani banks operating with DRS i.e. 47%, is higher than the same variable in the Indian banks i.e. 46%. The reported results imply that the banks have experienced more points in CRS & IRS, showing better and more efficiency scores. Therefore, an increase in CRS and IRS has become one of the main sources of improvement in the efficiency, particularly for underperforming banks. But while looking at the results of DRS, it is clear that the efficiency responds in an opposite manner to the DRS. It also means that higher percentages of DRS contribute adversely towards all the levels of efficiency. Therefore, the efficient performance of the banks can be predicted by their returns to scale. Moreover, these findings are supported by the literary evidence available on this discipline (Aghimien et al., 2016; Banya & Biekpe, 2018; Yudistira, 2004).
Moving on, Table 9 specifies the annual productivity changes during the time span from 2013 to 2017, and the decomposed components of the banking sectors of both the countries. Overall, we can observe that the TFP change, during the five years of analysis is 1.014 (Tfpch > 1); thus showing a change in the TFP at a percentage of 1.4, during the period of analysis. The most productive year during the encompassed period was observed to be 2015, when the change in TFP was at a rate of 4.1%. It is also noteworthy that 2015 was the year which experienced a significant growth in the efficiency, for both the countries, in the joint country frontier analysis. The reason for this high rate of increase happened to be the positive progress of technological advancements (Techch = 4.4%).

A Comparative Study of Banking Sectors of Pakistan and India 67
Table 9: Year-wise Malmquist Productivity Index of Private
Commercial Banks of the SAARC Region
Year Effch Techch Pech Sech Tfpch
2014 0.964 1.075 0.974 0.989 1.035 2015 0.997 1.044 1.011 0.986 1.041 2016 1.051 0.902 1.022 1.029 0.948 2017 1.022 1.01 1.018 1.005 1.032
Average 1.008 1.005 1.006 1.002 1.014
Source: Author’s own estimates Note: EFFCH is the Technical Efficiency Change, TECHCH is the Technological Change, Pure Technical Efficiency Change, SECH is the Scale Efficiency Change, and TFPCH is the Total Factor Productivity Change.
Moreover, the year 2016 exhibited a deterioration of 5.2%. This decrease in the TFPCH was experienced due to the highest loss of technological component utilization, which was derived to be less than one (Techch=0.902). But the overall joint position of both the countries, reflected a positive change in the factor of Technical Efficiency, i.e.,EFFCH, the Technological Component, i.e., TECHCH, Pure Technical Efficiency, i.e., PECH, and the Scale Efficiency, i.e., SECH which were recorded at 0.8%, 0.5%, 0.6%, 0.2%, respectively. Finally, when looking at the holistic picture, the entire MPI component contributed positively, in order to gain a positive TFP rate of 1.4%.
5. Conclusion
The motivation behind this study was to examine the efficiency and productivity of private commercial banks of Pakistan and India. It is common knowledge that the banking sectors of both the countries have faced serious ups and downs in the history of their banking sector development.
For the purpose of this paper, the efficiency has been evaluated by employing the DEA method. The results of efficiency are reported in the separate, as well as joint country context, and reflect the superiority of Indian banks over Pakistani banks. In this regard, the major source of the decline in the efficiency has been observed to be the poor progress in constructing the most productive use of the available input resources, during the time period that has been taken into consideration. Therefore, keeping the results in mind and making a comparative assessment, we observe that the private banks in India are more efficient in terms of making use of their input resources, as the scores of TE that are specific to
Aamir Shahzad, Tahir Mahmood, Mehwish Shahzad 68
the Indian banks are more than that of the Pakistani banks, in both the analysis. The source of managerial inefficiency (PTE) also depends upon the underperformance of the managerial functions. In this case, the banking strategies of Indian banks are far better than those of the Pakistani banks. By combining the banks of both the countries, the overall, as well as the individual level of efficiency of each country seems to have decreased. This means that by expanding the room for experiment, so as to calculate the efficiency, the average efficiency will decrease, primarily due to the expansion in the relative comparison among the sampled banks.
The returns to scale analysis promulgates to find the source of inefficiency that might be prevailing. In both of the analysis performed, the Indian banks lead with a better operation, when it comes to the CRS and IRC. This is because the improvement in efficiency is responsible for the additive impact of CRS and IRS. Whereas, operating with DRS has always contributed adversely towards the factor of efficiency. The MPI results have also shown the changes in the decomposed elements of the TFP. The results of changes in TPF are positive, indicating an improvement in the combined effect of all the private banks included.
Nonetheless, the study has some limitations as well. The scope of the study can be expended by estimating the cost and profile of the efficiency. Moreover, an extension in the number of years considered, and increase in the number of developing countries in the experiment may enhance the scope as well. The determinants of the efficiency, and the inclusion of the banking and environment variables can also widen the range of the research.

A Comparative Study of Banking Sectors of Pakistan and India 69
References
Aghimien, P. A., Kamarudin, F., Hamid, M., & Noordin, B. (2016). Efficiency of Gulf Cooperation Council Banks: Empirical evidence using data envelopment analysis. Review of International Business and Strategy, 26(1), 118-136.
Ataullah*, A., Cockerill, T., & Le, H. (2004). Financial liberalization and bank efficiency: a comparative analysis of India and Pakistan. Applied Economics, 36(17), 1915-1924.
Ayadi, R., Arbak, E., Naceur, S. B., & De Groen, W. P. (2015). Financial development, bank efficiency, and economic growth across the Mediterranean Economic and social development of the Southern and Eastern Mediterranean countries (pp. 219-233): Springer
Baily, M. N., & Elliott, D. J. (2013). The role of finance in the economy: implications for structural reform of the financial sector. The Brookings Institution, 11.
Banker, R. D., Charnes, A., & Cooper, W. W. (1984). Some models for estimating technical and scale inefficiencies in data envelopment analysis. Management science, 30(9), 1078-1092.
Banya, R., & Biekpe, N. (2018). Banking Efficiency and its determinants in selected Frontier African Markets. Economic Change and Restructuring, 51(1), 69-95.
Beck, T., Demirgüç-Kunt, A., & Merrouche, O. (2010). Islamic vs. conventional banking: Business model, efficiency and stability: The World Bank.
Berger, A. N., & DeYoung, R. (1997). Problem loans and cost efficiency in commercial banks. Journal of Banking & Finance, 21(6), 849-870.
Berger, A. N., & Humphrey, D. B. (1997). Efficiency of financial institutions: International survey and directions for future research. European journal of operational research, 98(2), 175-212.
Bhattacharyya, A., & Pal, S. (2013). Financial reforms and technical efficiency in Indian commercial banking: A generalized stochastic frontier analysis. Review of Financial Economics, 22(3), 109-117.

Aamir Shahzad, Tahir Mahmood, Mehwish Shahzad 70
Casu, B., & Girardone, C. (2010). Integration and efficiency convergence in EU banking markets. Omega, 38(5), 260-267.
Caves, D. W., Christensen, L. R., & Diewert, W. E. (1982). The economic theory of index numbers and the measurement of input, output, and productivity. Econometrica: Journal of the Econometric Society, 1393-1414.
Charnes, A., Cooper, W. W., & Rhodes, E. (1978). Measuring the efficiency of decision making units. European journal of operational research, 2(6), 429-444.
Coelli, T. (1996). A guide to DEAP version 2.1: a data envelopment analysis (computer) program. Centre for Efficiency and Productivity Analysis, University of New England, Australia.
Coelli, T. (1998). A multi-stage methodology for the solution of orientated DEA models. Operations Research Letters, 23(3-5), 143-149.
Cooper, W., Seiford, L., Tone, K., & Zhu, J. (2007). Some models and measures for evaluating performances with DEA: past accomplishments and future prospects. Journal of Productivity Analysis, 28(3), 151-163.
Cooper, W. W., Seiford, L. M., & Tone, K. (2000). Data Envelpoment Analysis: Kluwer Academic Publishers.
Das, S. K., & Drine, I. (2011a). Financial liberalization and banking sector efficiency in India: a Fourier Flexible functional form and stochastic frontier approach. International Business and Management, 2(1), 42-58.
Das, S. K., & Drine, I. (2011b). Financial liberalization and banking sector: Efficiency in India. International Business and Management, 2(1), 42-58.
Davutyan, N., & Yildirim, C. (2017). Efficiency in Turkish banking: post-restructuring evidence. The European Journal of Finance, 23(2), 170-191.
Dong, Y., Hamilton, R., & Tippett, M. (2014). Cost efficiency of the Chinese banking sector: a comparison of stochastic frontier analysis and data envelopment analysis. Economic Modelling, 36, 298-308.

A Comparative Study of Banking Sectors of Pakistan and India 71
Dutta, P., Jain, A., & Gupta, A. (2020). Performance analysis of non-banking finance companies using two-stage data envelopment analysis. Annals of Operations Research, 295(1), 91-116.
Emrouznejad, A., & Yang, G.-l. (2018). A survey and analysis of the first 40 years of scholarly literature in DEA: 1978–2016. Socio-Economic Planning Sciences, 61, 4-8.
Fang, Y., Hasan, I., & Marton, K. (2011). Bank efficiency in South‐Eastern Europe. Economics of Transition, 19(3), 495-520.
Färe, R., Grosskopf, S., Lindgren, B., & Roos, P. (1994). Productivity developments in Swedish hospitals: a Malmquist output index approach Data Envelopment Analysis: Theory, Methodology, and Applications (pp. 253-272): Springer
Färe, R., Grosskopf, S., Lovell, C. K., & Pasurka, C. (1989). Multilateral productivity comparisons when some outputs are undesirable: a nonparametric approach. The review of economics and statistics, 90-98.
Farrell, M. J. (1957). The measurement of productive efficiency. Journal of the Royal Statistical Society. Series A (General), 120(3), 253-290.
Fernandes, F. D. S., Stasinakis, C., & Bardarova, V. (2018). Two-stage DEA-Truncated Regression: Application in banking efficiency and financial development. Expert Systems with Applications, 96, 284-301.
Fethi, M. D., & Pasiouras, F. (2010). Assessing bank efficiency and performance with operational research and artificial intelligence techniques: A survey. European journal of operational research, 204(2), 189-198.
Fujii, H., Managi, S., & Matousek, R. (2014). Indian bank efficiency and productivity changes with undesirable outputs: A disaggregated approach. Journal of banking & finance, 38, 41-50.
He, Z., Kelly, B., & Manela, A. (2017). Intermediary asset pricing: New evidence from many asset classes. Journal of Financial Economics, 126(1), 1-35.
Kamarudin, F., Sufian, F., Loong, F. W., & Anwar, N. A. M. (2017). Assessing the domestic and foreign Islamic banks efficiency:

Aamir Shahzad, Tahir Mahmood, Mehwish Shahzad 72
Insights from selected Southeast Asian countries. Future Business Journal, 3(1), 33-46.
Khalifa Al‐Yousif, Y. (2002). Financial development and economic growth: another look at the evidence from developing countries. Review of Financial Economics, 11(2), 131-150.
Kounetas, K., & Tsekouras, K. (2007). Measuring scale efficiency change using a translog distance function. International Journal of business and economics, 6(1), 63.
Kumar, S., & Gulati, R. (2008). Evaluation of technical efficiency and ranking of public sector banks in India: An analysis from cross-sectional perspective. International journal of productivity and performance management, 57(7), 540-568.
Lampe, H. W., & Hilgers, D. (2015). Trajectories of efficiency measurement: A bibliometric analysis of DEA and SFA. European journal of operational research, 240(1), 1-21.
Levine, R. (1999). Financial development and economic growth: views and agenda: The World Bank.
Majeed, M. T., & Zanib, A. (2016). Efficiency analysis of Islamic banks in Pakistan. Humanomics, 32(1), 19-32.
Masoud, N., & Hardaker, G. (2012). The impact of financial development on economic growth: Empirical analysis of emerging market countries. Studies in Economics and Finance, 29(3), 148-173.
Menyah, K., Nazlioglu, S., & Wolde-Rufael, Y. (2014). Financial development, trade openness and economic growth in African countries: New insights from a panel causality approach. Economic Modelling, 37, 386-394.
Pasiouras, F. (2008). International evidence on the impact of regulations and supervision on banks’ technical efficiency: an application of two-stage data envelopment analysis. Review of Quantitative Finance and Accounting, 30(2), 187-223.
Porcelli, F. (2009). Measurement of Technical Efficiency. A brief survey on parametric and non-parametric techniques. University of Warwick, 11, 1-27.

A Comparative Study of Banking Sectors of Pakistan and India 73
Rahman, M., Lambkin, M., & Hussain, D. (2016). Value creation and appropriation following M&A: A data envelopment analysis. Journal of Business Research, 69(12), 5628-5635.
Sakouvogui, K. (2020). A comparative approach of stochastic frontier analysis and data envelopment analysis estimators: evidence from banking system. Journal of Economic Studies, Vol. 47 No. 7, pp. 1787-1810.
Sathye, M. (2005). Technical efficiency of large bank production in Asia and the Pacific. Multinational Finance Journal, 9(1/2), 1-22.
Say, J., Zhao, H., Agbenyegah, F. S., Nusenu, A. A., Boadi, E. A., & Egbadewoe, S. M. (2020). Regional efficiency disparities in rural and community banks in Ghana: A data envelopment analysis. Journal of Psychology in Africa, 30(3), 249-256.
Seelanatha, L. (2010). Market structure, efficiency and performance of banking industry in Sri Lanka. Banks and Bank Systems, 5(1), 20-31.
Seiford, L. M., & Thrall, R. M. (1990). Recent developments in DEA: the mathematical programming approach to frontier analysis. Journal of econometrics, 46(1-2), 7-38.
Sherman, H. D., & Gold, F. (1985). Bank branch operating efficiency: Evaluation with data envelopment analysis. Journal of Banking & Finance, 9(2), 297-315.
Stewart, C., Matousek, R., & Nguyen, T. N. (2016). Efficiency in the Vietnamese banking system: A DEA double bootstrap approach. Research in International Business and Finance, 36, 96-111.
Sufian, F., & Akbar Noor Mohamad Noor, M. (2009). The determinants of Islamic banks' efficiency changes: Empirical evidence from the MENA and Asian banking sectors. International Journal of Islamic and Middle Eastern Finance and Management, 2(2), 120-138.
Sufian, F., & Habibullah, M. S. (2012). Globalization and bank efficiency nexus: Symbiosis or parasites? Review of Development Finance, 2 (3-4), 139-155.
Thagunna, K. S., & Poudel, S. (2012). Measuring bank performance of Nepali banks: A Data envelopment analysis (DEA) perspective. International Journal of Economics and Financial Issues, 3(1), 54-65.

Aamir Shahzad, Tahir Mahmood, Mehwish Shahzad 74
Thrall, R. M. (2000). Measures in DEA with an application to the Malmquist index. Journal of productivity analysis, 13(2), 125-137.
Wanke, P., Barros, C. P., & Emrouznejad, A. (2016). Assessing productive efficiency of banks using integrated Fuzzy-DEA and bootstrapping: A case of Mozambican banks. European Journal of Operational Research, 249(1), 378-389.
Yudistira, D. 2004. Efficiency in Islamic banking: an empirical analysis of eighteen banks. Islamic economic studies, 12

A Comparative Study of Banking Sectors of Pakistan and India 75
An
nex
ure
-A
Se
pa
rate
Co
un
try
An
aly
sis
of
Pa
kis
tan
Ba
nk
-Wis
e E
ffic
ien
cy S
um
ma
ry
Ba
nk
s 2
013
201
4 2
015
201
6 2
017
CR
ST
E V
RS
TE
SC
AL
E
RS
C
RS
TE
VR
ST
E S
CA
LE
R
S
CR
ST
E V
RS
TE
SC
AL
E
RS
C
RS
TE
VR
ST
E S
CA
LE
R
S
CR
ST
E V
RS
TE
SC
AL
E
RS
Alb
ara
ka
Ba
nk
(P
ak
ista
n)
Ltd
. 0
.703
0
.815
0
.863
ir
s 0
.755
0
.885
0
.853
ir
s 0
.877
1
.000
0
.877
ir
s 0
.860
0
.927
0
.927
ir
s 0
.902
1
.000
0
.902
ir
s
All
ied
Ba
nk
Ltd
. 0
.961
1
.000
0
.961
d
rs
0.8
53
1.0
00
0.8
53
drs
0
.916
0
.986
0
.929
d
rs
0.9
45
1.0
00
0.9
45
drs
0
.903
0
.951
0
.949
d
rs
Ask
ari
Ba
nk
Ltd
. 0
.965
1
.000
0
.965
d
rs
0.8
76
1.0
00
0.8
76
drs
0
.856
1
.000
0
.856
d
rs
0.9
47
1.0
00
0.9
47
drs
1
.000
1
.000
1
.000
Ba
nk
Al-
Ha
bib
Ltd
. 1
.000
1
.000
1
.000
1.0
00
1.0
00
1.0
00
0
.928
1
.000
0
.928
d
rs
1.0
00
1.0
00
1.0
00
1
.000
1
.000
1
.000
Ba
nk
Alf
ala
h L
td.
0.8
90
1.0
00
0.8
90
drs
0
.844
1
.000
0
.844
d
rs
0.8
85
1.0
00
0.8
85
drs
0
.983
1
.000
0
.983
d
rs
0.9
05
1.0
00
0.9
05
drs
B
an
kis
lam
i P
ak
ista
n
Ltd
. 0
.855
0
.959
0
.892
ir
s 0
.678
0
.829
0
.818
ir
s 0
.630
0
.648
0
.971
ir
s 0
.771
0
.807
0
.956
ir
s 0
.970
1
.000
0
.970
ir
s
Du
ba
i Is
lam
i B
an
k
Pa
kis
tan
Ltd
. 0
.804
0
.884
0
.910
ir
s 0
.890
0
.906
0
.983
ir
s 1
.000
1
.000
1
.000
1.0
00
1.0
00
1.0
00
1
.000
1
.000
1
.000
Fa
ysa
l B
an
k L
td.
1.0
00
1.0
00
1.0
00
0
.983
1
.000
0
.983
d
rs
0.9
82
1.0
00
0.9
82
drs
0
.937
0
.966
0
.969
d
rs
0.8
62
0.9
32
0.9
25
drs
H
ab
ib B
an
k L
td.
0.9
20
1.0
00
0.9
20
drs
0
.779
1
.000
0
.779
d
rs
0.9
52
1.0
00
0.9
52
drs
0
.931
1
.000
0
.931
d
rs
0.9
15
1.0
00
0.9
15
drs
H
ab
ib M
etr
op
oli
tan
B
an
k L
td.
0.9
95
1.0
00
0.9
95
drs
0
.893
0
.927
0
.964
d
rs
0.9
22
0.9
57
0.9
63
drs
0
.963
0
.992
0
.971
d
rs
1.0
00
1.0
00
1.0
00
JS B
an
k L
td.
0.8
68
0.9
23
0.9
41
irs
1.0
00
1.0
00
1.0
00
1
.000
1
.000
1
.000
0.8
32
0.8
34
0.9
97
drs
1
.000
1
.000
1
.000
MC
B B
ank
Ltd
. 1
.000
1
.000
1
.000
0.9
41
1.0
00
0.9
41
drs
0
.855
1
.000
0
.855
d
rs
0.7
91
1.0
00
0.7
91
drs
0
.764
0
.943
0
.810
d
rs
Mee
zan
Ba
nk
Ltd
. 0
.911
0
.918
0
.993
ir
s 0
.673
0
.853
0
.789
d
rs
0.6
55
0.8
27
0.7
92
drs
0
.932
1
.000
0
.932
d
rs
1.0
00
1.0
00
1.0
00
S
amb
a B
an
k L
td
1.0
00
1.0
00
1.0
00
1
.000
1
.000
1
.000
1.0
00
1.0
00
1.0
00
1
.000
1
.000
1
.000
1.0
00
1.0
00
1.0
00
S
ilk
ba
nk
Lim
ite
d
1.0
00
1.0
00
1.0
00
1
.000
1
.000
1
.000
1.0
00
1.0
00
1.0
00
1
.000
1
.000
1
.000
0.9
80
1.0
00
0.9
80
irs
So
ne
ri B
an
k L
td.
0.9
48
0.9
55
0.9
93
drs
0
.941
0
.956
0
.984
d
rs
0.9
34
0.9
46
0.9
88
drs
0
.966
0
.978
0
.987
d
rs
1.0
00
1.0
00
1.0
00
S
tan
da
rd C
ha
rte
red
B
an
k (
Pa
kis
tan
) L
td.
0.8
50
0.8
90
0.9
55
drs
0
.780
0
.858
0
.909
d
rs
0.7
51
0.8
54
0.8
80
drs
0
.718
0
.867
0
.828
d
rs
0.7
55
0.8
31
0.9
09
drs
Su
mm
it B
an
k L
td.
1.0
00
1.0
00
1.0
00
1
.000
1
.000
1
.000
1.0
00
1.0
00
1.0
00
1
.000
1
.000
1
.000
1.0
00
1.0
00
1.0
00
U
nit
ed
Ban
k L
td.
0.8
92
1.0
00
0.8
92
drs
0
.790
1
.000
0
.790
d
rs
0.8
14
1.0
00
0.8
14
drs
0
.856
0
.975
0
.878
d
rs
1.0
00
1.0
00
1.0
00
A
VE
RA
GE
0
.924
0
.965
0
.956
0.8
78
0.9
59
0.9
14
0
.892
0
.959
0
.930
0.9
17
0.9
66
0.9
50
0
.945
0
.982
0
.961
Sou
rce:
Au
tho
r’s
ow
n e
stim
ate
s N
ote:
Bla
nk
Co
nst
an
t R
etu
rn t
o S
cale
, IR
S I
ncr
easi
ng
Ret
urn
to
Sca
le, A
nd
DR
S D
ecre
asi
ng
Ret
urn
to
Sca
le
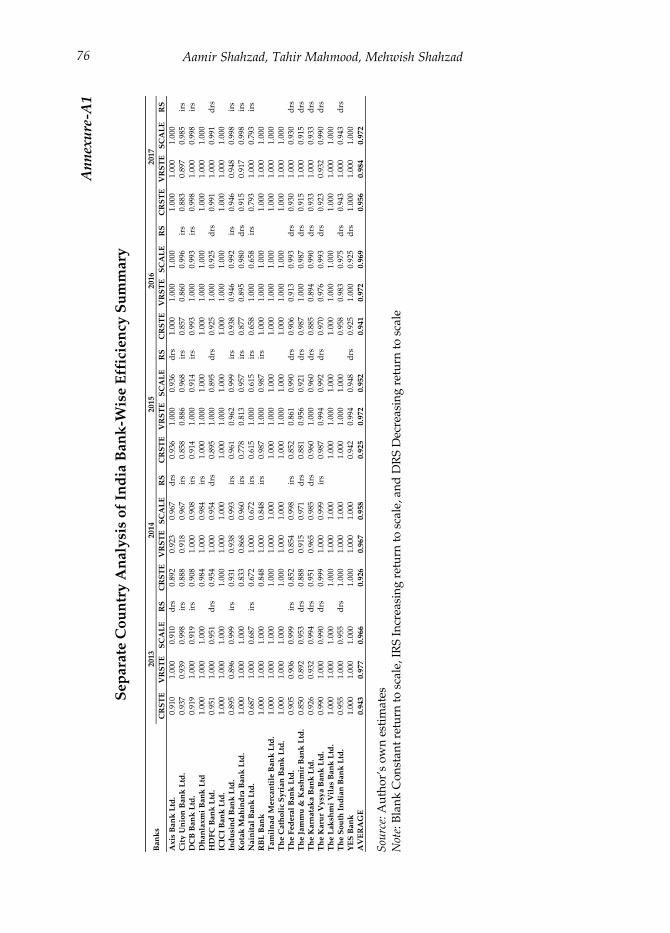
Aamir Shahzad, Tahir Mahmood, Mehwish Shahzad 76
An
nex
ure
-A1
Se
pa
rate
Co
un
try
An
aly
sis
of
Ind
ia B
an
k-W
ise E
ffic
ien
cy S
um
mary
Ban
ks
2013
2014
2015
2016
2017
CR
ST
E
VR
ST
E
SC
AL
E
RS
C
RS
TE
V
RS
TE
S
CA
LE
R
S
CR
ST
E
VR
ST
E
SC
AL
E
RS
C
RS
TE
V
RS
TE
S
CA
LE
R
S
CR
ST
E
VR
ST
E
SC
AL
E
RS
Axis
Ban
k L
td.
0.91
0 1.
000
0.91
0 d
rs
0.89
2 0.
923
0.96
7 d
rs
0.93
6 1.
000
0.93
6 d
rs
1.00
0 1.
000
1.00
0
1.00
0 1.
000
1.00
0
Cit
y U
nio
n B
an
k L
td.
0.93
7 0.
939
0.99
8 ir
s 0.
888
0.91
8 0.
967
irs
0.85
8 0.
886
0.96
8 ir
s 0.
857
0.86
0 0.
996
irs
0.88
3 0.
897
0.98
5 ir
s D
CB
Ban
k L
td.
0.91
9 1.
000
0.91
9 ir
s 0.
908
1.00
0 0.
908
irs
0.91
4 1.
000
0.91
4 ir
s 0.
993
1.00
0 0.
993
irs
0.99
8 1.
000
0.99
8 ir
s
Dh
an
laxm
i B
an
k L
td
1.00
0 1.
000
1.00
0
0.98
4 1.
000
0.98
4 ir
s 1.
000
1.00
0 1.
000
1.
000
1.00
0 1.
000
1.
000
1.00
0 1.
000
H
DF
C B
an
k L
td.
0.95
1 1.
000
0.95
1 d
rs
0.95
4 1.
000
0.95
4 d
rs
0.89
5 1.
000
0.89
5 d
rs
0.92
5 1.
000
0.92
5 d
rs
0.99
1 1.
000
0.99
1 d
rs
ICIC
I B
an
k L
td.
1.00
0 1.
000
1.00
0
1.00
0 1.
000
1.00
0
1.00
0 1.
000
1.00
0
1.00
0 1.
000
1.00
0
1.00
0 1.
000
1.00
0
Ind
usi
nd
Ban
k L
td.
0.89
5 0.
896
0.99
9 ir
s 0.
931
0.93
8 0.
993
irs
0.96
1 0.
962
0.99
9 ir
s 0.
938
0.94
6 0.
992
irs
0.94
6 0.
948
0.99
8 ir
s K
ota
k M
ah
ind
ra B
an
k L
td.
1.00
0 1.
000
1.00
0
0.83
3 0.
868
0.96
0 ir
s 0.
778
0.81
3 0.
957
irs
0.87
7 0.
895
0.98
0 d
rs
0.91
5 0.
917
0.99
8 ir
s N
ain
ital
Ban
k L
td.
0.68
7 1.
000
0.68
7 ir
s 0.
672
1.00
0 0.
672
irs
0.61
5 1.
000
0.61
5 ir
s 0.
658
1.00
0 0.
658
irs
0.79
3 1.
000
0.79
3 ir
s R
BL
Ban
k
1.00
0 1.
000
1.00
0
0.84
8 1.
000
0.84
8 ir
s 0.
987
1.00
0 0.
987
irs
1.00
0 1.
000
1.00
0
1.00
0 1.
000
1.00
0
Tam
iln
ad
Merc
an
tile
Ba
nk
Ltd
. 1.
000
1.00
0 1.
000
1.
000
1.00
0 1.
000
1.
000
1.00
0 1.
000
1.
000
1.00
0 1.
000
1.
000
1.00
0 1.
000
Th
e C
ath
oli
c S
yri
an
Ban
k L
td.
1.00
0 1.
000
1.00
0
1.00
0 1.
000
1.00
0
1.00
0 1.
000
1.00
0
1.00
0 1.
000
1.00
0
1.00
0 1.
000
1.00
0
Th
e F
ed
era
l B
an
k L
td.
0.90
5 0.
906
0.99
9 ir
s 0.
852
0.85
4 0.
998
irs
0.85
2 0.
861
0.99
0 d
rs
0.90
6 0.
913
0.99
3 d
rs
0.93
0 1.
000
0.93
0 d
rs
Th
e J
am
mu
& K
ash
mir
Ban
k L
td.
0.85
0 0.
892
0.95
3 d
rs
0.88
8 0.
915
0.97
1 d
rs
0.88
1 0.
956
0.92
1 d
rs
0.98
7 1.
000
0.98
7 d
rs
0.91
5 1.
000
0.91
5 d
rs
Th
e K
arn
ata
ka B
an
k L
td.
0.92
6 0.
932
0.99
4 d
rs
0.95
1 0.
965
0.98
5 d
rs
0.96
0 1.
000
0.96
0 d
rs
0.88
5 0.
894
0.99
0 d
rs
0.93
3 1.
000
0.93
3 d
rs
Th
e K
aru
r V
ysy
a B
an
k L
td.
0.99
0 1.
000
0.99
0 d
rs
0.99
9 1.
000
0.99
9 ir
s 0.
987
0.99
4 0.
992
drs
0.
970
0.97
6 0.
993
drs
0.
923
0.93
2 0.
990
drs
Th
e L
aksh
mi
Vil
as
Ban
k L
td.
1.00
0 1.
000
1.00
0
1.00
0 1.
000
1.00
0
1.00
0 1.
000
1.00
0
1.00
0 1.
000
1.00
0
1.00
0 1.
000
1.00
0
Th
e S
ou
th I
nd
ian
Ban
k L
td.
0.95
5 1.
000
0.95
5 d
rs
1.00
0 1.
000
1.00
0
1.00
0 1.
000
1.00
0
0.95
8 0.
983
0.97
5 d
rs
0.94
3 1.
000
0.94
3 d
rs
YE
S B
an
k
1.00
0 1.
000
1.00
0
1.00
0 1.
000
1.00
0
0.94
2 0.
994
0.94
8 d
rs
0.92
5 1.
000
0.92
5 d
rs
1.00
0 1.
000
1.00
0
AV
ER
AG
E
0.9
43
0.9
77
0.9
66
0.9
26
0.9
67
0.9
58
0.9
25
0.9
72
0.9
52
0.9
41
0.9
72
0.9
69
0.9
56
0.9
84
0.9
72
Sou
rce:
Au
tho
r’s
ow
n e
stim
ate
s N
ote:
Bla
nk
Co
nst
an
t re
turn
to
sca
le, I
RS
In
crea
sin
g r
etu
rn t
o s
cale
, an
d D
RS
Dec
rea
sin
g r
etu
rn t
o s
cale

A Comparative Study of Banking Sectors of Pakistan and India 77
An
nex
ure
-B
Join
t C
ou
ntr
y A
na
lysi
s o
f In
dia
& P
ak
ista
n B
an
k-W
ise E
ffic
ien
cy S
um
ma
ry
IND
IAN
BA
NK
S
2013
2014
2015
2016
2017
CR
ST
E
VR
ST
E
SC
AL
E
RS
C
RS
TE
V
RS
TE
S
CA
LE
R
S
CR
ST
E
VR
ST
E
SC
AL
E
RS
C
RS
TE
V
RS
TE
S
CA
LE
R
S
CR
ST
E
VR
ST
E
SC
AL
E
RS
Axis
Ban
k L
td.
0.91
0 1.
000
0.91
0 d
rs
0.88
3 0.
923
0.95
7 d
rs
0.91
5 1.
000
0.91
5 d
rs
1.00
0 1.
000
1.00
0
1.00
0 1.
000
1.00
0
Cit
y U
nio
n B
an
k L
td.
0.93
7 0.
939
0.99
8 ir
s 0.
868
0.87
4 0.
994
irs
0.83
0 0.
834
0.99
5 ir
s 0.
857
0.86
0 0.
996
irs
0.88
3 0.
889
0.99
4 ir
s D
CB
Ban
k L
td.
0.91
9 1.
000
0.91
9 ir
s 0.
892
0.93
1 0.
958
irs
0.88
9 0.
985
0.90
2 ir
s 0.
993
1.00
0 0.
993
irs
0.99
6 1.
000
0.99
6 ir
s
Dh
an
laxm
i B
an
k L
td
0.97
9 1.
000
0.97
9 ir
s 0.
869
0.88
6 0.
981
irs
0.84
0 0.
898
0.93
5 ir
s 0.
978
1.00
0 0.
978
irs
0.93
9 1.
000
0.93
9 ir
s H
DF
C B
an
k L
td.
0.95
1 1.
000
0.95
1 d
rs
0.94
4 1.
000
0.94
4 d
rs
0.87
9 1.
000
0.87
9 d
rs
0.92
5 1.
000
0.92
5 d
rs
0.98
8 1.
000
0.98
8 d
rs
ICIC
I B
an
k L
td.
1.00
0 1.
000
1.00
0
1.00
0 1.
000
1.00
0
1.00
0 1.
000
1.00
0
1.00
0 1.
000
1.00
0
0.99
6 1.
000
0.99
6 d
rs
Ind
usi
nd
Ban
k L
td.
0.89
5 0.
896
0.99
9 ir
s 0.
930
0.93
3 0.
997
irs
0.95
0 0.
959
0.99
0 d
rs
0.93
8 0.
946
0.99
2 ir
s 0.
934
0.94
6 0.
987
drs
K
ota
k M
ah
ind
ra B
an
k L
td.
1.00
0 1.
000
1.00
0
0.83
3 0.
850
0.98
0 ir
s 0.
778
0.79
8 0.
975
irs
0.87
7 0.
885
0.99
1 d
rs
0.90
5 0.
914
0.99
0 d
rs
Nain
ital
Ban
k L
td.
0.68
7 1.
000
0.68
7 ir
s 0.
645
1.00
0 0.
645
irs
0.57
1 1.
000
0.57
1 ir
s 0.
622
1.00
0 0.
622
irs
0.63
0 1.
000
0.63
0 ir
s R
BL
Ban
k
1.00
0 1.
000
1.00
0
0.83
9 0.
948
0.88
6 ir
s 0.
911
0.96
6 0.
943
irs
1.00
0 1.
000
1.00
0
0.98
6 0.
990
0.99
6 ir
s T
am
iln
ad
Merc
an
tile
Ban
k L
td.
1.00
0 1.
000
1.00
0
1.00
0 1.
000
1.00
0
0.98
5 1.
000
0.98
5 d
rs
1.00
0 1.
000
1.00
0
1.00
0 1.
000
1.00
0
Th
e C
ath
oli
c S
yri
an
Ban
k L
td.
0.97
7 0.
994
0.98
3 ir
s 0.
860
0.86
9 0.
990
irs
0.86
9 0.
894
0.97
3 ir
s 0.
820
0.85
9 0.
954
irs
0.80
9 0.
876
0.92
3 ir
s T
he F
ed
era
l B
an
k L
td.
0.90
5 0.
906
0.99
9 ir
s 0.
829
0.84
4 0.
983
drs
0.
820
0.86
0 0.
953
drs
0.
883
0.89
7 0.
985
drs
0.
926
1.00
0 0.
926
drs
T
he J
am
mu
& K
ash
mir
Ban
k L
td.
0.84
7 0.
892
0.95
0 d
rs
0.83
2 0.
915
0.90
9 d
rs
0.81
1 0.
872
0.93
0 d
rs
0.96
0 1.
000
0.96
0 d
rs
0.88
2 0.
960
0.91
9 d
rs
Th
e K
arn
ata
ka B
an
k L
td.
0.92
6 0.
932
0.99
4 d
rs
0.88
5 0.
930
0.95
2 d
rs
0.87
3 0.
934
0.93
5 d
rs
0.84
5 0.
856
0.98
7 d
rs
0.84
0 0.
863
0.97
4 d
rs
Th
e K
aru
r V
ysy
a B
an
k L
td.
0.99
0 1.
000
0.99
0 d
rs
0.96
8 0.
997
0.97
1 d
rs
0.94
2 0.
988
0.95
3 d
rs
0.96
1 0.
976
0.98
5 d
rs
0.92
1 0.
929
0.99
2 d
rs
Th
e L
aksh
mi
Vil
as
Ban
k L
td.
1.00
0 1.
000
1.00
0
0.92
3 0.
929
0.99
3 d
rs
0.94
1 0.
971
0.97
0 d
rs
1.00
0 1.
000
1.00
0
1.00
0 1.
000
1.00
0
Th
e S
ou
th I
nd
ian
Ban
k L
td.
0.95
5 1.
000
0.95
5 d
rs
0.96
6 1.
000
0.96
6 d
rs
0.92
3 1.
000
0.92
3 d
rs
0.95
0 0.
983
0.96
7 d
rs
0.91
0 1.
000
0.91
0 d
rs
YE
S B
an
k
1.00
0 1.
000
1.00
0
0.94
0 1.
000
0.94
0 d
rs
0.89
4 0.
943
0.94
8 d
rs
0.92
5 0.
959
0.96
5 d
rs
0.99
6 1.
000
0.99
6 d
rs
AV
ER
AG
E
0.9
41
0.9
77
0.9
64
0.8
90
0.9
38
0.9
50
0.8
75
0.9
42
0.9
30
0.9
23
0.9
59
0.9
63
0.9
23
0.9
67
0.9
56
Sou
rce:
Au
tho
r’s
ow
n e
stim
ate
s N
ote:
Bla
nk
Co
nst
an
t re
turn
to
sca
le, I
RS
In
crea
sin
g r
etu
rn t
o s
cale
, an
d D
RS
Dec
rea
sin
g r
etu
rn t
o s
cale

Aamir Shahzad, Tahir Mahmood, Mehwish Shahzad 78
An
nex
ure
-B
Join
t C
ou
ntr
y A
na
lysi
s o
f In
dia
& P
ak
ista
n B
an
k-W
ise E
ffic
ien
cy S
um
ma
ry
IND
IAN
BA
NK
S
2013
2014
2015
2016
2017
CR
ST
E
VR
ST
E
SC
AL
E
RS
C
RS
TE
V
RS
TE
S
CA
LE
R
S
CR
ST
E
VR
ST
E
SC
AL
E
RS
C
RS
TE
V
RS
TE
S
CA
LE
R
S
CR
ST
E
VR
ST
E
SC
AL
E
RS
PA
KIS
TA
NI
BA
NK
S
Alb
ara
ka B
ank
(P
akis
tan
) L
td.
0.63
4 0.
776
0.81
7 ir
s 0.
716
0.82
6 0.
867
irs
0.77
1 1.
000
0.77
1 ir
s 0.
753
0.87
5 0.
861
irs
0.82
3 1.
000
0.82
3 ir
s A
llie
d B
an
k L
td.
0.92
2 0.
925
0.99
6 d
rs
0.85
1 0.
879
0.96
8 d
rs
0.91
6 0.
973
0.94
2 d
rs
0.94
5 1.
000
0.94
5 d
rs
0.90
3 0.
951
0.94
9 d
rs
Ask
ari
Ban
k L
td.
0.91
5 1.
000
0.91
5 d
rs
0.87
5 1.
000
0.87
5 d
rs
0.85
6 1.
000
0.85
6 d
rs
0.94
7 1.
000
0.94
7 d
rs
1.00
0 1.
000
1.00
0
Ban
k A
l-H
abib
Ltd
. 1.
000
1.00
0 1.
000
1.
000
1.00
0 1.
000
0.
928
1.00
0 0.
928
drs
1.
000
1.00
0 1.
000
1.
000
1.00
0 1.
000
B
an
k A
lfala
h L
td.
0.79
9 1.
000
0.79
9 d
rs
0.84
3 1.
000
0.84
3 d
rs
0.88
5 1.
000
0.88
5 d
rs
0.95
0 1.
000
0.95
0 d
rs
0.90
5 0.
968
0.93
5 d
rs
Ban
kis
lam
i P
ak
ista
n L
td.
0.74
8 0.
957
0.78
1 ir
s 0.
619
0.76
5 0.
810
irs
0.58
0 0.
648
0.89
4 ir
s 0.
724
0.77
1 0.
939
irs
0.85
0 0.
938
0.90
7 ir
s D
ub
ai I
slam
i B
an
k P
ak
ista
n L
td.
0.67
8 0.
862
0.78
7 ir
s 0.
834
0.89
8 0.
928
irs
1.00
0 1.
000
1.00
0
0.90
4 0.
972
0.93
0 ir
s 0.
947
1.00
0 0.
947
irs
Fay
sal
Ban
k L
td.
0.93
1 0.
932
1.00
0
0.92
0 0.
943
0.97
6 d
rs
0.89
6 0.
932
0.96
2 d
rs
0.87
8 0.
896
0.98
1 d
rs
0.86
2 0.
881
0.97
8 d
rs
Hab
ib B
an
k L
td.
0.90
3 1.
000
0.90
3 d
rs
0.77
9 1.
000
0.77
9 d
rs
0.95
2 1.
000
0.95
2 d
rs
0.93
1 1.
000
0.93
1 d
rs
0.91
5 1.
000
0.91
5 d
rs
Hab
ib M
etr
op
oli
tan
Ban
k L
td.
0.86
4 0.
892
0.96
8 ir
s 0.
893
0.91
7 0.
974
drs
0.
922
0.95
7 0.
963
drs
0.
963
0.99
2 0.
971
drs
1.
000
1.00
0 1.
000
JS
Ban
k L
td.
0.79
8 0.
922
0.86
5 ir
s 1.
000
1.00
0 1.
000
1.
000
1.00
0 1.
000
0.
832
0.83
4 0.
997
drs
1.
000
1.00
0 1.
000
M
CB
Ban
k L
td.
1.00
0 1.
000
1.00
0
0.94
1 1.
000
0.94
1 d
rs
0.85
5 1.
000
0.85
5 d
rs
0.78
4 0.
989
0.79
3 d
rs
0.76
4 0.
887
0.86
1 d
rs
Meezan
Ban
k L
td.
0.87
0 0.
888
0.97
9 ir
s 0.
618
0.66
9 0.
923
drs
0.
600
0.67
3 0.
892
drs
0.
903
1.00
0 0.
903
drs
1.
000
1.00
0 1.
000
S
am
ba B
an
k L
td
0.89
0 1.
000
0.89
0 ir
s 0.
819
1.00
0 0.
819
irs
1.00
0 1.
000
1.00
0
1.00
0 1.
000
1.00
0
1.00
0 1.
000
1.00
0
Sil
kb
ank
Lim
ited
0.
931
1.00
0 0.
931
irs
0.92
8 1.
000
0.92
8 ir
s 0.
707
0.95
0 0.
744
irs
0.87
9 1.
000
0.87
9 ir
s 0.
908
1.00
0 0.
908
irs
So
neri
Ban
k L
td.
0.85
0 0.
882
0.96
4 ir
s 0.
817
0.84
2 0.
970
irs
0.81
2 0.
812
1.00
0
0.92
5 0.
934
0.99
1 d
rs
1.00
0 1.
000
1.00
0
Sta
nd
ard
Ch
art
ere
d B
an
k (
Pak
ista
n)
Ltd
. 0.
738
0.74
3 0.
993
drs
0.
780
0.81
2 0.
961
drs
0.
751
0.85
4 0.
880
drs
0.
718
0.86
7 0.
828
drs
0.
755
0.83
1 0.
909
drs
Su
mm
it B
an
k L
td.
1.00
0 1.
000
1.00
0
1.00
0 1.
000
1.00
0
1.00
0 1.
000
1.00
0
1.00
0 1.
000
1.00
0
1.00
0 1.
000
1.00
0
Un
ited
Ban
k L
td.
0.77
7 0.
786
0.98
8 d
rs
0.75
5 0.
800
0.94
4 d
rs
0.81
4 0.
886
0.91
9 d
rs
0.85
6 0.
965
0.88
7 d
rs
1.00
0 1.
000
1.00
0
AV
ER
AG
E
0.8
55
0.9
24
0.9
25
0.8
41
0.9
13
0.9
21
0.8
55
0.9
31
0.9
18
0.8
89
0.9
52
0.9
33
0.9
28
0.9
71
0.9
54
OV
ER
AL
L A
VE
RA
GE
0.8
98
0.9
51
0.9
44
0.8
66
0.9
26
0.9
36
0.8
65
0.9
37
0.9
24
0.9
06
0.9
56
0.9
48
0.9
26
0.9
69
0.9
55
Sou
rce:
Au
tho
r’s
ow
n e
stim
ate
s N
ote:
Bla
nk
Co
nst
an
t re
turn
to
sca
le, I
RS
In
crea
sin
g r
etu
rn t
o s
cale
, an
d D
RS
Dec
rea
sin
g r
etu
rn t
o s
cale