Embed Size (px)
Citation preview

A Comparative Financial RatioAnalysis of U.S. Farmer
Cooperatives UsingNonparametric Statistics
Jeffrey s. Ruyer
A comparative ratio analysis using nonparametric statistical methods provides noevidence to support the hypothesis that U.S. farmer cooperatives generally are financiallyweaker than other firms. Although some cooperative groups had lower current ratiosthan industry standards, most of these groups consisted of marketing associations forwhich differences may be explained largely by the unique business relationships betweenthe associations and their patrons. Comparisons ofdebtJequity ratios indicate that, exceptfor regional grain and farm supply associations, cooperatives generally are less leveragedthan other firms. The overall financial strength of cooperatives appears better thanduring the early 1980s.
Farmer cooperatives are unique business organizations in that they are ownedby the farmers they serve and they return their earnings to owners on the basisof patronage instead of stock ownership. As a result, there is little incentive fordirect investment in cooperatives, and they generally must rely heavily onretained patronage refunds or per-unit capital retains for accumulating equitycapital. Fundamental differences in how cooperatives are financed have ledsome researchers to conclude that cooperatives must operate differently thanother firms and that new methods for measuring cooperative performanceshould be developed. Others maintain that cooperatives must measure up wellagainst conventional standards of performance if they are operating in a financially sound manner. Empirical evidence from the early 1980s supported theconclusion that cooperatives generally were financially weaker than other firmswhen conventional methods of financial performance were applied.
Empirical analyses of the comparative financial performance of farmer cooperatives usually have been limited to small samples of firms operating in a fewcommodity areas. Data collected in a recent U.S. Department of Agriculture(USDA) financial profile study of farmer cooperatives are much more represen-
Jeffrey S. Royer is associate professor of agricultural economics, University of Nebraska-Lincoln.The author gratefully acknowledges the valuable contributions ofRoger Wissman, Agricultural
Cooperative Service, U.S. Department ofAgriculture, to research upon which this analysis is based.He also expresses appreciation to Charles Kraenzle and two anonymous reviewers for their helpfulcomments.
Journal Series No. 9457, Agricultural Research Division, University of Nebraska.
Comparative Financial Ratio Analysis/Royer 23
tative of cooperatives overall in terms of the number of cooperatives, their size,the products they handle, and the services they provide. In addition, the USDAdata provide a basis for assessing changes in the comparative financial performance of cooperatives since the early 1980s.
This article reports on an analysis of the comparative financial performanceof U.S. farmer cooperatives based on data from the USDA financial profilestudy. Cooperative financial ratios are compared with published industry standards for firms operating in the same or similar industries. The objectives ofthis analysis are to: (1) determine whether there are significant differences inthe financial strength of farmer cooperatives compared with industry standards,(2) assess whether the relative financial condition of cooperatives generallyhas improved since the early 1980s, and (3) demonstrate the usefulness ofnonparametric statistical methods in performing comparative financial ratioanalyses. The results of this analysis provide important insights into the financialdifferences between cooperatives and other firms. The purpose of this articleis not to provide cooperatives benchmarks with which they can compare theirperformance. Readers interested in comparing individual financial performance to that of cooperatives engaged in similar activities are referred to theUSDA report (Royer, Wissman, and Kraenzle).
Previous ResearchThe comparative financial performance of farmer cooperatives has been a
subject of scrutiny since the early 1980s when some writers expressed concernover the negative impact on cooperatives of high interest rates and the highlevel of borrowed capital relative to competing firms. Haugen compared 19 ofthe largest cooperatives in the United States with 13 large competitors duringthe period 1974-80. He found that the cooperatives were relying increasinglyon the use of long-term debt in place of equity relative to competing firms andthat cooperative returns were below those of competitors. Brown comparedmarketing cooperatives operating on a pooling basis, farm supply cooperatives,dairy cooperatives, and large grain cooperatives with food processing corporations from 1977 to 1981. He found that there was a decline in the proportionof net worth in all five groups but that the food processing corporations had asubstantially higher proportion than the four cooperative groups. He also citeddata showing that the proportion of net worth in the 100 largest cooperativesand the 100 largest industrial corporations had declined between 1962 and1981 but that the proportion for the industrial corporations was substantiallyhigher than for the cooperatives. Royer compared the average 1981 debt/equityratios of farm supply cooperatives and marketing cooperatives in six commoditygroups with median and quartile statistics from industry samples and concludedthat the debt/equity ratios of marketing cooperatives generally were greaterthan the medians for the industry samples, but the ratio for farm supply cooperatives was slightly less.
Other comparisons of cooperative financial ratios with those of other firmshave focused on testing hypotheses about cooperative performance based ondifferences in organizational objectives. Schrader et a1. reported that in comparisons of small cheese plants and grain elevators/farm supply businesses, proprietary firms had greater average leverage ratios than did cooperatives although

24 JOURNAL OF AGRICULTURAL COOPERATION 1991
the results were not statistically significant. On the other hand, they cited dataused by Chen that indicated the leverage of large diversified cooperatives wassubstantially greater than for similar proprietary agribusinesses. Parliament,Lerman, and Fulton tested several hypotheses concerning comparative cooperative financial performance using median and quartile data on nine regionaldairy cooperatives from 1971 to 1987. Although cooperatives were hypothesized to have less liquidity and greater leverage than an industry sample of dairyproduct manufacturers, actual cooperative liquidity was found to be greaterand cooperative leverage was found to be less than the industry standards. I Thehypothesis that cooperatives would be expected to have greater leverage ratioswas based in part on the idea that they are "equity bound," i.e., it is more difficultfor them to generate funds internally because of the lack of secondary marketsfor cooperative stock (see Staatz, pp. 15-16).
Recently Royer, Wissman, and Kraenzle published the results of the latestUSDA financial profile of farmer cooperatives. Motivation for that study, whichwas based on a survey of fiscal 1987 operating and balance sheet information,stemmed from changes in the economic environment, large operating lossesexperienced by many cooperatives, and the significant restructuring that hadoccurred since the 1970s, when data for the last study (Griffin et al.) werecollected. The 1987 study used ratio analysis in analyzing the financial conditionof cooperatives and concluded that average 1987 cooperative current and debt/equity ratios were stronger than in 1976 for all three major functional classifications (marketing, farm supply, and marketing/farm supply). Only marketingcooperatives had greater debt/equity ratios than in 1970. On the other hand,all three categories had weaker interest coverage ratios than in previous years.The study also concluded that the strength of the current and debt/equity ratioswas inversely related to cooperative size. The study made no comparisons withindustry standards. Thus, it was not possible to assess whether the financialcondition of cooperatives had improved relative to other firms with which theycompete.
This article extends the analysis of the 1987 USDA financial profile study bycomparing the current and debt/equity ratios of cooperatives with industrystandards to evaluate the comparative financial strength of cooperatives. It alsoassesses whether the relative financial condition of cooperatives generally hasimproved since the early 1980s.
MethodologyTo assess the liquidity and solvency of farmer cooperatives relative to other
firms in the industries in which they operate, the current and debt/equity ratiosfor 13 cooperative classifications at the end of fiscal 1987 were compared withDun & Bradstreet Credit Services industry standards.2 Cooperative ratios wereimputed using data from USDA's Agricultural Cooperative Service (ACS) 1987financial profile study of U.S. farmer cooperatives (Royer, Wissman, and Kraenzle). In that study, survey questionnaires were mailed to all organizations identified by ACS as meeting the definition of a farmer cooperative. All 461 cooperatives with annual sales of $15 million or more were selected for inclusion in thestudy. Usable responses were obtained from 89 percent of these cooperatives.Data for nonrespondents were estimated by expanding the averages for other

Comparative Financial Ratio Analysis/Royer 25
cooperatives in the same principal product or function classification and farmcredit district according to annual sales data obtained by ACS.
A sample of the cooperatives with annual sales of less than $15 million wastaken according to guidelines recommended by USDA's National AgriculturalStatistics Service. Using standard statistical methods, sampling rates were determined for each combination of principal product or function classification andfarm credit district. In some cases, centralized accounting services were able toprovide detailed financial data for affiliated local cooperatives. All cooperativesfor which these data were available were included in the study. Centralizedservices provided data for a total of 31 local grain and 211 local farm supplycooperatives. Data were collected on 36 percent of the other 3,870 cooperativeswith annual sales of less than $15 million.
Data for all cooperatives with annual sales of less than $15 million werepooled and expanded by the proportion of observations in each combination ofprincipal product or function classification and farm credit district to derivepopulation estimates. For combinations for which there was an insufficientnumber of respondents, questionnaires received but not in the sample wereedited and included. In total, data were collected and analyzed for 2,028 cooperatives, 44 percent of those identified in the population. The cooperatives forwhich data were collected represented 79.3 percent of total cooperative salesand 79.4 percent of estimated total assets.
Because Dun & Bradstreet, as well as other published sources of industrystandard data, present only median and quartile financial ratios, this analysis isbased largely on the use ofnonparametric statistical methods instead ofmethodsrequiring additional information about the distributions of the industry samples. Nonparametric methods include a variety of statistical procedures foranalyzing data that do not satisfy all the requirements of classical statisticalmethods. Generally, both procedures appropriately labeled nonparametric andthose more appropriately termed distribution-free are referred to as nonparametric methods. To be exact, nonparametric methods do not involve testing ahypothesis about the specific value of a parameter, whereas distribution-freemethods do not require assumptions about the precise form of the sampledpopulation. Knowledge about the distribution of the test statistic is necessaryin all cases, but for distribution-free tests this knowledge is based on sampleproperties instead of the population. Nonparametric statistical tests often arebased on a randomization distribution, which is the probability distribution of astatistic determined by considering all possible sample outcomes and computingtheir probabilities under the null hypothesis.
Nonparametric methods frequently employ ordinal or nominal measurements, such as rank, position, and frequency, instead of continuous measurements. Thus, nonparametric tests are concerned with medians rather thanmeans, interquartile ranges rather than variances, and sign rather than size.Nonparametric procedures have several advantages over other methods, mostimportant of which is that they often can be applied in situations where theassumptions of classical statistical methods are not valid. However, in situationswhere the classical assumptions are met, nonparametric tests usually are lessefficient, particularly for large samples.
In many situations, there may be considerable justification for preferring thecomparison of the medians of two groups to the comparison of the means

26 JOURNAL OF AGRICULTURAL COOPERATION 1991
(Wilcox, p. 336). This is because the median may be a better measure of centrallocation than the mean. If a distribution is symmetric, the mean and medianare equal. However, if the distribution is asymmetric, the median is closer tothe center or bulk of the distribution and therefore is more typical of possibleobserved values. In addition, the sample median is less sensitive to outliers orextreme values, which occur relatively frequently in heavy-tailed distributionsand can occur when there are errors in recording data.
Choice of Financial Ratios and Industry StandardsThe current ratio is a standard measure of liquidity, or the ability of a firm
to meet its current obligations as they come due. It is computed by dividingtotal current assets by total current liabilities. Generally, a higher current ratioindicates a greater cushion between current obligations and the firm's ability topay them, although the composition and quality of current assets are criticalfactors in determining a firm's liquidity. The debt/equity ratio used in thisanalysis is defined as total liabilities divided by total equity. It is a measure ofsolvency, or the ability of a firm to meet its total obligations over the long run,and it represents the relationship between the amount of capital provided bycreditors and that contributed by owners. Usually, a higher debt/equity ratioindicates greater vulnerability to business downturns and greater risk to creditors. On the other hand, a low debt/equity ratio implies greater borrowingflexibility in the future. Although a low debt/equity ratio may indicate greaterlong-term financial safety, desirable ratios may vary substantially depending onthe particular requirements of different industries, and a low debt/equity ratiomay indicate an inefficient mix of borrowed and equity capital. The debt/equityratio used in this analysis was chosen over other measures of solvency, such asborrowed capital divided by equity, in part because of the availability of published industry data.
Dun & Bradstreet annually publishes solvency, efficiency, and profitabilityratios as well as average balance sheets and data on sales, profits, taxes, andworking capital for more than 800 manufacturing, wholesaling, retailing, andother industries according to Standard Industrial Classification (SIC) codes.Three values, the lower quartile, the median, and the upper quartile, are presented for each financial ratio. These values are determined by computing theratio for each firm in the sample for an industry and ordering them fromhighest to lowest. The value that falls halfway between the highest and lowestvalues is the median. The value that falls halfway between the highest value andthe median is the upper quartile. The lower quartile is the value that fallshalfway between the median and the lowest value. Thus, the upper quartile,median, and lower quartile divide an industry into four groups, each containinga fourth of the firms. Values falling above the upper quartile belong to firmswith the highest ratios. Values falling below the lower quartile belong to firmswith the lowest. 3
Dun & Bradstreet was chosen as the source of the industry standards oversimilar information published by Robert Morris Associates (RMA) because itincluded data for more classifications and its samples generally were substantially larger. In some cases, RMA combines two or more SICs into a singlegroup, and sometimes these combined groups matched particular cooperative
Comparative Financial Ratio Analysis/Royer 27
classifications better than similar Dun & Bradstreet groups did. However, theRMA industry standards often included values that appeared extreme in comparison with the Dun & Bradstreet standards. Thus, for consistency amongcomparison groups, Dun & Bradstreet data were used exclusively. Given thesample sizes, the comparative size of the firms in the samples, and the descriptions of the samples, the Dun & Bradstreet data appeared appropriate for thepurposes of this analysis.
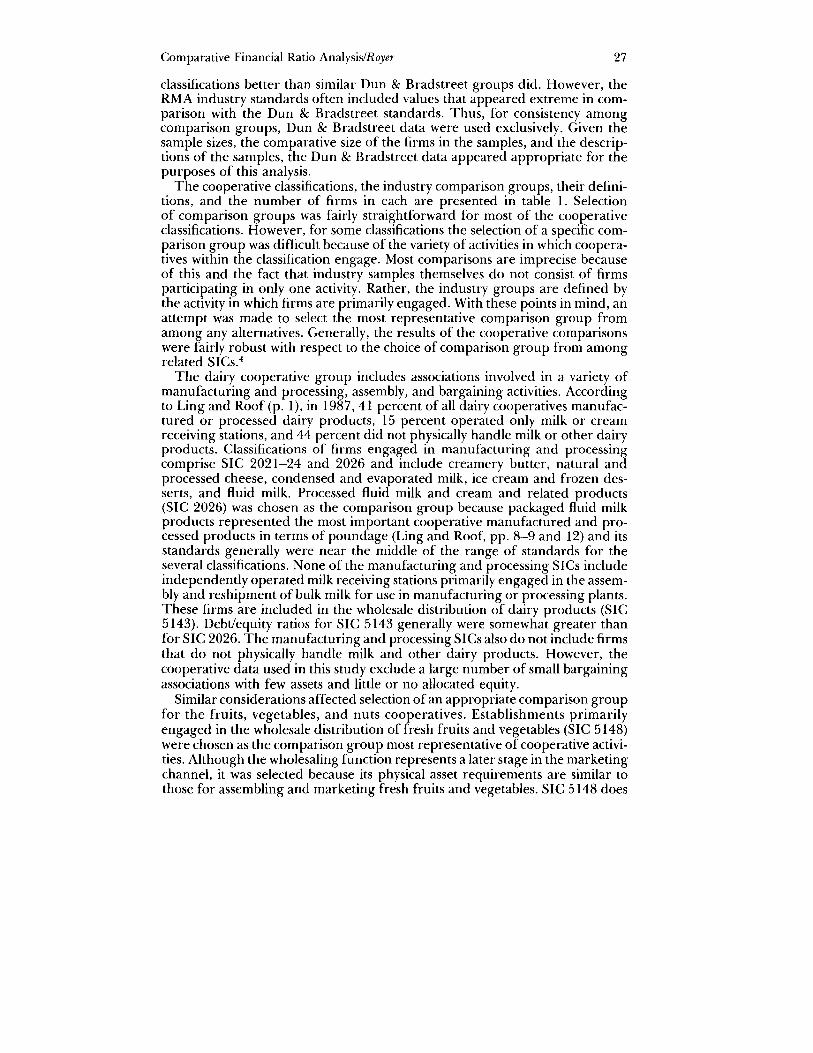
The cooperative classifications, the industry comparison groups, their definitions, and the number of firms in each are presented in table 1. Selectionof comparison groups was fairly straightforward for most of the cooperativeclassifications. However, for some classifications the selection of a specific comparison group was difficult because of the variety of activities in which cooperatives within the classification engage. Most comparisons are imprecise becauseof this and the fact that industry samples themselves do not consist of firmsparticipating in only one activity. Rather, the industry groups are defined bythe activity in which firms are primarily engaged. With these points in mind, anattempt was made to select the most representative comparison group fromamong any alternatives. Generally, the results of the cooperative comparisonswere fairly robust with respect to the choice of comparison group from amongrelated SICs.4
The dairy cooperative group includes associations involved in a variety ofmanufacturing and processing, assembly, and bargaining activities. Accordingto Ling and Roof (p. 1), in 1987, 41 percent of all dairy cooperatives manufactured or processed dairy products, 15 percent operated only milk or creamreceiving stations, and 44 percent did not physically handle milk or other dairyproducts. Classifications of firms engaged in manufacturing and processingcomprise SIC 2021-24 and 2026 and include creamery butter, natural andprocessed cheese, condensed and evaporated milk, ice cream and frozen desserts, and fluid milk. Processed fluid milk and cream and related products(SIC 2026) was chosen as the comparison group because packaged fluid milkproducts represented the most important cooperative manufactured and processed products in terms of poundage (Ling and Roof, pp. 8-9 and 12) and itsstandards generally were near the middle of the range of standards for theseveral classifications. None of the manufacturing and processing SICs includeindependently operated milk receiving stations primarily engaged in the assembly and reshipment of bulk milk for use in manufacturing or processing plants.These firms are included in the wholesale distribution of dairy products (SIC5143). Debt/equity ratios for SIC 5143 generally were somewhat greater thanfor SIC 2026. The manufacturing and processing SICs also do not include firmsthat do not physically handle milk and other dairy products. However, thecooperative data used in this study exclude a large number of small bargainingassociations with few assets and little or no allocated equity.
Similar considerations affected selection of an appropriate comparison groupfor the fruits, vegetables, and nuts cooperatives. Establishments primarilyengaged in the wholesale distribution of fresh fruits and vegetables (SIC 5148)were chosen as the comparison group most representative of cooperative activities. Although the wholesaling function represents a later stage in the marketingchannel, it was selected because its physical asset requirements are similar tothose for assembling and marketing fresh fruits and vegetables. SIC 5148 does

Table I.-Cooperative Classifications and Industry Comparison Groups
Cooperative Classification"
Cotton marketing: Cooperatives primarilyengaged in marketing cotton and cottonproducts.
Cotton ginning: Cooperatives primarily engagedin ginning cotton.
Dairy: Cooperatives primarily engaged inmarketing and processing milk.
Fruits, vegetables, and nuts: Cooperativesprimarily engaged in marketing or processingfruits, vegetables, or nuts.
Regional grain: Regional cooperatives primarilyengaged in marketing or processing grain, rice,or soybeans. Does not include cooperativesprimarily engaged in drying rice.
Local grain: Local cooperatives primarilyengaged in marketing grain, rice, or soybeans.Includes local grain marketing cooperatives withfarm supply activities not exceeding grainmarketing sales volume.
Number
20
330
244
274
9
1,538
Comparison Group
Cotton wholesaling (SIC 5152): Establishmentsprimarily engaged in buying and/or marketingcotton and cotton linters.
Cotton ginning (SIC 0724).
Fluid milk processing (SIC 2026):Establishments primarily engaged in processing(e.g., pasteurizing, homogenizing, vitaminizing,and bottling) fluid milk, cream, and relatedproducts, including cottage cheese, yogurt(except frozen), and other fermented milk.
Fresh fruits and vegetables wholesaling (SIC5148).
Grain wholesaling (SIC 5153): Establishmentsprimarily engaged in buying and/or marketinggrain (e.g., corn, wheat, oats, barley, andunpolished rice), dry beans, soybeans, and otherinedible beans. Includes country grain elevatorsprimarily engaged in buying or receiving grainfrom farmers as well as terminal elevators andother merchants marketing grain.
Grain wholesaling (SIC 5153).
Number
36
163
120
954
2,205
2,205
NlC$:!
'oC::<lZ;>t""
o"'1
>C'l::<lnc~c~t""
n8'""t"l
~..,(5z
-<.0<.0-
Sugar: Cooperatives primarily engaged in 20 Farm-product raw materials wholesaling, not 149 n0
marketing or processing sugar or sugar elsewhere classified (nee) (SIC 5159): Includes Sproducts. establishments primarily engaged in buying and/ "0
~
or marketing raw sugar, unprocessed or shelled.,~
nuts, tobacco leaf, wool, or other raw farm c.-<:
products (except grain, field beans, and rtl
livestock) at the wholesale level as well as tobacco ""'l5'auctioning and warehousing. ~
::ILivestock, wool, and poultry: Cooperatives 109 Livestock wholesaling (SIC 5154): 148 ("\
~primarily engaged in marketing or processing Establishments primarily engaged in buying and/:;:o::llivestock, wool, or poultry and products. or marketing cattle, hogs, sheep, and goats as r:;.
well as the operation of livestock auction 0'markets. ;J;>
Miscellaneous marketing: Cooperatives 67 Farm-product raw materials wholesaling, nee 149::I~
primarily engaged in marketing or processing (SIC 5159). --<~.
commodities not otherwise classified. Includes~dry edible beans and peas, tobacco, and~miscellaneous products. '"...
Interregional manufacturing: Cooperatives 6 Phosphatic fertilizers manufacturing (SIC 29primarily engaged in the manufacture of farm 2874).supplies and serving a membership consisting ofregional cooperatives.
Regional farm supply: Regional cooperatives 11 Farm supplies wholesaling (SIC 5191): 1,725primarily engaged in the distribution of farm Establishments primarily engaged in thesupplies. wholesale distribution of animal feeds,
fertilizers, agricultural chemicals, pesticides,seed, and other farm supplies except grain.
Local farm supply: Local cooperatives primarily 1,835 Retail nurseries, lawn and garden supply stores 1,945engaged in the distribution of farm supplies. (SIC 5261): Includes establishments primarilyIncludes local farm supply cooperatives with engaged in selling seed, fertilizers, pesticides,grain marketing activities not exceeding farm garden tools, and other supplies to the public.supply sales volume.
. ~Continued on next page <.0
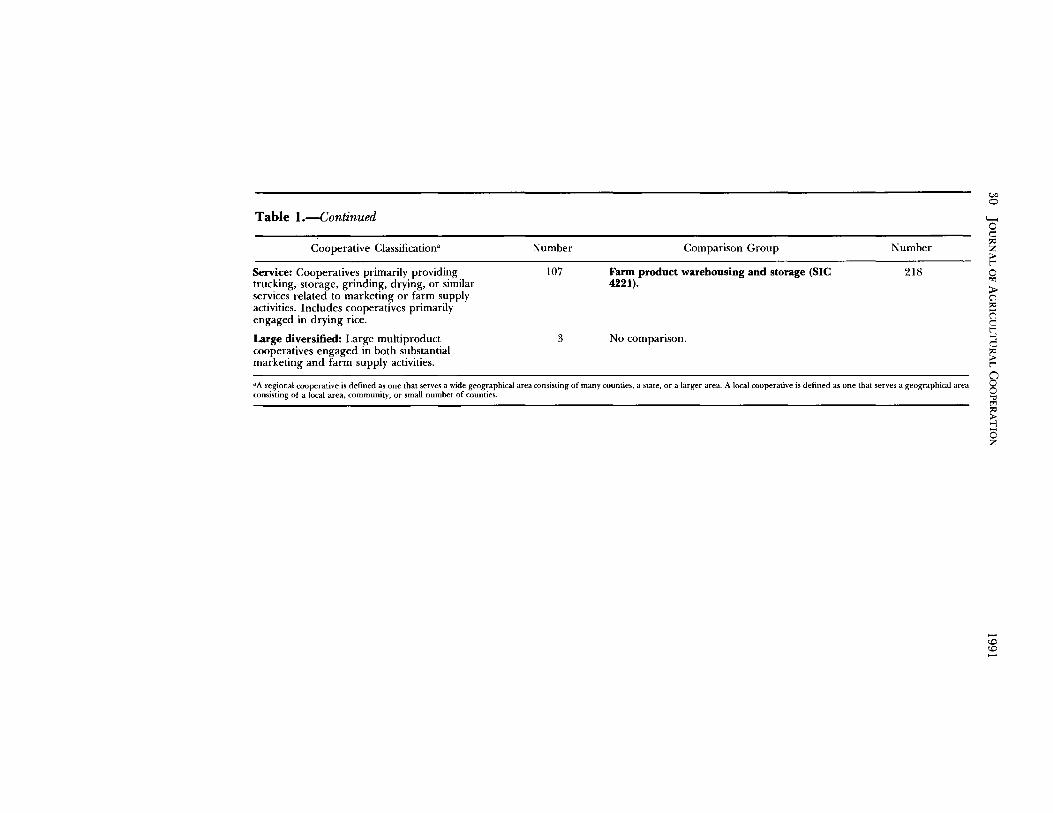
aA regional cooperative is defined as one that serves a wide geographical area consisting of many counties, a state, or a larger area. A local cooperative is defined as one that serves a geographical areaconsisting of a local area, community, or small number of counties.
Table I.-Continued
Cooperative Classificationa
Service: Cooperatives primarily providingtrucking, storage, grinding, drying, or similarservices related to marketing or farm supplyactivities. Includes cooperatives primarilyengaged in drying rice.
Large diversified: Large multiproductcooperatives engaged in both substantialmarketing and farm supply activities.
Number
107
3
Comparison Group
Farm product warehousing and storage (SIC4221).
No comparison.
Number
218
(A
o
'oe:<lZ;..t""
~
~:<lrietie~t""
go""t"i:<l;...-J(5Z
-<.D<.D-

Comparative Financial Ratio Analysis/Royer 31
not include firms primarily engaged in processing activities such as canningfruits, vegetables, and juices (SIC 2033); sun-drying or artificially dehydratingfruits and vegetables (SIC 2034); or freezing fruits, fruit juices, and vegetables(SIC 2037). Industry standards for SIC 5148 generally were within the rangeof ratios for these groups and were very similar to those for SIC 2033, the groupwith the highest current ratios and the lowest debt/equity ratios. Establishmentsprimarily engaged in the grading and marketing of farm-dried fruits, such asprunes and raisins, are included in SIC 5149, wholesaling of groceries andrelated products, not elsewhere classified.
Interregional manufacturing cooperatives produce a wide variety of products. However, fertilizer manufacturing and petroleum refining are dominantactivities. Although nitrogenous fertilizer manufacturing is the most importantsingle activity, phosphatic fertilizers manufacturing (SIC 2874) was chosen forthe comparison group because its industry standard statistics generally werebetween those for nitrogenous fertilizers manufacturing (SIC 2873) and petroleum refining (SIC 2911) and therefore were judged to be more representativeof all three activities.
Both regional and local grain cooperatives were compared with grain wholesaling (SIC 5153) because it includes both country grain elevators and terminalelevators. Livestock wholesaling (SIC 5154) was chosen as the comparison groupfor livestock, wool, and poultry cooperatives. SIC 5154 generally had greatercurrent ratios and lower debt/equity ratios than poultry and poultry productswholesaling establishments (SIC 5144) and poultry dressing plants (SIC 2016).No attempt was made to compare three large diversified cooperatives withindustry standards because of the broad scope of marketing and farm supplyactivities in which they engage.
Comparison of Cooperative Statistics withIndustry Standards
The mean and median current and debt/equity ratios are compared with theirrespective industry standards in tables 2 and 3 for each of the 13 cooperativeclassifications. In computing the mean ratios, the larger cooperatives wereweighted more heavily than smaller ones. This resulted, in the case of debt/equity ratios, from dividing a group's total debt by its total equity in determiningits mean ratio instead of averaging the ratios of individual cooperatives. Becausethe industry standards are based on an ordered array of firms, irrespective ofsize, the median cooperative ratios are the most appropriate for comparisonwith the standards. In instances where the median ratio is stronger than themean ratio, comparison of the mean ratio with the industry standards wouldindicate a relatively weaker financial situation for the cooperatives than wouldthe median ratio. For example, to the extent that large cooperatives within agroup are more heavily leveraged than smaller ones, comparisons based on theweighted mean might suggest a high degree of overall leverage relative to otherfirms although a majority of cooperatives have comparatively lower debt/equityratios. For more than half the classifications, as shown in the tables, the mediancurrent ratio is greater than the mean ratio, and in all but one, the median debt/equity ratio is less than the mean. In some cases, the differences between themedian and mean ratios are substantial.
32 JOURNAL OF AGRICULTURAL COOPERATION 1991
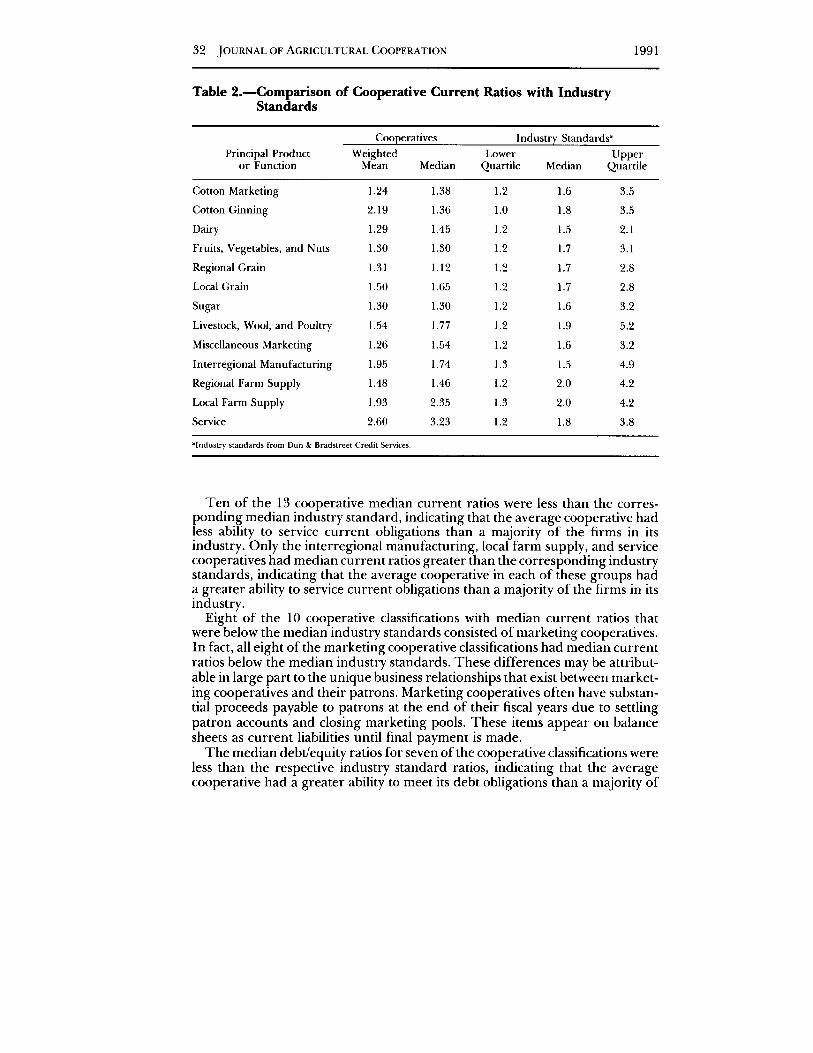
Table 2.-Comparison of Cooperative Current Ratios with IndustryStandards
Cooperatives Industry Standards'Principal Product Weighted Lower Upper
or Function Mean Median Quartile Median Quartile
Cotton Marketing 1.24 1.38 1.2 1.6 3.5
Cotton Ginning 2.19 1.36 1.0 1.8 3.5
Dairy 1.29 1.45 1.2 1.5 2.1
Fruits, Vegetables, and Nuts 1.30 1.30 1.2 1.7 3.1
Regional Grain 1.31 1.12 1.2 1.7 2.8
Local Grain 1.50 1.65 1.2 1.7 2.8
Sugar 1.30 1.30 1.2 1.6 3.2
Livestock, Wool, and Poultry 1.54 1.77 1.2 1.9 5.2
Miscellaneous Marketing 1.26 1.54 1.2 1.6 3.2
Interregional Manufacturing 1.95 1.74 1.3 1.5 4.9
Regional Farm Supply 1.48 1.46 1.2 2.0 4.2
Local Farm Supply 1.93 2.35 1.3 2.0 4.2
Service 2.60 3.23 1.2 1.8 3.8
alndustry standards from Dun & Bradstreet Credit Services.
Ten of the 13 cooperative median current ratios were less than the corresponding median industry standard, indicating that the average cooperative hadless ability to service current obligations than a majority of the firms in itsindustry. Only the interregional manufacturing, local farm supply, and servicecooperatives had median current ratios greater than the corresponding industrystandards, indicating that the average cooperative in each of these groups hada greater ability to service current obligations than a majority of the firms in itsindustry.
Eight of the 10 cooperative classifications with median current ratios thatwere below the median industry standards consisted of marketing cooperatives.In fact, all eight of the marketing cooperative classifications had median currentratios below the median industry standards. These differences may be attributable in large part to the unique business relationships that exist between marketing cooperatives and their patrons. Marketing cooperatives often have substantial proceeds payable to patrons at the end of their fiscal years due to settlingpatron accounts and closing marketing pools. These items appear on balancesheets as current liabilities until final payment is made.
The median debt/equity ratios for seven of the cooperative classifications wereless than the respective industry standard ratios, indicating that the averagecooperative had a greater ability to meet its debt obligations than a majority of
Comparative Financial Ratio Analysis/Royer 33
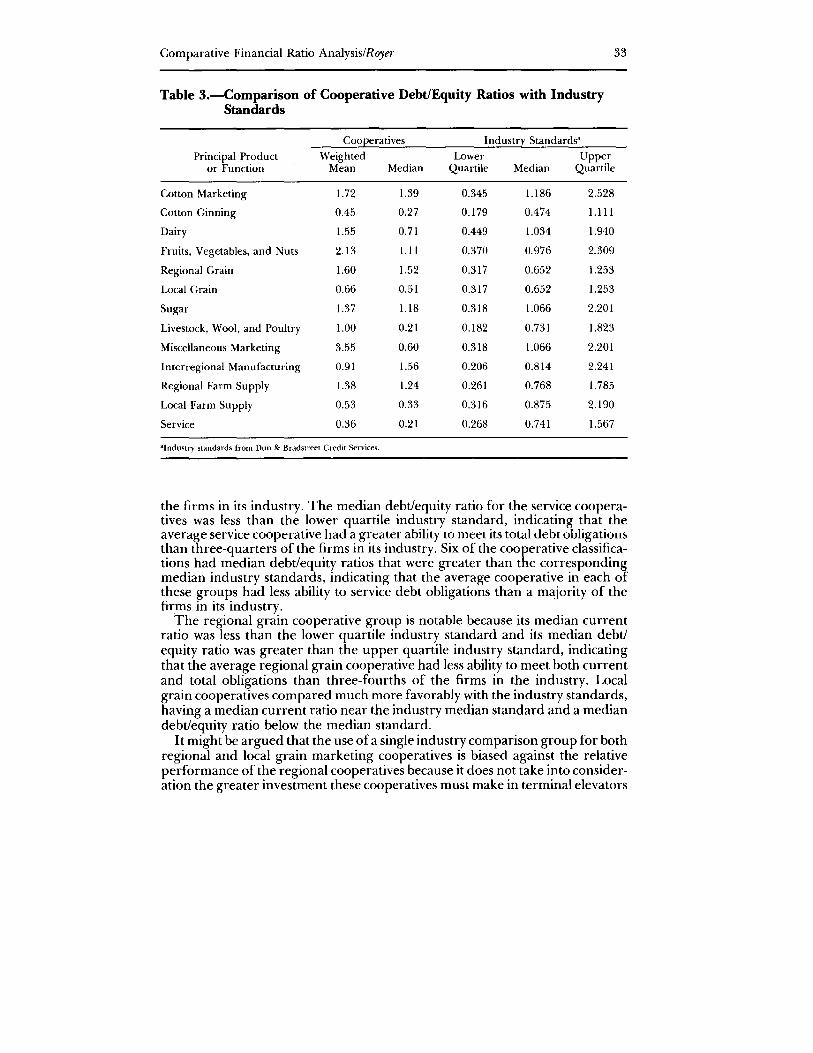
Table 3.-Comparison of Cooperative Debt/Equity Ratios with IndustryStandards
Cooperatives Industry Standards'
Principal Product Weighted Lower Upperor Function Mean Median Quartile Median Quartile
Cotton Marketing 1.72 1.39 0.345 1.186 2.528
Cotton Ginning 0.45 0.27 0.179 0.474 1.I11
Dairy 1.55 0.71 0.449 1.034 1.940
Fruits, Vegetables, and Nuts 2.13 1.11 0.370 0.976 2.309
Regional Grain 1.60 1.52 0.317 0.652 1.253
Local Grain 0.66 0.51 0.317 0.652 1.253
Sugar 1.37 1.18 0.318 1.066 2.201
Livestock, Wool, and Poultry 1.00 0.21 0.182 0.731 1.823
Miscellaneous Marketing 3.55 0.60 0.318 1.066 2.201
Interregional Manufacturing 0.91 1.56 0.206 0.814 2.241
Regional Farm Supply 1.38 1.24 0.261 0.768 1.785
Local Farm Supply 0.53 0.33 0.316 0.875 2.190
Service 0.36 0.21 0.268 0.741 1.567
alndustry standards from Dun & Bradstreet Credit Services.
the firms in its industry. The median debtlequity ratio for the service cooperatives was less than the lower quartile industry standard, indicating that theaverage service cooperative had a greater ability to meet its total debt obligationsthan three-quarters of the firms in its industry. Six of the cooperative classifications had median debtlequity ratios that were greater than the correspondingmedian industry standards, indicating that the average cooperative in each ofthese groups had less ability to service debt obligations than a majority of thefirms in its industry.
The regional grain cooperative group is notable because its median currentratio was less than the lower quartile industry standard and its median debtlequity ratio was greater than the upper quartile industry standard, indicatingthat the average regional grain cooperative had less ability to meet both currentand total obligations than three-fourths of the firms in the industry. Localgrain cooperatives compared much more favorably with the industry standards,having a median current ratio near the industry median standard and a mediandebtlequity ratio below the median standard.
It might be argued that the use ofa single industry comparison group for bothregional and local grain marketing cooperatives is biased against the relativeperformance of the regional cooperatives because it does not take into consideration the greater investment these cooperatives must make in terminal elevators
34 JOURNAL OF AGRICULTURAL COOPERATION 1991
and other large fixed assets. However, a comparison of the balance sheets forthese two groups (Royer, Wissman, and Kraenzle, p. 19) indicates that theirinvestments in fixed assets do not differ greatly and that the most strikingdifferences are in the proportion of assets held as current and long-term liabilities in comparison with equity capital. The regional grain cooperatives also hadthe lowest median current ratio of the 13 cooperative groups as well as thesecond highest debtJequity ratio. Thus, not only were they financially weakerthan the industry sample, they also were weaker than the other cooperativegroups.
There appears to be some association between the ranking of the 13 cooperative groups according to their current ratios and their ranking according totheir debtJequity ratios. The Spearman coefficient for rank correlation betweenthe strength of the median current and debtJequity ratios is .53 and is significantat the .05 level. 5 In other words, there seems to be a relationship between agroup's ability to meet current debt obligations and its ability to meet totalobligations over the long run, notwithstanding differences in the financialrequirements of various industries.6
Measuring and Testing Distributional DifferencesUse of the median cooperative ratio in comparisons with industry standard
statistics focuses knowledge about the cooperatives on a single value and disregards information on the rest of the distribution. To incorporate this additionalinformation into an analysis ofthe differences between cooperative and industrysample distributions, the cooperatives in each of the 13 cooperative classifications were sorted and individually placed into one of four categories, or quartiles, defined by the three industry standards. The four quartiles (first, second,third, and fourth) consist of the firms with ratios less than the lower quartileindustry standard, greater than the lower quartile standard but less than themedian, greater than the median but less than the upper quartile standard, andgreater than the upper quartile standard.
By definition, 25 percent of the firms in the industry sample fall into each ofthe four quartiles. If the cooperatives in the industry were distributed identicallyto the firms in the industry sample, 25 percent of them also would fall into eachquartile. Some random variation in the percentage of cooperatives falling intoeach quartile normally would be expected. However, a substantial discrepancybetween the cooperative and industry sample distributions would indicate asignificant difference in the cooperative ratios relative to the industry. Forexample, if substantially fewer than 25 percent of the cooperative debtJequityratios fell in each of the first two quartiles and substantially more than 25 percentfell in the third and fourth quartiles, one could conclude that cooperativesgenerally were significantly more leveraged than the firms in the industrysample. Tables 4 and 5 present the distributions of cooperatives according tothe industry standards for the current and debtJequity ratios.
To assess as objectively as possible whether the cooperative distributionsconform to the industry sample distributions or whether the cooperative ratiosgenerally are higher or lower than those in the industry samples, three additional analyses were performed: (1) calculation of an index to indicate if thecooperative ratios generally are greater or less than the industry sample medi-
Comparative Financial Ratio Analysis/Royer 35
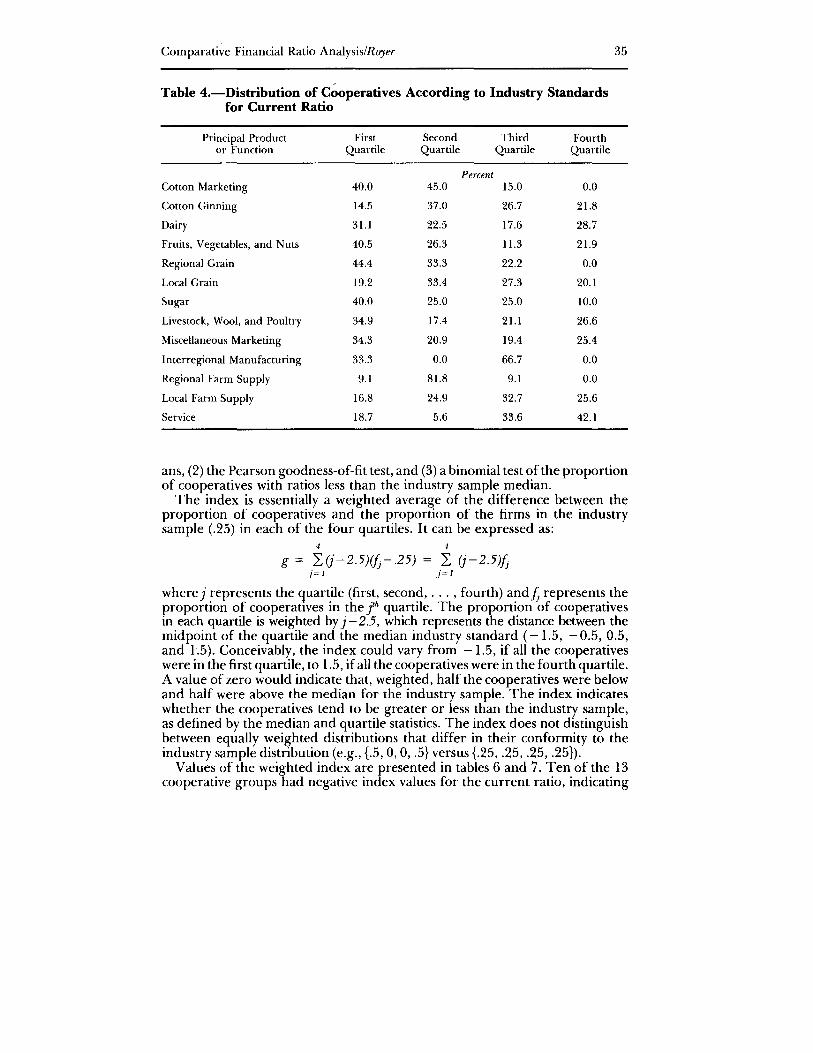
Table 4.-Distribution of Cooperatives According to Industry Standardsfor Current Ratio
Principal Product First Second Third Fourthor Function Quartile Quartile Quartile Quartile
PercentCotton Marketing 40.0 45.0 15.0 0.0
Cotton Ginning 14.5 37.0 26.7 21.8
Dairy 31.1 22.5 17.6 28.7
Fruits, Vegetables, and Nuts 40.5 26.3 11.3 21.9
Regional Grain 44.4 33.3 22.2 0.0
Local Grain 19.2 33.4 27.3 20.1
Sugar 40.0 25.0 25.0 10.0
Livestock, Wool, and Poultry 34.9 17.4 21.1 26.6
Miscellaneous Marketing 34.3 20.9 19.4 25.4
Interregional Manufacturing 33.3 0.0 66.7 0.0
Regional Farm Supply 9.1 81.8 9.1 0.0
Local Farm Supply 16.8 24.9 32.7 25.6
Service 18.7 5.6 33.6 42.1
ans, (2) the Pearson goodness-of-fit test, and (3) a binomial test of the proportionof cooperatives with ratios less than the industry sample median.
The index is essentially a weighted average of the difference between theproportion of cooperatives and the proportion of the firms in the industrysample (.25) in each of the four quartiles. It can be expressed as:
4 4
g = L(j-2.5)(jj-.25) = L (j-2.5)Jjj=l j=l
where j represents the quartile (first, second, ... , fourth) and Jj represents theproportion of cooperatives in the fh quartile. The proportion of cooperativesin each quartile is weighted by j - 2.5, which represents the distance between themidpoint of the quartile and the median industry standard (-1.5, - 0.5,0.5,and 1.5). Conceivably, the index could vary from - 1.5, if all the cooperativeswere in the first quartile, to 1.5, if all the cooperatives were in the fourth quartile.A value of zero would indicate that, weighted, half the cooperatives were belowand half were above the median for the industry sample. The index indicateswhether the cooperatives tend to be greater or less than the industry sample,as defined by the median and quartile statistics. The index does not distinguishbetween equally weighted distributions that differ in their conformity to theindustry sample distribution (e.g., {.5, 0, 0, .5} versus {.25, .25, .25, .25}).
Values of the weighted index are presented in tables 6 and 7. Ten of the 13cooperative groups had negative index values for the current ratio, indicating
36 JOURNAL OF AGRICULTURAL COOPERATION 1991
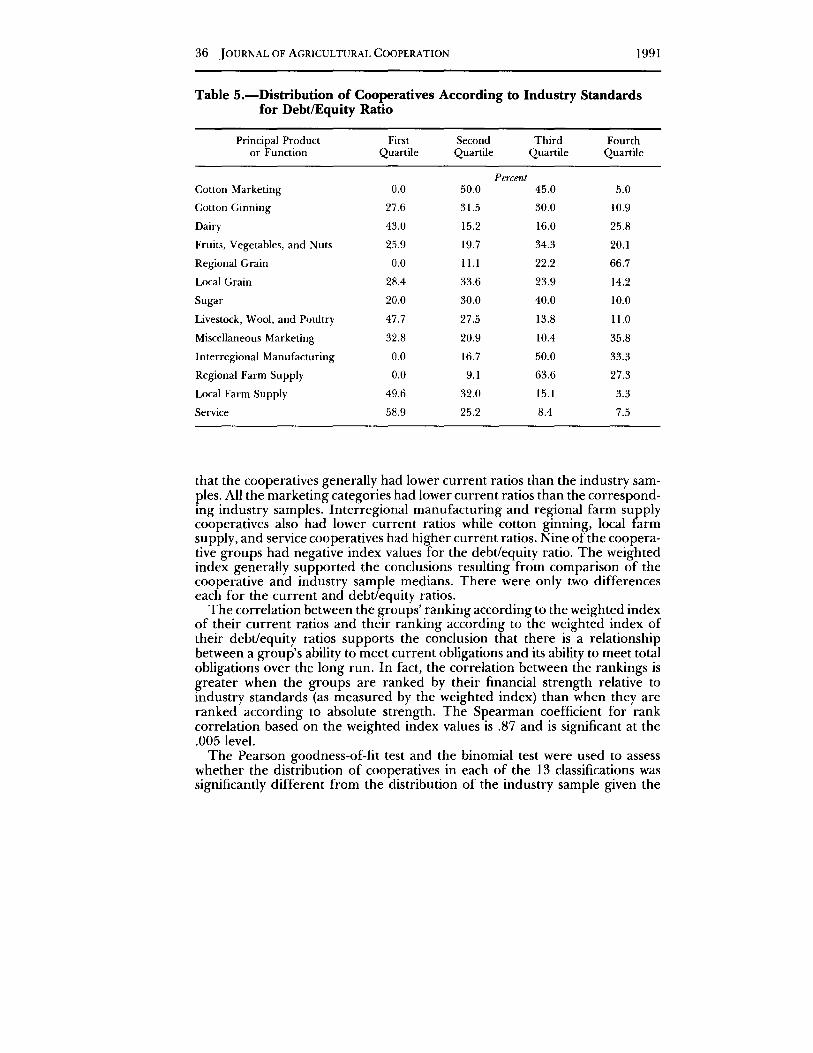
Table 5.-Distribution of Cooperatives According to Industry Standardsfor Debt/Equity Ratio
Principal Product First Second Third Fourthor Function Quartile Quartile Quartile Quartile
PercentCotton Marketing 0.0 50.0 45.0 5.0
Cotton Ginning 27.6 31.5 30.0 10.9
Dairy 43.0 15.2 16.0 25.8
Fruits, Vegetables, and Nuts 25.9 19.7 34.3 20.1
Regional Grain 0.0 11.1 22.2 66.7
Local Grain 28.4 33.6 23.9 14.2
Sugar 20.0 30.0 40.0 10.0
Livestock, Wool, and Poultry 47.7 27.5 13.8 11.0
Miscellaneous Marketing 32.8 20.9 10.4 35.8
Interregional Manufacturing 0.0 16.7 50.0 33.3
Regional Farm Supply 0.0 9.1 63.6 27.3
Local Farm Supply 49.6 32.0 15.1 3.3
Service 58.9 25.2 8.4 7.5
that the cooperatives generally had lower current ratios than the industry samples. All the marketing categories had lower current ratios than the corresponding industry samples. Interregional manufacturing and regional farm supplycooperatives also had lower current ratios while cotton ginning, local farmsupply, and service cooperatives had higher current ratios. Nine ofthe cooperative groups had negative index values for the debt/equity ratio. The weightedindex generally supported the conclusions resulting from comparison of thecooperative and industry sample medians. There were only two differenceseach for the current and debt/equity ratios.
The correlation between the groups' ranking according to the weighted indexof their current ratios and their ranking according to the weighted index oftheir debt/equity ratios supports the conclusion that there is a relationshipbetween a group's ability to meet current obligations and its ability to meet totalobligations over the long run. In fact, the correlation between the rankings isgreater when the groups are ranked by their financial strength relative toindustry standards (as measured by the weighted index) than when they areranked according to absolute strength. The Spearman coefficient for rankcorrelation based on the weighted index values is .87 and is significant at the.005 level.
The Pearson goodness-of-fit test and the binomial test were used to assesswhether the distribution of cooperatives in each of the 13 classifications wassignificantly different from the distribution of the industry sample given the

Table 6.-Weighted Index, Goodness-of-Fit Test, and Binomial Test for Current Ratios
Weighted Goodness-Principal Product Index of-Fit Significance Binomial
or Function (g) (X2) Levela Hypothesis
Cotton Marketing -0.750 10.80 .025 p>.5
Cotton Ginning 0.058 35.04 .005 p>.5
Dairy -0.061 10.92 .025 p>.5
Fruits, Vegetables, and Nuts -0.354 48.13 .005 p>.5
Regional Grain -0.722 3.89 , p>.5
Local Grain - 0.017 82.55 .005 p>.5
Sugar -0.450 3.60 , p>.5
Livestock, Wool, and Poultry -0.106 7.51 .100 p>.5
Miscellaneous Marketing - 0.142 3.63 , p>.5
Interregional Manufacturing -0.167 7.33 .100 p<.5
Regional Farm Supply -0.500 19.18 .001 p>.5
Local Farm Supply 0.171 93.31 .005 p<.5
Service 0.491 33.45 .005 p<.5
SignificanceLevela
.001
.001
.100
.025
.010
.001
.001
C10S
"'0~'"'i~C.<I'b
Conclusionb "rj
S'~
Less ::l'"'
Fail§.::::0
Less~c.0
Less ;I>::l
Fail ~V>
Less 1;;'
~Fail ~
'"...Less
Fail
Fail
Less
Greater
Greater
aSignificam.:e level (a) at which one would reject the lIull hypothesis that the distribution of cooperative ratios is identical to that of the industry sample or that p =.5 given the respective probabilityof a Type I error.bCondusions can be read:
Fail: Fail to reject the hypothesis that the distribution of cooperative ratios is identical to that of the industry sample.Less: .Accept the hypothesis that cooperative ratios generally are less than the industry standards.Greater: Accept the hypothesis that cooperative ratios generally are greater than the industry standards.
Strong conclusions are presented in boldface.'Greater than .100 level of significance.
(jO
-..J
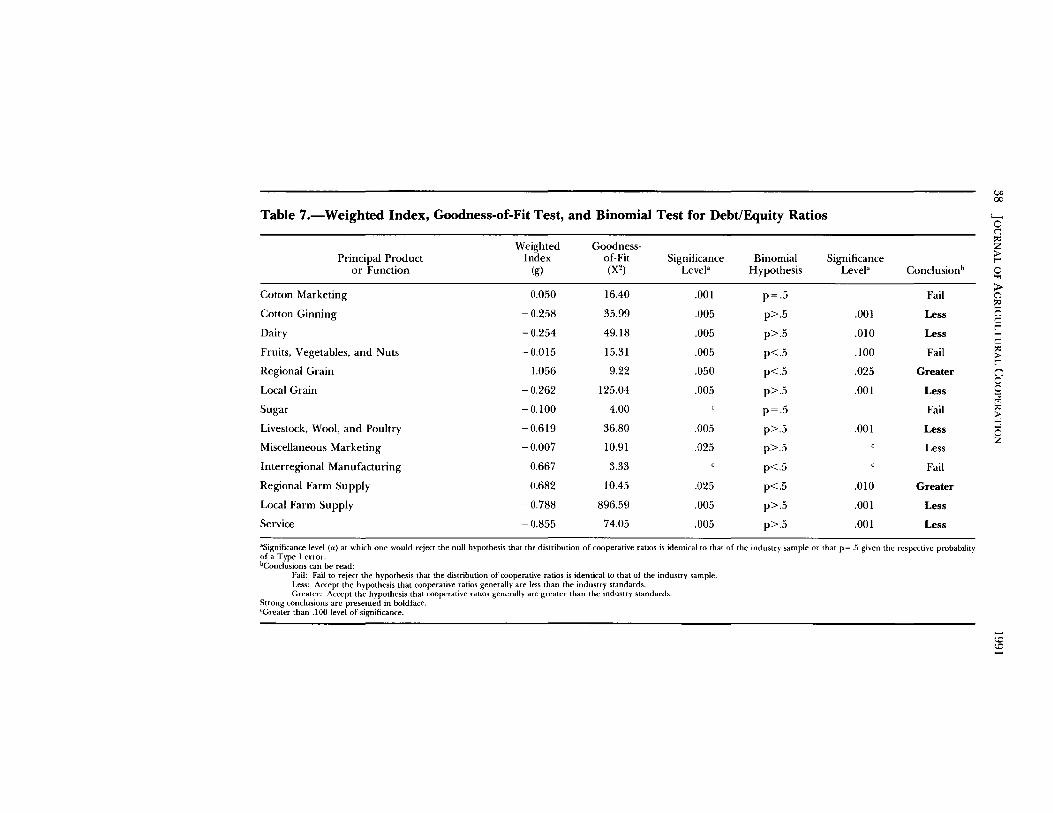
Table 7.-Weighted Index, Goodness-of-Fit Test, and Binomial Test for Debt/Equity Ratios
Weighted Goodness-Principal Product Index of-Fit Significance Binomial
or Function (g) (X2) Levela Hypothesis
Cotton Marketing 0.050 16.40 .001 p=.5
Cotton Ginning -0.258 35.99 .005 p>.5
Dairy -0.254 49.18 .005 p>.5
Fruits, Vegetables, and Nuts -0.015 15.31 .005 p<.5
Regional Grain 1.056 9.22 .050 p<.5
Local Grain -0.262 125.04 .005 p>.5
Sugar -0.100 4.00 p=.5
Livestock, Wool, and Poultry -0.619 36.80 .005 p>.5
Miscellaneous Marketing -0.007 10.91 .025 p>.5
Interregional Manufacturing 0.667 3.33 c p<.5
Regional Farm Supply 0.682 10.45 .025 p<.5
Local Farm Supply -0.788 896.59 .005 p>.5
Service -0.855 74.05 .005 p>.5
SignificanceLevela
.001
.010
.100
.025
.001
.001
.010
.001
.001
e"o00
'-0c~z>t""
Conclusionb 0..,Fail >
C'l~
Less (=jc
Lesst""...,C
Fail ~
>t""
Greater n0
Less 0'"0tTl
Fail ~
>...,Less 0
ZLess
Fail
Greater
Less
Less
aSignificance level (a) at which one would reject the null hypothesis that the distribution of cooperative ratios is identical to that of the industry sample or that p =.5 given the respective probabilityof a Type I error.bConclusions can be read:
Fail: Fail to reject the hypothesis that the distribution of cooperative ratios is identical to that of the industry sample.Less: Accept the hypothesis that cooperative ratios generally are less than the industry standards.Greater: Accept the hypothesis that cooperative ratios generally are greater than the industry standards.
Strong conclusions are presented in boldface.cGreater than .100 level of significance.
......<.0<.0......
Comparative Financial Ratio Analysis/Royer 39
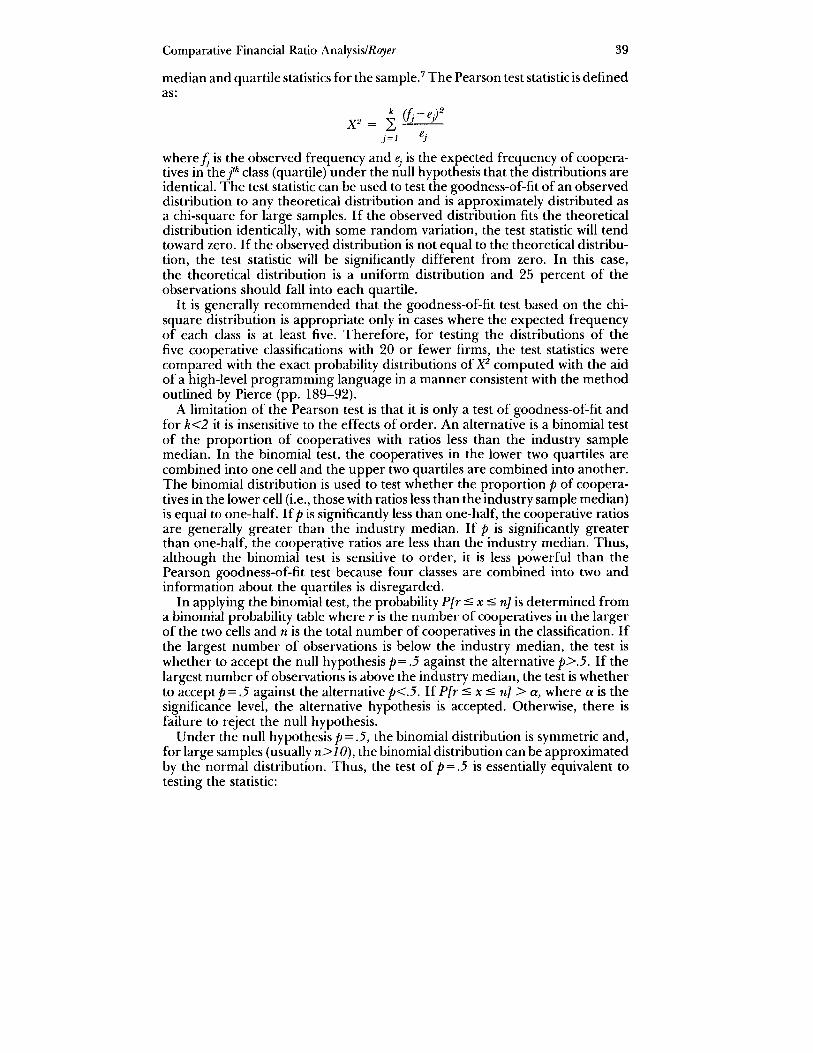
median and quartile statistics for the sample.7 The Pearson test statistic is definedas:
X2 = ±(fj-ej2j=l ej
where Jj is the observed frequency and ej is the expected frequency of cooperatives in the jth class (quartile) under the null hypothesis that the distributions areidentical. The test statistic can be used to test the goodness-of-fit of an observeddistribution to any theoretical distribution and is approximately distributed asa chi-square for large samples. If the observed distribution fits the theoreticaldistribution identically, with some random variation, the test statistic will tendtoward zero. If the observed distribution is not equal to the theoretical distribution, the test statistic will be significantly different from zero. In this case,the theoretical distribution is a uniform distribution and 25 percent of theobservations should fall into each quartile.
It is generally recommended that the goodness-of-fit test based on the chisquare distribution is appropriate only in cases where the expected frequencyof each class is at least five. Therefore, for testing the distributions of thefive cooperative classifications with 20 or fewer firms, the test statistics werecompared with the exact probability distributions of X2 computed with the aidof a high-level programming language in a manner consistent with the methodoutlined by Pierce (pp. 189-92).
A limitation of the Pearson test is that it is only a test of goodness-of-fit andfor k<2 it is insensitive to the effects of order. An alternative is a binomial testof the proportion of cooperatives with ratios less than the industry samplemedian. In the binomial test, the cooperatives in the lower two quartiles arecombined into one cell and the upper two quartiles are combined into another.The binomial distribution is used to test whether the proportion p of cooperatives in the lower cell (i.e., those with ratios less than the industry sample median)is equal to one-half. Ifp is significantly less than one-half, the cooperative ratiosare generally greater than the industry median. If p is significantly greaterthan one-half, the cooperative ratios are less than the industry median. Thus,although the binomial test is sensitive to order, it is less powerful than thePearson goodness-of-fit test because four classes are combined into two andinformation about the quartiles is disregarded.
In applying the binomial test, the probability P[r::S x ::s n] is determined froma binomial probability table where r is the number of cooperatives in the largerof the two cells and n is the total number of cooperatives in the classification. Ifthe largest number of observations is below the industry median, the test iswhether to accept the null hypothesis p =.5 against the alternative p>.5. If thelargest number of observations is above the industry median, the test is whetherto accept p =.5 against the alternative p<.5. IfP[r ::s x ::s n] > a, where a is thesignificance level, the alternative hypothesis is accepted. Otherwise, there isfailure to reject the null hypothesis.
Under the null hypothesis p=.5, the binomial distribution is symmetric and,for large samples (usually n>10), the binomial distribution can be approximatedby the normal distribution. Thus, the test of p=.5 is essentially equivalent totesting the statistic:
40 JOURNAL OF AGRICULTURAL COOPERATION 1991
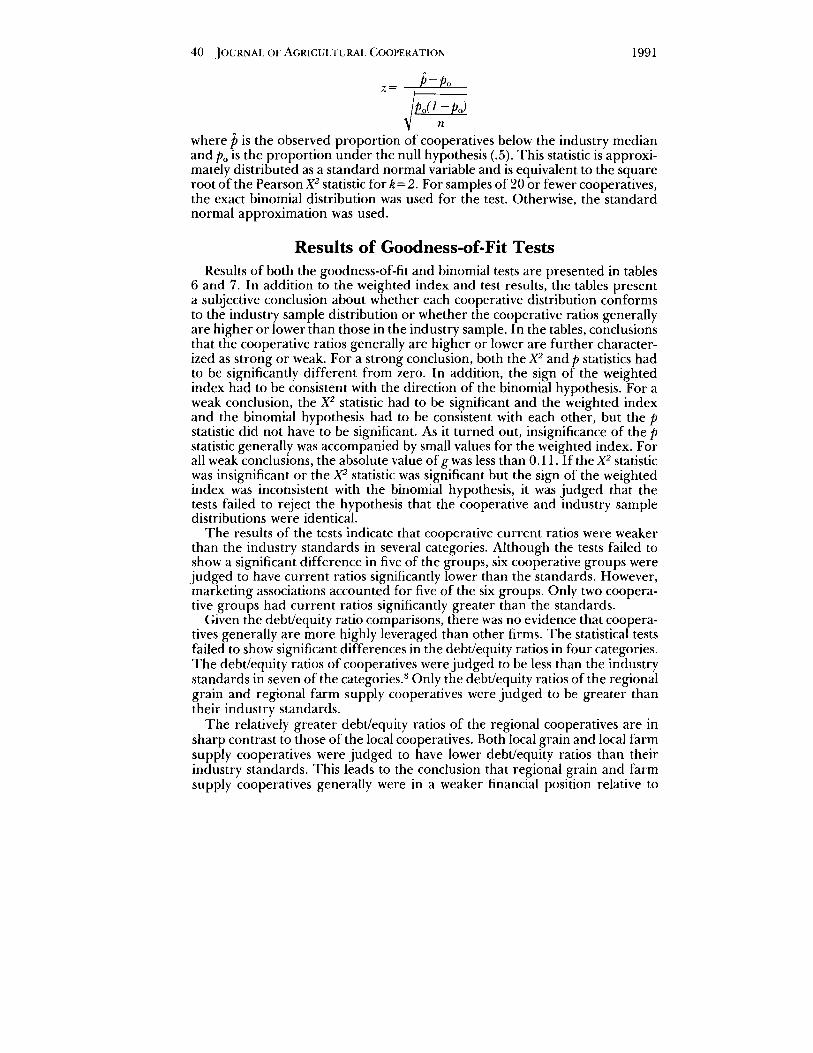
z= p-po
jNI-PJn
where pis the observed proportion of cooperatives below the industry medianand Po is the proportion under the null hypothesis (.5). This statistic is approximately distributed as a standard normal variable and is equivalent to the squareroot of the Pearson X2 statistic for k=2. For samples of20 or fewer cooperatives,the exact binomial distribution was used for the test. Otherwise, the standardnormal approximation was used.
Results of Goodness-of-Fit TestsResults of both the goodness-of-fit and binomial tests are presented in tables
6 and 7. In addition to the weighted index and test results, the tables presenta subjective conclusion about whether each cooperative distribution conformsto the industry sample distribution or whether the cooperative ratios generallyare higher or lower than those in the industry sample. In the tables, conclusionsthat the cooperative ratios generally are higher or lower are further characterized as strong or weak. For a strong conclusion, both the X2 and pstatistics hadto be significantly different from zero. In addition, the sign of the weightedindex had to be consistent with the direction of the binomial hypothesis. For aweak conclusion, the X2 statistic had to be significant and the weighted indexand the binomial hypothesis had to be consistent with each other, but the pstatistic did not have to be significant. As it turned out, insignificance of the pstatistic generally was accompanied by small values for the weighted index. Forall weak conclusions, the absolute value ofg was less than 0.11. If the X2 statisticwas insignificant or the X2 statistic was significant but the sign of the weightedindex was inconsistent with the binomial hypothesis, it was judged that thetests failed to reject the hypothesis that the cooperative and industry sampledistributions were identical.
The results of the tests indicate that cooperative current ratios were weakerthan the industry standards in several categories. Although the tests failed toshow a significant difference in five of the groups, six cooperative groups werejudged to have current ratios significantly lower than the standards. However,marketing associations accounted for five of the six groups. Only two cooperative groups had current ratios significantly greater than the standards.
Given the debt/equity ratio comparisons, there was no evidence that cooperatives generally are more highly leveraged than other firms. The statistical testsfailed to show significant differences in the debt/equity ratios in four categories.The debt/equity ratios of cooperatives were judged to be less than the industrystandards in seven of the categories.8 Only the debt/equity ratios of the regionalgrain and regional farm supply cooperatives were judged to be greater thantheir industry standards.
The relatively greater debt/equity ratios of the regional cooperatives are insharp contrast to those of the local cooperatives. Both local grain and local farmsupply cooperatives were judged to have lower debt/equity ratios than theirindustry standards. This leads to the conclusion that regional grain and farmsupply cooperatives generally were in a weaker financial position relative to

Comparative Financial Ratio Analysis/Royer 41
industry standards than their local counterparts, a conclusion reinforced by thefact that local farm supply cooperatives were judged to have greater currentratios than their industry standards while the current ratios of regional farmsupply cooperatives were judged to be smaller.
ConclusionsThe preceding analysis demonstrates the usefulness of nonparametric statisti
cal methods in performing financial ratio comparisons, particularly when published industry standard data are used and there is only limited informationavailable about the sample distributions. Results of the analysis provide noevidence to support the hypothesis that cooperatives generally are financiallyweaker than other firms in the industries in which they operate. Althoughseveral cooperative groups had lower current ratios than their industry standards, most of these groups consisted of marketing associations. The lowercurrent ratios among marketing cooperatives may be explained largely by theunique business relationships that exist between these associations and theirpatrons and the extent to which proceeds payable to patrons appear on yearend balance sheets as current liabilities.
If anything, a comparative analysis of cooperative debt/equity ratios indicatesthat cooperatives generally are less leveraged than other firms in their industries. Several cooperative groups had debt/equity ratios judged to be less thantheir respective industry standards. Of the remaining groups, only two haddebt/equity ratios judged greater than the standards. These two groups werethe regional grain and regional farm supply cooperatives.
That these groups had higher leverage ratios than their industry standardsdeserves further comment, particularly in light of the fact that their local cooperative counterparts were judged to have lower debt/equity ratios than theirindustry standards. Cooperatives in each of the two regional groups experienced major operating losses during the 1980s, and many of these losses werewritten off against the equity accounts of their local affiliates. No overall explanation for the losses can be offered. General economic conditions certainlyplayed a role in them, but in some cases, specific circumstances unique toindividual organizations appeared to be more important. Thus, although theselosses may explain some of the difference in leverage between the regionalcooperatives and their industry standards, it does not explain all of it, nor doesit explain the difference in relative leverage between the regional and localgroups.
Another factor that may be useful in explaining these differences is thatthe equity position of local cooperatives handling grain and farm supplies isartificially enhanced by the double counting of earnings they receive from theirregional affiliates but which are retained by the regionals as capital investments.Despite recent equity write-offs by regionals, local grain and local farm supplycooperatives combined held more than $1.4 billion in intercooperative investments at the end of fiscal 1987, an amount equal to nearly 27 percent of thelocal cooperatives' equity (Royer, Wissman, and Kraenzle, p. 18).
A third potential factor is that, although there may not be evidence thatcooperatives in general are "equity bound," regional cooperatives in federatedownership structures indeed may be. In other words, cooperatives at the
42 JOURNAL OF AGRICULTURAL COOPERATION 1991
regional level, which are owned by local cooperatives, may have greater difficultyacquiring equity capital to finance the size and scope of services they providetheir local cooperatives than do the local cooperatives in providing services totheir producer members. No substantive evidence supporting this conclusionis presented here, and it is offered only as a hypothesis worthy of furtherinvestigation. No research on the comparative financial performance of federated and centralized organizational structures is known to exist, and such analysis might be fruitful in offering further insight into this question.
Finally, it seems that the overall financial strength of cooperatives comparedwith other firms in their industries is better than that portrayed by authorswriting in the early 1980s. There definitely has been a rebuilding of financialstrength among cooperatives, as demonstrated by the 1987 financial profile.However, it is possible that some of the apparent improvement in the financialstrength of cooperatives relative to other firms since the early 1980s is dueeither to the fact that earlier authors compared weighted mean cooperativeratios to median industry standards or their conclusions were based on comparisons of large cooperatives for which current and debt/equity ratios generallyare weaker.
Notes1. In a related study, Lerman and Parliament analyzed nine fruit and vegetable
processing cooperatives and nine dairy processing and manufacturing cooperativesduring the same period and in a similar manner. They concluded that the leverage ratiosof the cooperatives were not greater than the industry standards and that the dairycooperatives had greater liquidity. However, they concluded that the fruit and vegetablecooperatives were less liquid.
2. Cooperative data were collected for business years ending in calendar 1987. Dun& Bradstreet data are based on business years ending between July 1, 1987, and June30, 1988. This period was chosen as the appropriate comparison because an earlierexamination of ACS records indicated that 68 percent of cooperatives ended theirbusiness years during the last six months of the calendar year. The six-month lag couldpotentially bias evaluation of relative performance against cooperatives during a periodof general economic improvement.
3. Here the quartiles are defined according to their use in the following analysisinstead of how they are defined by Dun & Bradstreet. Dun & Bradstreet actually orderindividual ratios from strongest to weakest so that the ratios falling above the upperquartile are the strongest and not necessarily those with the highest numerical values.Although it is convenient in the following analysis to present the ratios according to theirnumerical rank, high current ratios and low debt/equity ratios are assumed to representrelative financial strength, a judgment that is consistent with Dun & Bradstreet andcommon practice.
4. The SICs used in this article and by Dun & Bradstreet are as they existed prior tothe 1987 revision (U.S. Office of Management and Budget). In that revision, SIC 5152(cotton wholesaling) was eliminated and cotton wholesaling activities were included inSIC 5159 (farm-product raw materials, not elsewhere classified).
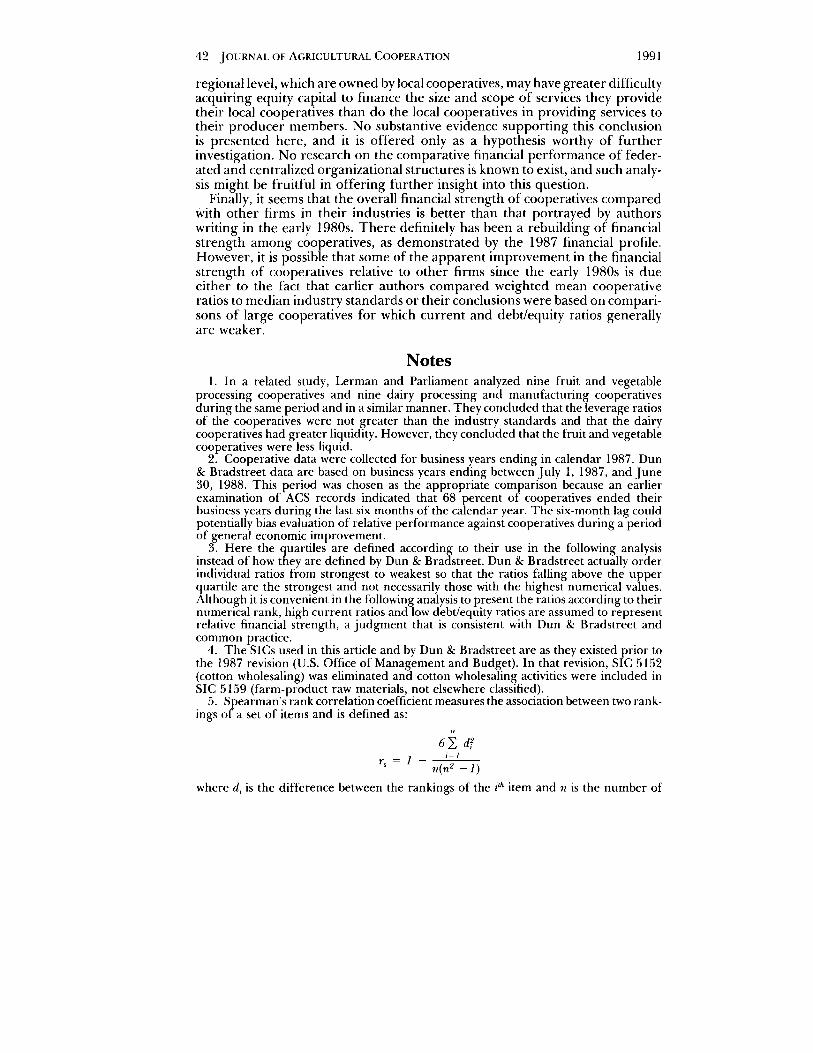
5. Spearman's rank correlation coefficient measures the association between two rankings of a set of items and is defined as:
62: dri=l
Ts = 1 - n(n2 -1)
where di is the difference between the rankings of the ith item and n is the number of
Comparative Financial Ratio Analysis/Royer 43
items ranked. The coefficient ranges from - 1 to + 1 and is interpreted in a manneranalogous to the standard correlation coefficient. The statistic used to test the hypothesisthat the two rankings are independent is:
D = 'Z dri=l
and ranges from zero to n(n -1)/3. Tables of the exact critical values of D are availablefor small sample sizes, including n = 13. For large samples, test statistics based on T, andapproximately distributed according to the standard normal and t distributions can beused. Spearman's coefficient was chosen for this analysis over Kendall's tau coefficient,another measure of association between rankings, because its interpretation as the correlation between rankings has intuitive appeal and it weights large differences in rankmore heavily than smaller ones.
6. This association is substantially greater between rankings based on the weightedmean ratios. The corresponding Spearman coefficient is .91 and is significant at the .005level.
7. Both the Pearson goodness-of-fit and binomial tests are based on random samplingwith replacement, a condition impossible to meet given the stratified sampling methodused in collecting the data upon which the ratio estimates are based. Thus, the validityof the following depends on acceptance of the estimated cooperative distributions asrepresentative of the true populations. Also, the power of each test was increased by thefact that estimated observations were considered. One reason for using a combination ofcriteria in evaluating the results of the tests (as described later) was that this conservativeapproach would offset the increase in power.
8. The conclusions for the dairy cooperative group are consistent with those of Parliament, Lerman, and Fulton with respect to the debt/equity ratio but inconsistent withtheir conclusion that dairy cooperatives were significantly more liquid than the industrysample. The conclusions regarding cooperatives handling fruits, vegetables, and nutsare consistent with the findings of Lerman and Parliament with respect to both leverageand liquidity.
ReferencesBrown, Gail N. "Current Cooperative Financial Ratios and Capital Formation."
Cooperative Accountant, Summer 1983, pp. 16-32.Chen, Kwo-Shin. "The Growth of Large Cooperative and Proprietary Firms in
the U.S. Food Sector." Ph.D. thesis, Purdue University, 1984.Dun & Bradstreet Credit Services. Industry Norms and Key Business Ratios,
1987-88 ed. Dun & Bradstreet, Inc., 1988.Griffin, Nelda, et al. The Changing Financial Structure of Farmer Cooperatives.
Washington, D.C.: USDA ESCS Farm. Coop. Res. Rep. 17, Mar. 1980.Haugen, Rolf E. "Financing Growth while Coping with Inflation-A Financial
Perspective." Cooperative Accountant, Winter 1981, pp. 68-74.Lerman, Zvi, and Claudia Parliament. "Comparative Performance of Coopera
tives and Investor-Owned Firms in U.S. Food Industries." Agribusiness6(1990):527-40.
Ling, K. Charles, and James B. Roof. Marketing Operations of Dairy Cooperatives.Washington, D.C.: USDA ACS Res. Rep. 88, Nov. 1989.
Parliament, Claudia; Zvi Lerman; and Joan Fulton. "Performance of Cooperatives and Investor-Owned Firms in the Dairy Industry."Journal ofAgriculturalCooperation 5(1990):1-16.
44 JOURNAL OF AGRICULTURAL COOPERATION 1991
Pierce, Albert. Fundamentals ofNonparametric Statistics. Belmont, Calif.: Dickenson Publishing Co., 1970.
Robert Morris Associates. Annual Statement Studies, 1988 ed. Philadelphia, Sept.1988.
Royer, Jeffrey S. "Questions Arise Concerning the Role of Debt Financing."American Cooperation 1984, pp. 181-87. Washington, D.C.: American Instituteof Cooperation, 1984.
Royer, Jeffrey S.; Roger A. Wissman; and Charles A. Kraenzle. Farmer Cooperatives' Financial Profile, 1987. Washington, D.C.: USDA ACS Res. Rep. 91,Sept. 1990.
Schrader, Lee F.; Emerson M. Babb; Robert D. Boynton; and Mahlon G. Lang.Cooperative and Proprietary Agribusinesses: Comparison ofPerformance. Agr. Exp.Sta. Res. Bull. 982, Purdue University, Apr. 1985.
Staatz, John M. Farmer Cooperative Theory: Recent Developments. Washington,D.C.: USDA ACS Res. Rep. 84, June 1989.
U.S. Office of Management and Budget. Standard Industrial Classification Manual,1987. Springfield, Va.: National Technical Information Service.
Wilcox, Rand R. New Statistical Procedures for the Social Sciences: Modern Solutionsto Basic Problems. Hillsdale, N.].: Lawrence Erlbaum Associates, 1987.


![Aalborg Universitet A Comparative Study of Three Vibration ... Comparative... · Cawley et al. [6]. Using an FEM to model a damage in a structure, theoretical values of the ratio](https://img.dokumen.tips/doc/110x75/5fb631d7fe2822508c7c1873/aalborg-universitet-a-comparative-study-of-three-vibration-comparative.jpg)


![A comparative XRPD study of Sedimentary Rocks of Pakistan · 2017-10-28 · A comparative XRPD study of Sedimentary Rocks of Pakistan ... kcl] 50/50 This ratio can ... XRPD pattern](https://img.dokumen.tips/doc/110x75/5b9ef5aa09d3f2ab0b8cb81f/a-comparative-xrpd-study-of-sedimentary-rocks-of-2017-10-28-a-comparative.jpg)


