Embed Size (px)
DESCRIPTION
A comparative Financial Analysis of Soft Drink Industry
Citation preview
A Project Report
On
A comparative Financial Analysis of Soft Drink Industry
Under Partial fulfillment for the award of the Degree MBA
(Master of Business Administration) JRN Rajasthan Vidyapeeth University, Udaipur
Under the guidance of- submitted by- Mrs Poonam Swami Ravi Sharma(Sr. Lecture in Finance Deptt)
Poddar International College, Jaipur BATCH: 2009-2011

Acknowledgment

INDEX
Sr. Topic Page 1 Executive summary 12 Industry profile 33 Company profile of pepsi 84 Company profile of
cocacola21
5 Balancesheet analysis 266 Cashflow analysis 327 Income statement analysis 458 Weighted average cost of
capital48
9 Ratio analysis 5010 Conclusion 6111 Annexure 6212 Bibliography 70

EXECUTIVE SUMMARY

INTRODUCTION
Type Public (NYSE: PEP)
Founded 1965
Headquarters New York, USA
Key people Indra Nooyi,
Chairwoman, President & CEO
Industry Food and beverage
Products :
Pepsi
Tropicana Products
Gatorade
Lay's
Doritos
Frappuccino (for Starbucks)
Mountain Dew
Operating income $6.44 billion USD (2006)
Net income $5.64 billion USD (2006)
profit margin 16.06%
Employees 153,000(2005)
GROUP OF COMPANIES
Frito-Lay North America
PepsiCo Beverages North America,
PepsiCo International
Quaker Foods North America
Mission
The main objective of the company is to provide best quality
products to its consumer. Another objective is to provide

healthy rewards to its investor, good reward to its employee
and other investor and partners who financially help the
company
Vision
The vision of the company is to improve in all aspects in
which they operate. By improving in social and economical
environment, they want to make tomorrow better than
today.
A Brief Pepsi History
In 1893, Caleb Bradham,a young pharmacist from New Bern, North Carolina,
begins experimenting with many different soft drink concoctions. Like many
pharmacists at the turn of the century he had a soda fountain in his drugstore,
where he served his customers refreshing drinks, that he created himself. His most
popular beverage was something he called "Brad's drink" made of carbonated water,
sugar, vanilla, rare oils, pepsin and cola nuts.
One of Caleb's formulations, known as "Brad's drink", created in the summer of 1893,
was later renamed Pepsi Cola after the pepsin and cola nuts used in the recipe. In 1898,
Caleb Bradham wisely bought the trade name "Pep Cola" for $100 from a competitor
from Newark, New Jersey that had gone broke. The new name was trademarked on June
16th, 1903. Bradham's neighbor, an artist designed the first Pepsi logo and ninety-seven
shares of stock for Bradham's new company were issued.
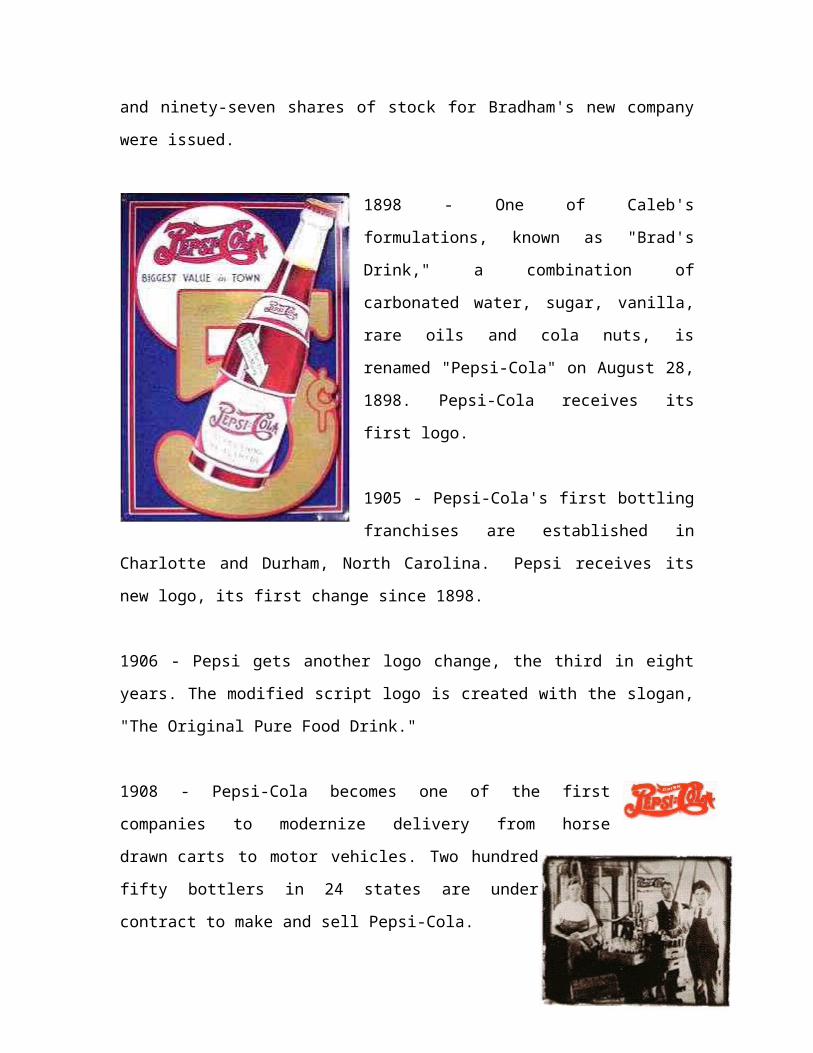
1898 - One of Caleb's formulations, known as
"Brad's Drink," a combination of carbonated water,
sugar, vanilla, rare oils and cola nuts, is renamed
"Pepsi-Cola" on August 28, 1898. Pepsi-Cola
receives its first logo.
1905 - Pepsi-Cola's first bottling franchises are
established in Charlotte and Durham, North
Carolina. Pepsi receives its new logo, its first
change since 1898.
1906 - Pepsi gets another logo change, the third in
eight years. The modified script logo is created with the slogan, "The Original Pure Food
Drink."
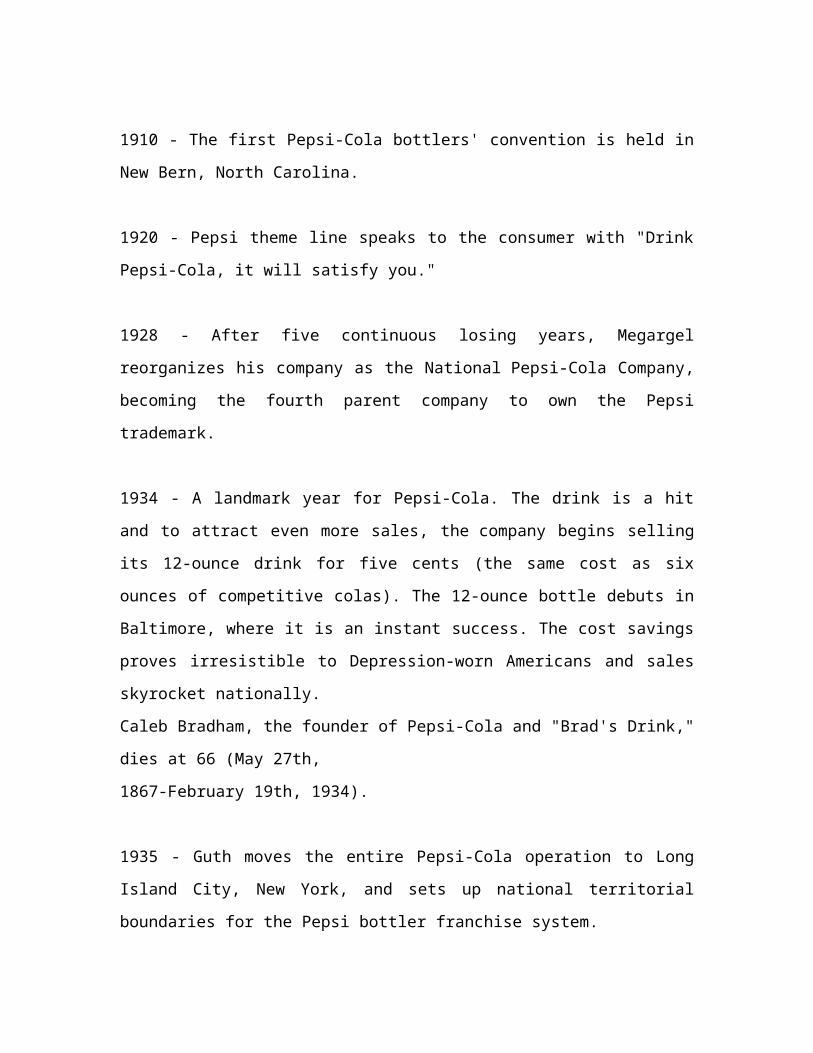
1908 - Pepsi-Cola becomes one of the first companies to modernize delivery
from horse drawn carts to motor vehicles. Two hundred fifty
bottlers in 24 states are under contract to make and sell Pepsi-
Cola.
1910 - The first Pepsi-Cola bottlers' convention is held in New Bern, North Carolina.
1920 - Pepsi theme line speaks to the consumer with "Drink Pepsi-Cola, it will satisfy
you."
1928 - After five continuous losing years, Megargel reorganizes his company as the
National Pepsi-Cola Company, becoming the fourth parent company to own the Pepsi
trademark.
1934 - A landmark year for Pepsi-Cola. The drink is a hit and to attract even more sales,
the company begins selling its 12-ounce drink for five cents (the same cost as six ounces
of competitive colas). The 12-ounce bottle debuts in Baltimore, where it is an instant
success. The cost savings proves irresistible to Depression-worn Americans and sales
skyrocket nationally.
Caleb Bradham, the founder of Pepsi-Cola and "Brad's Drink," dies at 66 (May 27th,
1867-February 19th, 1934).
1935 - Guth moves the entire Pepsi-Cola operation to Long Island City, New York, and
sets up national territorial boundaries for the Pepsi bottler franchise system.
1936 - Pepsi grants 94 new U.S. franchises and year-end profits reach $2,100,000.
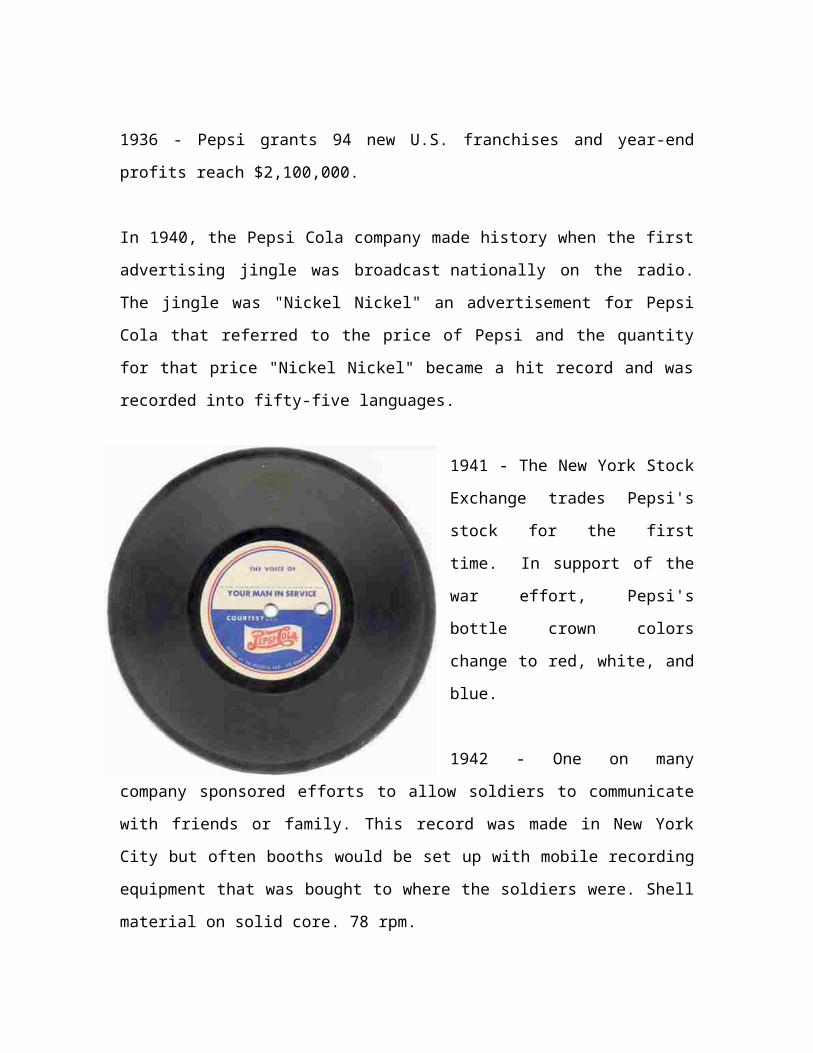
In 1940, the Pepsi Cola company made history when the first advertising jingle was
broadcast nationally on the radio. The jingle was "Nickel Nickel" an advertisement for
Pepsi Cola that referred to the price of Pepsi and the quantity for that price "Nickel
Nickel" became a hit record and was recorded into fifty-five languages.
1941 - The New York Stock
Exchange trades Pepsi's stock for the
first time. In support of the war
effort, Pepsi's bottle crown colors
change to red, white, and blue.
1942 - One on many company
sponsored efforts to allow soldiers to
communicate with friends or family.
This record was made in New York
City but often booths would be set up
with mobile recording equipment that
was bought to where the soldiers were. Shell material on solid core. 78 rpm.
1943 - Pepsi's theme line becomes "Bigger Drink, Better Taste."
1948 - Corporate headquarters moves from Long Island City, New York, to midtown
Manhattan.
1950 - Alfred N. Steele becomes President and CEO of Pepsi-Cola. Mr. Steele's wife,
Hollywood movie star Joan Crawford, is instrumental in promoting the company's
product line.
Pepsi receives its new logo, which incorporates the "bottle cap" look. The new
logo is the fifth in Pepsi history.
1953 - "The Light Refreshment" campaign capitalizes on a change in the product's
formula that reduces caloric content.
1955 - Herbert Barnet is named President of Pepsi-Cola.
1959 - Pepsi debuts at the Moscow Fair. Soviet Premier Khrushchev and U.S. Vice
President Nixon share a Pepsi.
1960 - Young adults become the target consumers and Pepsi's advertising keeps pace
with "Now it's Pepsi, for those who think young."
1962 - Pepsi receives its new logo, the sixth in Pepsi history. The 'serrated' bottle cap
logo debuts, accompanying the brand's groundbreaking "Pepsi Generation" ad campaign.
1963 - After climbing the Pepsi ladder from fountain syrup salesman, Donald M. Kendall
is named CEO of Pepsi-Cola Company. Pepsi-Cola continues to lead the soft drink
industry in packaging innovations, when the 12-ounce bottle gives way to the 16-ounce
size. Twelve-ounce Pepsi cans are first introduced to the military to transport soft drinks
all over the world.
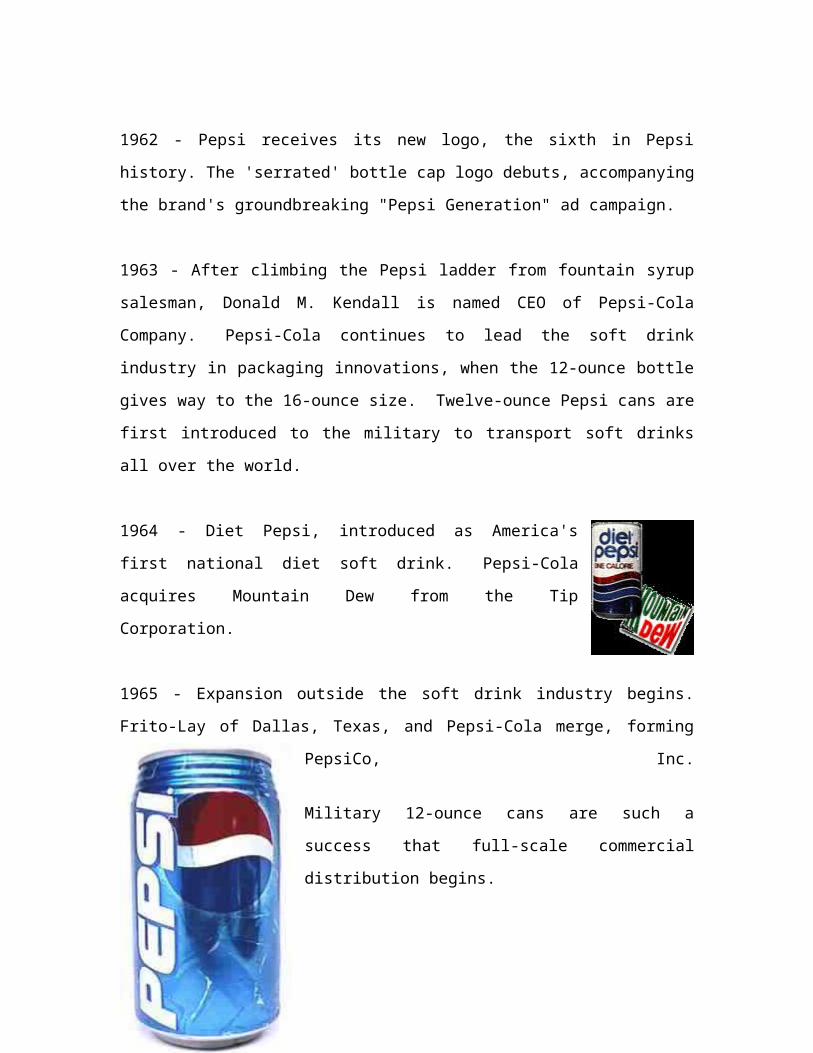
1964 - Diet Pepsi, introduced as America's first national diet soft
drink. Pepsi-Cola acquires Mountain Dew from the Tip Corporation.
1965 - Expansion outside the soft drink industry begins. Frito-Lay of
Dallas, Texas, and Pepsi-Cola merge, forming PepsiCo, Inc.
Military 12-ounce cans are such a success that full-scale
commercial distribution begins.
Mountain Dew launches its first campaign, "Yahoo
Mountain Dew...It'll tickle your innards."
1970 - Pepsi leads the way into metrics by introducing the
industry's first two-liter bottles. Pepsi is also the first
company to respond to consumer preference with light-
weight, recyclable, plastic bottles. Vic Bonomo is named President of Pepsi-Cola. The
Pepsi World Headquarters moves from Manhattan to Purchase, NY.
1974 - First Pepsi plant opens in the U.S.S.R. Television ads introduce the new theme
line, "Hello, Sunshine, Hello Mountain Dew."
1976 - Pepsi becomes the single largest soft drink brand sold in American supermarkets.
The campaign is "Have a Pepsi Day!" and a classic commercial, "Puppies," becomes one
of America's best-loved ads. As people get back to basics, Pepsi is there as one of the
simple things in life.
1977 - At 37, marketing genius John Sculley is named President of Pepsi-Cola.
1978 - The company experiments with new flavors. Twelve-pack cans are introduced.
1980 - Pepsi becomes number one in sales in the take home market.
1981 - PepsiCo and China reach agreement to manufacture soft drinks, with production
beginning next year.
1982 - Pepsi Free, a caffeine-free cola, is introduced nationwide. Pepsi Challenge activity
has penetrated 75% of the U.S. market.
1984 - Pepsi advertising takes a dramatic turn as Pepsi becomes "the choice of a New
Generation." Lemon Lime Slice, the first major soft drink with real fruit juice, is
introduced, creating a new soft drink category, "juice added." In subsequent line of
extensions, Mandarin Orange Slice goes on to become the number one orange soft drink
in the U.S. Diet Pepsi is reformulated with NutraSweet (aspertame) brand sweetener.
1985 - After responding to years of decline, Coke loses to Pepsi in preference tests
by reformulating. However, the new formula is met with widespread consumer rejection,
forcing there-introduction of the original formulation as "Coca-Cola Classic." The cola
war takes "one giant sip for mankind," when a Pepsi "space can" is successfully tested
aboard the space shuttle. By the end of 1985, the New Generation campaign earns more
than 58 major advertising and film-related awards. Pepsi's campaign featuring Lional
Richie is the most remembered in the country, according to consumer preference polls..
1987 - Pepsi-Cola President Roger Enrico is named President/CEO of PepsiCo
Worldwide Beverages. Pepsi-Cola World Headquarters moves from Purchase to Somers,
New York. After a 27 year absence, Pepsi returns to Broadway with the lighting of a
spectacular new neon sign in Times Square.
1988 - Craig Weatherup is appointed President/CEO of Pepsi-Cola Company.
1989 - Pepsi lunges into the next decade by declaring Pepsi lovers "A Generation
Ahead." Chris Sinclair is named President of Pepsi-Cola International. Pepsi-Cola
introduces an exciting new flavor, Wild Cherry Pepsi.
1990 - American Music Award and Grammy winner rap artist Young MC writes and
performs songs exclusively for national radio ads for Pepsi. Ray Charles joins the Pepsi
family by endorsing Diet Pepsi. The slogan is "You Got The Right One Baby."
1991 - Craig E. Weatherup is named CEO of Pepsi-Cola North America, as Canada
becomes part of the company's North American operations. Pepsi introduces the first
beverage bottles containing recycled polyethylene terephthalate (or PET) into the
marketplace. The development marks the first time recycled plastic is used in direct
contact with food in packaging.
1992--Pepsi-Cola launches the "Gotta Have It" theme which supplants the longstanding
"Choice of a New Generation."
1993 - Brand Pepsi introduces its slogan, "Be Young. Have Fun. Drink Pepsi." Pepsi-
Cola profits surpass $1 billion. Pepsi introduces an innovative 24-can multipack that
satisfies growing consumer demand for convenient large-size soft drink packaging. "The
Cube" is easier to carry than the traditional 24-pack and it fits in the refrigerator.
1994 - New advertising introducing Diet Pepsi's freshness dating initiative features Pepsi
CEO Craig Weatherup explaining the relationship between freshness and superior taste to
consumers. Pepsi Foods International and Pepsi-Cola International merge, creating the
PepsiCo Foods and Beverages Company.
1995 - In a new campaign, the company declares "Nothing else is a Pepsi" and takes top
honors in the year's national advertising championship.
1996 - In February of this year, Pepsi makes history once again, by launching one of the
most ambitious entertainment sites on the World Wide Web. Pepsi World eventually
surpasses all expectations, and becomes one of the most landed, and copied, sites in this
new media, firmly establishing Pepsi's presence on the Internet.
1997 - In the early part of the year, Pepsi pushes into a new era with the unveiling of
the GeneratioNext campaign. GeneratioNext is about everything that is young and fresh;
a celebration of the creative spirit. It is about the kind of attitude that challenges the norm
with new ideas, at every step of the way.
PepsiCo. announces that, effective October 6th, it will spin off its restaurant division to
form Tricon Global Restaurants, Inc. Including Pizza Hut, Taco Bell, & KFC, it will be
the largest restaurant company in the world in units and second-largest in sales.
1998 - Pepsi celebrates its 100th anniversary. PepsiCo. Chairman and CEO Roger A.
Enrico donates his salary to provide scholarships for children of PepsiCo
employees. Pepsi introduces PepsiOne - the first one calorie drink without
that diet taste!
2000 - Although Pepsi is a great place to work, Steven Truitt (aka 'struitt') takes his skills
and hard work elsewhere (for more money of course!), therefore putting an end to his
Pepsi page! For more information about Pepsi, choose a search engine and search for
'Pepsi' or visit www.pepsi.com or www.pepsico.com.
2005 - Pepsi invited to introduce new brand cola
PEPSICO IN INDIA
PepsiCo gained entry to India in 1988 by creating a joint venture with the Punjab
government-owned Punjab Agro Industrial Corporation (PAIC) and Voltas India Limited.
This joint venture marketed and sold Lehar Pepsi until 1991, when the use of foreign
brands was allowed; PepsiCo bought out its partners and ended the joint venture in 1994.
Others claim that firstly Pepsi was banned from import in India, in 1970, for having
refused to release the list of its ingredients and in 1993, the ban was lifted, with Pepsi
arriving on the market shortly afterwards. These controversies are a reminder of "India's
sometimes acrimonious relationship with huge multinational companies." Indeed, some
argue that PepsiCo and The Coca-Cola Company have "been major targets in part
because they are well-known foreign companies that draw plenty of attention."
In 2003, the Centre for Science and Environment (CSE), a non-governmental
organization in New Delhi, said aerated waters produced by soft drinks manufacturers in
India, including multinational giants PepsiCo and The Coca-Cola Company, contained
toxins, including lindane, DDT, malathion and chlorpyrifos — pesticides that can
contribute to cancer, a breakdown of the immune system and cause birth defects. Tested
products included Coke, Pepsi, 7 Up, Mirinda, Fanta, Thums Up, Limca, and Sprite. CSE
found that the Indian-produced Pepsi's soft drink products had 36 times the level of
pesticide residues permitted under European Union regulations; Coca Cola's 30 times.
CSE said it had tested the same products in the US and found no such residues. However,
this was the European standard for water, not for other drinks. No law bans the presence
of pesticides in drinks in India.
The Coca-Cola Company and PepsiCo angrily denied allegations that their products
manufactured in India contained toxin levels far above the norms permitted in the
developed world. But an Indian parliamentary committee, in 2004, backed up CSE's
findings and a government-appointed committee, is now trying to develop the world's
first pesticides standards for soft drinks. Coke and PepsiCo opposed the move, arguing
that lab tests aren't reliable enough to detect minute traces of pesticides in complex
drinks. On December 7, 2004, India's Supreme Court ruled that both PepsiCo and
competitor.
The Coca-Cola Company must label all cans and bottles of the respective soft drinks
with a consumer warning after tests showed unacceptable levels of residual pesticides.
[citation needed]
Both companies continue to maintain that their products meet all international safety
standards without yet implementing the Supreme Court ruling.[citation needed] As of
2005, The Coca-Cola Company and PepsiCo together hold 95% market share of soft-
drink sales in India. PepsiCo has also been alleged[attribution needed] to practice "water
piracy" due to its role in exploitation of ground water resources resulting in scarcity of
drinking water for the natives of Puthussery panchayat in the Palakkad district in Kerala,
India. Local residents have been pressuring the government to close down the PepsiCo
unit in the village.
In 2006, the CSE again found that soda drinks, including both Pepsi and Coca-Cola, had
high levels of pesticides in their drinks. Both PepsiCo and The Coca-Cola Company
maintain that their drinks are safe for consumption and have published newspaper
advertisements that say pesticide levels in their products are less than those in other foods
such as tea, fruit and dairy products. In the Indian state of Kerala, sale and production of
Pepsi-Cola, along with other soft drinks, has been banned. Five other Indian states have
announced partial bans on the drinks in schools, colleges and hospitals.
3.1 Highlights of PepsiCo in India:
World leader - Convenient Foods and Beverages
Revenues of more than $35 billion
More than 1,68,000 employees
Available in nearly 200 countries and territories
Group’s 37 bottling plants in India
16 are company owned and 21 are franchisee owned
Tropicana was acquired in 1998 and PepsiCo merged with The Quaker Oats
Company in 2001
Generates direct employment for more than 4000 people in India and indirect
employment for 60,000 people
Set up 8 greenfield sites in backward regions of different states. PepsiCo intends
to expand its operations and is planning an investment of approximately US$ 150
million in the next two-three years.
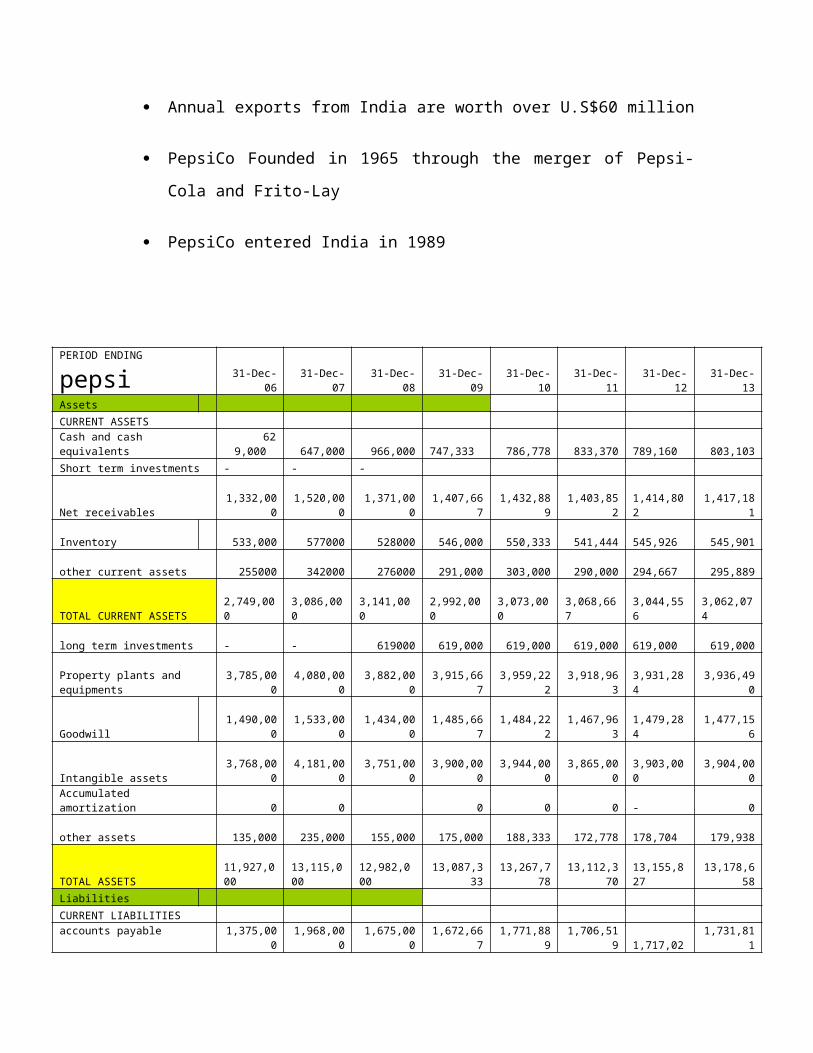
Annual exports from India are worth over U.S$60 million
PepsiCo Founded in 1965 through the merger of Pepsi-Cola and Frito-Lay
PepsiCo entered India in 1989
PERIOD ENDING pepsi 31-Dec-06 31-Dec-07 31-Dec-08 31-Dec-09 31-Dec-10 31-Dec-11 31-Dec-12 31-Dec-13
Assets
CURRENT ASSETS
Cash and cash equivalents 629,00
0 647,000 966,000 747,333 786,778 833,370
789,160 803,103
Short term investments - - -
Net receivables 1,332,000 1,520,000 1,371,000 1,407,667 1,432,889 1,403,852 1,414,802 1,417,181
Inventory 533,000 577000 528000 546,000 550,333 541,444 545,926 545,901

other current assets 255000 342000 276000 291,000 303,000 290,000 294,667 295,889
TOTAL CURRENT ASSETS 2,749,000
3,086,000
3,141,000
2,992,000
3,073,000 3,068,667
3,044,556
3,062,074
long term investments - - 619000 619,000 619,000 619,000 619,000 619,000
Property plants and equipments 3,785,000 4,080,000 3,882,000 3,915,667 3,959,222 3,918,963
3,931,284 3,936,490
Goodwill 1,490,000 1,533,000 1,434,000 1,485,667 1,484,222 1,467,963 1,479,284 1,477,156
Intangible assets 3,768,000 4,181,000 3,751,000 3,900,000 3,944,000 3,865,000 3,903,000 3,904,000
Accumulated amortization 0 0 0 0 0 - 0
other assets 135,000 235,000 155,000 175,000 188,333 172,778 178,704 179,938
TOTAL ASSETS 11,927,000
13,115,000
12,982,000 13,087,333 13,267,778 13,112,370
13,155,827 13,178,658
Liabilities
CURRENT LIABILITIES
accounts payable 1,375,000 1,968,000 1,675,000 1,672,667 1,771,889 1,706,519 1,717,025 1,731,811
short/long term debt 374,000 247,000 1,408,000 676,333 777,111 953,815 802,420 844,449
other current liabilities 302,000 0 0 100,667 33,556 44,741 59,654 45,984
TOTAL CURRENT LIABILITES 2,051,000 2,215,000 3,083,000 2,449,667 2,582,556 2,705,074 2,579,099 2,622,243
Long term debt 4,754,000 4,770,000 4,784,000 4,769,333 4,774,444 4,775,926 4,773,235 4,774,535
other liabilities 1,205,000 1,186,000 1,658,000 1,349,667 1,397,889 1,468,519 1,405,358 1,423,922
deffered long term liabilities 1,293,000 1,356,000 9,66,000 1,324,500 1,340,250 1,332,375 1,332,375 1,335,000
minority interest 540,000 973,000 1,148,000 887,000 1,002,667 1,012,556 967,407 994,210
Negative goodwill 0 0 0 0 0 0 - 0
TOTAL LIABILITIES 7,792,000 8,285,000 7,590,000 8,330,500 3,740,806 8,589,375 6,886,894 6,405,691
SHARE HOLDER'S EQUITY
prefered stocks 0 0 0 0 0 0 - 0
common stocks 3000 3000 3000 3,000 3,000 3,000 3,000 3,000
retain earnings 2,708,000 31,24,000 31,30,000 2,708,000 2,708,000 2,708,000 2,708,000 2,708,000
treasury stocks -2017000 -2269000 -2703000 -2,329,667 -2,433,889 -2,488,852 (2,417,469) -2,446,737
capital surplus 1751000 1805000 1851000 1,802,333 1,819,444 1,824,259 1,815,346 1,819,683
other stock holder equity (3,61,000) -48,000 (9,38,000) -48,000 -48,000 -48,000 (48,000) -48,000
TOTAL STOCKHOLDER EQUITY 2,084,000 26,15,000 13,43,000 2,084,000 2,084,000 2,084,000
2,084,000 2,084,000
NET TANGIBLE ASSETS -3174000 -3099000 -3842000 -3,371,667 -3,437,556 -3,550,407 (3,453,210) -3,480,391
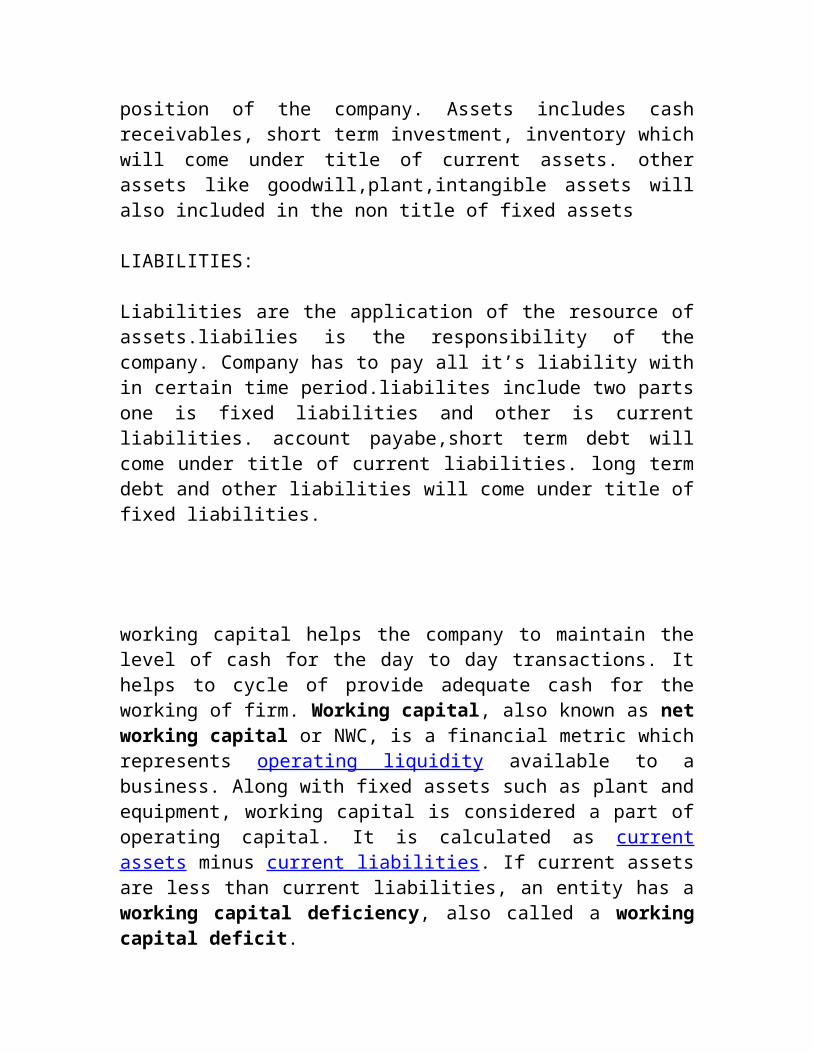
ASSETS:
Assets are the most important part of the company it provides resources to the company. Company’s position can be predicted by the assets holding capacity. larger the capacity ,stronger the position of the company. Assets includes cash receivables, short term investment, inventory which will come
under title of current assets. other assets like goodwill,plant,intangible assets will also included in the non title of fixed assets
LIABILITIES:
Liabilities are the application of the resource of assets.liabilies is the responsibility of the company. Company has to pay all it’s liability with in certain time period.liabilites include two parts one is fixed liabilities and other is current liabilities. account payabe,short term debt will come under title of current liabilities. long term debt and other liabilities will come under title of fixed liabilities.
working capital helps the company to maintain the level of cash for the day to day transactions. It helps to cycle of provide adequate cash for the working of firm. Working capital, also known as net working capital or NWC, is a financial metric which represents operating liquidity available to a business. Along with fixed assets such as plant and equipment, working capital is considered a part of operating capital. It is calculated as current assets minus current liabilities. If current assets are less than current liabilities, an entity has a working capital deficiency, also called a working capital deficit.
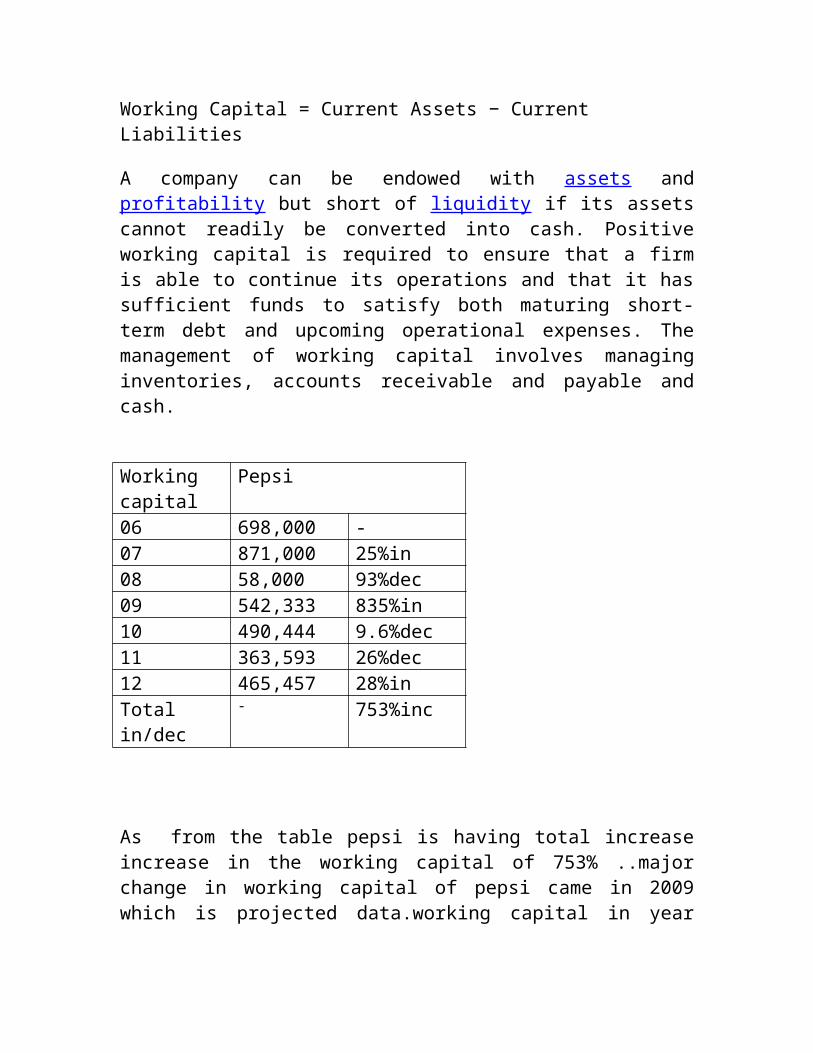
Working Capital = Current Assets − Current Liabilities
A company can be endowed with assets and profitability but short of liquidity if its assets cannot readily be converted into cash. Positive working capital is required to ensure that a firm is able to continue its operations and that it has sufficient funds to satisfy both maturing short-term debt and upcoming operational expenses. The management of working capital involves managing inventories, accounts receivable and payable and cash.
Working capital
Pepsi
06 698,000 -07 871,000 25%in08 58,000 93%dec
09 542,333 835%in10 490,444 9.6%dec11 363,593 26%dec12 465,457 28%inTotal in/dec - 753%inc
As from the table pepsi is having total increase increase in the working capital of 753% ..major change in working capital of pepsi came in 2009 which is projected data.working capital in year 2008 is lowest after a year it will increase to 542333from just 58000..
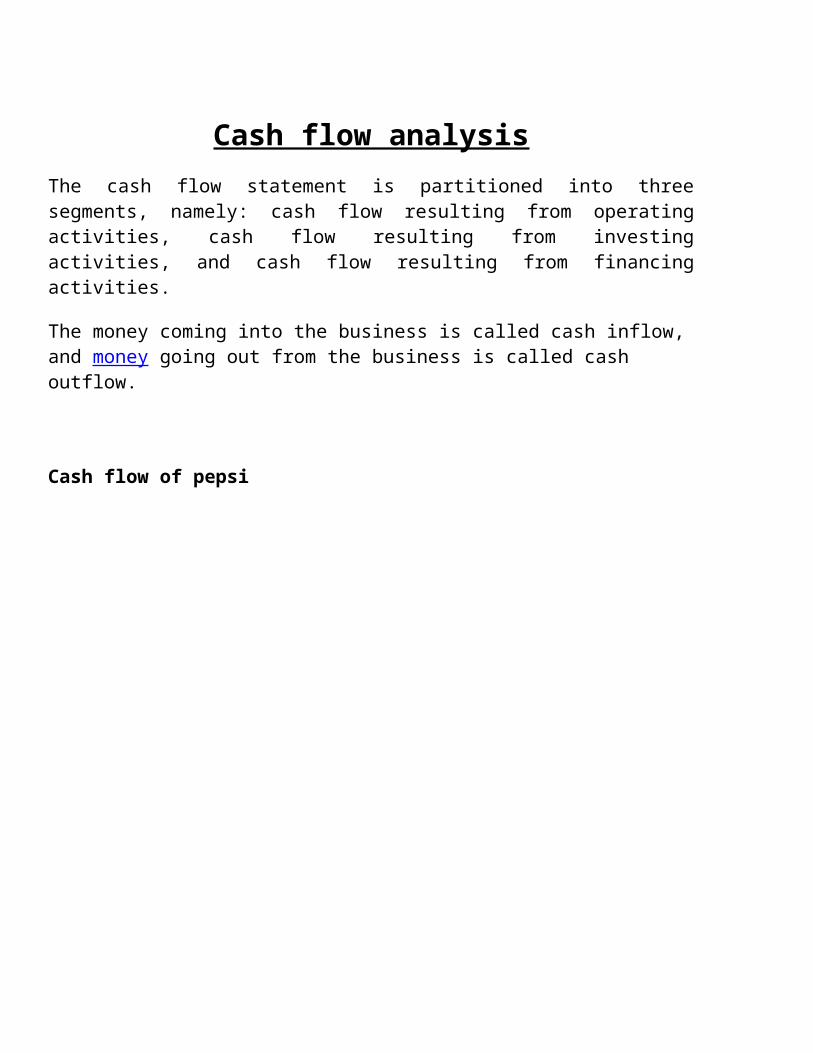
Cash flow analysis
The cash flow statement is partitioned into three segments, namely: cash flow resulting from operating activities, cash flow resulting from investing activities, and cash flow resulting from financing activities.
The money coming into the business is called cash inflow, and money going out from the business is called cash
outflow.
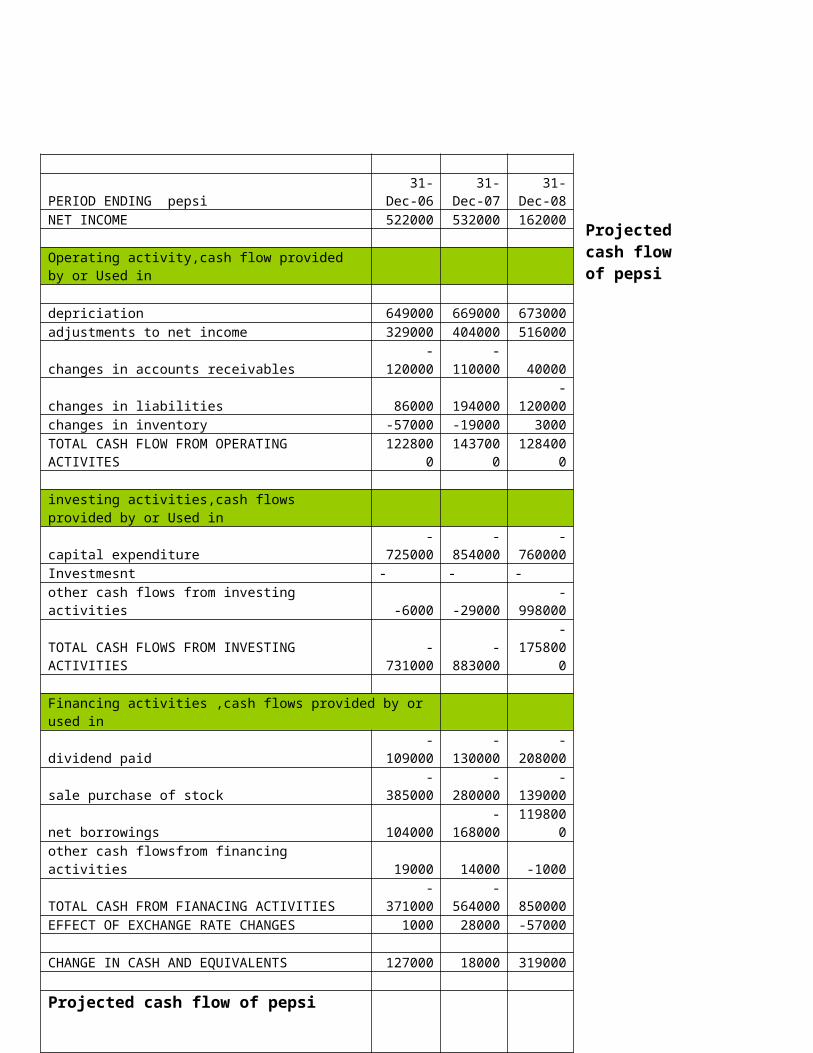
Cash flow of pepsi
PERIOD ENDING pepsi31-Dec-
0631-Dec-
0731-Dec-
08NET INCOME 522000 532000 162000
Operating activity,cash flow provided by or Used in
depriciation 649000 669000 673000adjustments to net income 329000 404000 516000changes in accounts receivables -120000 -110000 40000changes in liabilities 86000 194000 -120000changes in inventory -57000 -19000 3000TOTAL CASH FLOW FROM OPERATING ACTIVITES 1228000 1437000 1284000
investing activities,cash flows provided by or Used in capital expenditure -725000 -854000 -760000Investmesnt - - -other cash flows from investing activities -6000 -29000 -998000TOTAL CASH FLOWS FROM INVESTING ACTIVITIES -731000 -883000
-1758000
Financing activities ,cash flows provided by or used in dividend paid -109000 -130000 -208000sale purchase of stock -385000 -280000 -139000net borrowings 104000 -168000 1198000other cash flowsfrom financing activities 19000 14000 -1000TOTAL CASH FROM FIANACING ACTIVITIES -371000 -564000 850000EFFECT OF EXCHANGE RATE CHANGES 1000 28000 -57000
CHANGE IN CASH AND EQUIVALENTS 127000 18000 319000
Projected cash flow of pepsi

Projected cash flow of pepsi
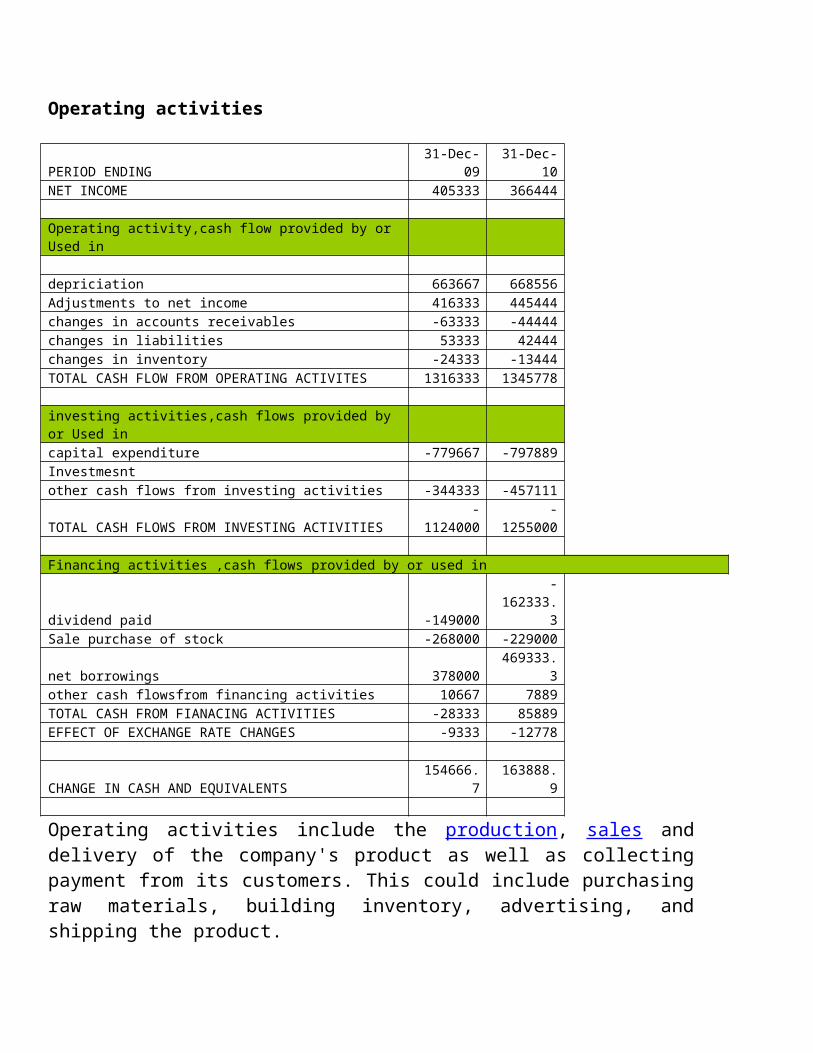
Operating activities
Operating activities include the production, sales and delivery of the company's product as well as collecting payment from its customers. This could include purchasing raw materials, building inventory, advertising, and shipping the product.
Under IAS 7, operating cash flows include:
Receipts from the sale of goods or services Receipts for the sale of loans, debt or equity instruments in a trading portfolio Interest received on loans Dividends received on equity securities Payments to suppliers for goods and services
PERIOD ENDING 31-Dec-09 31-Dec-10NET INCOME 405333 366444
Operating activity,cash flow provided by or Used in
depriciation 663667 668556Adjustments to net income 416333 445444changes in accounts receivables -63333 -44444changes in liabilities 53333 42444changes in inventory -24333 -13444TOTAL CASH FLOW FROM OPERATING ACTIVITES 1316333 1345778
investing activities,cash flows provided by or Used in capital expenditure -779667 -797889Investmesntother cash flows from investing activities -344333 -457111TOTAL CASH FLOWS FROM INVESTING ACTIVITIES -1124000 -1255000
Financing activities ,cash flows provided by or used in dividend paid -149000 -162333.3Sale purchase of stock -268000 -229000net borrowings 378000 469333.3other cash flowsfrom financing activities 10667 7889TOTAL CASH FROM FIANACING ACTIVITIES -28333 85889EFFECT OF EXCHANGE RATE CHANGES -9333 -12778
CHANGE IN CASH AND EQUIVALENTS 154666.7 163888.9
Payments to employees or on behalf of employees Interest payments (alternatively, this can be reported under financing activities
in IAS 7, and US GAAP)
Items which are added back to [or subtracted from, as appropriate the net income figure (which is found on the Income Statement) to arrive at cash flows from operations generally include:
Depreciation (loss of tangible asset value over time) Deferred tax Amortization (loss of intangible asset value over time) Any gains or losses associated with the sale of a non-current asset, because
associated cash flows do not belong in the operating section.(unrealized gains/losses are also added back from the income statement)
Dividend stock analysis of pepsi
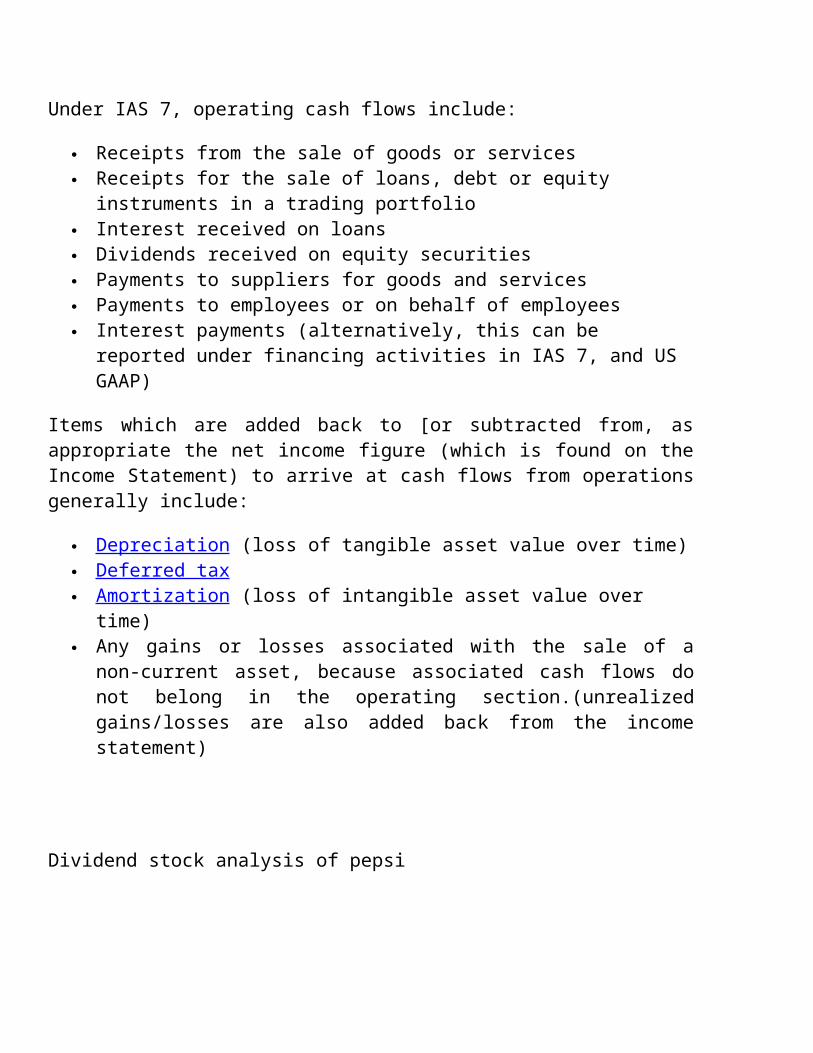
PepsiCo has been consistently increasing its dividends for 36 consecutive years. From the end of 1998 up until December 2009 this dividend growth stock has delivered a 4.70% annual average total return to its shareholders.
source:big charts.com
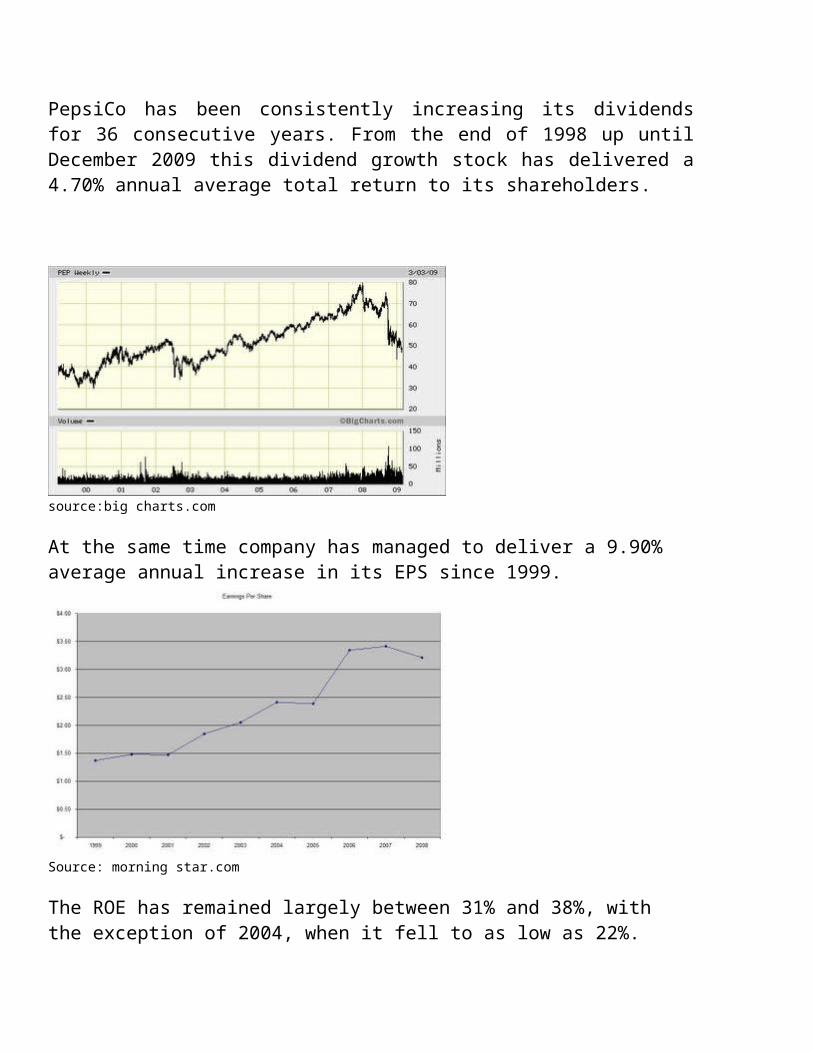
At the same time company has managed to deliver a 9.90% average annual increase in its EPS since 1999.
Source: morning star.com
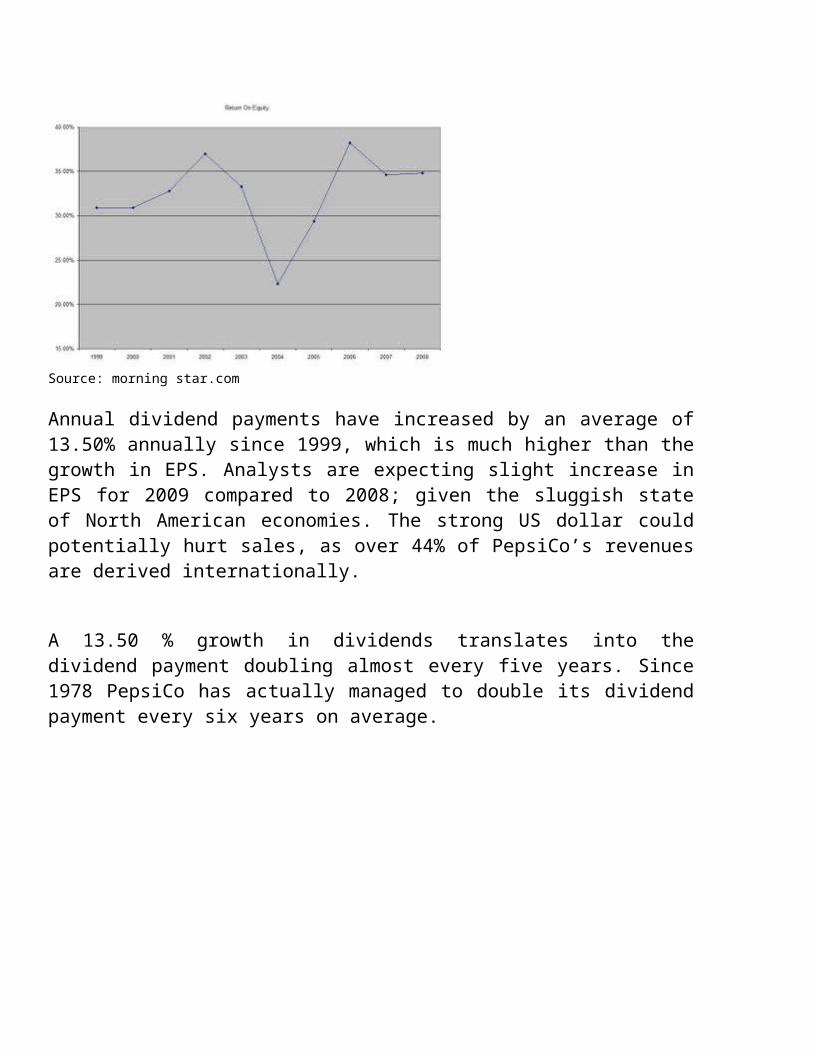
The ROE has remained largely between 31% and 38%, with the exception of 2004, when it fell to as low as 22%.
Source: morning star.com
Annual dividend payments have increased by an average of 13.50% annually since 1999, which is much higher than the growth in EPS. Analysts are expecting slight increase in EPS for 2009 compared to 2008; given the sluggish state of North American economies. The strong US dollar could potentially hurt sales, as over 44% of PepsiCo’s revenues are derived internationally.

A 13.50 % growth in dividends translates into the dividend payment doubling almost every five years. Since 1978 PepsiCo has actually managed to double its dividend payment every six years on average.
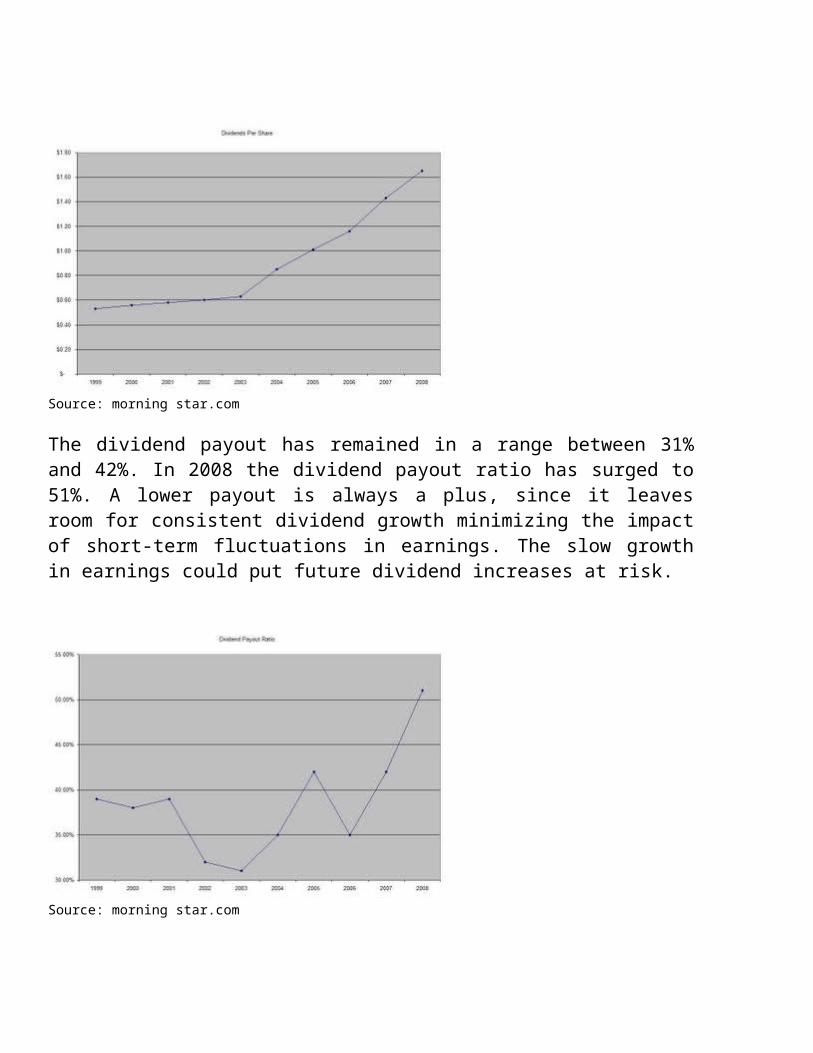
Source: morning star.com
The dividend payout has remained in a range between 31% and 42%. In 2008 the dividend payout ratio has surged to 51%. A lower payout is always a plus, since it leaves room for consistent dividend growth minimizing the impact of short-term fluctuations in earnings. The slow growth in earnings could put future dividend increases at risk.
Source: morning star.com
PepsiCo is currently attractively valued. The stock trades at a price/earnings multiple of 15, has an adequately covered dividend payout and the current dividend yield at 3.50%,
Income statement of pepsi.
Projected income statement for pepsi.
2009 2010 2011 2012 2013net revenue 39287 37966 37463 38239 37890Cogs 18050 17283 17032 17455 17257selling,general exp. 14273 13731 13572 13859 13720amortazation of intangible assets 95 105 121 107 111operating profit 6869 6847 6739 6818 6802
bottaling equit incomr 496 536 528 520 528int.exp -264 -242 -248 -252 -247int.income 113 137 141 130 136PBT 7214 7278 7160 7217 7218
Tax 1733 1684 1588 1668 1647
net income 5481 5594 5572 5549 5571
Ratio analysis
Financial Ratios
Pepsi 2006 2007 2008net revenue 43251 39474 35137Cogs 20351 18038 15762selling,general exp. 15901 14208 12711amortazation of intangible assets 64 58 162operating profit 6935 7170 6502
bottaling equit incomr 374 560 553int.exp -329 -224 -239int.income 41 125 173PBT 7021 7631 6989
Tax 1879 1973 1347
net income 5142 5658 5642
Financial ratios are useful indicators of a firm's performance and financial situation. Most ratios can be calculated from information provided by the financial statements. Financial ratios can be used to analyze trends and to compare the firm's financials to those of other firms. In some cases, ratio analysis can predict future bankruptcy.
Financial ratios can be classified according to the information they provide. The following types of ratios frequently are used:
Liquidity ratios Asset turnover ratios Financial leverage ratios Profitability ratios Dividend policy ratios
Liquidity Ratios
Liquidity ratios provide information about a firm's ability to meet its short-term financial obligations. They are of particular interest to those extending short-term credit to the firm. Two frequently-used liquidity ratios are the current ratio (or working capital ratio) and the quick ratio.
The current ratio is the ratio of current assets to current liabilities:
Current Ratio =
Current Assets
Current Liabilities
Short-term creditors prefer a high current ratio since it reduces their risk. Shareholders may prefer a lower current ratio so that more of the firm's assets are working to grow the business. Typical values for the current ratio vary by firm and industry. For example, firms in cyclical industries may maintain a higher current ratio in order to remain solvent during downturns.
One drawback of the current ratio is that inventory may include many items that are difficult to liquidate quickly and that have uncertain liquidation values. The quick ratio is an alternative measure of liquidity that does not include inventory in the current assets. The quick ratio is defined as follows:
Quick Ratio =
Current Assets - Inventory
Current Liabilities
The current assets used in the quick ratio are cash, accounts receivable, and notes receivable. These assets essentially are current assets less inventory. The quick ratio often is referred to as the acid test.
Finally, the cash ratio is the most conservative liquidity ratio. It excludes all current assets except the most liquid: cash and cash equivalents. The cash ratio is defined as follows:
Cash Ratio =
Cash + Marketable Securities
Current Liabilities
The cash ratio is an indication of the firm's ability to pay off its current liabilities if for some reason immediate payment were demanded.
Asset Turnover Ratios
Asset turnover ratios indicate of how efficiently the firm utilizes its assets. They sometimes are referred to as efficiency ratios, asset utilization ratios, or asset management ratios. Two commonly used asset turnover ratios are receivables turnover and inventory turnover.
Receivables turnover is an indication of how quickly the firm collects its accounts receivables and is defined as follows:
Receivables Turnover =
Annual Credit Sales
Accounts Receivable
The receivables turnover often is reported in terms of the number of days that credit sales remain in accounts receivable before they are collected. This number is known as the collection period. It is the accounts receivable balance divided by the average daily credit sales, calculated as follows:
= Accounts Receivable
Average Collection PeriodAnnual Credit Sales / 365
The collection period also can be written as:
Average Collection Period =
365
Receivables Turnover
Another major asset turnover ratio is inventory turnover. It is the cost of goods sold in a time period divided by the average inventory level during that period:
Inventory Turnover =
Cost of Goods Sold
Average Inventory
The inventory turnover often is reported as the inventory period, which is the number of days worth of inventory on hand, calculated by dividing the inventory by the average daily cost of goods sold:
Inventory Period =
Average Inventory
Annual Cost of Goods Sold / 365
The inventory period also can be written as:
Inventory Period =
365
Inventory Turnover
Other asset turnover ratios include fixed asset turnover and total asset turnover.
Financial Leverage Ratios
Financial leverage ratios provide an indication of the long-term solvency of the firm. Unlike liquidity ratios that are concerned with short-term assets and liabilities, financial leverage ratios measure the extent to which the firm is using long term debt.
The debt ratio is defined as total debt divided by total assets:
Debt Ratio =
Total Debt
Total Assets
The debt-to-equity ratio is total debt divided by total equity:
Debt-to-Equity Ratio =
Total Debt
Total Equity
Debt ratios depend on the classification of long-term leases and on the classification of some items as long-term debt or equity.
The times interest earned ratio indicates how well the firm's earnings can cover the interest payments on its debt. This ratio also is known as the interest coverage and is calculated as follows:
Interest Coverage =
EBIT
Interest Charges
where EBIT = Earnings Before Interest and Taxes
Profitability Ratios
Profitability ratios offer several different measures of the success of the firm at generating profits.
The gross profit margin is a measure of the gross profit earned on sales. The gross profit margin considers the firm's cost of goods sold, but does not include other costs. It is defined as follows:
Gross Profit Margin =
Sales - Cost of Goods Sold
Sales
Return on assets is a measure of how effectively the firm's assets are being used to generate profits. It is defined as:
Return on Assets =
Net Income
Total Assets
Return on equity is the bottom line measure for the shareholders, measuring the profits earned for each dollar invested in the firm's stock. Return on equity is defined as follows:
Return on Equity =
Net Income
Shareholder Equity
Dividend Policy Ratios
Dividend policy ratios provide insight into the dividend policy of the firm and the prospects for future growth. Two commonly used ratios are the dividend yield and payout ratio.
The dividend yield is defined as follows:
Dividend Yield =
Dividends Per Share
Share Price
A high dividend yield does not necessarily translate into a high future rate of return. It is important to consider the prospects for continuing and increasing the dividend in the future. The dividend payout ratio is helpful in this regard, and is defined as follows:
Payout Ratio =
Dividends Per Share
Earnings Per Share
Use and Limitations of Financial Ratios
Attention should be given to the following issues when using financial ratios:
A reference point is needed. To to be meaningful, most ratios must be compared to historical values of the same firm, the firm's forecasts, or ratios of similar firms.
Most ratios by themselves are not highly meaningful. They should be viewed as indicators, with several of them combined to paint a picture of the firm's situation.
Year-end values may not be representative. Certain account balances that are used to calculate ratios may increase or decrease at the end of the accounting period because of seasonal factors. Such changes may distort the value of the ratio. Average values should be used when they are available.
Ratios are subject to the limitations of accounting methods. Different accounting choices may result in significantly different ratio value
Financial Leverage:
Financial leverage is the use of fixed cost funds such as debt or preferred stock to increase the common stockholder's return. Using debt in the firm produces a stream of earnings that has greater volatility (risk) than would occur in the same firm if it had less debt. One major factor is management's willingness to accept financial risk. A second factor is earnings predictability. Two debt ratios that were computed are the debt to total assets ratio, or the "debt ratio," and the equity multiplier.
Debt Ratio:
The Debt ratio is calculated as the sum of all the liability accounts divided by "total assets." For our four sample firms, the numerator is the sum of everything on the right side of the balance sheet from "current liabilities" through "deferred income taxes”.
Return on Equity:
Many would argue that the most important ratio to calculate for a company is its return on equity (ROE), which is "net income available to common stockholders" divided by "common equity”. ROE represents the rate of return the company earned on the book value of its equity investment. The higher the number, the greater the return the companyis earning for its shareholders. For our companies, PepsiCo has the greatest ROE, 39.84 percent, which is an exceptionally high number.
PepsiReturn on equity 39.84
PepsiCo has an excellent ROE. It is a result of its high profit margin, effective asset utilization, and use of leverage. PepsiCo probably is pursuing an aggressive debt strategybecause of the lower profitability of some of its product lines.
Return on equity
Net profit margin
Total turn over
Equity muliplier
Pepsi 39.64 10.6 2 1.86Price/Earnings Ratio:
The Price/ Earnings Ratio is used to gauge the relative value of a security in the light of current market conditions. It is determined by dividing the price of a share of stock by its earnings per share for a 12-month period. Sometimes the P/E is referred to as the "multiple” because it shows how much investors are willing to pay per dollar of earnings. PepsiCo has a high P/E, which means high projected earnings in the future, in comparison to its competitors in the beverage industry.Price/Cash Flow:
The Price/ Cash Flow is calculated by dividing the closing price with the cash flow per share from the last 12 months. An alternative to the P/E ratio, this ratio removes depreciation and other non-cash charges from the equation. Another advantage of the Price/Cash Flow ratio is that it makes it easier to analyze various companies across the board. As displayed above, Coca-Cola has the most efficient Price/Cash Flow ratio than PepsiCo’s 17.28 ratio, which displays that three of the four companies have ample money available to spend on research and development, to expand operations, and to pay dividends to investors.
Conclusion
Pepsi Co.: - current ratio is high – short-term solvency is favorable - greater volatility in ratios- greatly reduces D/E ratio- increases TIE ratio – solvency- shorter days sales of inventory period – better inventory management- increases slightly asset turnover- capital intensity increases – better capital utilization to realize sales- profit margin increases significantly
In conclusion, the ratios of Pepsi Co. significantly improve and lose their worrisome volatility with time. They reach levels as high, if not higher, than those of their main competitor
Balancesheet of pepsi co.

Assets

Current Assets
Cash And Cash Equivalents 966,000 647,000 629,000
Short Term Investments - - -
Net Receivables 1,371,000 1,520,000 1,332,000
Inventory 528,000 577,000 533,000
Other Current Assets 276,000 342,000 255,000
Total Current Assets 3,141,000 3,086,000 2,749,000
Long Term Investments 619,000 - -
Property Plant and Equipment 3,882,000 4,080,000 3,785,000
Goodwill 1,434,000 1,533,000 1,490,000
Intangible Assets 3,751,000 4,181,000 3,768,000
Accumulated Amortization - - -
Other Assets 155,000 235,000 135,000
Deferred Long Term Asset Charges - - -
Total Assets 12,982,000 13,115,000 11,927,000
Liabilities
Current Liabilities
Accounts Payable 1,675,000 1,968,000 1,375,000
Short/Current Long Term Debt 1,408,000 247,000 374,000
Other Current Liabilities - - 302,000
Total Current Liabilities 3,083,000 2,215,000 2,051,000
Long Term Debt 4,784,000 4,770,000 4,754,000
Other Liabilities 1,658,000 1,186,000 1,205,000
Deferred Long Term Liability Charges 966,000 1,356,000 1,293,000
Minority Interest 1,148,000 973,000 540,000
Negative Goodwill - - -
Total Liabilities 11,639,000 10,500,000 9,843,000
Cash flow of pepsi.
View: Annual DataQuarterly Data All numbers in thousands
PERIOD ENDING 27-Dec-08 29-Dec-07 30-Dec-06
Net Income 162,000 532,000 522,000
Operating Activities, Cash Flows Provided By or Used In
Depreciation 673,000 669,000 649,000
Adjustments To Net Income 516,000 404,000 329,000
Changes In Accounts Receivables 40,000 (110,000) (120,000)
Changes In Liabilities (120,000) 194,000 86,000
Changes In Inventories 3,000 (19,000) (57,000)
Changes In Other Operating Activities 10,000 (233,000) (181,000)
Total Cash Flow From Operating Activities 1,284,000 1,437,000 1,228,000
Investing Activities, Cash Flows Provided By or Used In
Capital Expenditures (760,000) (854,000) (725,000)
Investments - - -
Other Cashflows from Investing Activities (998,000) (29,000) (6,000)
Total Cash Flows From Investing Activities (1,758,000) (883,000) (731,000)
Financing Activities, Cash Flows Provided By or Used In
Dividends Paid (208,000) (130,000) (109,000)
Sale Purchase of Stock (139,000) (280,000) (385,000)
Net Borrowings 1,198,000 (168,000) 104,000
Other Cash Flows from Financing Activities (1,000) 14,000 19,000
Total Cash Flows From Financing Activities 850,000 (564,000) (371,000)
Effect Of Exchange Rate Changes (57,000) 28,000 1,000
Change In Cash and Cash Equivalents $319,000 $18,000 $127,000
Incomestatement of pepsi.
Stockholders' Equity
Misc Stocks Options Warrants
- - -
Redeemable Preferred Stock - - -
Preferred Stock - - -
Common Stock 3,000 3,000 3,000
Retained Earnings 3,130,000 3,124,000 2,708,000
Treasury Stock (2,703,000) (2,269,000) (2,017,000)
Capital Surplus 1,851,000 1,805,000 1,751,000
Other Stockholder Equity (938,000) (48,000) (361,000)
Total Stockholder Equity 1,343,000 2,615,000 2,084,000
Net Tangible Assets($3,842,000
)($3,099,000
)($3,174,000
)
Pepsi 2006 2007 2008net revenue 43251 39474 35137Cogs 20351 18038 15762selling,general exp. 15901 14208 12711amortazation of intangible assets 64 58 162operating profit 6935 7170 6502
Bottaling equit incomr 374 560 553int.exp -329 -224 -239int.income 41 125 173PBT 7021 7631 6989
Tax 1879 1973 1347
net income 5142 5658 5642

Equity of pepsi.
Bibliography
PEPSICO WEBSITE,www.pepsico.com
WWW.YAHOOFINANCE.COM
WWW.MORNINGSTAR.COM
WWW.BIGCHARTS.COM
PEPSICO INTERNATIONAL INTERNAL REPORT
WWW.AUTHORSTREAM.COM


![REPORT OF SOFT DRINK CONSUMPTION HABITS IN INDONESIA...A. Executive summary –Brand awareness [5] Coca-Cola is the brand leader for soft drink category. • The top three soft drink](https://img.dokumen.tips/doc/110x75/5e62f40798e4586b2b4a7116/report-of-soft-drink-consumption-habits-in-indonesia-a-executive-summary-abrand.jpg)