Embed Size (px)
Citation preview

A combined microwave and infrared radiometer approach for a high resolution global precipitation map in the GSMaP Japan
Tomoo Ushio, K. Okamoto, K. Aonashi, T. Inoue, T. Kubota, H. Hashizume, T. Simomura, T. Iguchi, N. Takahashi, R. Oki, M. Kachi

Outline Background
On the GSMaP project Microwave radiometer based precipitation map Needs for the Infrared data (IR)
Methodology Cloud motion and Kalman filter approach from the Geo-IR data
Results Demonstration of our product Initial evaluation of our product PEHRPP activities in Japan
Summary and future directions

Goals of the project
Production of high precision and high resolution global precipitation map by using satelliteborne microwave radiometer data
-e.g. Spatial resolution: 0.1 ゚ ✕ 0.1 ゚ , Temporal resolution: 1 day -Microwave radiometers (TMI, SSM/I ×3, AMSR-E, AMSR) -Precipitation radar, IR data
Development of reliable microwave radiometer algorithm -Based on the common physical precipitation model which precipitation
radar also uses. Even in version 6 TRMM algorithms, about 10-15% discrepancy can be seen in monthly average rainfall rates retrieved by TMI and PR.
Establishment of precipitation map production technique by using multi-satellite data for the coming GPM era

Obs. Data
Precip. Retrieval
Flow of the GSMaP Project
Routine Obs.Campaign Obs.
Data base
ParameterSensitivity Exp.
Match-upData Anal.
Look-upTable
Verify
Precip. MapProducts
Obs. Data
High TemporalResolution Map
Obs.Data
RadarAlgorithm
Meteor. Satellites
Global Precip. Map TRMM/PR
Ground Obs.
Precip. MapData base
Precip. Physical Model
Algorithm G .
Precip. Physical Model G.
Ground Radar Obs. G.
Global Precip. Map G .
Algorithm
Microwave Radiometer
Interpolation Algo.

How do we get a global precipitation map?
The accurate estimation of surface rainfall on a global scale with high resolution has been one of the major goals in global water cycle and its related area.
Ground based approach Fairly good estimation Generally suffer from spatial coverage problems.
Satellite based approach Fairly good coverage and reasonably good estimation There is not a single space-born sensor to detect surface rainfall
in near real time on a global basis. We need to combine the data from multiple satellites.

Approach of the GSMaP project
We use the Aonashi Algorithm to retrieve rainfall rate.
The sensors for the analysis are TMI, AMSR-E, AMSR, SSMI (F13, 14, 15).
Name Data availableTRMM (TMI) Jan. 1998 to Dec. 2005
Aqua (AMSR-E) Jan. 2003 to Oct. 2005
ADEOS-II (AMSR) Apr. 2003 to Oct. 2003
DMSP (SSMI:F13, F14, F15) Sep. 2003, July. 2005 and several


Monthly precipitation accumulation from DMSP/SSMI (F13, 14, 15) for Sep. 2003
F13
F15
F14

6 hourly MWR combined map
Combined6 hourly
TMI AMSR & AMSR-E
SSM/I ( F13, F14, F15 )


How can we get a global precipitation map with temporal resolution of 3 hours or less? Infrared radiometers (IR)
can provide information on cloud top layers (not precipitation) Can ensure a global coverage with high temporal resolution (> 30 min)
due to the geo-synchronous orbit (GEO)
Microwave radiometers (MW) Can detect cloud structure and precipitation with high spatial resolution The major draw back is temporal sampling due low earth orbit satellite
(LEO)
The LEO-MW and GEO-IR radiometry are quite complementary for monitoring the highly variable parameters like precipitation.
How do we combine the MWR and IR data?
Combination of the moving vector and Kalman filtering method
The moving vector method was introduced by Joyce et al. [2004]. Joyce R., J. Janowiak, P. Arkin, and P. Xie, CMORPH: A method that produces global precipitation estimates from passive microw
ave and ifrared data at high spatial and temporal resolution, J. Hydrometeorology, 487-503, 2004
Advantage MWR based approach (not Tb but cloud motion) Fast processing time
Disadvantage Not include the developing and decaying process of precipitation
Kalman filter approach Refine precipitation rate on Kalman gain after propagating the rain pixel The Kalman gain is determined from the database on the relationship be
tween the IR Tb and surface rain rate.
New!!

11.4 μm Geo IR1 hour before
11.4 μm Geo IRPresent
Infrared (IR) Data
Microwave Radiometer (MWR) Data
1 hr Moving Vector
GSMaP Data
GSMaPPresent
GSMaP1 hour before
1 hr MWRPresent
Algorithm flow
Predicted GSMaP
Kalman Filter

)( EquationnObservatioxy vkk
State and observation equation used in Kalman filter
) ( EquationStatexx wkk 1
: Rain rate at time k : Infrared Tb : Rain rate at time k+1: System noise: Observation noise
1kx
kx
ky
vw
180
230
280
0 5 10 15 20 25 30Rain Rate[mm/ h]
Brig
htne
ss T
empe
ratu
re[T
]

Predicted rain rate
IR Tb
Predicted rain rate
Refinement
Prediction
xx ˆ
xyKxx ˆ
GSMaP x̂
x
x
Kalman Filter
2
42 K
2
2
v
w
Obs. Noise
System Noise
v
w
y

Correlation between radar and the GSMaP product as Correlation between radar and the GSMaP product as a function of the past microwave satellite overpass a function of the past microwave satellite overpass
0
0.2
0.4
0.6
0.8
1
0 1 2 3 4 5 6
Time (hour)
Cor
rela
tion
mv(2000_8)mvk(2000_8)
With Kalman filter
Without Kalman filterMoving vector only
0
0.2
0.4
0.6
0.8
1
0 10 20 30 40 50
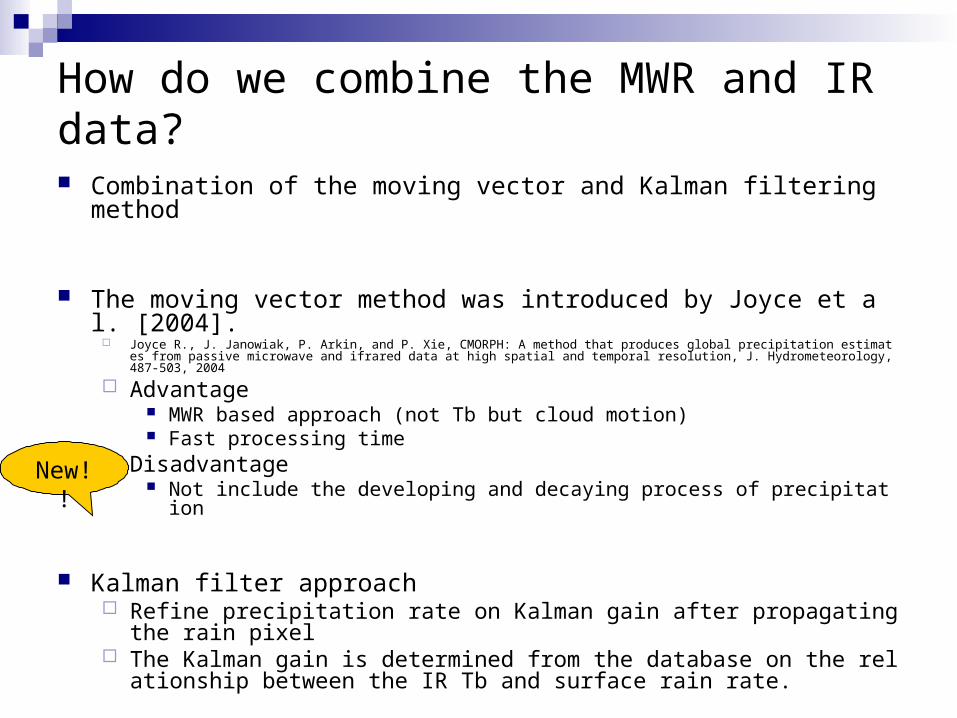
Effect of Kalman Filter ( Aug. 2000 )‐ TRMM/TMI only‐
Corre
latio
n
Time (hr)
GSMaP VS Radar rain gauge network in Japan
■ : with Kalman filter
▲ : Moving vector only


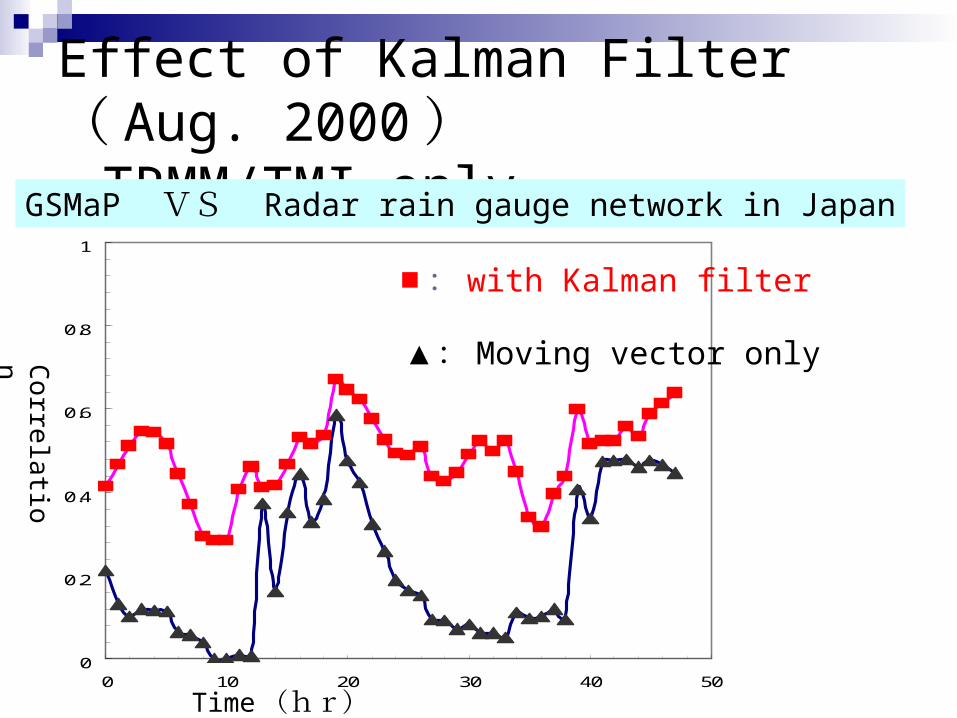
On the PEHRPP web in Japan
We started to make the evaluation web site using the radar-rain gauge network data around Japan in 2005.
The IDL codes to make the web are all from Dr. Beth Ebert.


A comparison of the GSMaP with CMORPH from the PEHRPP web in Japan
0
0.1
0.2
0.3
0.4
0.5
0.6
0.7
0.8
0.9
1
7/5/
2005
7/6/
2005
7/7/
2005
7/8/
2005
7/9/
2005
7/10
/200
5
7/11
/200
5
7/12
/200
5
7/13
/200
5
7/14
/200
5
7/15
/200
5
7/16
/200
5
7/17
/200
5
7/18
/200
5
7/19
/200
5
7/20
/200
5
7/21
/200
5
7/22
/200
5
7/23
/200
5
7/24
/200
5
7/25
/200
5
date
Cor
rela
tion
CMORPHGSMaP_MWRGSMaP_MVK

PEHRPP web site in Japan
http://www.radar.aero.osakafu-u.ac.jp/~gsmap/IPWG/dailyval.html
Or you can access this site by clicking the address on the DVD.

Summary Initial results of the global precipitation
map from the MWR and from IR and MWR combined algorithm were introduced and demonstrated.
The details of the GSMaP project are in the DVD I brought.
Acknowledgements
Thanks to Dr. Bob Adler and Kris Kummerow, we could kick off this project.
Thanks to Dr. Beth Ebert and Dr. Phil Arkin, we could make the web site.

Thank you!! 謝謝 !! Danke!! Merci!! ありがとう!!

Global Satellite Mapping of Precipitation projectOrganization of Research Team in FY 2005
Principal Investigator K. Okamoto
Administrative Assistant K. Matsukawa
Ground Radar Observation Group K. Iwanami ( Leader ) K. Nakagawa , H. Hanado , K. KitamuraPrecipitation Physical Model Production Group
N. Takahashi ( Leader ), J.Awaka,
T. Kozu , S. Satoh , Y.
Takayabu , M.HiroseAlgorithm Developing Group
T. Iguchi ( Leader ) , M. Fujita , T.
Inoue,
K. Aonashi , S. Shimizu, S.Seto, H.Eito,
K.TakahashiSatellite Data Processing and Global Map Production Group
T. Ushio ( Leader ) , S. Shige,
H.Hashizume, R. Oki , M. Kachi,
T. Kubota, Y. Iida, H.Sasaki

What, When, Where, and How do we analyze for?
Purpose: To map the global precipitation map with 0.1 degree/1 hour resolution
What: IR: 1hour global IR data from Goddard/DAAC MWR: TMI, AMSR-E, AMSR, and SSM/I×3 When:July 2005 Where: 60 degree in latitude around globe How: By interpolating precipitation between
MWR overpasses using the cloud motion and Kalman filtering inferred from 1 hour IR images.


![Introduction of the Global Hydrological Simulation System ... · Introduction of the Global Hydrological Simulation System using GSMaP References [1] Takata, K., S. Emori, and T](https://img.dokumen.tips/doc/110x75/5f8fb3fcf4b0684fc96bcefb/introduction-of-the-global-hydrological-simulation-system-introduction-of-the.jpg)