Embed Size (px)
Citation preview

A)
COLLOID NATURAL ANALOG STUDIES
AT
CIGAR LAKE
By
Peter Vilks, Jan Cramerand Don Bachinski
AECL ReseachWbiteshell Laboratories
Pinawa, Manitoba
YUCCA MOUNTAIN SITE CHARACTERIZATION PROJECTCOLLOID WORKSHOP
1993 MAY 03 - 05
K\1
. _ _ . _ = _ .
9311010116 931021WPDR WASTE.WM-1 I PDR 1)1

III
- - - LIIIHEMA'n'm .I I
III
-
I
I3_E
II
,. IM;
080
71
LSS
. (BL
- - , E''' - - -
, ....................... :'.'.:': , :,i:.:.:::::' :: :: .:.'
/_ _ _,",'' ':.':' . _ "
j :.': :.. : :: :.....::
I ::E. i, :,.',,' -'E ,',.
219 -45 m .. :--
-~~w:-''HME'
.lO.. .... m . .I
F10_-. . .- . . .
128 S
_ ;x 37X99* -
* .. ,> : >j ............;,, :, s ,. .. L . - ,,.,.., .:,
... . .. ... ..
..
Bleached IUnalteredSandstone I -Quartzcementedzone MClayzone *Orezone
( ( C

PARTCLE SIZE CLASSIFICATION
Diameter (m)
10-9
10I
104IT-7
10I I
o t410 0 12
I I I Inm
Molecules'rnr __-.
£ imC
Vol
mm
C o lo d n
VbUB~~~~~~~~~~~~~~~~ qa
Suspended parTcles
A.g- -wt -ri
( - -
CU
4m p 0 ril 4.m of.I
Ie c.I tf( 15
Sitze dt'sfist.;L~o f
- pcer k/k co. P*O&/ 'Y
-.ra di,,,., 4jP- ^esofr owi *o ftf J0/Os
dw 5e cAv c.t ev.nvceor of~rs At m^hf&st
of feefidt40,/ .
9 C 0% ce '00 &Ott
iramt,
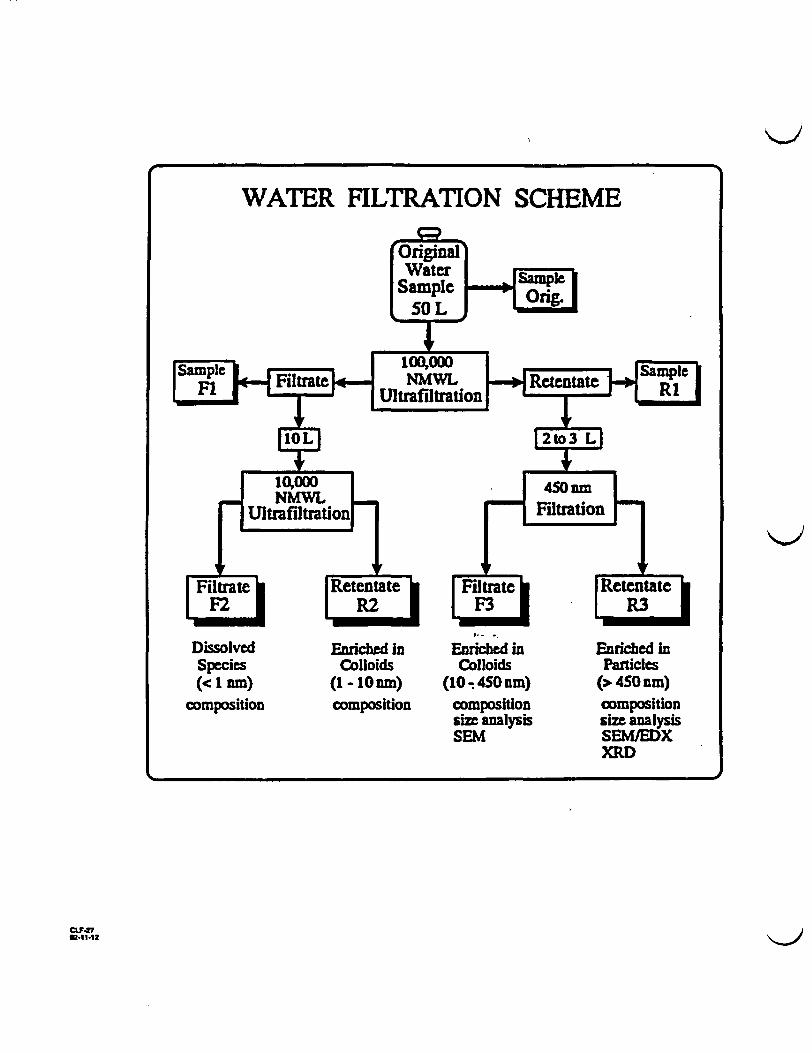
WATER FILTRATION SCHEME
DissolvedSpecies(c I am)
composition
Enriched in Enriched inColloids Colloids
(1 - lo am) (10 - 450 nm)composition composition
size analysisSEM
Enriched InParticles
(> 450 am)compositionsize analysisSEM/EXXRD
-wVrn-1Il.

F3
/O. - qS& nvv% > "O nw%
100 na
So no
lo noW
10Om At0
I "a now
0--
LiD ftf

M
0
I-zLu0
0C.)
ui-iw.
I-1cc
0L
PARTICLE SIZE DISTRIBUTIONSANDSTONES
1.5
1.0-J
E
0.5
0*- LA I I-A. -. qAVI.A 0 ) 0 0* I 0 0 0 0 °tA b- I I 0 0o O -b e
0 0 0 tA $-A 00 0 0 0 0
0 0 00 0
0
SIZE CLASS (nm)
( C

- MICROTRAQC -- ULTRAFINE PARTICLE ANALYZER -
Progression: standard Date:09/16/92Sample ID 1: 67 GRAB 21 Above Residual:Sample ID 2: 92-9-16 7:45 1368 L Below Residual:
Time: 08:080.000.00
100
90
CU
V0LU
E
80
70
60
50
40
30
20
1~~iI~F I i
Fi i i T I T I T -11I-TIITT I T IIT ' 1TI1TIITT14 : TIT TTTIITI111ITT1fitiEIlliuiituilluluIII - :1:..
50
45
40 DI
35 F
30 0
25 b20 E
15 z
10
510
ID,00
0
D NO) (0 0
0 0
0piI.0
0
0
0
"I 0* %D
M Im00a
0 0
to
00
I' n 1 of
Vo o 0 0
N
0
0
In
0
N
0
M )qiFl)0 V~0
. MICRONS

-0
Ez0
C:
0wUJC-QP
a:QL
PARTICLE SIZE FROM COUNTINGBOREHOLE 67
0.09
0.08
0.07
0.06
0.05
0.04
0.03
0.02
0.01
0
1000000
100000
10000
1000
100
10
-jE
LU
cn
CL
a:Q
10.45 0.95 5.5 10.5 15.5 20.5 25.5 30
PARTICLE SIZE (MICRONS)
C mg/L - countslmL
PARTICLE SURFACE AREA SIZE DISTRIBUTIONBOREHOLE 67
0.8 10000o--J
E
uJa:
UlC,)
cn
0.7
0.6
0.5
0.4
0.3
02
0.1
100000
10000
1000
100
-iEccuLJcn0~U-I
F=-QC.)
10
I00.45 0.95 5.5 10.5 15.5 20.5 25.5 30
PARTICLE SIZE (MICRONS)
0 SURFACE AREA - counts/mL

PARTICLE SIZE DISTRIBUTIONBOREHOLE 67
1 . .�J .a.
I IN-a
CD0
C)3uo-L
1=
a-
o.81
0.61
.Am m M . n I -pi
0.4
0.2
0
L-- i
%n
R
a!2
-
in0
CD
p- - -
"I
.CaC6
CRW-
CDI :CD
CR
C!
W-
CRCD. .
CoGo
p p-- -
C.
A
PARTICLE SIZE (MICRONS)
F GRAVIMETRIC E UPA 0 COUNTING

PIEZOMETER 139_2 20 1 susp. particlesC -
E 15 ~~~~~~~~~oi~~~~~L ~~ 2.02L 2/
O~~~~~ S
AO 10 _
m as 1.0LU
0-2
cm
20~ .
LU IJ
CO ~ ~ ~ ~ IC
0
CD cm~~~~~~~ 20 *~~~Cp Cm~oC- -~~~~~~~~~~t
SMPLE PFEOD

bUtEHOLE 671000000
100000I
r.
F~
10000
1000
100
10
1
1000000
100000
10000
1000
100
8--a. . . . . . � I . . . . .
0.45 0.65 0.85 15 3.5 S 7.5 9. 115 13.5 155 175 195PARTICLE SIZE
. GRAB 22 + GRAB 23 . GRAB 24
- GRAB 25 + GRAB 26 A GRAB 1
BOREHOLE 91.05
-I
g.J
Up
10
I I I I . I I I I I I I I I I I I I I I I
0.45 0.6S 0.85 15 3.5 55 7.5 9.S 11.5 13.5 15. 17.5 19PARTICLE SIZE (MICRONS)
-s- 48 L +0- 176LA RESTART PUMPING 190 L - 5S04 L

- 28 -
TABLE 3
AVERAGE PARTICLE CONCENTRATIONS IN CIGAR LAKE GROUNDVATERS (1986-1991)
Suspended SampledHole Particles Colloids Zone Depth Comment
(mg/L) (mg/L) (u)
75 0.63 ± 0.14 0.83 ± 0.26 154-159 upper sandstone71 1.76 ± 0.42 0.73 * 0.16 243-245 lover sandstone80 1.42 0.77 203-205 lover sandstone67 1.90 ± 0.21 1.33 ± 0.30 346-348 altered sandstone81 9.20 ± 2.48 1.77 * 0.63 438 altered sandstone *
211 1.89 ± 0.49 0.81 ± 0.17 416-418 altered sandstone91 4.92 ± 1.48 0.60 ± 0.09 407 clay zone **
134 0.61 0.94 415-417 clay zone197 0.64 ± 0.13 0.72 i 0.19 416421 ore/clay contact79 2.23 ± 0.67 0.78 * 0.15 432 ore
198 2.86 ± 0.98 1.52 ± 0.29 424-426 ore220 1.87 ± 0.41 1.44 ± 0.38 433-439 ore128 0.74 2.21 463-465 basement137 0.81 0.03 473-475 basement199 106 ± 2.3 7.78 ± 4.14 446-452 altered basement139 1.73 ± 0.60 0.65 ± 0.16 437 inflow south, ***219 0.83 ± 0.15 0.95 ± 0.15 414-426 outflow north ****83 1.27 ± 0.41 1.11 ± 0.36 18-477 artesian (uncased)
122 1.00 ± 0.19 1.37 ± 0.35 0-200 artesian (uncased)P3.12 1.75 ± 0.08 0.91 ± 0.24 4-7 overburdenP3.8 18.1 ± 1.4 .13.0 i 4.9 10-22 overburdenP3.7 20.5 ± 3.8 10.3 ± 2.7 10-23 overburden
* Located just above the unconformity, near the clay zone. Fromthe core log, the piezometer Is set in altered sandstone, near afracture. I-
** Based on hydrologic observationi,-this piezometer appears to beset near a major fracture zone.
*** Located just above the unconformity.**** Located just above the unconformity, beyond the quartz cap.
The error values are given for boreholes for which more than onesample vas taken, and are given by the standard deviation dividedby the square root of the number of data points.

PIEZOMETER 139INFLOW FROM SOUTH ABOVE UNCOMFORMITY
I
I'
Is :
4,
as:
0
OXIDE a°
PlEZOUETER 7rUPPER SANDSTONE
la
I 'I.
S.z I
"I'r I
i I
i 61
SII 4i
r, II
a
PIEZOUETER 21tOUTFLOW NORTH ABOVE UNCONFORMITY
ol.
is :t
OXIO ° 6 0"
OXIDE 0
PIEZOMETER 57ALTERED SANDSTONE
a. SEII 1e
2(
e
D
D
D
D I 11ii IOXIDE
-4;. a eOI0
OXIDE 0
PIEZOMETER 17,.. CLAYIORE CONTACT
8- M|
a
S6 o
40~ to
I
t
I- g
!
1!s
I 4
1; s
I
6-
. ;t
E 'S
'St
I- .
E -noSI
S. I
I aS S
Is
19 Om Kg
OXIDE °
PIEZOMETER 220ORE
PIEZOMETER 70ORE
I I~~
OXIDE °OXIDE °
lTO10nm *1lOTO45Onm ,4SOnm

S4
c
40a
DISSOLVED AND PARTICULATE URANIUM
_ PARTICULATE03 DISSOLVED
10.00
0.01 i,,, _ _ + a o ,, , c 3
DISSOLVED AND PARTICULATE RADIUM
-J
ma-
C4m~
10.000
1.0000
0.1000
0.0100
0.0010
0.0001
DISSOLVED AND PARTICULATE THORIUMI.- .
-J
0
0.7
0.6
0.5
0.4
0.3
0.2
0.1
a
SS CLAY ORE BASE. ARTESIAN
SAMPLE

URAN-UM AND RADIUMARE SORBED FROM GROUNDWATER
- ( 23U/238U )pankcuhate = 1.99 ± 036
(2UP/23SU )di=oWed = 1.93 + 0.15
(2UI/238U )ro = 0.8 to 1.0
2. ( 2 26Ra12 )panT )d ei 4 100
(2 26 R 2 30 Th )o2a < 2.5

IF IT IS ASSUMED THLAT ALL 'le
230Th ON PARTICLES HAS INGROWN
FROM 2U, THEN THE OLDEST AGE
OF ANY PARTICLE MAY BE 8000 a

SUMMARY OF FIELD DERIVED DISTRIBUTIONCOEFFCIENTS (Rd)
Cigar Lake Rd (mdg)
uranium 2 z 103 to 2 x 10⁷thorium 3 x 10³ to 9 x 10 5
radium 2 X 10³ t o I s 106
WRA Rd (ML g)
uranium 4 s 103 to 2 x 10thorium 3 x 10⁴ to 7 x 10Sradium 3 s 103 to 3 x 10
The wide range In Rd values in groundwatersfrom agiven formation suggests that Us Thand Ra associated with particlesi mn t be,.---In equilibrium bndwaer_ .1
.lm water.~-.
9--~~~~~~~~~~~
PA . : w
. s

Average a 0Ur a A I vr**A Conven ,,of
&roundMailer Pr. fe/les (,VI
L.otv, r
Ump 0, c $
.A. ! ft e cGSd
S. S. IV3 dp"14.
SS. 4 .
S' S I0 +
A le, t va A Mu-VI
s! /.Oer S,. )
if. I W-
Ow;l ! 'W'
am o- -- t ,@ 'f2
*~~~~~~~~~~~~ -. ,.A
I. ,
C /iV. .*. _ 7
, .- ..
: WI
c 1h7 /ore. --covni&.-C l#l'pf
Ore

,-' ,, CONCLUSIONS
- F RADIOCOLLOD N IS REVERSIBLE,THE NATURAL COLLOlD CONCENTRATIONS ATCIGAR LAKE WOULD RAVE A MINIMUM IMPACI' ONRn TRANSPORT
- HOW1VR S41 N Ol' SOME Rn IS NOTREVESIBR IT IS NECESSARY TOUNDERSTAND FARCLE KMIGRATION
PARTICLE TRANSPORT FROM THE ORE AND CLAYTO THE SURROUNDING SANDSTONE HAS BEEN.NEGLIGIBLE
)

l~rt lritl:i
MICROBIAL MOBILITY ID METAL UPTAKE PHENOMENA
J.H. Wolfram, INE.L.Representative to MSU
,. J.W. C t4tn, IVSU - ERC
rrsentation for the Colloid Conference
May 8-10, 1993 in Santa Fe, New Mexico* sar i ,,. r!; '!, 1xtj.

K>
i6:
4 Al&�M kq.IdJWVS-i --
ft - -
Figure 1. Microbial metabolism
A wide diversity of metabolic capabilities exists between species ofmicroorganisms. This figure also shows some of the extreme environ-mental conditions in which microorganisms can survive.

K)
Figure 2. Microbial capacity to leach metals from ores
This figure shows the metal content of the effluent stream from abiomining'operation. Specific species of microorganisms are usedcommercially to leach copper and uranium from ore deposits. Themajority of the solubilized metal content of this effluent is a resultof microbial metabolic activity on sulphide ore.
,

KJ
Figure 3. Biosorptions capacity of a microbial species
Microorganisms can also accumulate metal ions many fold above the liquidgradient in which they live. Some organisms have been shown to accumu-late uranium and other radionuclide Isotopes of metall-ic elements. Themetals then migrate with the organism.

''.i dl if Y * '..
Figure 4. Hetallothioneins
The biomolecules involved in biosorption are either polysaccharides orproteins. Hetallothionein proteins are unique in this regard and eachpeptide can bind 7-10 atoms of a variety of transition metals. Poly-saccharide molecules Have been shown to accumulate actinides.

. . A� .. . :11 . IL I . :,. . I -, , ". .,. - .. . ... %.. .. -.. . .. .. .:.. M --- .". . . -.. 4 -
Itie,
g .
I
Figure 5. Petri plate containing colonies oforganisms isolated from vadose zones 65 feetbelow the surface.
Similiar isolations have been seen from sampleshundreds of feet below the surface. Thisdemonstrates the subsurface is not sterile asonce thought.

K)
Idl. . 1' , . '"
Figure 6. Laboratory demonstration
The petroleum industry in their attempt to use secondary recoverymethods needed ways to plug thief zones and channels. Berea sandstonehas good porousity but traps and holds large quanities-of crude oil.

Figure 7. Lab' demonsttation (;ot;DWell nourished organisms plugged areas close to the well casing.Pressurization from the water injection system would overcome theshallow plugs and very little oil recovery would result.

K)
Figure 8. Lab demonstration (Cont.)
By starving organisms and forming ultramicro bacteria (UMB), theorganisms could be made to move great distances. Adding nutrientswould then allow the organisms to grow, multiply and execrete exopoly-meric substances which forms a plug in the channels sufficient toprevent flow.

,-, !f �,.. 4�i.r� -,; -.): IM *Rhj .. :.11 , . . . . . . .: 1 , .9I 0. VA�, --i
xU---
Figure 9. A sem photo of berea sandstone
Side A, berea sandstone without any microorganisms attached.Side BP crushed berea sandstone with a covering of microorganisms.The covering is extensive and completely covering the poresbetween the particles.

v)
Figure 10. Lab'r :6ry column containing glass beads
Glass beads we~rUsed to pack a column. The pore diameters averaged 26micron. The average diameter of a microorganism is 1 micron. Expecta-
tion was that mictqbes would quickly move through the pore-spaces andexist the column.

K)j
Figure 11. Subsequent time interval following Figure 10
Sequence of events on the glass beads shortly after the organisms wereintroduced to the column cells began to stick and form a biofilm on thesurfaces of the beads.

Figure 12. Subsequent time interval following Figure 11
The biofilm continued to develop covering the surfaces of the beads andspanning the pore spaces.

I,.)
Figure 13. Final SEH picture of the well developed biofilm
The actively growing cells, although small in size, on contact with asurface, demonstrate their ability to adhere and form an extensive bio-film at least on the initial surfaces. This prevents the movement oforganisms extensively through the matrix.

K)11 v)
a I
*.
I I
* *' .d
.
0~~~
. T
. ,. If
Figure 14. Microbial presence in ocean waters
Previous research has shown a vigorous microbial population exists inshallow waters both as planktonic (free) and sessile (attached) cells.However, at great depths, no cells could be found using microscopictechniques. If nutrients were supplied, bacterial growth would beobserved. This was an Initial observation that bacteria when starveddid not die but shrunk in size from 1.0 micron to 0.3 micron. Thissize is below the resolving power of the light microscope and thereforethe UMBs went undetected.

.I -i: le. ..j: ? .. ;. .. I - .
-
I~~ - ,
Figure 15. Nourished cells under going sizereduction
This special series of slides shows the bacteriaunder starvation conditions becoming UM~s. Thetime sequence is about 24-48 hours.

. Figure 16. UMB'Techno.ogy
The petroleum industrkrusing UNBs can pump them down the well. Thesmall UHBs will not stick to surfaces and move through the pores ofthe berea sandstone. Pulsing nutrients after the UHBs have traveled,will cause a revival to a full size bacterium followed by populationincreases and adsorption to surfaces causing a deep plug.

U.S. PATENT #4.8 59
JANUARY 31, 1989
MICROBIAL PROCEXOR SELECTIVELY PLUGGING A
SUBTERRANEAN FOR ATION.
INVENTORS: J.W. cERTONFRANCtENE CUSACKF.A. MA^,CLEODT.J. CYR.
.ASSIGNtrE: ' AOS
gure 17. This technique was' pa;,:ted'2UMB technology receive4*i vj.' patent in 1989.The
I

K-
* * JYBIOB RR- -
RIER
Figure 18. Another ,sdbteranean UMB technique
An advancing plume of metal/radionuclide ions or hazardous organicscould be detained by placing a biobarrier ahead of it. This couldprevent the harmful affects of the plume contaminants in reaching theaccessible environment.
?

COLLOID DISTRIBUTIONAT THE KOONGARRA
URANIUM DEPOSIT
Tim Payne
Australian Nuclear Scienceand Technology Organisation
--..
Yucca Mountain Colloid Workshop(May 3-5,-1993)

OUTLINE OF PRESENTATION
1. KOONGARRA SITE DESCRIPTION
2. ALLIGATOR RIVERS ANALOGUEPROJECT (ARAP)
3. GEOCHEMISTRY OF KOONGARRA
4. COLLOIDS
- sampling p- elemental content- mineralogy- radionuclide transport
5. SIGNIFICANCE OF COLLOIDS

- - -
I.
.4
* i*�
* 'I-,
* *a'* �.
A
I

THE ALLIGATOR RIVERSANALOGUE PROJECT (ARAP)
An international project sponsored bythe OECD/NEA. Participants inagreement:
ANSTO (Australia)JAERI (Japan)PNC (Japan)SKI (Sweden)UKDoE (U.K.)USNRC (U.S.A)
Work was carried out by theseorganisations, together withuniversities, national researchinstitutions, and other laboratories.
A series of 16 reports covering theproject (1987-1993) will soon beavailable.

THE BASIS OF THE KOONGARRAANALOGUE
* uranium transport started whenthe weathering front (which ismoving downwards) intersected theorebody
* the rate of downward movementof the weathering front is estimatedto be 15 - 30m / million years
* groundwater moving in theweathered zone has re-distributeduranium in the system
* a uranium "dispersion fan"extending for 200 m has developedover about 1.5 million years

THE KOONGARRA ANALOGUE
Cmoundwaterri o -
I U 4 U-
We"thezed Zone
^ I I a*u! sne
am, GD
SV=!A=
~ W-Mu=
PRnOMORE Z=c
Fault
A. PRIOR TO WEATHERING OFPRIMARY ORE
Crcndvate _ D DSPZ P5O0 q CrFow It F rAN
=OTxm=rpszs
Fault
B. PRESENT DAY

c C C
S :mW
i
URANIUM MARRALOGY
Im Utomo WHI P" S.W*O
Iku wylp Pfft g"ofe
-- * G&ewndw-leffe
ALTERATION
:. 0 =
Um"q fleft\( NqyVM *tg e~ t I- g~w,,q am. " M et*)
le o m .h oe u.
x \ gn .mI"." no ,,,llA " d I tt
Pi eUm usfp 1o hmm.a~
talun . A pBn
.... ;.;. ::.:.. \-
GEOLOGY
vft"M. owlRose of .mwoovmg~
M~UI POTROU"ole
LOW"" PNQT!ROOi
C tE Ot st-"lt . 16me i
H1 *.e wh~~oot
E *,ptws-en - eobden
Mac3 Owettarnems doWe
m tw emn iB.. ash
6 is
eA61he.

1000-.
100:
10
a EC I
zano __
' o? Za
a
- in
1:
a
C~~~C
C
: t:A< C_ , _~~~~
-.3
ED I¶'3 00 :OSO ~ 300 MO 400 JR)3
i ID~~~~~~~Chsanoe a)
Uranium concentrations in groundwater (pGRlj as a function ofdistance from KD1


MAIN CHARACTERISTICS OFPH49 GROUNDWATER:
. pH near neutral• low conductivity• Mg2+ is the dominant cation. HC0 3 is the main anion. elevated concentrations of U and
U-series radionuclides• low levels of TOC;::. slightly oxidising with respect to
U(V)I/U(VI). Si is present at significant levels

GROUNDWATER CHEMISTRY ATKOONGARRA AND YUCCA MOUNTAIN
___ KOONGARRA YUCCApH 6.5 - 7.4 6.7 - 7.7
Eh (mV) +100 - +300 +000 - +400(mmol/L)
Mg2+ 1.09 0.07Ca2 + 0.10 0.29K+ 0.02 0.14
Na+ 0.06. 1.96Si 0.32 1.07
HCO3- 2.52 2.34Cl 0.10 0.18F 0.01 0.11
Po 43 - 0.003:_ -
S042 0.021 0.19(meq/L)
X Cations 2.48 2.82X Anions 2.63 2.82
The range of pH and Eh are for typical samples.Other data are for Koongarra PH49 andYucca J-13 (from LA-1088-MS [1984]).Charge balance only includes major ions.

"l Fr
*.W Ct.,, 200j All
10,
-0 to 5.00 6.00 7.00 8.00pH
* depth >16m a depth <16m* creek a rmin
pAh cfiagram for Koongarra groundwater showing the fieldoccupied by shalow groundwaters.

OBJECTIVES OF KOONGARRACOLLOID STUDY
1. To sample colloids (< 1.0 jim)and particles in groundwater
2. Physical and chemical'am racterisation '
3. Determine size distribution ofradionuclides (p"rticularly Uand Th)
4. Evaluate significance of colloidsin radionuclide transport

Can results from Koongarra help us'to evaluate whether colloids willsignificantly increase radionucliderelease to the accessibleenvironment at Yucca Mountain?'
*. Have colloids played a significantrole at Koongarra;?
* To what extent are results- fromKoongarra transferable to YuccaMountain?
* Is Koongarra a worst casescenario?

MAJOR SAMPLING PROBLEMS
1. TRANSFORMATIONS OFSAMPLES
Strategy adopted:* In-field separation of colloids - no
time elapsed prior to-ultrafiltrationstep
* Closed system ultrafiltration withoxygen free atmosphere(N 2 / COO
* samples sealed from atmosphereuntil analysis
2. ACCURATE PARTICLE SIZECUT-OFF OF FILTERS
Strategy adopted:* selected Nuclepore filters with
well-defined pore size of 1.0 gmas upper size limit of colloids
* electron microscope examinationof filters subsequent to samplecollection

Hollow fibre ultrafiltration sytem
(10000 M.W.5pLm and
ultrafilter membrane1.0[tm pre-filters)
(1= mm
a"al
a"u
i:

Stirred cell ultrafiltration system
NITROGEN ATMOSPHERE BOX

C c C
!

JIP4 l V,
r -~~~~r
T v -;- S
1;@- '4.w e
tifBo; - . >:
po:.-@ ** - ~ * h.*

.
.1.I
I
01ol 0 - .Qw. 'f -;A.e. - ;W�
: via . '-%0-000 II.-k :L� -f
Iu V-
.1 vl

(
Ij , . tr
PARTITIONING OF CATIONS. IN IJ-FILTERED GROUNDWATER BETWEENCOLLOID CONCENTRATE (CC) LILTRAFILTRATE (UF) AND ULTRAFILTER
BXAC1FLUSH (BF)(Hollow Fibre Ulttfitltration Experiments)
'S;- -:n"
Hole Fraclon K Na Mg Ca Al Fe Mn Si
K02 UF (mg/I) 0.65 1.69 15.5 0.92 c0.02 1.14 0.037 12.5CC (mg" 0.63 1.63 %ti 0.70 0.02 1.06 0.027 9.8BF* - . (O.1o) 0.8% .
PH55 UF (mg/)l 1.07 , ,.58 17.1 1.28 <0.02 0.77 0.067 12.5CC (mgL) 1.11 , '1.62 18.2 1.38 0.02 0.80 0.070 12.6BF* , . . (0.05%) 0.5% .
PH14a UF (mgIL) 0.71 1.49 21.7 2.29 0.04 0.43 0.36 9.2CC (mg/I 0.74 1.44 22.2 2.38 <0.02 0.46 0.37 9.0BF* - . _ (0.15%) 1.4%
PH14b UF (mg/L) 0.65 1.36 19.8 1.50 0.02 0.14 0.20 9.5CC (mg/) 0.69 1.37 18.2 1.43 <0.02 0.13 0.17 9.0BF* . . (0.2%) 1.1% .
PH49 UF (mg9) 0.58 1.12 24 1.60 0.02 0.40 0.13 8.3CC (mg/I) 0.60 1.09 23 1.60 <0.02 0.46 0.13 8.0OF* - - - (0.4%) 1.1%O
C('
* Percentage of total found in ultrafilter backflush. In cases not assigned a numeric value,ultrafilter retention was below 0.03%. Data for Al in BF fraction are bracketed because theAl values were close to detection limits.

Figure 3.5.23. Uraniumconcentrate (bar = 0.2 um).
ok .*-....
particles (U(Fe)) from PH49 28-30 m colloid

Figure 3.5.19. Kaolinite-like particles (crystalline, Al, Si). a) PH96 colloidconcentrate (bar = 0.2 pm), b) PH49 < 28 m colloid concentrate (bar = 0.2 jlm).
iI_L I
I
i

Figure 3.5.20. Chlorite-like particle (Si, Al, Mg, (Fe)), PH49 28-30 m colloidconcentrate (bar = 0.5 gm).

tKaI
ask
9 B~~~~IKMe
i~~~j a KSK kw
c ' (~~~~~~~~~~~~~~~~c
FmTrxcJ CO ON L _ O
Ic rc lw : L aI C'oili c _ zl l

c C C
P"49 W P119WI m VA M2 PH;6 C9 M3 Ws PtJ96
k~Weathered zone
k kaoliniteokc . C chlorite
. # ~uh uranium50m u/s uranyl silicate
pb lead
DISTRIBUTION OF SOME COLLOIDS DETECTEDIN KOONGARRA GREOUNWATERS

C
PARTITIONING OF 238U AND "'Th IN I ,urn-FILTERED GROUNDWATER
(Hollow fibre ultrafiltration experiments)
C
Borehole Mu Th
UF (ppb) Colloid UF (mBq/L) Colloid
K132 0.079 1.8% <0.007PH55 0:40 2.5% 0.073 33%PH14(a)* 87'7' 1.4% 0.160 12%PH14(b)* 205 1.1% 0.062 27%PH49 178 1.4% 0.053 82%
* There were two colloid sampling experiments at PH14.

i M A d -Iw -
Ii~~~~~~~
.1
I
Comparison of U concentratidns and mineralabundances. Uranium concentrations (ppm) alongthe DDH 3 core are shown with a schematic repre-sentation of the relative abundances of chlorite,vermiculite, and kaolinite (and smeftt).
.
s. Huzakami, IL Isobe R.Edis,
Hiat Res Soc Symp Broc 212, 1991
i

C C
URANIUM ASSOCIATED WITH COLLOIDS
(Stirred Cell Experiments)
(
Hole Sampling Depth U. U. % of U on(m) ppb ppb Colloid
WI 23-25 m 0.24 61 0.4W4 13-15 m 2.6 470 0.5W4 23-25 m 1.0 300 0.3Ml 27-29 in 0.52 620 0.1PH49 18-20 m 0.60 110 0.5M2 42-44 m 0.12 46 0.3W5 23-25 m 0.21 3.0 6.5
U. - uranium on collolid.U. - uranium in ultrafiltrate.

If the b.f. includes adsorbedspecies then the calculatedcolloidal 238U and 230Th should beconsidered to be upper limits.
If this material is excluded from thecalculation, then:
colloidal 230Th is 5 - 35%colloidal 238U is 0.1 - 0.4%
Whilst these figures aresignificantly lower, the colloidal23 Th is significant and remainsgreater than is the case for 238U.

v
DISTRIBUTIONS OF 3U AND 23Th AMONGST COLLOIDS, PARTICLES (>1 tim)AND ULTRAFILTRATES
Ultrafiltrate Collold asas Percentage
Experiment Percentage of Total*of Total*
=au
PH14(a) 87.4 1.26-PH14(b) 70.2 0.76PH49 64.8 0.91
=0Th
PH14(a) 0.48 0.07PH14(b) 0.08 0.03PH49 0.007 0.032
l Tbe'total -includes ultrafirate and particles in allsize ranges,angs ......nWI
I

c
DISTRIBUTIONS OF 23U AND 2Th AMONGST COLLOIDS, PARTICLES (>1 lim)AND ULTRAFILTRATES
(Hollow Fibre Ultrafiltration Experiments)
C
Partilcles Particles Colloids Ultrafiltrate Ultraffitrale Colloid as>5 Jim 1-5 PM < Ji tm as Percentage
Experiment (mBq/L) (mBqCI4 (mBlq/) (mBw Percentage of Total. of Total*
PH14(a) 60.7 81.0 , 15.7 1090 87.4 1.26PH14(b) 547 507 27.5 2550 70.2 0.76PH49 722 452 31.0 2220. 64.8 0.91
"rh
PH14(a) 12.8 20.5 0.022 0.160 0.48 0.07PH14(b) 64.3 16.0 0.023 0.062 0.08 0.03PH49 445 348 0.250 0.053 0.007 0.032
* The total Includes ultrafiltrate and particles in all size ranges.

a) 238u
0.J
b) 230Th
CIj210
5Lm 1pn 10000 MW
filter pore size
unfifternd
50
40-
30 -
20 -
10
P.
I-- ..
ulftafitered
__~~~ / I
5Am 1p 100'M
fiter pore size
Effect of filtration on radionuclide levels in groundwater

Potrf"It MesS I. .JinjS
(Borekoltes l uarseort -6oJ7)
S s a 150 - 20oOnsLa
U
4 OOo0Mw

e 3 m h
A)
0
C-B
B)
01
0
C.)
5 2 2 Th1 64
2 3 8Th
a i Rn
72221.R22 a Ra
227t*. hi
, T.3h
,I-.. I Ii 'I
2hIs
| 2.1 |I
allSi-
tAn
. ,,_ .! _- U ________ -
4ltergy(MeV)
_ _
7
Thoriuma)b)
alpha-spectrum for PH14 samples retained by:1 pm Nuclepore filtercolloid filter

I.-
TEWORXL ALaPK& SPECTRUM
KOONGARRA CORE: SA;PE
iwTh
's V.Ii r Xt , X- -i .r t . .-K. ....~~~a
4
I
m -Th.A1 I
Lq..asTh
A_1 Thl
.- _ -.Aia
4I I_ U. *
-
5 '6
Energy (MNeV)

CONCLUSIONS
* Uranium migrates mostly asdissolved species
* Thorium and actinium are mostlyassociated with larger particles(> 1.0 gm)
* Only a small amount of colloidalmaterial is present
* Colloids reflect the mineralogy ofthe solid phase
* Colloids carry measurableamounts"d 6ThI 238U 227Ac, andFe
* In 1.0[im-filtered groundwater,5-82% of 230Th and 0.1-2.5% of231U are associated with colloids
* Colloidal transport is of greatestsignificance for Ac and Th
* Colloids are relatively unimportantin transporting radionuclides atKoongarra

Formation ana Physicc-chnemicafProperties of Radiocoaloids
David E. MorrisSpectroscopy and Biochemistry GroupLos Alamos National Laboratory
I-- .
Yucca Mountain SiteColloidMay 3
Santa Fe,
Characterization ProjectWorkshop.5, 1993
New Mexico

Operational Definition
* Radiocolloidsexclusively ofradionuclides
are composedhydrolyzed
-~ ~ .; ., -- V^
9.
* There is no sorbing substrateinvolved

RADIOCOLLOID FORMATION PROCESS
Hydrolysis:
M 4 + + 3H2 0 40 �-
mm4p- M(OH)3 + +3H+
Condensation:/OH
2+
.iH 2 02 M(OH)3+ -4 �--0-
Oligomerization: 4- ..
1sCOLLOIDS - n H 2 CI
Maii et at. Nuci. Tech. 84, 82 (1989)

Candidate RadionuclidesConsiderations:
1) Part of PA's inventory2) High charge/radius ratio for accessible
oxidation state3) Concentration in Inventory
I. Plutonium
II. Americium, Thorium,Protactinium
I I I . Uranium,Lead, Tin
Neptunium, Actinium,
IV. Radium, Nickel, Strontium

Philosophy forRadiocolloid Studies
Studies are comparable to otherradionuclide speciation studies
_ Howe _~dd t 3on h--~~~ - xe -
characterization a're d-* to assess tranfsport potential* to- understand and correlate
reactivity

I , -%, � -
S Oz. L I PICT I �- VA - ~~~~~~1-
I II \F-T hA C
I - I.71#rflQ
)"A oE ~tj C-6M E I -7 � e � -I - rz
I--.

Philosophy forRadiocolloid Studies
Chemical Properties
* Synthetic Conditions* Stoichiometry &
Molecular Structure* Trends in Reactivity
Physical Properties
* Particle Size* Particle Density* Bulk Particle Charge

FORMATION, CHARACTERIZATION, AND STABIITYOF PLUTONIUM(IV)-COLLOIDt
David E. Hobart, David E. Morris, and Phillip D. Palmer
Isotope and Nuclear Chemistry DivisionLos Alamos National Laboratory
Los Alamos, New Mexico 87545 USA
ABSTRACT
Several actinide elements are known to form colloids under environmental groundwaterconditions. It is imperative to study the physico-chemical properties of these colloids(particularly plutonium colloid) as pertains to high level nuclear waste isolation andstorage. In the event that a nuclear repository containing plutonium is breached by near-neutral pH groundwater, it is most likely that, as discussed in this report, the plutoniumwill form colloidal Pu(MV).
This report provides a thorough literature review (to June 1987) relevant to pertinentaspects of the chemistry and physics of Pu(IV)-colloid. In addition, the results of anumber of experimeta performed in our laboratories are presented which provide newdata to characerie further the physico-chemical properties of Pu(1V)-colloid. Thesenew experimental data include a detailed comparison of the electronic spectra (abSorptionand diffuse reflectance) of Pu(M1-colloid and numerous other Pu(MV) complexes. On thebasis of this spectral comparison, it is concluded that Pu(IV)-colloid is structurally verysimilar to finely divided crystulline PuO2 . -This is in agreement with conclusions drawnfrom other experimental rrnita Including X-ray and electron diffraction studies. Recentresults are also presented concerning the rqdox reactivity of Pu(IV)-colloid. It has beendetermined that the colloid can be reduced to aquated Pu(ffl) by either zinc amalgam orelectrochemically at a mercury electrode. The electrochemical reduction shows a strongpotential dependence with an abrupt increase in the rate of colloid reduction at - -1.0V v SCE. The colloid can also be oxidized electrochemically to PuOs+ at a platinuelectrode. In this cae, significant oxidation rates do not occur until - +1.4 V vs SCE.Finally, this report concludes with a brief summary of the proposed future direction of thePu(V)-coloid Investigation.
t Nevada Nuclear Waste Storage Investigation Interim Report No. R718
1

Some Pu(IV) ColloidFormation Reactions
* Dilution of acidic solutions of[Pu4+]aq[Ockenden and Welch J. Chem. Soc. 3350 (1956)]
* Precipitation of Pu(IV) hydrousoxide and peptization in diluteacid(CoeanZo et at. J. lnorg. Nuci. Chem. 35, 609 (1973)]
* Extraction of nitric acid fromPu(lV) solution with n-hexanol[Uoyd and Haire Radlochim. Acts 25, 139 (1978)1
* Auto-oxidation of Pu(IIl) stock indilute acid[Morris et al. YMIP Milestone Report M367]
K>

I
9 9 9

C
Drip tests done with spent fuel show surprising radionuclidedistribution patterns (compared to saturated tests) and alsoREE and actinide-bearing colloids.
(
DW Tests (of L) Saturaed Tests (oIL)
Filtered(50 nm)Unfiltered
Am-241Cm-244Cs-1 37pH
2E-44E-42E-44-6
4 T
I . ,1E-61E-6
Unfiltered
lE-10
2E-3. 8
0m

(a) Micrograph of agglomerated colloids from spentfuel leachate. The individual particles are around 50-100 nm in diameter and (b) SAED analysis suggestedthe phase was the uranium hydrate schoepite.

The compositional analysis: U, 0, Si, and REE
EELS was used to identify the REEs; La, Ce, Pr, Nd, and Sm In theschoepite colloid
bazan PEELSI JUVP..Un
Bank:rnllMemorg:Ia)b c d e I Y 2
cursor. 1020 Width: 0.48547 Counts: -17
2000,
Ce- M4,5
1hI I
-4 . ........
1500,Nd-M4,5
I'/non,
5001
La-M4,5
'L.L ..
Pr-M4,5
L I.. .....j Sm-M4,5
..
........ ..... .. . .. . .. .I. .
..... .................................................
nl L_ _ . .
_, . . __
y.... i.*5001 ....
rVr F, - r -
-_00o0................-- ---I..... - ------- 1-................ I-- --------.......... ............ ..... .. ...
900 900 1000 1190 1290 1BOB -goo -loon 1100 1 200 I

K>
As the waste form reacts, It strongly influences thedistribution of radionuclides to solution. It is possible toIdentify the colloidal species, the size distribution, and theradionuclide content.
* Primary colloids - form directly from glass and U02due to spallation of material from the glass, contain,concentration Pu/Am phases, remain suspended Insolution.
* Pseudocolloids - form as glass and spent fueldissolution products nucleate in solution (J-13 > DIW) -the distribution in solution depends on the ionicstrength of the leachate.

COLLOID FORMATION FROM SPENT FUEL DISSOLUTION
Walter J. GraySenior ScientistPacific Northwest Laboratory (PNL)Richland, Washington
.I
Yucca Mountain SiteColloid
Characterization ProjectWorkshop
May 3-5, 1993
Santa Fe, New Mexico

K)
INFORMATION SOURCES
* C. N. Wilson, Results from NNWSI Series 2 Bare Fuel Dissolution Tests,PNL-7169, 1990.
* C. N. Wilson, Results from NNWSI Series 3 Spent Fuel Dissolution Tests,PNL-7170, 1990.
MAJOR TEST DIFFERENCES
* Series 2 tests employed' fused silica vessels, 250C
* Series 3 tests employed stainless steel vessels, 25CC and 85°C
* Test results were similar at 25°C
* Generally lower releases and fewer colloids were observed at 850C

.FUSED SILICABASKET WITH BAIL
FIGURE 2.1. Series 2 Bare Fuel Test Configuration
2.2

Composition of J-1
Component
Ca
K
3 Well Water
Concentration (mg/L)
13
4.9
Mg
Na
2.0
44.
Si 30
Cl 6.7
F
NO3
so4I- .
f . .,. 2.3
9.0
19
126
1.8
HCO3
Organic Carbon
pH 8.4

SAMPLING SCHEDULE
* Periodically (every few weeks) collect water sample (10 to 30 mL)
* Filter and analyze
* Replenish water
* Approx. every 8 months Jroplace entire water volume and begin new cycle

K)l
239 + 240pU In Solution Samples
b0o2I 1,wCD
1000 60 100 160 200 0 50 100 160 200 0 60 100 160 200 0 50 100 150 200 0
Days60 100 150 200260
2807012.4
FIGURE32. Activities of 239+240Pu Measured in Solution Samples

K)
241Am In Solution Samples104 _ .
'aa
102
SO I 1 200 0 _________________ ~~~~~~~~~Cycle 6
0 60 t00 160 200 0 60 100 160 200 0 60 100 150 200 0 60 100 160 200 0 60 100 150 200 260Days aus0o0o2.2
IURE3.3. Activities of 241Am Measured in Solution Samples

2 "Cm In Solution Samples
mv 0.10g
Cycle 51 0-1 I I l _ __ _ __ _ _ _ _ l__ ___ l _ l0 60 100 160 200 0 60 100 150 200 0 60 100 150 200 0 60 100 150 200 0 50 100 150 200 250
Days ,,0,0,3,
FIGURE 3.4. Activities of 244Cm Measured in Solution Samples

K)
2371p In Solution Samples
2
1.8
1.6
1.4
1.2
w
co
r 1.0
0.8
0.6
0.4
0.2
0
INV-
0 60 100 160 200 0 60 100 160 200 0 60 100 160 200 0 60 100 160 200 0Days
60 100 150 200 260U8307012.9
FIGURE 3.5. Activities of 237Np Measured in Solution Samples

Annual Release Rates (including "colloids") at 250C in J-1 3 Wateras Fraction of: 1,000-Year Inventories
Actinide
U
Np
lop(Release Rate)
-8.6
% Colloids
-0
-0-8.8
Pu -9.0 20 to 60
Am -9.1 >90. T
I .,
Cm -8.0 >90
-
* Assumes water flow rate of 20 L/Yr per waste package containing 3140 kgof 33 MWd/kgM PWR fuel.
.-
a jV-DodA a 'I 4c0rrVJ5 G4rid-dior ,.S , Kkd in -kkr'''Dtn-c FAk , L
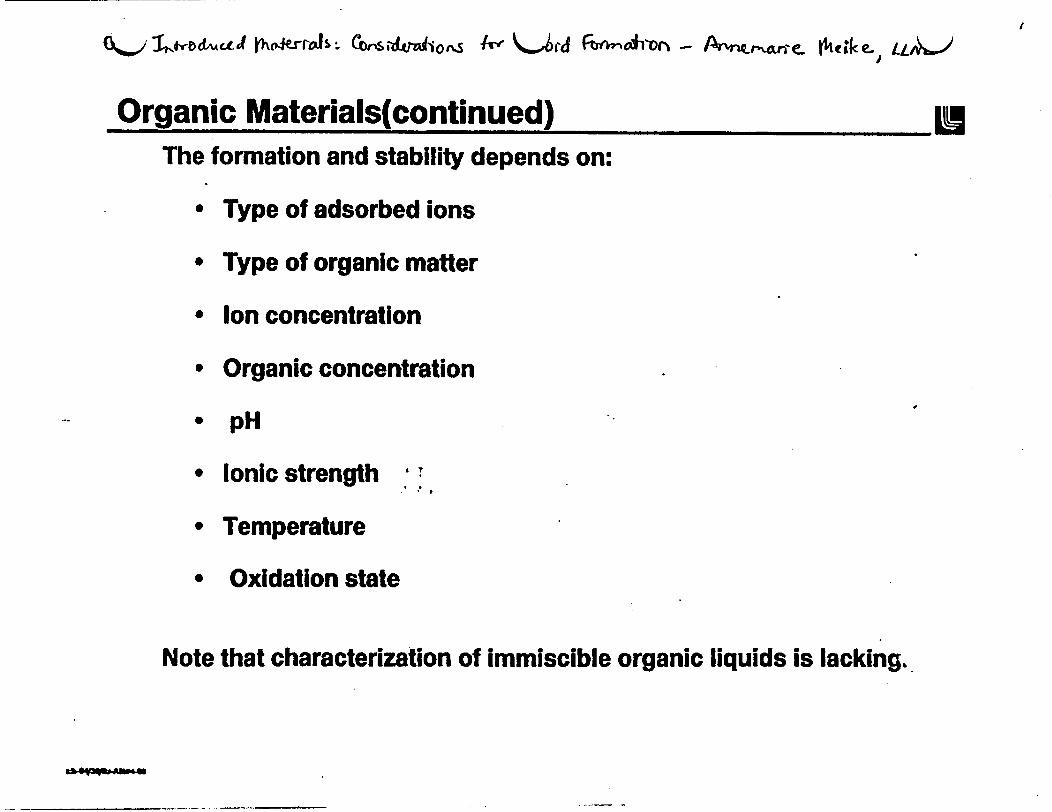
Organic Materials(continued) LiThe formation and stability depends on:
* Type of adsorbed ions
* Type of organic matter
* Ion concentration
* Organic concentration
. pH
* Ionic strength :
* Temperature
* Oxidation state
Note that characterization of immiscible organic liquids is lacking.

Are the consequences of Introduced Materials Significant?
CONSIDER:
* SCP DESIGN INCLUDES 560,000 m 3 of shotcrete in theemplacement drifts alone.
* ESF North Portal Facility estimated usage for FY 1993 includes:
- 6,o000,000 gal. water
- 250,000 gal. diesel fuel.1.
- 10,000 lbs. of rockbolt resin
- 180 ft.2 extruded polystyrene
- 50 yd.3 bentonite clay
- 250 gal. cable lubricant

v~~~~~~~~~~K
Organic MaterialsCOLLOID FORMATION:
* Degradation of greases, wood, other introduced organic matter
* Degradation of less soluble materials as a result of elevatedtemperature and chemical, microbial and/or radiolytic attack of:
- Plastics
- PVC
- Cellulose
- Rubber
- Polyethene

OxyhydroxidesSources are not only container materials, but also other introduced
materials such as stainless steel fixtures and rebar.Adsorption and transport effects are specific to the metal
and oxyhydroxide species.Potential aspects of introduced materials involvement.
* Fulvic acid and,Si concentration
* Elevated pH
* Reaction path
* Increasing adsorbate concentration
* Increasing ionic strengths
* S04 concentration
* Sorption of organic acids on goethite varies
wsqA4-U"
K)
Cementitious Materials 'Grouts, cements and shotcrete are sources ofcalcium silicate hydrate (CSH). colloidal gels:
* Known effects:
- Ash and silica fume can produce pseudocolloids at high pH
- Low concentrations of salts, aliphatic aromatics andsaccharides can influence transformation rate
* Unknowns:
- Cement additives (superplasticizers, curing compounds...)Presence of other ions
- Presence of organic material within or close to the cement- Aggregate and pozzolan chemistries- Effect of Eh gradient- Effect of pH gradient

Possible colloids derived from introduced materialsCOMPOSITION:
* Oxy(hydr)oxides
* Clays
* Organic particles
* Polysilicates
SIZE:
* Very small (< 10 rqm), eg. hydrated metal ions, small organicparticles, polyhydroxo-complexes, polysilicates, fulvic acids...
* Medium sized (10 -100 nm), eg. clays, metal-hydroxides
* Large (> 1pm), eg. inorganic and organic particles

K)
Examples of introduced materials that may affect adsorption and transport:
0
* Inorganic complexants (acid, batteries)
* Organic complexants and nutrients for microbes (e.g. alcohol,, antifreeze, bituminous materials, diesel fuel, diesel soot,I some gases, clothes, lubricants, plastic, wood...)
* Groundwater pH modifiers (acids, concrete, grout, lime, plaster...). ?
III

K>
Expected Gradients Caused by Intdduced Materials
* pH
* Ionic composition
* Eh
* C0 2 partial pressure,
* Temperature
* Radiation
* Bacterial activity!
i.e. The repository cannot be viewed as a homogeneous system
A_i" S

Waste Packages and the Cement IssueK)j
Lai_ .
4,A tO00E
_~~~~~~ 1Q0
_rj~~~~~~~~C
E
0 ~ ~ ~
, To far fieldand accessibleenvironment?
Time
Phase 2
10,000 yrsTime

Influences on formation, transport and stability ELCOLLOID CHARACTERISTICS:
* Physical size* Bulk charge* Density* Chemical reactivity* Chemical structure* Sorption potential
ENVIRONMENTAL CHARACTERISTICS: ,
* pH (cement)* Redox potential (cement, metal)* Ionic strength* Competing ions* Organic matter (peanut butter and jelly sandwiches)* Temperature* Microbial activity* Radiolysis
GRADIENTS in environmental chacteristics (space, time)

1 - 164 - j
* Colloid transport
* 'Adsorption mechanisms
* Formation of naturally occuring colloids
m 693- 1"w1

Goal of ioiaoid studies within theMan-made materials Task
Identify introduced material sources and their significancewith respect to:
* Colloid formation
* Adsorptive capacity modification
* Natural colloid enhancement
OBJECTIVE: Provide information for the development of policieswith regard to Introduced materials:
* Removal
* Minimized usage
* Special measures during emplacement and use

( ( CGoal of Man-made materials Task
DETERMINE THE CHEMICAL CONSEQUENCES OF INTRODUCEDMATERIALS IN THE POST-EMPLACEMENT ENVIRONMENTExamples
* WATER (drilling fluids, dust control, emplacement of cement)
* Insoluble metals (stainless steel): measurement devices,electrical accessories...
* Insoluble organic solids (neoprene, plastic): packer, rubber...
* Soluble inorganic solids (LiBr, LiCI, NaBr): tracers
* Inorganic liquid (water with tracers)
* Miscible organic liquids (ethylene-glycol): antifreeze,fluorescein dye.....
* Immiscible organic liquids (petroleum based oils): brake fluids,lubricants, oils, paints, grease, fuels...
* Organic gases: H 2, N 2, 02, CO, C02, C 2H 2

S
K)j
Other Introduced Materials:Considerations for Colloid Formation
M.a
I .
Annemarie MelkeTask Leader, Man-made Materials
Lawrence Livennore National Laboratory
May 3, 1993
_ i ~

K>
)IO *d hare I A & '4 - o7ma wonecessar 1 A b&umass 5
7eV Y'Ad AV ? I/Ai 0Ma7 looowo4d /? S
~~~~~~2.~~~~~~~~~1-1- %.-//
;.
* 7ho coors romaln sr>;n00r
uneons6 fAricv ?or
�*e.rd unkwo "Oovs*he 16*1 P