Embed Size (px)
DESCRIPTION
A Closer look at Computer Adaptive Tests (CAT) and Curriculum-Based Measurement ( CBM) — M aking RTI progress monitoring more manageable and effective. - PowerPoint PPT Presentation
Citation preview

Dr. Edward S. Shapiro, Director, Center for Promoting Research to PracticeLehigh UniversityBethlehem, PA
CESA #4 and Renaissance LearningWest Salem, WI, December 5, 2012
A Closer look at Computer Adaptive Tests (CAT) and Curriculum-Based Measurement (CBM)—Making RTI progress monitoring more manageable and effective.

Why is Lehigh known?

Why Lehigh is Known?

Big Picture and Key Points RTI Self-Assessment at School Level RTI and Assessment Components
Universal Screening Progress Monitoring
RTI and Curriculum-Based Measurement (CBM)
RTI and Computer Adaptive Testing (CAT)
Some case examples from CAT
RTI Self-Assessment
Complete self-assessment at school level
Report out group readiness Next steps to implementation?

RTI Represents Systems Change RTI aligns with the school
improvement process
RTI is: A dramatic redesign of general and
special education A comprehensive service delivery
system that requires significant changes in how a school serves all students
NASDE, 2006
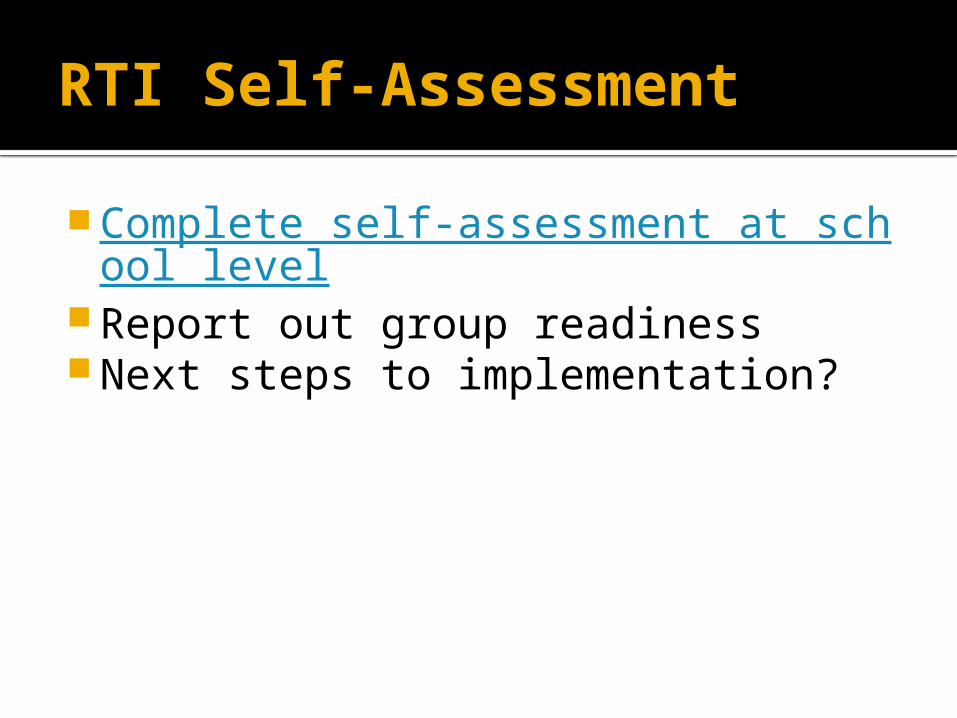
Wisconsin Vision of RTI

National Perspective• 1,390 respondents (K-12 administrators) to
survey (margin of error 3-4% AT 95% confidence interval)
• 94% of districts are in some stage of implementing RTI – up from 60% in 2008 and 44% in 2007
• Only 24% of districts reached full implementation• Primary implementation is elementary level with
reading leading the way
www.spectrumk12.com

Two Key Assessment Processes in RTI Universal Screening
Progress Monitoring
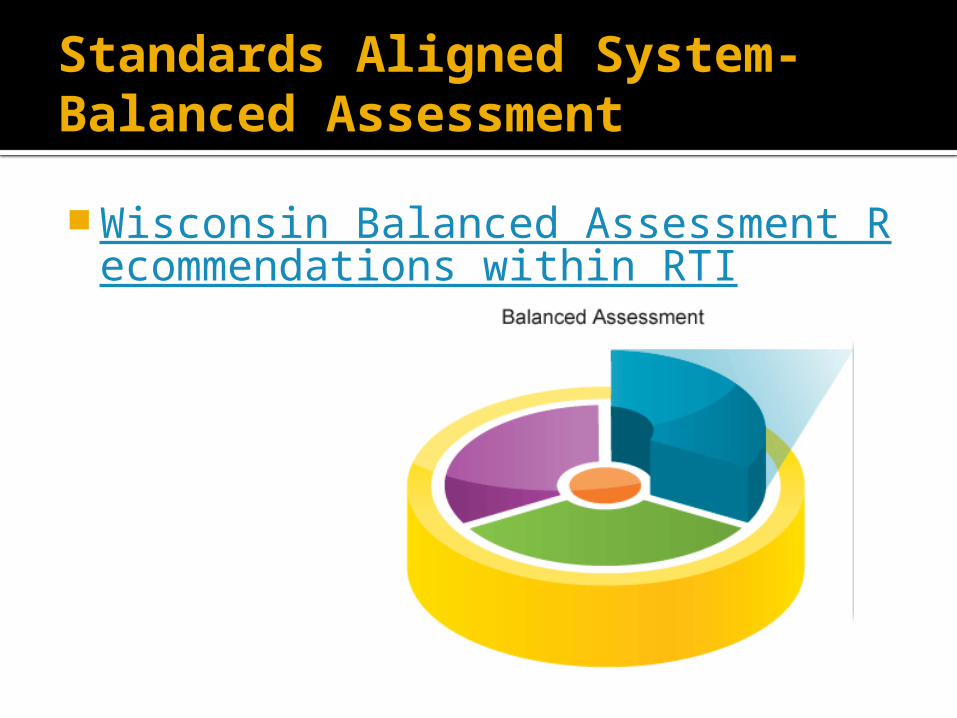
Standards Aligned System-Balanced Assessment Wisconsin Balanced Assessment Rec
ommendations within RTI

20
Formative Assessment
A planned process
Used to adjust ongoing teaching and learning to improve students’ achievement of intended instructional outcomes
Classroom-based Formal and Informal Measures
Diagnostic - Ascertains, prior to and during instruction, each student’s strengths, weaknesses, knowledge, and skills to inform instruction.

21
Benchmark Assessment
Provides feedback to both the teacher and the student about how the student is progressing towards demonstrating proficiency on grade level standards.

22
Summative Assessment
Seeks to make an overall judgment of progress made at the end of a defined period of instruction.
Often used for grading, accountability, and/or research/evaluation
Universal Screening Process- A Benchmark Assessment ProcessWhat is Universal Screening?
▪ Administered to all students at all levels, K-12
▪ Universal screening is a process that includes assessments, but also includes record review and historical information
▪ Brief measure▪ Its use is primarily to determine who might be at-risk
▪ Some screeners can do more

Reviewing the data
Universal screening data are typically collected in the fall, winter, and spring.
Key questions Identify how the group is doing as a
whole Determine who is individually in need of
intervention beyond core instruction Some screeners can give us info
about how to focus instruction

Potential Choices of Measures National RTI Center Tools Chart Two types of measures
Curriculum-Based Measurement▪ Benchmark, Summative
Computer Adaptive Tests▪ Benchmark, Formative, Summative

CBM and Assessment
CBM designed as INDEX of overall outcomes of academic skills in domain
CBM is a General Outcomes Measure Tells you HOW student is doing
OVERALL, not specifically what skills they have and don’t have (not formative or diagnostic)
McDonald’s- How Do We Know They Are Doing Well as a Company
General Outcomes Measure of company’s success
What is the one item that tells the CEO and stock holders how they are doing?


• The medical profession measures height, weight, temperature, and/or blood pressure.
• Companies report earnings per share.
• Wall Street measures the Dow-Jones Industrial Average.
• General Outcomes approach for reading
measures Oral Reading Fluency
General Outcomes Measures- Examples

Characteristics of CBM
Standardized format for presentation Material chosen is controlled for grade
level difficulty Material presented as brief, timed probes Rate of performance used as metric Results provide index of student progress
in instructional materials over time Indexes growth toward long-term
objectives Measures are not designed to be
formative or diagnostic
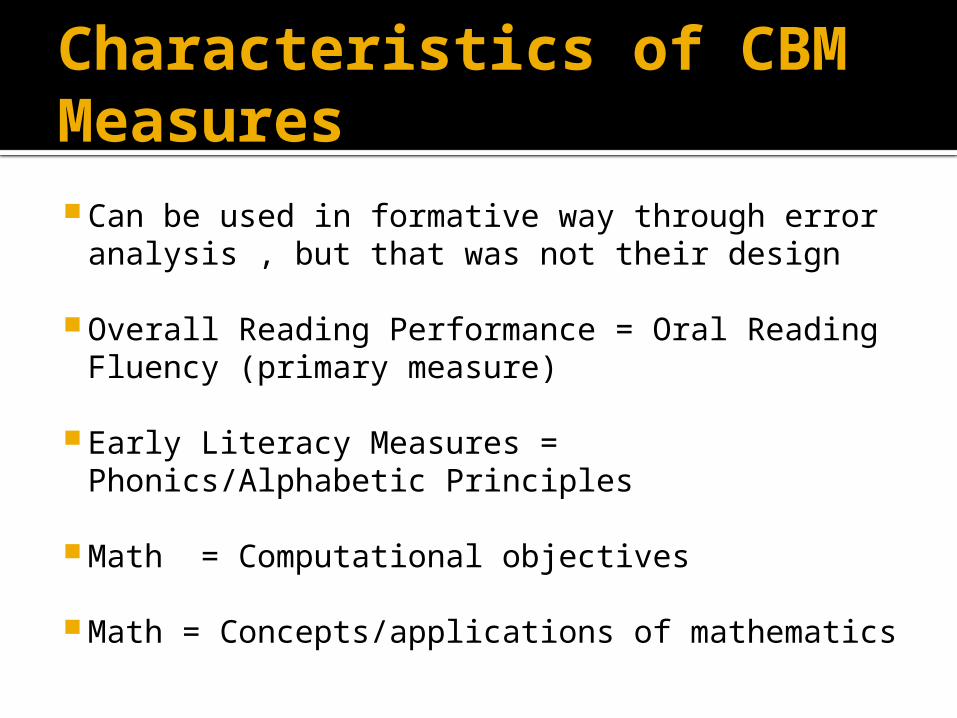
Characteristics of CBM Measures Can be used in formative way through error
analysis , but that was not their design
Overall Reading Performance = Oral Reading Fluency (primary measure)
Early Literacy Measures = Phonics/Alphabetic Principles
Math = Computational objectives
Math = Concepts/applications of mathematics

CBM and Reading Assessment Measures Early Literacy
Phoneme Segmentation Fluency Initial Sound Fluency Nonsense Word Fluency Letter Identification Fluency
Reading Oral Reading Fluency Maze Retell Fluency
AIMSweb as example

Types of CBM Math Assessment M-COMP = Computation Skills
Assesses many skills across the grade Samples the skills expected to be
acquired Grade-based assessment Reflects performance across time
M-CAP = Concepts/Applications Skills

Example of MCOMP & MCAP Measures Grade 3 MCOMP Example
Grade 5 MCOMP Example
Example of MCAP – Grade 3
Example of MCAP – Grade 5

AIMSweb – MCOMP Domains Assessed

AIMSweb- MCAP Domains Assessed

Time Limits MCOMP- Group Administered
Grade Time (min)
All Grades 8 min
Reading Measures-
Time
R-CBM- Individually Administered
1 min each X 3
Maze- Individual or Group Administered
1 min each X 3
Retell Fluency- Individually Administered
1 min each X 3
MCAP-Group Administered
Grade Time (min)
2 -6 8 min
7-8 10 min
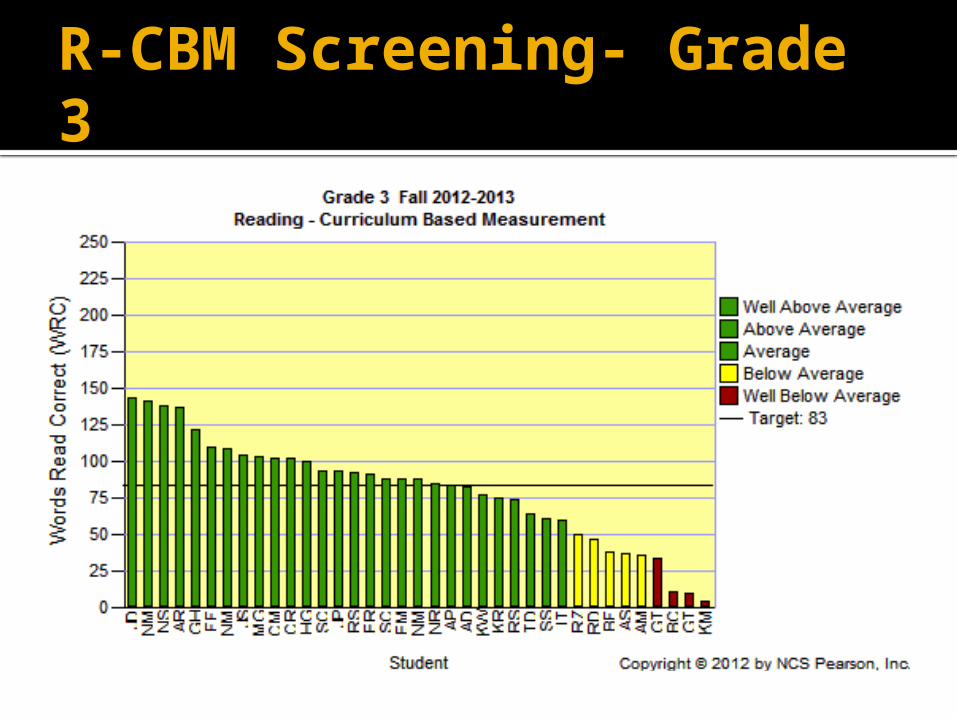
R-CBM Screening- Grade 3

R-CBM Screening
Instructional Recommendations Link to Lexile Level and Instructional
Level Book Recommendations (Gr 3, Lawnton-Scores & Percentiles)
Prediction to state test also available Links to Common Core also reported

Data Outcomes and Interpretation At each grade, one identifies the
distribution of students at each level of risk, as defined by the user
Data used by data team to identify students in need of supplemental instruction
Data reflects change in GROUPS over time

Exercise 1 for Groups
Show data for school- Use RCBM Have groups interpret the outcomes Use data from CD as example Extract grade 2 and 3 data, Winter
only. Have the groups identify goals for winter.
Then show the Winter to spring data and have groups draw conclusions about the data.
Keys to Interpretation of CBM Data Change over time interpreted
differently for reading and math Change from end of one year to start
of next (summer decline?) Implications for instruction?

AIMSweb RCBM Across Time
0
20
40
60
80
100
120
140
160
25th50th75th
Wor
ds C
orre
ct P
er m
in

MCOMP Across Grades, Time by Percentiles
0
10
20
30
40
50
60
70
MCOMP Across Grade and Time by Percentiles
25th50th75th
Tota
l Poi
nts

MCAP Across Grades and Time by Percentiles
0
5
10
15
20
25
30
35
MCAP Across Grade and Time by Percentiles
25th50th75th
Tota
l Poi
nts

Some Key Elements of Interpreting AIMSweb CBM Within and across grade growth is evident for reading
(RCBM) but not math Across grade growth in reading shows step wise
improvements, after “summer decline” In math, within year change over the year can be very
small Across grade growth in math not possible to determine
from math CBM, i.e., each grade is not necessarily higher scoring than the previous grade
Interpretation within grade rather than across grade is stronger
Why? Due to nature of within grade measures- Math measures are more specific skills probes than general outcome measures
Computer Adaptive Tests

What are Computer Adaptive Tests? Based on IRT (Item Response Theory)
method of test construction Adjusts items administered based on
student responses and difficult of items Tests have huge item banks Items are not timed, based on accuracy
of response Careful calibration, pinpoints skills
acquired and in need of teaching in a skill sequence

CAT Methods and Measures Computer administered entirely Between 15-25 minutes per
administration Skills focused within domains Not all students take same items,
depends on which items are answered correctly and incorrectly
Scaled Score is the KEY metric

CAT Methods and Measures Provides a student’s relative standing to
peers in on a national distribution Provides student’s goals for growth Provides indication of group’s performance
(grade, school, district) relative to what is expected nationally
Example for today- STAR Assessment (Enterprise) from Renaissance Learning
Other similar metrics exist, see NCRTI charts Study Island, SRI, MAP

STAR Assessments
STAR Early Literacy (pre-K - 3)
STAR Reading (Gr 1 – 12)
STAR Math (Gr 1 – 12)

STAR Scaled Score - Critical Metric that places student on a
distribution from K through grade 12 Weight analogy STAR Scaled Score
Early Literacy (PreK – 3) 300 – 900 Reading (K-12) – 0 to 1400 Math (1 – 12) – 0 to 1400
Note important difference in interpretation to CBM (AIMSweb) measures across grades and time

STAR Reading Scaled Scores

STAR Reading Scaled Score Across Time and Grades
Gr 1-Fall Gr 1 Winter Gr 1 Spring Gr 2 Fall Gr 2 Winter Gr 2 Spring Gr 3 Fall Gr 3 Winter Gr 3 Spring0
100
200
300
400
500
600
700
25th40th75th

AIMSweb RCBM Across Time
Gr 1 Fa
ll
GR 1 - W
inter
Gr 1- S
pring
Gr 2 Fa
ll
Gr 2 W
inter
Gr 2 Sp
ring
Gr 3 Fa
ll
Gr 3 W
inter
Gr 3 Sp
ring
0
20
40
60
80
100
120
140
160
25th50th75th
Wor
ds C
orre
ct P
er m
in

STAR Math Scaled Score

STAR Math Scaled Score Across Time and Grades
Gr 1-Fall Gr 1 WinterGr 1 Spring Gr 2 Fall Gr 2 WinterGr 2 Spring Gr 3 Fall Gr 3 WinterGr 3 Spring0
100
200
300
400
500
600
700
25th40th75th
Scal
ed S
core

MCOMP Across Grades, Time by Percentiles
0
10
20
30
40
50
60
70
MCOMP Across Grade and Time by Percentiles
25th50th75th
Tota
l Poi
nts

MCAP Across Grades and Time by Percentiles
0
5
10
15
20
25
30
35
MCAP Across Grade and Time by Percentiles
25th50th75th
Tota
l Poi
nts

STAR Math- Universal Screening Show Use of STAR as Universal
Screening in Math Exercise #2 Use Lehighton Data as example
across the yearHave audience draw conclusions from the data
Gr 2 – 3 data fall, draw conclusions about outcomes

STAR Math – Grade 2
STAR Math Fall Screening Report
STAR Math Winter Screening Report
PROGRESS MONITORING

Progress Monitoring Using CBM AIMSweb Students in need of tiered instruction are
monitored on frequent basis Frequency of monitoring can vary but once
every two weeks is recommended at minimum
Monitor student toward grade level goals Reading
R-CBM (Oral Reading Fluency) – after mid year grade 1
Math M-COMP & M-CAP (starting second grade)
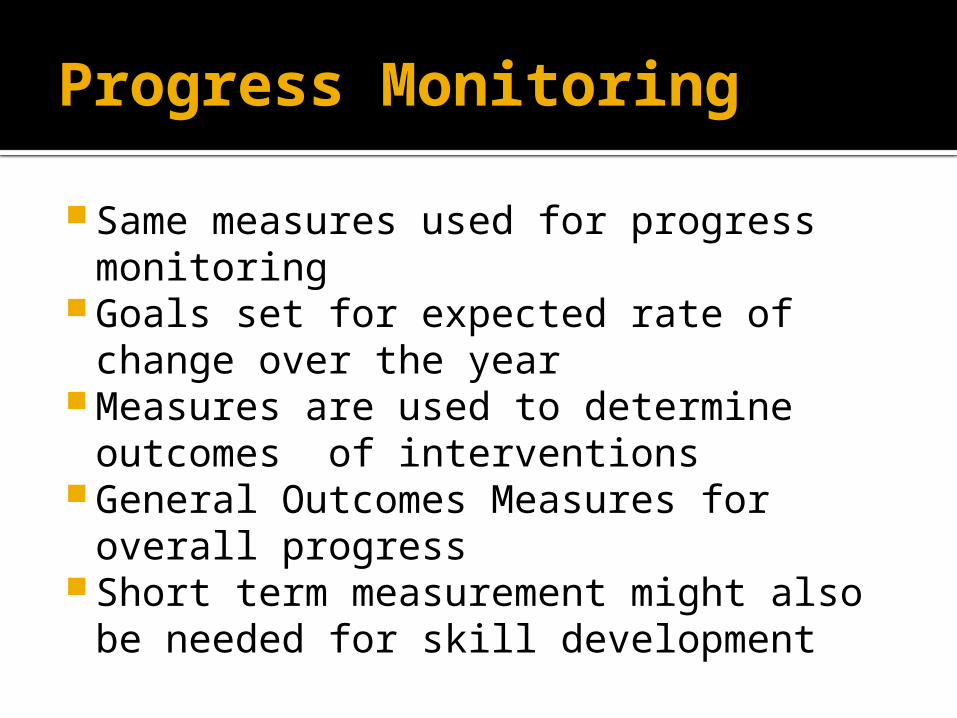
Progress Monitoring
Same measures used for progress monitoring
Goals set for expected rate of change over the year
Measures are used to determine outcomes of interventions
General Outcomes Measures for overall progress
Short term measurement might also be needed for skill development

Standard Error – Interpreting Trend All measures have error Change in performance over time must be
interpreted by considering error If change from one point to next is within error, no
big deal If change from one point to next is larger than error,
need to check whether change is “real” or “accidental” Easier or harder passage than one before Student was physically ill Student just clicked away on the computer
CBM ORF SEM = 10 wcpm (range 5-15) Christ, T. J.; Silberglitt, B., (2007) School Psychology Review, 36(1), 130-146.

Grade 2= Real or Error?SEM = 10
14-Sep21-
Sep28-
Sep5-Oct12-
Oct19-
Oct26-
Oct2-N
ov9-N
ov16-
Nov23-
Nov30-
Nov7-D
ec14-
Dec21-
Dec28-
Dec4-J
an11-
Jan18-
Jan25-
Jan1-Feb8-F
eb15-
Feb22-
Feb29-
Feb7-Mar14-
Mar21-
Mar28-
Mar4-A
pr11-
Apr
18-Ap
r25-
Apr2-M
ay9-M
ay16-
May0
20
40
60
80
100
120
46
72
90
7165
6963
83
66
85 85
97
66
55
8581
76f(x) = 0.0855241033015203 x − 3427.92063363214
ROI = .60 wcpm/week
Goal = 98 (25th %tile)
Initial Data = 46 (<10th %tile)
Aim Line = 1.86 wcpm/week(98-46/28 weeks)

Grade 2= RCBM PM Example
14-Sep21-
Sep28-
Sep5-Oct12-
Oct19-
Oct26-
Oct2-N
ov9-N
ov16-
Nov23-
Nov30-
Nov7-D
ec14-
Dec21-
Dec28-
Dec4-J
an11-
Jan18-
Jan25-
Jan1-Feb8-F
eb15-
Feb22-
Feb29-
Feb7-Mar14-
Mar21-
Mar28-
Mar4-A
pr11-
Apr
18-Ap
r25-
Apr2-M
ay9-M
ay16-
May0
20
40
60
80
100
120
46
72
90
7165
6963
83
66
85 85
97
66
55
8581
76f(x) = 0.0855241033015203 x − 3427.92063363214
ROI = .60 wcpm/week
Goal = 98 (25th %tile)
Initial Data = 46 (<10th %tile)
Aim Line = 1.86 wcpm/week(98-46/28 weeks)

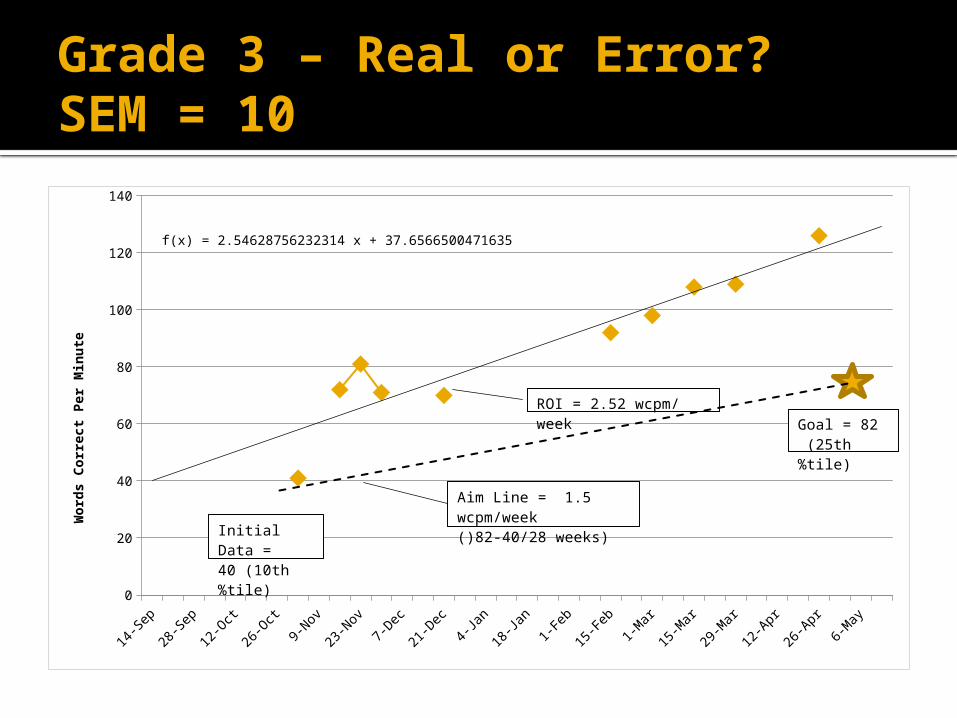
Grade 3 – Real or Error?SEM = 10
14-Se
p22-
Sep30-
Sep8-O
ct16-
Oct24-
Oct1-N
ov9-N
ov17-
Nov25-
Nov3-D
ec11-
Dec19-
Dec27-
Dec4-J
an12-
Jan20-
Jan28-
Jan5-Feb13-
Feb21-
Feb29-
Feb8-Mar16-
Mar24-
Mar1-A
pr9-A
pr17-
Apr25-
Apr3-M
ay
11-May
19-May
0
20
40
60
80
100
120
140
f(x) = 0.361193584685674 x − 14696.3116308076
Wor
ds C
orre
ct P
er M
inut
e
ROI = 2.52 wcpm/week Goal = 82
(25th %tile)
Aim Line = 1.5 wcpm/week()82-40/28 weeks)Initial Data
= 40 (10th %tile)

Important New Findings about CBM Reading and Progress Monitoring (Christ et al., in press, J. of School Psychology) Use of Ordinary Least Squares (OLS)
regression is only valid trend estimator Number of weeks of monitoring is key and
best predictor of outcomes Recommendation is 10-14 weeks with good
passage set Increasing density of data collection (i.e.,
more in shorter amount of time) does not improve prediction)
Need to use more data per assessment (i.e., 3 passages use median) over single passage

General Strengths of CBM for PM Measures are generally short and efficient (1
minute for Reading individually administered, 8 minutes for math that can be group administered)
Reading is General Outcome Measure, cuts across reading skills, strong correlations to state assessments
Math measures of both computation and concepts offer rich array of assessments across domains of skills
Measures remain sensitive to growth within grades across the year

General Weaknesses of CBM Measures for RTI Measures are not designed to be formative
(diagnostic) but some math measures can be (Yearly Progress Pro)
Additional assessment needed for purposes of formative assessment and instructional linkages
Math measures do not always show same growth patterns across grades
Math measures cannot be easily used across grades
Links to state and common core standards are not always clear, measures are designed to be broad growth indicators not specific skills assessments

STAR Math- Progress Monitoring Same measure can be used as
progress monitoring device Frequency can be as often as once
per week Standard Score measure is reflected
in data

Sample PM from STAR MathSEM = 30, Grade 3
STAR M
ath Scal
ed Sco
re
Grade: 3 ID: 55073
Class: Ms. Wassmer's Class Teacher: Wassmer, J.
700
650
600
550
500
450
Jul-11 Sep-11 Nov-11 Jan-12 Mar-12 May-12 Jul-12
Test score Trend line Goal line Goal Intervention change
Angelina's Current Goal
Goal: 616 SS 54 PR (Moderate) Goal End Date: 6/2/2012 Expected Growth Rate: 3.4 SS/Week

STAR Math: Is it Real of Error?SEM = 30, Grade 3
STAR M
ath Scal
ed Sco
re
Grade: 3 ID: 55073
Class: Ms. Wassmer's Class Teacher: Wassmer, J.
700
650
600
550
500
450
Jul-11 Sep-11 Nov-11 Jan-12 Mar-12 May-12 Jul-12
Test score Trend line Goal line Goal Intervention change
Angelina's Current Goal
Goal: 616 SS 54 PR (Moderate) Goal End Date: 6/2/2012 Expected Growth Rate: 3.4 SS/Week
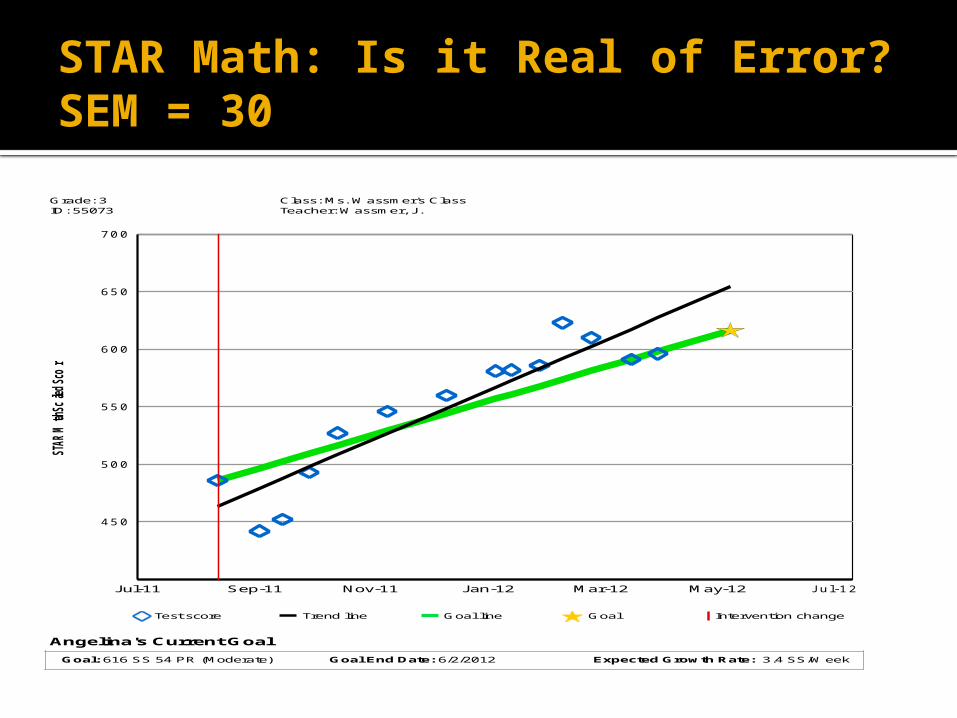
STAR Math: Is it Real of Error?SEM = 30
STAR M
ath Scal
ed Sco
re
Grade: 3 ID: NHorn
Class: Mr. Snyder's Class Teacher: Snyder, K.
700
650
600
550
500
450
Jul-11 Sep-11 Nov-11 Jan-12 Mar-12 May-12 Jul-12
Test score Trend line Goal line Goal Intervention change
Natalie's Current Goal
Goal: 503 SS 25 PR (Moderate)

Added Elements of CAT- Instructional Links All CAT measures offer instructional
links Tied to skill sequences and
development Can be used to assist teachers in
identifying instructional targets Example report from STAR Reading
(Enterprise) Example reports from STAR Math Learning Progressions

Examples
Diagnostic Report – STAR Ex Instructional Planning Report- Emily Progress Monitoring Report- Emily Annual Report Emily
Growth and CAT
Question of growth is critical How much did the student grow this
year? How was the growth made by the
student compared to other students who started at the same point as this student?
Student Growth Percentiles Innovative metric Tells you whether the GROWTH made by
the student was as much, more, or less than expected
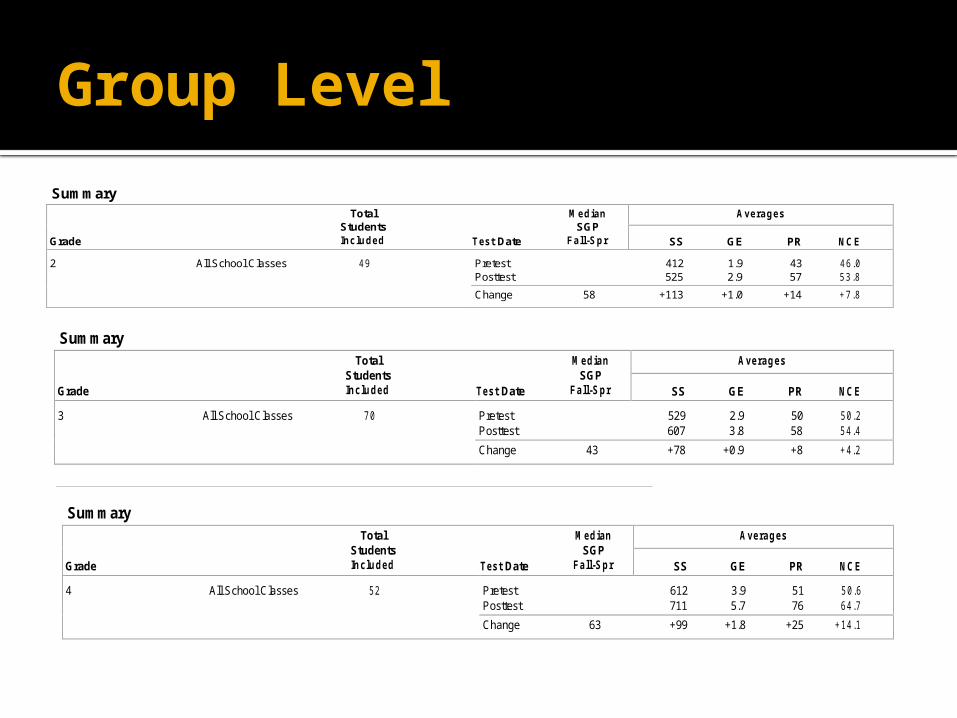
Group LevelSummary
Total Median Students SGP
Grade Included Test Date Fall-Spr
Averages
SS GE PR NCE
2 All School Classes 49
Pretest 412 1.9 43 46 .0 Posttest 525 2.9 57 53 .8 Change 58 +113 +1.0 +14 +7 .8
Summary
Total Median Students SGP
Grade Included Test Date Fall-Spr
Averages
SS GE PR NCE
3 All School Classes 70
Pretest 529 2.9 50 50 .2 Posttest 607 3.8 58 54 .4 Change 43 +78 +0.9 +8 +4 .2
Summary
Total Median Students SGP
Grade Included Test Date Fall-Spr
Averages
SS GE PR NCE
4 All School Classes 5 2
Pretest 612 3.9 51 50 .6 Posttest 711 5.7 76 64 .7 Change 63 +99 +1.8 +25 +14 .1
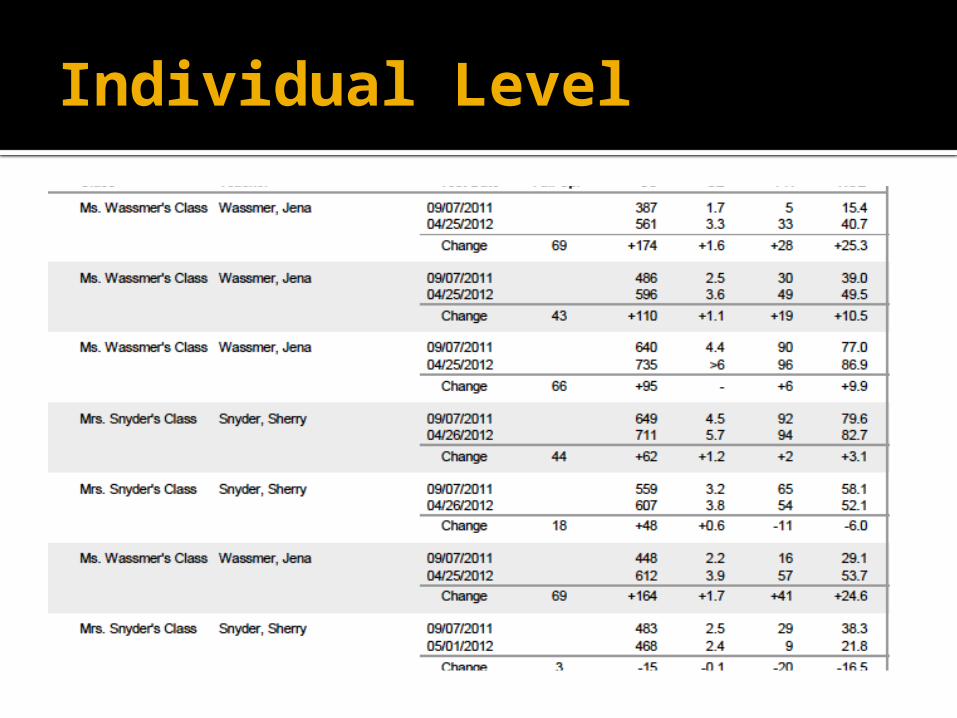
Individual Level

Case Example- Putting it Together Using CAT Grade 3 Screening Report Two Students - All receive
intervention TB (On Watch) MR (Needs Intervention)

Case #1 - TB
TB – Diagnostic Report Note the inclusion of scores directing you to specific
levels and texts for reading TB – Instructional Planning Report TB – Progress Monitoring Report TB – PSSA Estimate TB – Common Core Estimate TB – Core Progress Learning Progression
Author’s Craft- Grade 3 (demo from logged in RL website)

Case #2 - MH
MR – Instructional Planning Report MR – Progress Monitoring Report MR – PSSA Estimate MR – Common Core Estimate MR – Core Progress Learning
Progression Author’s Craft- Grade 3 (demo from
logged in RL website)

General Strengths of STAR for PM Measures are efficient since they are administered by
computer (15-20 minutes) and can be given to large groups at the same time
Reading & Math serve as General Outcome Measures (looking at scaled scores and movement toward goals)
Reading & Math serve as indicators of instructional foci with direct links to skills in need of instruction
Reading & Math measures assess the domains consistent with common core and state standards, with strong correlations to state assessments
Reading & Math measures remain sensitive to growth within AND across grades across the year

General Weaknesses of STAR for PM Measures for RTI Measures can show more bounce in the
data due to students not being carefully monitored in their taking of the tests on computers (pay attention to SEM rules)
Measures are not direct measures of fluency Measures may be somewhat limited in
sensitivity to small increments of growth over short periods of time (i.e. 4-6 weeks)
Use of STAR (or any CAT) requires full understanding of the nature of CAT

Summary & Conclusions
CBM and CAT are both options for universal screening and progress monitoring
Both measures provide summative and benchmark objectives
CBM not designed for formative analysis CAT adds dimensions of formative
assessment and instructional planning links
Lots of options – both CBM and CAT