Embed Size (px)
Citation preview

A Close Look at Charge Generation in Polymer:Fullerene Blends withMicrostructure ControlMariateresa Scarongella,† Jelissa De Jonghe-Risse,† Ester Buchaca-Domingo,‡ Martina Causa’,§
Zhuping Fei,∥ Martin Heeney,∥ Jacques-E. Moser,† Natalie Stingelin,‡ and Natalie Banerji*,†,§
†Institute of Chemical Sciences & Engineering, Ecole Polytechnique Federale de Lausanne (EPFL), SB ISIC GR-MO, Station 6,CH-1015 Lausanne, Switzerland‡Centre for Plastic Electronics and Department of Materials, Imperial College London, Exhibition Road, London, SW7 2AZ, UnitedKingdom§Department of Chemistry, University of Fribourg, Chemin du Musee 9, CH-1700 Fribourg, Switzerland∥Centre for Plastic Electronics and Department of Chemistry, Imperial College London, Exhibition Road, London, SW7 2AZ, UnitedKingdom
*S Supporting Information
ABSTRACT: We reveal some of the key mechanisms duringcharge generation in polymer:fullerene blends exploiting ourwell-defined understanding of the microstructures obtained inpBTTT:PCBM systems via processing with fatty acid methylester additives. Based on ultrafast transient absorption, electro-absorption, and fluorescence up-conversion spectroscopy, wefind that exciton diffusion through relatively phase-purepolymer or fullerene domains limits the rate of electron andhole transfer, while prompt charge separation occurs in regionswhere the polymer and fullerene are molecularly intermixed(such as the co-crystal phase where fullerenes intercalate between polymer chains in pBTTT:PCBM). We moreover confirm theimportance of neat domains, which are essential to prevent geminate recombination of bound electron−hole pairs. Mostinterestingly, using an electro-absorption (Stark effect) signature, we directly visualize the migration of holes from intermixed toneat regions, which occurs on the subpicosecond time scale. This ultrafast transport is likely sustained by high local mobility(possibly along chains extending from the co-crystal phase to neat regions) and by an energy cascade driving the holes toward theneat domains.
1. INTRODUCTION
Organic photovoltaic (OPV) cells offer a cost-efficient way toconvert solar energy to electricity with over 10% efficiency.1,2
The photoactive material of such devices commonly consists ofa conjugated polymer electron donor blended with an electron-accepting fullerene derivative, yielding an interpenetratingnetwork known as the bulk heterojunction (BHJ).3,4 Theexcitons generated by light absorption in such BHJs aredissociated via charge separation (CS) between the polymerand fullerene, and the charges are transported throughsegregated pathways of the BHJ to opposite electrodes of thedevice.Early on, it has become clear that the precise arrangement of
the donor and acceptor in the BHJ (from the molecular to themicroscopic scale), which we will refer to as microstructure, hasstrong implications on solar cell efficiency.5 Numerousempirical strategies to enhance device performance byinfluencing the microstructure of BHJ thin films during orafter their solution-processing have been explored (e.g., castingsolvent optimization, use of additives, thermal/solventannealing).6−12 It is, however, only with recent advances in
structural characterization that the true complexity of the BHJhas been revealed.13,14 Not only can the polymer and fullerenearrange into either amorphous or crystalline neat domains ofvariable size (i.e., relatively phase-pure regions), but anadditional, intimately mixed polymer−fullerene phase hasbeen identified.15−20 This can play an important role in thephotovoltaic processes, and indeed, the highest device perform-ance in polymer:fullerene blends is typically obtained with athree-phase microstructure consisting of the neat domains aswell as intermixed regions.19−22 The better understanding ofthe BHJ provides opportunities to establish clear structure−property relations that will enable precise control of theoptoelectronic properties in OPV materials by targetingoptimized microstructures.22−29
In an effort to comprehensively correlate the early chargegeneration events to BHJ structure, we used ultrafastabsorption and emission spectroscopy to investigate blends ofpoly(2,5-bis(3-hexadecylthiophen-2-yl)thieno [3,2-b]thiophene
Received: September 29, 2014Published: February 4, 2015
Article
pubs.acs.org/JACS
© 2015 American Chemical Society 2908 DOI: 10.1021/ja510032xJ. Am. Chem. Soc. 2015, 137, 2908−2918

(pBTTT, inset of Figure 1A) and [6,6]-phenyl C60 butyric acidmethyl ester (PCBM). Although pBTTT is mainly known for
excellent performance in field effect transistors,30−32 thismaterial is also a particularly suitable model system to studymicrostructural effects in solar cells. It is known that PCBMmolecules intercalate between the side chains of orderedpolymer domains, forming a co-crystalline phase and providinga structurally well-defined setting for our investigation.18,20,22
Moreover, we have recently shown that the co-crystal formationcan be controlled by using fatty acid methyl esters as additives,expanding the range of phase morphologies accessible with thepolymer:fullerene blend from a fully intermixed, to a partiallyintercalated, to a predominantly nonintercalated microstruc-ture.24
We exploit these well-defined microstructures to focus ontwo main questions. First, we investigate how CS by bothelectron and hole transfer depends on microstructure, andshow how its rate can be limited by exciton diffusion throughneat domains.33−35 Second, we discuss the role played by theBHJ structure in the generation of free (as opposed to bound)charges, using the early evolution of an electro-absorptionsignature (Stark effect) in the transient absorption (TA) data.Indeed, there has been much debate about the time scale(ultrafast or slow) and mechanism by which the electron−holepairs generated across polymer:fullerene interfaces separate to adistance at which they can overcome their mutual Coulombattraction (for example, by long-range CS, via hot states,assisted by delocalization, by diffusive dissociation, or mediatedby high local mobility).34,36−47
2. RESULTS AND DISCUSSION2.1. Steady-State Absorption Spectra. The absorption
spectrum of neat pBTTT shows a structureless band around525 nm, while neat PCBM films absorb little in the visiblerange, but mainly below 400 nm (Figure 1A). In the 1:1pBTTT:PCBM blend (by weight), processed by wire barcoating at 35 °C (see the Supporting Information for details),there is quasi-complete intercalation of fullerenes between thepolymer side chains, yielding an intimately intermixed co-crystal phase, as schematically shown in Figure 2A.20,22,24,48
Both the PCBM and the polymer signatures are present in theabsorption spectrum of this blend (Figure 1B). While thefullerene displays a similar signature as in the neat system, theabsorption of the polymer shows a pronounced structure due toa vibronic progression and is more red-shifted (maximum at558 nm) compared to the band in neat pBTTT. This spectraldifference has been previously reported,20 and was attributed tosignificant changes in the crystal structure between neat andintercalated pBTTT (including changes in backbone con-formation, chain stacking, and thus electronic coupling).49
Theoretical work for other conjugated polymers confirms theimportant implications of intra- and intermolecular coupling onthe extent of vibronic contribution to the absorptionspectrum.50 For the 1:4 pBTTT:PCBM blend (by weight),there is excess PCBM present, which forms relatively pureclusters around the intermixed regions, yielding a two-phasescenario (Figure 2B).20,22,48 As a consequence, the PCBM
Figure 1. Steady-state absorption spectra of the investigated pBTTT,PCBM, and pBTTT:PCBM systems. (A) Neat films of pBTTT(molecular structure in inset) and PCBM. (B) pBTTT:PCBM blendsin 1:1 and 1:4 ratio (by weight), wire bar coated at differenttemperatures. (C) 1:1 blends of pBTTT:PCBM with differentamounts of processing additive Me 7 (structure shown in inset).(D) 1:1 blends of pBTTT:PCBM with different amounts of processingadditive Me 12 (structure shown in inset) and Me 14. Vertical lines arethe excitation wavelengths used for transient absorption spectroscopy.
Figure 2. Schematic representation of the four investigated micro-structures for pBTTT:PCBM, as described in the lower panel table.The different processing conditions yielding each microstructure arealso summarized, together with the abbreviated sample names used inthe main text (color coded according to the absorption spectra inFigure 1). Note that the molecules and domain sizes are not drawn toscale in the schematic representation. Please refer to Figures S2 and S3in the Supporting Information for additional structural data and to ref24 for details on the domain sizes and distribution.
Journal of the American Chemical Society Article
DOI: 10.1021/ja510032xJ. Am. Chem. Soc. 2015, 137, 2908−2918
2909

absorption is strongly enhanced, while the structured shape ofthe pBTTT band confirms that the polymer is stillpredominantly present in the co-crystalline domains (Figure1B).Processing the 1:1 blend at room temperature (RT) changes
the structural picture compared to the same system cast at 35°C. The polymer exhibits in such films a broad absorption bandaround 540 nm and a shoulder at 605 nm, indicatingincomplete fullerene intercalation (coexistence of neatpBTTT and co-crystal regions, Figure 1B). A more reliablestrategy to control the PCBM intercalation is to useasymmetrical processing additives, which direct the supra-molecular assembly of the two components in the blend.24 Thestructure of heptanoic acid methyl ester (Me 7) and theabsorption spectra of the 1:1 pBTTT:PCBM blend (by weight)processed with 1, 10, and 50 mol equiv of Me 7 per pBTTTmonomer unit are depicted in Figure 1C. For the threesamples, the superposed absorption of the broad and structuredpBTTT features shows that the PCBM starts to phase separatefrom the polymer (partial fullerene intercalation). The relativeweight of the broad 540 nm signature versus the 605 nmshoulder suggests that the phenomenon is slightly morepronounced for the lowest Me 7 concentration. The pictureof partial intercalation is in agreement with our previous study,where a variety of tools (grazing-angle incidence wide-angle X-ray scattering, scanning transmission X-ray microscopy, opticalmicroscopy, resonant soft X-ray scattering) confirmed thethree-phase microstructure in the 1:10:1 pBTTT:Me7:PCBMsystem.24 The concomitant presence of a significant fraction ofco-crystal phase with some (relatively) neat pBTTT and PCBMregions is schematically shown in Figure 2C.Our previous structural investigation also revealed that using
additives with longer alkyl chains, such as dodecanoic acidmethyl ester (Me 12, Figure 1D) or tetradecanoic acid methylester (Me 14) leads to further expulsion of PCBM from the co-crystal regions compared to using Me 7. A predominantly two-phase microstructure comprised of relatively phase-purepolymer and fullerene domains is obtained (Figure 2D).24
The absorption spectra of the 1:1 pBTTT:PCBM blendsprocessed with Me 12 and Me 14 show a pronouncedstructureless signature in the 540 nm region and only a weakshoulder at 605 nm, confirming the predominant presence ofneat polymer domains (Figure 1D). Moreover, there is asurprising decrease of the PCBM band below 400 nm for thesamples containing 10 mol equiv of Me 12 or Me 14, althoughthe amount of fullerene has in principle not been reduced.To verify the PCBM concentration in those blends, we
redissolved the Me 12 (1:10:1) sample in chlorobenzene, andindeed recovered the fullerene absorption to the same level asin redissolved 1:1 and Me 7 blends (Figure S4, SupportingInformation). We also excluded film inhomogeneity as theorigin of the observed effect, by moving the sample and using alarge beam. Neither did we notice an enhancement of therelative polymer absorption, which might have explained thereduced PCBM peak in the normalized spectra. A similarreduction of PCBM absorption has been noted for annealedblends of poly(3-hexylthiophene) (P3HT) with PCBM.51 Theeffect is possibly related to enhanced long-range ordering in theneat PCBM regions of the Me 12 and Me 14 samples (asopposed to short-range aggregation obtained with Me 7).52
The presence of large PCBM-rich domains in the Me 12 andMe 14 samples is supported by structural data (Figures S2 andS3, Supporting Information, and ref 24). When less Me 12 was
used (1:1:1 blend in Figure 1D), the relative amplitude of thePCBM signature remained high, suggesting that the phenom-enon causing the reduced amplitude (presumably long-rangePCBM ordering) is limited, as in the case of the blendsprocessed with Me 7.
2.2. Excited-State Dynamics of Neat pBTTT Films. Thefemtosecond TA spectra of a neat pBTTT film excited at 540nm (<8 μJ/cm2) are shown in Figure 3A. The broad negative
band around 530 nm is assigned to ground state bleaching(GSB) of the polymer. The singlet excited state (exciton)absorption (ESA) has a positive signature above 640 nm,characteristically peaking toward 1000 nm. Finally, the negativeshoulder around 630 nm and the indent around 770 nm aredue to stimulated emission (SE), which resembles the steady-state fluorescence spectrum.24 Inhomogeneity in the excitonpopulation of conjugated polymers is typically caused bydisorder, breaking the conjugation into chromophoric segmentsof different lengths and leading to multiphasic excited statebehavior.53 It is therefore not surprising that the decay of theTA features for neat pBTTT films is biphasic, with a fastcomponent and a slower component in the TA dynamics,shown for selected wavelengths in Figure 3C. They wereanalyzed globally with time constants of 4.3 and 176 ps,yielding respectively the red and green amplitude spectra inFigure 3B (see the Supporting Information for details on thefitting procedure). The complex excited state behavior isconfirmed by the strongly multiphasic fluorescence dynamics,measured by femtosecond up-conversion spectroscopy upon500 nm excitation (Figure 4A). Time constants of 0.4, 4.9, 62,
Figure 3. TA data for neat pBTTT films. (A) TA spectra recorded atselected time delays following 540 nm excitation. Thicker solid linesare smoothed and overlaid to the raw experimental data. (B)Amplitude spectra associated with the time constants (shown in thelegend) obtained by multiexponential global analysis of the data. The“long” time constant is a plateau showing no decay within themeasured time window. (C) TA dynamics at selected probewavelengths. The solid lines represent the best multiexponential fitobtained by global analysis.
Journal of the American Chemical Society Article
DOI: 10.1021/ja510032xJ. Am. Chem. Soc. 2015, 137, 2908−2918
2910
and 600 ps were necessary to globally reproduce the dynamicsat emission wavelengths between 700 and 800 nm.
It can be seen from the data displayed in Figure 4A that theamplitude of the fast decay components is enhanced at shorteremission wavelengths, indicating faster decay on the blue sideof the fluorescence spectrum. In general, this is typical for anykind of relaxation leading to a dynamic red-shift of theemission.54−56 In agreement, the shape of the 4.3 ps amplitudespectrum from the TA data shows decay of a blue-shifted SEsignature. This kind of early relaxation in conjugated polymersis usually caused by excitation energy transfer to lower-energychromophores, and possibly by geometrical changes in thepolymer backbone.56−59 There is, however, pronouncedground-state recovery for pBTTT on the 4.3 ps time scale(see GSB contribution to the amplitude spectrum). Thissuggests that the high-energy polymer segments do not onlytransfer their excitation energy (which should maintain theGSB), but that they are also lost, at least partially, to the groundstate on the very fast time scale. On the other hand, the 176 pscomponent of the TA data corresponds essentially to thelifetime of relaxed low-energy pBTTT excitons with more red-shifted SE (Figure 3B). At long time delays, a plateau (offset) isobserved in the TA dynamics (the corresponding amplitudespectrum is denoted as “long”). It is due to long-lived TAfeatures with negligible SE contribution and flat absorptionabove 600 nm (mainly charges and/or the triplet state).60,61
2.3. Charge Generation in pBTTT:PCBM Blends.2.3.1. Fully Intercalated Samples. We discuss here the 1:1and 1:4 pBTTT:PCBM blends processed at 35 °C (simplyreferred to as 1:1 and 1:4 samples in the following), which both
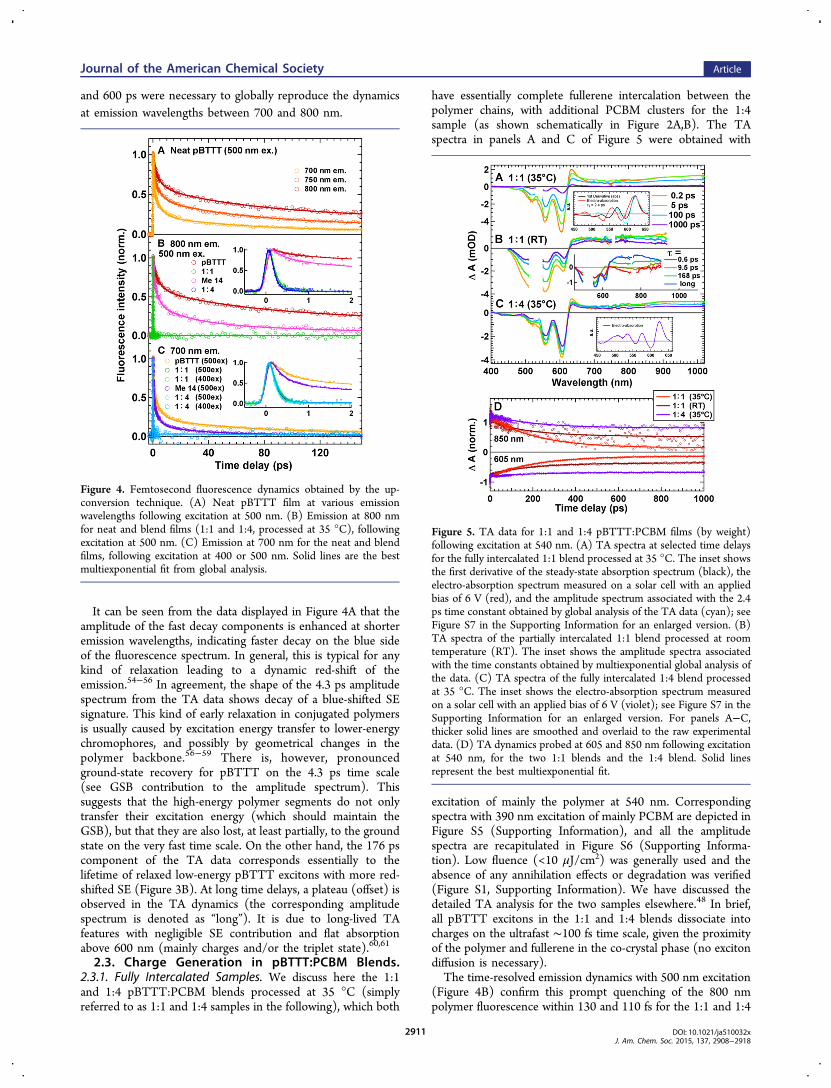
have essentially complete fullerene intercalation between thepolymer chains, with additional PCBM clusters for the 1:4sample (as shown schematically in Figure 2A,B). The TAspectra in panels A and C of Figure 5 were obtained with
excitation of mainly the polymer at 540 nm. Correspondingspectra with 390 nm excitation of mainly PCBM are depicted inFigure S5 (Supporting Information), and all the amplitudespectra are recapitulated in Figure S6 (Supporting Informa-tion). Low fluence (<10 μJ/cm2) was generally used and theabsence of any annihilation effects or degradation was verified(Figure S1, Supporting Information). We have discussed thedetailed TA analysis for the two samples elsewhere.48 In brief,all pBTTT excitons in the 1:1 and 1:4 blends dissociate intocharges on the ultrafast ∼100 fs time scale, given the proximityof the polymer and fullerene in the co-crystal phase (no excitondiffusion is necessary).The time-resolved emission dynamics with 500 nm excitation
(Figure 4B) confirm this prompt quenching of the 800 nmpolymer fluorescence within 130 and 110 fs for the 1:1 and 1:4
Figure 4. Femtosecond fluorescence dynamics obtained by the up-conversion technique. (A) Neat pBTTT film at various emissionwavelengths following excitation at 500 nm. (B) Emission at 800 nmfor neat and blend films (1:1 and 1:4, processed at 35 °C), followingexcitation at 500 nm. (C) Emission at 700 nm for the neat and blendfilms, following excitation at 400 or 500 nm. Solid lines are the bestmultiexponential fit from global analysis.
Figure 5. TA data for 1:1 and 1:4 pBTTT:PCBM films (by weight)following excitation at 540 nm. (A) TA spectra at selected time delaysfor the fully intercalated 1:1 blend processed at 35 °C. The inset showsthe first derivative of the steady-state absorption spectrum (black), theelectro-absorption spectrum measured on a solar cell with an appliedbias of 6 V (red), and the amplitude spectrum associated with the 2.4ps time constant obtained by global analysis of the TA data (cyan); seeFigure S7 in the Supporting Information for an enlarged version. (B)TA spectra of the partially intercalated 1:1 blend processed at roomtemperature (RT). The inset shows the amplitude spectra associatedwith the time constants obtained by multiexponential global analysis ofthe data. (C) TA spectra of the fully intercalated 1:4 blend processedat 35 °C. The inset shows the electro-absorption spectrum measuredon a solar cell with an applied bias of 6 V (violet); see Figure S7 in theSupporting Information for an enlarged version. For panels A−C,thicker solid lines are smoothed and overlaid to the raw experimentaldata. (D) TA dynamics probed at 605 and 850 nm following excitationat 540 nm, for the two 1:1 blends and the 1:4 blend. Solid linesrepresent the best multiexponential fit.
Journal of the American Chemical Society Article
DOI: 10.1021/ja510032xJ. Am. Chem. Soc. 2015, 137, 2908−2918
2911

blend, respectively (a convolution with the 100 fs instrumentresponse function was used and it is likely that even fasterquenching components are missed). The higher-energyemission at 700 nm (Figure 4C) also decays with 150/180 fs(1:1 blend) and 130/150 fs (1:4 blend), following excitation at500/400 nm. With 400 nm excitation, there is a weakcontribution of PCBM emission,52 which is quenched by holetransfer (HT) to pBTTT. Our previous TA study has revealedthis process to be prompt in the 1:1 blend (∼100 fs), but tohave a distribution of ultrafast to slow components (rangingfrom sub-ps to ∼500 ps) in the 1:4 blend due to diffusion ofPCBM excitons to a quenching site through the fullereneclusters (see amplitude spectra in Figure S6, SupportingInformation).48 This causes the weak offset at long time delaysin the emission dynamics of the 1:4 blend excited at 400 nm(Figure 4C).For the fully intercalated 1:1 blend, it is known that most
electron−hole pairs generated by CS recombine geminately tothe ground state, most likely because they cannot overcometheir mutual Coulomb attraction.20,22,24,28,62 This is consistentwith the low solar cell efficiency of this system. Here, wedirectly observe the geminate charge recombination (gCR) as asignificant decay of all TA features with a relatively short 211 pstime constant (Figure 5A, dynamics of the 605 nm GSB and850 nm charge absorption in Figure 5D, amplitude spectra inFigure S6, Supporting Information).48 Only a small fraction offree charges is formed, leading to a weakly pronounced long-lived TA spectrum at our longest time delay of 1 ns. In the 1:4blend, the presence of PCBM clusters largely suppressesgCR,20,22,28,62 so that the decay of the TA features on the 1 nstime scale is notably reduced (Figure 5C,D). This can beexplained by favored spatial separation of charge pairs formedin the co-crystalline regions, driven by an energy cascade toneat fullerene domains with higher electron affinity.22,37 Thecharge dissociation efficiently competes with the 211 psrecombination process, so that we infer that the electronmigration to the PCBM clusters is faster than the gCR (<211ps). Electrons are thus largely removed from the co-crystalphase within the time window of the experiment.
2.3.2. Partially Intercalated Samples. This section concernssamples having a three-phase microstructure (partial fullereneintercalation), comprised of co-crystalline regions, PCBMclusters, and neat pBTTT domains, as schematically depictedin Figure 2C (1:1 pBTTT:PCBM blends processed at RT, withdifferent amounts of Me 7, or with 1 mol equiv of Me 12). Forthe 1:1 blend processed at RT, which we will refer to as 1:1(RT), the TA spectra with 540 nm excitation (Figure 5B) areclearly different from the fully intercalated 1:1 sample. Inparticular, the amplitude of the long-lived TA features issignificantly enhanced, pointing to a microstructure that favorsgeneration of free charges. The dynamics in Figure 5D confirmthe reduction of gCR (although still more charges recombinethan in the 1:4 blend). In agreement with the similarity of thesteady-state absorption, the TA behavior of the 1:1 (RT)sample (Figure 5B) is comparable to the one of the 1:1 blendprocessed with Me 7, which also results in partial fullereneintercalation (shown for 10 mol equiv and 540 nm excitation inFigure 6A). For convenience, we will simply call the latter theMe 7 sample. As with the 1:1 (RT) sample, processing of the1:1 blend with Me 7 reduces the extent of gCR (see chargedynamics at 850 nm in Figure 7C). The partial phase separationof the polymer and fullerene due to the addition of Me 7 hasalso previously been correlated to enhanced free charge yield(by nanosecond TA spectroscopy and time-resolved microwaveconductivity) and to improved solar cell efficiency compared tofully intercalated systems.24
For both partially intercalated samples (RT and Me 7), theGSB contains an unstructured contribution in the 530 nmregion, which we attribute to the presence of neat pBTTTdomains (Figures 5B and 6A). Since neat pBTTT domains andco-crystalline regions are excited at 540 nm, we expect promptCS in the highly intermixed regions as well as multiphasicdelayed CS for excitons diffusing (by various distances)through the neat regions toward PCBM.33−35 The characteristicESA signature at 1000 nm in the early TA spectra (in additionto the flat absorption of promptly generated charges) confirmsthe delayed presence of pBTTT excitons in the neat domains.Their quenching leads to fast components in the TA dynamics,
Figure 6. TA spectra at selected time delays for 1:1 pBTTT:PCBM films processed with Me 7, Me 12, and Me 14 additives, following excitation at540 nm (A−D) or at 390 nm (E−H). The insets represent the amplitude spectra associated with the time constants obtained by multiexponentialglobal analysis of the data. Thicker solid lines are smoothed and overlaid to the raw experimental and amplitude spectra.
Journal of the American Chemical Society Article
DOI: 10.1021/ja510032xJ. Am. Chem. Soc. 2015, 137, 2908−2918
2912

for example in the ESA at 1000 nm (Figure 7E, only slow decayof overlapping charge absorption is seen for the 1:1 blend). Byglobal analysis, we find a subpicosecond time constant (0.6/0.3ps for RT/Me 7) and a slower (9.5/6.8 ps) time constant forthe delayed exciton quenching. This is assigned based on thedecay of the negative SE around 730 nm and positive ESAabove 870 nm in the corresponding amplitude spectra (insetsof Figures 5B and 6A). We cannot exclude some slower excitonquenching masked by the evolution of the charge absorption.The amplitude spectra assigned to exciton quenching alsoindicate decrease of the GSB. Reduction of the GSB during CShas been reported in other polymer:fullerene blends.34,63
However, given the ∼4 ps exciton decay in neat pBTTTfilms (Figure 3), it is possible that excitons in the neat regionsare not only dissociated by delayed CS, but are also partly lostto the ground state. Finally, we observe a slower decrease of theTA features with a 168 ps time constant for the 1:1 (RT) andMe 7 samples, which we attribute to gCR in the co-crystallineregions, given the similarity of the amplitude spectrum with the
one obtained for gCR in the 1:1 and 1:4 blends (Figure S6,Supporting Informatioin).48
Let us now turn to the TA data with 390 nm excitation,where both the polymer and the PCBM are excited. TA spectrafor the partially intercalated 1:1 (RT) and Me 7 samples areshown in Figure S5 in the Supporting Information and Figure6E, respectively. In those blends, the PCBM is present both inthe intercalated, co-crystalline phase, as well as in the relativelyphase-pure fullerene clusters (as revealed by the presence ofmobile electrons using time-resolved microwave conductiv-ity).24 A complex overlap of prompt and delayed electron andhole transfer processes with recombination and spatial chargeseparation is therefore expected. The TA evolution is verysimilar for the 1:1 (RT) and Me 7 blends, but there aresignificant differences compared to the data obtained with 540nm excitation. Most notably, there is an apparently reduceddecay of the TA features for the 390 nm data (Figure S5,Supporting Information and Figure 6E). This is also obvious inthe TA dynamics probed at 605 nm for the Me 7 sample(Figure 7A, green solid lines for 540 nm and dotted lines for390 nm excitation). Since free charge yield in OPV blends isgenerally not increased with excess excitation energy, it isunlikely that gCR is reduced at 390 nm.44 Indeed, the 168 psamplitude spectrum in the inset of Figure 6E shows thatrecombination is present with 390 nm excitation. A more likelyinterpretation is that delayed HT from PCBM clusters (asobserved in the 1:4 blend, Figure S5 in the SupportingInformation) leads to a rise of the polymer GSB and chargeabsorption, which partly counterbalances the decrease of theTA features due to recombination.
2.3.3. Predominantly Phase-Separated Samples. Morephase-separated systems can be obtained when the 1:1pBTTT:PCBM blends are processed with 10 mol equiv ofMe 12 and Me 14, leading to relatively phase-pure domains ofthe polymer and fullerene (Figure 2D).24 The TA spectra ofthose samples (abbreviated as Me 12 and Me 14 in thefollowing) are shown in Figure 6B,C for 540 nm excitation andFigure 6F,G for 390 nm excitation. The free charge yield andsolar cell efficiency are less than for the three-phasemicrostructure in the Me 7 sample, but higher than in thefully intercalated 1:1 blend.24 This trend is clearly reflected bythe TA dynamics probed at 850 nm (mainly charge absorption,Figure 7C). The most long-lived signal is observed for theefficient 1:4 blend, followed by samples processed with Me 7,then Me 12, and finally the fully intercalated 1:1 blend. Thus, itis clear that recombination processes on the subnanosecondtime scale determine the performance of pBTTT:PCBMdevices.There is no significant difference in the TA data between the
blends processed with Me 12 and Me 14 (blue and pink curvesin Figure 7A). With 540 nm excitation of pBTTT, the early 0.2ps TA spectrum is dominated by signatures of pBTTT excitons(negative SE at 730 nm and positive ESA at 1000 nm, Figure6B,C), without significant contribution of charge absorption.This strong reduction of prompt CS, as well as the moreunstructured shape of the GSB, confirm the predominance ofneat pBTTT domains rather than highly intermixed, co-crystalline regions. According to the fluorescence dynamics for700 and 800 nm emission, the excitons in Me 14 blends arequenched more rapidly than in neat pBTTT films (Figure4B,C). Still, the quenching is quite slow and stronglymultiphasic, with time constants of 290 fs, 3.4 ps, 25 ps, and165 ps, confirming that exciton diffusion limits the CS rate. In
Figure 7. TA dynamics recorded for various blends shown in thelegend at probe wavelengths of 605 (A, B), 850 (C), 630 (D), and1000 nm (E). Solid lines represent 540 nm excitation, while dottedlines represent 390 nm excitation. The thicker lines are the bestmultiexponential fits from global analysis.
Journal of the American Chemical Society Article
DOI: 10.1021/ja510032xJ. Am. Chem. Soc. 2015, 137, 2908−2918
2913

the TA spectra, the exciton quenching contributes to the 0.3and 9.7 ps amplitude spectra (insets of panels B and C in Figure6; their shape is similar to the one obtained for the Me 7sample). There is also a dominant contribution of exciton decayto the 168 ps component (see similarity with the 176 psamplitude spectrum in neat pBTTT film, Figure 3B). For thefully intercalated (1:1 and 1:4) and partially intercalated (1:1(RT), Me 7) blends, the TA decay on this time scale is mainlycaused by gCR of charge pairs in the co-crystal phase. For themore phase-separated Me 12 and Me 14 samples, the lossmechanism is different and results mainly from the decay ofexcitons in neat pBTTT domains to the ground state, whichcannot reach a PCBM acceptor during their lifetime.For the Me 12 and Me 14 samples, it is still predominantly
the pBTTT which absorbs with excitation at 390 nm, sincethere is very little absorption of PCBM in this region (fullerenelight harvesting is lost due to long-range ordering of PCBM,Figure 1D). This explains the negligible difference in thedynamics with 540 and 390 nm excitation (solid and dottedlines in Figure 7A). The TA spectra with 390 nm excitation alsoexhibit a strong contribution of polymer excitons, undergoingslow multiphasic quenching and decay (Figure 6F,G). Ourstructural picture is further confirmed when using lowerquantities of Me 12 during processing (1:1:1 blend), whichallows us to restore a three-phase microstructure withsignificant PCBM absorption at 390 nm. Exciton recombinationlosses are in this case reduced and the evolution of the TAspectra resembles the one of the 1:1 (RT) and Me 7 samples(Figure 6D,H).2.4. Electro-absorption and Spatial Charge Separa-
tion. The photogenerated charges in polymer:fullerene blendscreate important electric fields in their vicinity, which can havestrong effects on the optical transitions of neighboringchromophores.38 In general, an electric field (E) perturbs theabsorption spectrum of a molecule by shifting the energy levelsof the ground and/or excited state (Stark effect), by breakingthe symmetry allowing otherwise forbidden transitions, or byionizing the excited state.64 We focus here on the Stark effect,which occurs if there is a change of permanent dipole moment(Δp) and/or of polarizability (Δα) between the ground andexcited states, leading to an energy shift of the transition. Theelectro-absorption (EA) is defined as the difference of theabsorption spectrum in the presence (AE(ν)) and absence(A(ν)) of the electric field. It can be expressed as a series offirst, second, and higher order derivatives of A(ν):64
ν νν
νν
νν
ν
= −
= − ∂∂
Δ − ∂∂
Δα + ∂∂
Δ
+
A A
ApE
AE
ApE
EA ( ) ( )
( ) 12
( ) 12
( )( )
...
E
22
22
The first term (linear in E) cancels in isotropic media, thesecond term (quadratic in E) shows that changes inpolarizability are related to the first derivative of the absorptionspectrum, and the third term associates changes in thepermanent dipole moment to the second derivative of A(ν).In TA spectroscopy, the absorption difference (ΔA) of the
sample with and without excitation by the pump is measured,thus in the presence and absence of photogenerated charges inthe case of the pBTTT:PCBM blends. If a Stark effect is causedby those charges, an EA contribution is seen in the TA data. Incontrast to the case where a uniform electric field is externallyapplied across the bulk of the film using electrodes,43,65,66 the
Stark effect in the TA data depends on the local radial electricfields around free charges and the local electric dipoles aroundelectron−hole pairs. It can be observed even if the overallmacroscopic field cancels due to a random orientation of theelectron−hole pairs in the BHJ (in particular for a quadraticdependence on the local field magnitude).38 The EA signaturein the TA data can be exploited to determine in which phase ofthe blend the charges are generated and how they spatiallyseparate. Key parameters determining the amplitude of theobserved EA signal include the electron−hole distance, theorientation of the electric dipoles with respect to the crystalstructure, and the nature of the chromophores found in thevicinity of the charges (neat or in the co-crystal phase). Someexamples of electric field scenarios encountered in a three-phase microstructure of pBTTT:PCBM are schematicallyillustrated in Figure 2C.
2.4.1. Fully Intercalated Samples. We have demonstratedthat the electron transfer (ET) from photoexcited pBTTT tointercalated PCBM molecules is prompt for the 1:1 and 1:4blends excited at 540 nm. Therefore, only the signature ofcharges (not of excitons) is present in the TA spectra of Figure5A,C. In addition to the expected GSB below 620 nm and theflat absorption of positively charged pBTTT above 620 nm, anoscillatory EA signal resembling the first derivative of theabsorption spectrum (inset of Figure 5A) superposes to the redside of the GSB and displays a characteristic positive peakaround 630 nm. We have confirmed this assignment by directlymeasuring the EA spectra of the 1:1 and 1:4 films sandwichedbetween electrodes in solar cell devices, with an externallyapplied uniform electric field of the order of 6 × 10⁵ V/cm(insets of panels A and C in Figure 5, experimental details inthe Supporting Information). We note that the EA signaturethat is most visible in the TA spectra (600−650 nm region)results from transitions in pBTTT, while the weakercontribution of PCBM (450−550 nm)66 is masked by theGSB of the polymer. We will therefore limit the discussion tothe EA signal induced by photogenerated charges in thepolymer chains. The EA amplitude measured in the device at620 nm varies quadratically with the externally applied bias(Figure S8B, Supporting Information). We are thus observinga quadratic Stark effect (the transition shifts with E2). Since theEA spectrum of the 1:1 blend shows similarity to the firstderivative of the absorption (Figure 5A and Figure S7 in theSupporting Information), the main origin of the Stark effect is achange in polarizability between the ground and excited state ofpBTTT.It is noteworthy that the EA signature observed in the TA
data of the 1:1 blend (upon 390 nm or 540 nm excitation) isinstantaneously present at the shortest time delays (Figure 5Aand Figure S5A in the Supporting Information), although thecharges generated by prompt CS in this highly intermixed, fullyintercalated system must be in close proximity and arepresumably significantly bound. Different behavior has beenreported for other systems, where the EA signal was onlyassociated with long-range (4−5 nm) separated charges, butabsent in samples with low fullerene loading and strongelectron−hole binding.38 We relate this to the significantlydifferent microstructure of the pBTTT:PCBM blend, whichforms a well-defined co-crystal phase, compared to themolecularly less ordered polymer and small molecule systemsdiscussed in ref 38.Indeed, we can explain our observations in the 1:1 blend
using simple electrostatic considerations applied to the
Journal of the American Chemical Society Article
DOI: 10.1021/ja510032xJ. Am. Chem. Soc. 2015, 137, 2908−2918
2914

particular geometry of the pBTTT:PCBM co-crystal phase (seethe Supporting Information for details and Figure S9 for thepublished crystal structure49). Since the local field generated bya charge decays with distance according to 1/a2 (and E2 decayseven faster with 1/a4), only the pBTTT chromophores locatedin closest proximity to a charge will experience a significantStark effect. In the co-crystal phase, the initially generateddipole related to the electron−hole pair is perpendicular to thepBTTT backbones (Figure 2C). By inspection of the crystalstructure shown in Figure S9, Supporting Information, thepolymer segments closest to a charge (which will dominate theEA response) are the ones located on both sides of the hole onthe same chain, and the ones on the chains π-stacked above andbelow the hole. The field generated by the hole across thelamella spacing of ∼3 nm is much weaker.49 Similarly, the effectof the field around the electron is small on the pBTTTchromophores, as it will mainly affect the close-by fullerenemolecules. Electrostatic simulations show that the field felt bythe relevant polymer segments next to the hole vanishes if theelectron−hole distance approaches zero (see the SupportingInformation). However, if we assume an initial chargeseparation distance of 1 nm (which is reasonable based onthe size and arrangement of the pBTTT and PCBMmolecules),38 the field at the relevant positions is alreadysignificant and explains the presence of the EA signature in theTA spectra of the 1:1 blend at early time delays. In fact, thepolymer segments located at a distance of about 0.2−0.5 nmaway from the hole in the co-crystal geometry experience anelectric field very close to the one that would be created arounda free hole.Our previous analysis of the TA data for the intercalated 1:1
blend has revealed that the only evolution of the EA signature isa weak decrease with a 2.4 ps time constant.48 Thecorresponding amplitude spectrum indeed strongly resemblesthe EA signature (inset of Figure 5A and Figure S6, SupportingInformation). In spite of this weak decay, the 630 nm EA peakis still clearly visible at the longest (1 ns) time delay. Wetentatively ascribe the EA decay to some relaxation of thecharges involving change in their delocalization, or to theirmigration within the co-crystal phase (the electrostaticsimulations in the Supporting Information confirm that theassociated electron−hole separation and rotation of the dipolewith respect to the crystal frame could lead to a decrease of theEA). In the 1:1 blend, migration away from their initialgeneration site concerns only a small fraction of escapedcharges, since most of them undergo gCR on the 200 ps timescale. In contrast, the presence of neat PCBM clusters in the1:4 blend provides a driving force for spatial charge separationand significantly prevents recombination within the timewindow of our experiment.22 Thereby, the electron transportwithin the co-crystalline regions occurs in the direction parallelto the polymer π-stacks, because it is hindered in the other twodirections by the polymer backbones and pBTTT side chains(Figure S6, Supporting Information).49
One would expect a different evolution of the EA signature inthe 1:4 sample, but it is surprisingly similar to the one of the 1:1blend without neat fullerene regions. The EA appears in bothcases instantaneously upon prompt CS in the co-crystal phase,then slightly decays within 2.4 ps, and remains significantlypresent for free charges at long time delays (Figure 5, and in theSupporting Information Figures S5 and S6). We can againexplain this observation by considering the molecular geometryaround the photogenerated charges (Figure 2C). For the initial
electron−hole pair in the co-crystal phase (separated by 1 nm),the pBTTT segments most affected by the charges are close tothe hole (<0.5 nm) and in the plane perpendicular to the dipole(similar as discussed above for the 1:1 blend). According toelectrostatic considerations (see the Supporting Information),they experience an electric field comparable to the one around afree hole (i.e., the influence of the electron is negligible at thisposition). There is therefore not a large difference in the EAamplitude when the charges effectively separate to a distance of5 nm thanks to the PCBM clusters (Figure 2C). A significantlystronger dependence of the EA on the electron−holeseparation would occur if the closest neighbors to the hole inthe co-crystal phase were along the axis of the initial chargedipole, but this is not the case for the co-crystal geometry. TheStark effect observed for intercalated pBTTT:PCBM samples isthus quite independent of whether the electrons stay in the co-crystalline regions or not, but it is dominated by the presence of(bound or free) holes on polymer chains within the co-crystalregions.
2.4.2. Partially Intercalated and Predominantly Phase-Separated Samples. For the partially intercalated 1:1 (RT)and Me 7 blends excited at 540 nm, gCR is reduced comparedto the fully intercalated 1:1 blend, which we attribute to thepresence of phase-pure domains in the former blends, similar tothe 1:4 system. However, neat pBTTT regions are now presentin addition to the PCBM clusters.24 The TA spectra recorded atlong time delays (1 ns) predominately represent the signatureof long-lived free charges (Figures 5B and 6A). The GSB andflat absorption of positively charged pBTTT are obvious, butthere is a striking absence of the EA signal peaking at 630 nm.The EA signal is weakly present in the 0.2 ps spectrum, butalmost disappears within a few picoseconds. Since we have seenfor the 1:4 blend that the EA amplitude is quite insensitive tothe migration of electrons to PCBM clusters, we deduce thatthe fast decay of the EA in the partially intercalated samples isrelated to the hole migration from the co-crystal phase to theneat pBTTT domains. Following a similar reasoning based onelectrostatic simulations as for the 1:4 blend, we show in theSupporting Information that increasing the electron−holeseparation by itself should not have a strong effect on thefield experienced by the close neighbors of the hole. The strongreduction of the EA in the partially intercalated samples istherefore rather related to the nature of the polymer segmentssurrounding the hole. Indeed, the electronic properties ofpBTTT are very different when it is in the neat domains or co-crystal phase, as testified by the change in the absorptionspectrum (Figure 1A,B). The less steep absorption edge in thebroad spectrum of neat pBTTT leads to a smaller value of thefirst derivative and thus to weaker EA. Experimentally, the EAspectrum recorded for a device containing neat pBTTT (withexternally applied field) confirms that it is less sharp andreduced compared to the intercalated 1:1 blend (Figure S8A,Supporting Information). Thus, the electric field generated by ahole in neat pBTTT domains will induce a weak EA inneighboring polymer segments, not visible in the TA spectra.Further evidence that the prominent EA signature is
specifically related to holes in co-crystalline regions is shownin Figure 8A−C (540 nm excitation). Here, the concentrationof Me 7 was varied during processing of the 1:1 blend, allowingslight tuning of the extent of PCBM intercalation. The earlyoscillatory EA signature due to prompt CS is more pronouncedin the 1:50:1 blend containing more co-crystal fraction, than inthe less intercalated 1:1:1 blend (in addition to weak changes in
Journal of the American Chemical Society Article
DOI: 10.1021/ja510032xJ. Am. Chem. Soc. 2015, 137, 2908−2918
2915

the GSB shape according to the steady-state absorption). Apartfrom this initial difference, the TA dynamics and overallevolution of the TA spectra is similar for the three samples(Figure 7B).Although it has been previously established that neat
domains in the BHJ favor the spatial separation of chargepairs generated in intermixed regions,20−22,48 a direct visual-ization of charge migration between different phases has to ourknowledge not been reported. With the phase-dependent EAsignature in pBTTT, we have a unique tool in hand to directlymonitor the generation site of charges and the migration ofholes from co-crystalline to neat polymer regions. Importantconclusions can be drawn for the partially intercalated andmore phase-separate pBTTT:PCBM blends:(1) The presence of the 630 nm EA peak at ultrafast times
designates co-crystal regions as the prompt charge generationsite in the blends containing a significant intermixed fraction(1:1 blends processed at RT and with 10 or 50 mol equiv of Me7, excited at 540 nm). Prompt CS can also occur for excitonsformed at the domain boundaries of neat phases (no diffusionis necessary and the hole is immediately present in the neatdomain, Figure 2C), leading to an initial charge signaturewithout a visible EA signal (less intercalated Me 7 (1:1:1) andMe 12 (1:1:1) samples, excited at 540 nm). Since there is ingeneral no obvious rise of the EA during delayed CS in thepartially intercalated samples as well as in the more phase-separated Me 12 and Me 14 samples (Figure 6B,C), thisprocess also seems to occur at the interfaces between phase-pure domains.(2) Upon 390 nm excitation of all the partially intercalated
samples (1:1 RT, Me 7) as well as the more phase separatedMe 12 and Me 14 systems, there is a strong enhancement ofthe oscillatory EA signature in the early 0.2 ps spectra (Figure6E−H and Figure S5B, Supporting Information). This suggestsa selective excitation of PCBM and possibly pBTTT in the co-crystal phase at 390 nm. The effect is independent of the Me 7concentration used during processing, confirming thatpromptly generated holes (with 390 nm excitation) are in allcases predominantly found in the highly intermixed, interca-
lated regions (Figure 8D−F). The signature of free charges atlong time delays is the same for both excitation wavelengths(without EA signal).(3) Whenever charges are promptly generated in the co-
crystal phase for the partially intercalated systems (with 540and 390 nm excitation) and for the predominantly phase-separated blends (with 390 nm excitation), the holes migrate toneat pBTTT regions on the ∼1 ps time scale, as evidenced bythe fast decay of the EA signature. For 390 nm excitation, this isclearly seen in the dynamics of Figure 7D. The EA decay is alsoreproduced by the oscillatory shape of the 0.3 ps amplitudespectra (insets of Figure 6E−G), and might contribute to theslower 6.8 or 9.6 ps components, together with a rise of theGSB due to delayed HT. The EA decay is less obvious in theamplitude spectra with 540 nm excitation, because of lessselective excitation of the co-crystal phase and mixing with theET dynamics.(4) The results confirm that neat polymer domains in
partially intercalated samples favor spatial separation of chargepairs generated in the intermixed co-crystal phase, contributingto reduced gCR, in the same way as PCBM clusters in the 1:4blend. They can, however, lead to loss of short-lived pBTTTexcitons. From the ∼1 ps decay of the EA, we conclude that theholes can move immediately after their generation and do sovery quickly. In agreement with recent Monte Carlosimulations,37 we suggest that this fast transport is sustainedby high local mobility and by an energy cascade driving theholes to the neat regions. An energy cascade of 100−200 meVhas been reported for the electron transport to the fullereneclusters,22 and can also be expected between the intermixed andneat pBTTT regions, given the different electronic properties ofthe polymer in the two phases (see change in the absorptionspectrum). Within the co-crystal phase, a hole can in principlemigrate along the polymer backbones or along the π-stackingdirection, but the former seems to be favored.67 We thereforehypothesize that the ultrafast hole migration occurs predom-inantly along the same polymer chains, which extend from theco-crystalline to neat pBTTT domains (so-called “tie”mole-cules, Figure 2C).68 By probing the environment of the charge,the Stark effect is therefore more useful to determine thelocation of the hole than the GSB, which probes the chargedpolymer chain itself.(5) For the Me 7 and 1:1 (RT) samples (three phase
microstructure), the presence of the 630 nm EA signature inthe 168 ps amplitude spectrum assigned to gCR suggests thatthis recombination is dominant for holes remaining in theintermixed co-crystal regions (insets of Figures 5B and 6A,E).The charges are likely to be trapped in the intermixed phasedue to poor (through-chain) connectivity to neat pBTTTregions and missing percolated paths to PCBM clusters.21,68
3. CONCLUSION
We have demonstrated a precise correlation between the earlycharge generation mechanism and the phase morphology ofpolymer:fullerene bulk heterojunction blends. Control of thecharge separation was achieved by targeting well-definedmicrostructures through the use of fatty acid methyl estersprocessing additives. The rate of electron and hole transfer wasdetermined by femtosecond absorption and emission spectros-copy, while an electro-absorption (Stark effect) signatureallowed us to directly visualize ultrafast transport of holesfrom intercalated to neat region. The investigated samples
Figure 8. TA spectra at selected time delays for 1:1 pBTTT:PCBMfilms processed with different amounts of Me 7 additive, followingexcitation at 540 nm (A−C) or at 390 nm (D−F). Thicker solid linesare smoothed and overlaid to the raw experimental data and rawamplitude spectra.
Journal of the American Chemical Society Article
DOI: 10.1021/ja510032xJ. Am. Chem. Soc. 2015, 137, 2908−2918
2916

could be classified into four distinct categories according totheir microstructure and charge separation mechanism:(1) One-phase, fully intercalated blend (1:1 pBTTT:PCBM
blend processed at 35 °C)both electron and hole transferoccur on the <100 fs time scale, since no exciton diffusion isnecessary within the single co-crystal phase. However, amajority of the electron−hole pairs recombine geminatelywithin 200 ps.(2) Two-phase microstructurecomprised of co-crystalline
regions and PCBM clusters (1:4 pBTTT:PCBM blendprocessed at 35 °C): electron transfer is prompt, while holetransfer can be prompt or delayed depending on whetherexcitons are generated in the intercalated or neat PCBMregions. Geminate charge recombination in the co-crystal phaseis significantly reduced due to efficient migration of electronstoward fullerene clusters, favoring spatial separation ofelectron−hole pairs.(3) Three-phase microstructurewith co-crystalline regions,
PCBM clusters, and neat pBTTT domains (1:1 pBTTT:PCBMblend processed at room temperature, with different amountsof Me 7, or with 1 mol equiv of Me 12): prompt chargeseparation occurs in the co-crystal phase and for excitonsformed at the edge of neat domains, while exciton diffusionthrough PCBM or pBTTT regions limits the rate of chargeseparation (and leads to some loss of short-lived polymerexcitons). Nevertheless, both neat PCBM and polymerdomains contribute to the spatial separation of electron−holepairs, reducing geminate recombination in intercalated regions.The holes promptly generated in the co-crystal phase migrateto neat pBTTT regions on the <1 ps time scale, showing thatthey are free to move immediately after their formation. Thisultrafast hole transport is sustained by high local mobility(possibly along polymer chains extending from co-crystal toneat regions) and by an energy cascade driving the holes to theneat domains.(4) Predominantly two-phase systemcomprised of rela-
tively phase-separated regions of neat PCBM and pBTTT (1:1pBTTT:PCBM blend processed with 10 mol equiv of Me 12 orMe 14): charge separation becomes slow and multiphasic dueto exciton diffusion, and there is significant loss to the groundstate of excitons that cannot reach a charge separation siteduring their lifetime. Moreover, long-range fullerene orderinglimits light harvesting by PCBM at 390 nm, but remaining co-crystals can be selectively excited at this wavelength, followedby ultrafast transport of promptly generated holes to neatpBTTT regions.Overall, the pBTTT:PCBM system has proven to be
particularly suitable to answer many long-standing questionsrelated to charge generation in polymer:fullerene blends. Notonly because its microstructure can be precisely characterizedand carefully manipulated, but also because the optoelectronicdifferences of the polymer found in neat or intercalated regionsallow us to differentiate the electro-absorption according to thebulk heterojunction phase, giving us a unique tool to determinethe location of the charges.
■ ASSOCIATED CONTENT
*S Supporting InformationExperimental details, additional Figures as mentioned in thetext, and electrostatic simulations. This material is available freeof charge via the Internet at http://pubs.acs.org.
■ AUTHOR INFORMATION
Corresponding Author*[email protected]
FundingM.S., M.C. and N.B. are funded by the Swiss National ScienceFoundat ion , through the Ambiz ione Fe l lowship(PZ00P2_136853) and the Stipend Professorship(PP00P2_150536). N.B. and M.C. are also supported by theUniversity of Fribourg. J.D.J.R and J.E.M are supported by theNCCR-MUST from the Swiss National Science Foundation.N.S. is supported by a European Research Council (ERC)Starting Independent Researcher Fellowship under grantagreement No. 279587. E.B.D. is funded by a SABIC Post-Doctoral Fellowship at King Abdullah University of Scienceand Technology.
NotesThe authors declare no competing financial interest.
■ ACKNOWLEDGMENTSWe thank Professor Eric Vauthey and Romain Letrun(University of Geneva) for putting at our disposition thefluorescence up-conversion setup and helping with theexperiment. We like to also thank John R. Tumbleston andHarald Ade (Department of Physics, North Carolina StateUniversity), as well as Martin Pfannmoller and Rasmus R.Schroder (CellNetworks, BioQuant, Heidelberg University,Heidelberg, Germany) for their important contribution withrespect to scanning transmission X-ray- and transmissionelectron microscopy. We acknowledge Dr. Lee Richter andDr. Dean Delongchamp from NIST for useful discussionconcerning microstructure control using processing additives.
■ REFERENCES(1) Green, M. A.; Emery, K.; Hishikawa, Y.; Warta, W.; Dunlop, E. D.Prog. Photovoltaics: Res. Appl. 2014, 22, 701.(2) You, J.; Dou, L.; Yoshimura, K.; Kato, T.; Ohya, K.; Moriarty, T.;Emery, K.; Chen, C.-C.; Gao, J.; Li, G.; Yang, Y. Nat. Commun. 2013,4, 1446.(3) Thompson, B. C.; Frechet, J. M. J. Angew. Chem., Int. Ed. 2008,47, 58.(4) Yu, G.; Gao, J.; Hummelen, J. C.; Wudl, F.; Heeger, A. J. Science1995, 270, 1789.(5) Brabec, C. J.; Sariciftci, N. S.; Hummelen, J. C. Adv. Funct. Mater.2001, 11, 15.(6) Beaujuge, P. M.; Frechet, J. M. J. J. Am. Chem. Soc. 2011, 133,20009.(7) Lee, J. K.; Ma, W. L.; Brabec, C. J.; Yuen, J.; Moon, J. S.; Kim, J.Y.; Lee, K.; Bazan, G. C.; Heeger, A. J. J. Am. Chem. Soc. 2008, 130,3619.(8) Zhao, Y.; Xie, Z.; Qu, Y.; Geng, Y.; Wang, L. Appl. Phys. Lett.2007, 90, 043504.(9) Peet, J.; Kim, J. Y.; Coates, N. E.; Ma, W. L.; Moses, D.; Heeger,A. J.; Bazan, G. C. Nat. Mater. 2007, 6, 497.(10) Hoppe, H.; Sariciftci, N. S. J. Mater. Chem. 2006, 16, 45.(11) Ma, W.; Yang, C.; Gong, X.; Lee, K.; Heeger, A. J. Adv. Funct.Mater. 2005, 15, 1617.(12) Shaheen, S. E.; Brabec, C. J.; Sariciftci, N. S.; Padinger, F.;Fromherz, T.; Hummelen, J. C. Appl. Phys. Lett. 2001, 78, 841.(13) Huang, Y.; Kramer, E. J.; Heeger, A. J.; Bazan, G. C. Chem. Rev.2014, 114, 7006.(14) Liu, F.; Gu, Y.; Shen, X.; Ferdous, S.; Wang, H.-W.; Russell, T.P. Prog. Polym. Sci. 2013, 38, 1990.(15) Westacott, P.; Tumbleston, J. R.; Shoaee, S.; Fearn, S.; Bannock,J. H.; Gilchrist, J. B.; Heutz, S.; de, M. J.; Heeney, M.; Ade, H.;
Journal of the American Chemical Society Article
DOI: 10.1021/ja510032xJ. Am. Chem. Soc. 2015, 137, 2908−2918
2917

Durrant, J.; McPhail, D. S.; Stingelin, N. Energy Environ. Sci. 2013, 6,2756.(16) Ruderer, M. A.; Meier, R.; Porcar, L.; Cubitt, R.; Muller-Buschbaum, P. J. Phys. Chem. Lett. 2012, 3, 683.(17) Pfannmoller, M.; Flugge, H.; Benner, G.; Wacker, I.; Kowalsky,W.; Schroder, R. R. Synth. Met. 2012, 161, 2526.(18) Miller, N. C.; Cho, E.; Gysel, R.; Risko, C.; Coropceanu, V.;Miller, C. E.; Sweetnam, S.; Sellinger, A.; Heeney, M.; McCulloch, I.;Bredas, J.-L.; Toney, M. F.; McGehee, M. D. Adv. Energy Mater. 2012,2, 1208.(19) Collins, B. A.; Tumbleston, J. R.; Ade, H. J. Phys. Chem. Lett.2011, 2, 3135.(20) Mayer, A. C.; Toney, M. F.; Scully, S. R.; Rivnay, J.; Brabec, C.J.; Scharber, M.; Koppe, M.; Heeney, M.; McCulloch, I.; McGehee, M.D. Adv. Funct. Mater. 2009, 19, 1173.(21) Bartelt, J. A.; Beiley, Z. M.; Hoke, E. T.; Mateker, W. R.;Douglas, J. D.; Collins, B. A.; Tumbleston, J. R.; Graham, K. R.;Amassian, A.; Ade, H.; Frechet, J. M. J.; Toney, M. F.; McGehee, M.D. Adv. Energy Mater. 2013, 3, 364.(22) Jamieson, F. C.; Domingo, E. B.; McCarthy-Ward, T.; Heeney,M.; Stingelin, N.; Durrant, J. R. Chem. Sci. 2012, 3, 485.(23) Kesava, S. V.; Fei, Z.; Rimshaw, A. D.; Wang, C.; Hexemer, A.;Asbury, J. B.; Heeney, M.; Gomez, E. D. Adv. Energy Mater. 2014, 4,1400116.(24) Buchaca-Domingo, E.; Ferguson, A. J.; Jamieson, F. C.;McCarthy-Ward, T.; Shoaee, S.; Tumbleston, J. R.; Reid, O. G.; Yu,L.; Madec, M. B.; Pfannmoller, M.; Hermerschmidt, F.; Schroder, R.R.; Watkins, S. E.; Kopidakis, N.; Portale, G.; Amassian, A.; Heeney,M.; Ade, H.; Rumbles, G.; Durrant, J. R.; Stingelin, N. Mater. Horiz.2014, 1, 270.(25) Dou, F.; Buchaca-Domingo, E.; Sakowicz, M.; Zhang, X.;Stingelin, N.; Silva, C. In SPIE: Physical Chemistry of Interfaces andNanomaterials XII, San Diego, CA, 2013; Vol. 8811, p 88111J.(26) Wang, T.; Pearson, A. J.; Lidzey, D. G. J. Mater. Chem. C 2013,1, 7266.(27) Kozub, D. R.; Vakhshouri, K.; Kesava, S. V.; Wang, C.;Hexemer, A.; Gomez, E. D. Chem. Commun. (Cambridge, U.K.) 2012,48, 5859.(28) Rance, W. L.; Ferguson, A. J.; McCarthy-Ward, T.; Heeney, M.;Ginley, D. S.; Olson, D. C.; Rumbles, G.; Kopidakis, N. ACS Nano2011, 5, 5635.(29) Savenije, T. J.; Grzegorczyk, W. J.; Heeney, M.; Tierney, S.;McCulloch, I.; Siebbeles, L. D. A. J. Phys. Chem. C 2010, 114, 15116.(30) Baklar, M.; Wobkenberg, P. H.; Sparrowe, D.; Goncalves, M.;McCulloch, I.; Heeney, M.; Anthopoulos, T.; Stingelin, N. J. Mater.Chem. 2010, 20, 1927.(31) Hamadani, B. H.; Gundlach, D. J.; McCulloch, I.; Heeney, M.Appl. Phys. Lett. 2007, 91, 243512.(32) Mcculloch, I.; Heeney, M.; Bailey, C.; Genevicius, K.; I, M.;Shkunov, M.; Sparrowe, D.; Tierney, S.; Wagner, R.; Zhang, W. M.;Chabinyc, M. L.; Kline, R. J.; Mcgehee, M. D.; Toney, M. F. Nat.Mater. 2006, 5, 328.(33) Paraecattil, A. A.; Banerji, N. J. Am. Chem. Soc. 2014, 136, 1472.(34) Howard, I. A.; Mauer, R.; Meister, M.; Laquai, F. J. Am. Chem.Soc. 2010, 132, 14866.(35) De, S.; Kesti, T.; Maiti, M.; Zhang, F.; Inganaes, O.; Yartsev, A.;Pascher, T.; Sundstrom, V. Chem. Phys. Lett. 2008, 350, 14.(36) Barker, A. J.; Chen, K.; Hodgkiss, J. M. J. Am. Chem. Soc. 2014,136, 12018.(37) Burke, T. M.; McGehee, M. D. Adv. Mater. 2014, 26, 1923.(38) Gelinas, S.; Rao, A.; Kumar, A.; Smith, S. L.; Chin, A. W.; Clark,J.; van der Poll, T. S.; Bazan, G. C.; Friend, R. H. Science 2014, 343,512.(39) Bittner, E. R.; Silva, C. Nat. Commun. 2014, 5, 3119.(40) Howard, I. A.; Etzold, F.; Laquai, F.; Kemerink, M. Adv. EnergyMater. 2014, 4, 1301743.(41) Grancini, G.; Maiuri, M.; Fazzi, D.; Petrozza, A.; Egelhaaf, H. J.;Brida, D.; Cerullo, G.; Lanzani, G. Nat. Mater. 2013, 12, 29.
(42) Jailaubekov, A. E.; Willard, A. P.; Tritsch, J. R.; Chan, W.-L.; Sai,N.; Gearba, R.; Kaake, L. G.; Williams, K. J.; Leung, K.; Rossky, P. J.;Zhu, X. Y. Nat. Mater. 2013, 12, 66.(43) Vithanage, D. A.; Devizis, A.; Abramavicius, V.; Infahsaeng, Y.;Abramavicius, D.; MacKenzie, R. C. I.; Keivanidis, P. E.; Yartsev, A.;Hertel, D.; Nelson, J.; Sundstrom, V.; Gulbinas, V. Nat. Commun.2013, 4, 2334.(44) Vandewal, K.; Albrecht, S.; Hoke, E. T.; Graham, K. R.; Widmer,J.; Douglas, J. D.; Schubert, M.; Mateker, W. R.; Bloking, J. T.;Burkhard, G. F.; Sellinger, A.; Frechet, J. M. J.; Amassian, A.; Riede, M.K.; McGehee, M. D.; Neher, D.; Salleo, A. Nat. Mater. 2013, 13, 63.(45) Dimitrov, S. D.; Bakulin, A. A.; Nielsen, C. B.; Schroeder, B. C.;Du, J.; Bronstein, H.; McCulloch, I.; Friend, R. H.; Durrant, J. R. J. Am.Chem. Soc. 2012, 134, 18189.(46) Bakulin, A. A.; Rao, A.; Pavelyev, V. G.; van Loosdrecht, P. H.M.; Pshenichnikov, M. S.; Niedzialek, D.; Cornil, J.; Beljonne, D.;Friend, R. H. Science 2012, 335, 1340.(47) Caruso, D.; Troisi, A. Proc. Natl. Acad. Sci. U.S.A. 2012, 109,13498.(48) Scarongella, M.; Paraecattil, A. A.; Buchaca-Domingo, E.;Douglas, J. D.; Beaupre, S.; McCarthy-Ward, T.; Heeney, M.; Moser, J.E.; Leclerc, M.; Frechet, J. M. J.; Stingelin, N.; Banerji, N. J. Mater.Chem. A 2014, 2, 6218.(49) Miller, N. C.; Cho, E.; Junk, M. J. N.; Gysel, R.; Risko, C.; Kim,D.; Sweetnam, S.; Miller, C. E.; Richter, L. J.; Kline, R. J.; Heeney, M.;McCulloch, I.; Amassian, A.; Acevedo-Feliz, D.; Knox, C.; Hansen, M.R.; Dudenko, D.; Chmelka, B. F.; Toney, M. F.; Bredas, J.-L.;McGehee, M. D. Adv. Mater. 2012, 24, 6071.(50) Spano, F. C.; Silva, C. Annu. Rev. Phys. Chem. 2014, 65, 477.(51) Faist, M. A.; Keivanidis, P. E.; Foster, S.; Wobkenberg, P. H.;Anthopoulos, T. D.; Bradley, D. D. C.; Durrant, J. R.; Nelson, J. J.Polym. Sci., Part B: Polym. Phys. 2011, 49, 45.(52) Guilbert, A. A. Y.; Schmidt, M.; Bruno, A.; Yao, J.; King, S.;Tuladhar, S. M.; Kirchartz, T.; Alonso, M. I.; Goni, A. R.; Stingelin, N.;Haque, S. A.; Campoy-Quiles, M.; Nelson, J. Adv. Funct. Mater. 2014,6972.(53) Banerji, N. J. Mater. Chem. C 2013, 1, 3052.(54) Furstenberg, A.; Julliard, M. D.; Deligeorgiev, T. G.; Gadjev, N.I.; Vasilev, A. A.; Vauthey, E. J. Am. Chem. Soc. 2006, 128, 7661.(55) Jimenez, R.; Fleming, G. R.; Kumar, P. V.; Maroncelli, M.Nature 1994, 369, 471.(56) Banerji, N.; Cowan, S.; Leclerc, M.; Vauthey, E.; Heeger, A. J. J.Am. Chem. Soc. 2010, 132, 17459.(57) Banerji, N.; Cowan, S.; Vauthey, E.; Heeger, A. J. J. Phys. Chem.C 2011, 115, 9726.(58) Wells, N. P.; Boudouris, B. W.; Hillmyer, M. A.; Blank, D. A. J.Phys. Chem. C 2007, 111, 15404.(59) Meskers, S. C. J.; Hubner, J.; Oestreich, M.; Bassler, H. J. Phys.Chem. B 2001, 105, 9139.(60) Reid, O. G.; Rumbles, G. J. Phys. Chem. Lett. 2013, 4, 2348.(61) Guo, J.; Ohkita, H.; Benten, H.; Ito, S. J. Am. Chem. Soc. 2009,131, 16869.(62) Hwang, I.-W.; Kim, J. Y.; Cho, S.; Yuen, J.; Coates, N.; Lee, K.;Heeney, M.; McCulloch, I.; Moses, D.; Heeger, A. J. J. Phys. Chem. C2008, 112, 7853.(63) Hodgkiss, J. M.; Albert-Seifried, S.; Rao, A.; Barker, A. J.;Campbell, A. R.; Marsh, R. A.; Friend, R. H. Adv. Funct. Mater. 2012,22, 1567.(64) Lanzani, G. The Photophysics behind Photovoltaics and Photonics;Wiley-VCH Verlag & Co: Weinheim, Germany, 2012.(65) Cabanillas-Gonzalez, J.; Virgili, T.; Gambetta, A.; Lanzani, G.;Anthopoulos, T.; de Leeuw, D. Phys. Rev. Lett. 2006, 96, 106601.(66) Devizis, A.; Hertel, D.; Meerholz, K.; Gulbinas, V.; Moser, J. E.Org. Electron. 2014, 15, 3729.(67) Lee, M. J.; Gupta, D.; Zhao, N.; Heeney, M.; McCulloch, I.;Sirringhaus, H. Adv. Funct. Mater. 2011, 21, 932.(68) Noriega, R.; Rivnay, J.; Vandewal, K.; Koch, F. P. V.; Stingelin,N.; Smith, P.; Toney, M. F.; Salleo, A. Nat. Mater. 2013, 12, 1038.
Journal of the American Chemical Society Article
DOI: 10.1021/ja510032xJ. Am. Chem. Soc. 2015, 137, 2908−2918
2918