Embed Size (px)
Citation preview

Louisiana State UniversityLSU Digital Commons
LSU Master's Theses Graduate School
2016
A Climatological Exploration of Land Change andLand Use on Lightning Patterns over LouisianaNicholas James SokolLouisiana State University and Agricultural and Mechanical College, [email protected]
Follow this and additional works at: https://digitalcommons.lsu.edu/gradschool_theses
Part of the Social and Behavioral Sciences Commons
This Thesis is brought to you for free and open access by the Graduate School at LSU Digital Commons. It has been accepted for inclusion in LSUMaster's Theses by an authorized graduate school editor of LSU Digital Commons. For more information, please contact [email protected].
Recommended CitationSokol, Nicholas James, "A Climatological Exploration of Land Change and Land Use on Lightning Patterns over Louisiana" (2016).LSU Master's Theses. 4406.https://digitalcommons.lsu.edu/gradschool_theses/4406

A Climatological Exploration of
Land Change and Land Use on Lightning Patterns over Louisiana
A Thesis
Submitted to the Graduate Faculty of the
Louisiana State University and
Agricultural and Mechanical College
in partial fulfillment of the
requirements for the degree of
Master of Science
in
The Department of Geography and Anthropology
by
Nicholas J. Sokol
B.S., Towson University, 2015
December 2016

ii
Acknowledgments
The completion of this thesis would not have been possible without several people who
were there for me. I must extend most heartfelt thanks to my family, who have supported my
academic endeavors through innumerable hardships. After them, many of my sincerest thanks go
out to the faculty members at Louisiana State University that have impacted my life in many
ways. I also must thank my advisor Dr. Robert Rohli, who has provided unyielding support and
feedback on my work since my time at LSU began. Without his hard work, dedication, and
assistance, I doubt I would have completed this thesis. I also thank Dr. Carol Friedland for
granting me an opportunity to work alongside individuals in the College of Engineering at LSU.
In addition, I would like to thank my committee members: Dr. Nan Walker (Oceanography), Dr.
Michael Leitner (Geography and Anthropology), and Dr. Todd Moore (Geography and
Environmental Planning at Towson University). Each of these faculty members provided
amazing feedback and counsel on how to make my thesis the best it could be! My gratitude goes
to everyone else in the Geography and Anthropology (G&A) department. My interactions with
everyone in G&A have made me aware of so many things in life and ultimately changed me as a
person.
I would be remiss if I did not mention my gratitude to all my friends and advisors back in
Maryland, and other parts of the world. You all have supported me since before I gave graduate
school a thought and provided nothing but love and positive energy. Every time I returned home
you listened to me whine about being broke and how much I despised the heat and humidity in
Louisiana. In return you responded with ways I could make the best of it, took me on crazy
adventures to get my mind off work, and spent countless hours enjoying my dark sense of humor
– and that kept me going. Thank you all!

iii
Table of Contents
ACKNOWLEDGMENTS………………………………………………………………………...ii
LIST OF TABLES………………………………………………………………………………..iv
LIST OF FIGURES……………………………………………………………………………….v
ABSTRACT…………………………………………………………………………………….viii
I. INTRODUCTION………………………………………………………………………………1
II. LITERATURE REVIEW………………………………………………………………………6
2.1 Diurnal Lightning Studies……………………………………………………………...6
2.2 Seasonal Lightning Studies……………………………………………………………..7
2.3 Lightning Frequency……………………………………………………………………8
2.4 Landsat Based Land Change Studies………………………………………………….12
2.5 Land Change Influences on Lightning………………………………………………...14
III. DATA/METHODS…………………………………………………………………………..16
3.1 Landsat Land Classification Data……………………………………………………..16
3.2 NOAA/Vaisala NLDN Lightning Data……………………………………………….28
3.3 Lightning Climatology………………………………………………………………...31
3.4 Linear Regression with a Categorical Variable……………………………………….31
3.5 ANOVA and Scheffé’s 95% Confidence Interval Test……………………………….31
3.6 Geographically Weighted Regression…………………………………………………33
IV. RESULTS AND DISCUSSION…………………………………………………………….35
4.1 Lightning Climatology………………………………………………………………..35
4.2 Linear Regression with a Categorical Variable………………………………………57
4.3 ANOVA and Scheffé’s Test…………………………………………………………..61
4.4 GeographicallyWeighted Regression………………………………………………... 67
V. CONCLUSION……………………………………………………………………………….73
REFERENCES…………………………………………………………………………………..76
VITA……………………………………………………………………………………………..85

iv
List of Tables
Table 3.1 Colors representing each LULC type within the classification image maps ………....22
Table 4.1 Results of trend line analysis………………………………………………………….54
Table 4.2 Results of categorical linear regression for 1996 and 2001…………………………...60
Table 4.3 Results of categorical linear regression for 2006 and 2010…………………………...61
Table 4.4 Results of ANOVA……………………………………………………………………62
Table 4.5 Results of Scheffé’s test for 1996 …………………………………………………….63
Table 4.6 Results of Scheffé’s test for 2001 …………………………………………………….64
Table 4.7 Results of Scheffé’s test for 2006 …………………………………………………….65
Table 4.8 Results of Scheffé’s test for 2010 ……………………………………………….........67
v
List of Figures
Figure 1.1 Graupel, hail, sleet, and snow………………………………………………………….1
Figure 1.2 Process of a stepped leader …………………………………………………………....2
Figure 1.3 Lightning fatalities in the United States from 1940 to 2015…………………………..3
Figure 2.1 Lightning climatology derived from LIS/OTD ……………………………………….8
Figure 2.2 Lightning climatology derived from the worldwide lightning location network……...9
Figure 3.1 Louisiana land classification map for 1996…………………………………………..18
Figure 3.2 As in Figure 3.2, for 2001……………………………………………………………19
Figure 3.3 As in Figure 3.2, for 2006…………………………………………………………....20
Figure 3.4 As in Figure 3.2, for 2010……………………………………………………………21
Figure 3.5 Majority resampled Louisiana land classification for 1996………………………….23
Figure 3.6 As in Figure 3.5, for 2001……………………………………………………………24
Figure 3.7 As in Figure 3.5, for 2006……………………………………………………………25
Figure 3.8 As in Figure 3.5, for 2010……………………………………………………………26
Figure 3.9 LULC totals for the years 1996, 2001, 2006, and 2010……………………………...27
Figure 3.10 NOAA derived NLDN CG lightning product………………………………………28
Figure 3.11 Aligned CG lightning raster with resampled Louisiana Land Classes……………...30

vi
Figure 4.1 Histogram of CG lightning along with frequency map for 1995………………….....36
Figure 4.2 As in Figure 4.1, for 1996……………………………………………………………37
Figure 4.3 As in Figure 4.1, for 1997……………………………………………………………38
Figure 4.4 As in Figure 4.1, for 1998……………………………………………………………39
Figure 4.5 As in Figure 4.1, for 1999……………………………………………………………40
Figure 4.6 As in Figure 4.1, for 2000……………………………………………………………41
Figure 4.7 As in Figure 4.1, for 2001……………………………………………………………42
Figure 4.8 As in Figure 4.1, for 2002……………………………………………………………43
Figure 4.9 As in Figure 4.1, for 2003……………………………………………………………44
Figure 4.10 As in Figure 4.1, for 2004…………………………………………………………..45
Figure 4.11 As in Figure 4.1, for 2005…………………………………………………………..46
Figure 4.12 As in Figure 4.1, for 2006…………………………………………………………..47
Figure 4.13 As in Figure 4.1, for 2007…………………………………………………………..48
Figure 4.14 As in Figure 4.1, for 2008…………………………………………………………..49
Figure 4.15 As in Figure 4.1, for 2009…………………………………………………………..50
Figure 4.16 As in Figure 4.1, for 2010…………………………………………………………..51
Figure 4.17 As in Figure 4.1, for 2011…………………………………………………………..52

vii
Figure 4.18 Bar graph showing the total regional frequency of CG lightning flashes with a trend
line fitted (top), and a map showing the spatial distribution of the 4 km x 4 km pixels across the
region for all years 1995–2011………………………………………………………..…………53
Figure 4.19 Boxplots of each LULC type and their mean, interquartile range, and extremes of
CG lightning, by 4 km x 4 km pixel, for 1996 (top) and 2001 (bottom)………………………...55
Figure 4.20 As in Figure 4.19, for 2006 and 2010……………………………………………….56
Figure 4.21 Residuals from a linear regression test between 1996 (top) and 2001 (bottom) LULC
and lightning ……………………………...……………………………………………………..57
Figure 4.22 As in Figure 4.21, for 2006 and 2010……….………………………………………58
Figure 4.23 Resulting conditional number, local R2, standard residuals, and predicted values
from GWR output between total lightning frequency between 1996 land classes and total
lightning. ………………………………………………………………………………..…….....70
Figure 4.24 As in Figure 4.23, for 2001………………………………………………………....71
Figure 4.25 As in Figure 4.23, for 2006…………………………………………………………72
Figure 4.26 As in Figure 4.24, for 2010…………………………………………………………73

viii
Abstract
Lightning is one of the most impactful weather phenomena but yet little precise and
accurate information is known about how its frequency is impacted climatologically by changes
in land use/land cover (LULC). This is unfortunate because LULC changes occur ubiquitously
as the human influence on the environment proceeds. This research uses NOAA’s gridded
annual lightning data from the National Lightning Detection Network (NLDN), and LULC
classification data from the NOAA coastal change analysis program (C-CAP) to analyze
frequency changes in lightning across a swath of Louisiana, coastal Mississippi, and coastal east
Texas over the years 1995–2011. Results suggest that urban areas have the highest frequency of
CG lightning, but there is little variation in lightning over the course of the temporal period
examined. The implications of this work will provide planners and regional analysts more
insight as to how some LULC categories attract more lightning than others, as well as how CG
lightning is sporadic and complicated to model. Some limitations of this research are that the
lightning data utilized in this study are not point data, complicating the measurement of spatial
shifts in lightning occurrence since raster cells are fixed to a specific latitude and longitude.
Therefore, continued work is needed to further understand the relationship between human
influence on the landscape and the lightning risk. Results presented here and in future work will
be useful to environmental planners as they work to understand and mitigate the lightning
hazard.

1
Chapter 1. Introduction
Why Study Lightning?
Lightning is a phenomenon that has perplexed, terrified, amazed, and devastated humans
and other organisms. It is one of the world’s most dangerous, but often underestimated, severe
weather phenomena and it continues to claim dozens of lives every year in the United States
(Curran et al., 2000; NWS, 2016; Holle, 2016).
Fulminologists—scientists who study atmospheric electricity—have generated substantial
information regarding the development of lightning. Lightning is formed when small particles of
ice – known as graupel (Figure 1.1) – form inside a cloud. The graupel is ionized through
collisions with other particles in the cloud that are driven by powerful updrafts; this process is
known as an electron avalanche (Cooray, 2015).
Figure 1.1 Graupel, hail, sleet, and snow, respectively (NWS, 2016).
Once enough electrically charged particles surpass the threshold of atmospheric
insulation, a stepped leader (Figure 1.2)—a concentrated current of energy that is negatively or
positively charged propagating toward the surface—will connect with a vertically-propagating
stepped leader from the surface or object on Earth, and the resulting phenomena is the lightning
flash (Cooray, 2015). Thunder is the acoustic aftermath of a lightning flash, caused by rapid

2
heating and expansion of the surrounding air, which has been recorded to reach temperatures of
up to 6000 K (Rakov and Uman, 2003).
Most people who are aware of the hazard of lightning often jest about the statistical
probability of being struck, which is 1 in 1,042,000 (NWS, 2013). This fact likely causes many
to neglect the safety methods disseminated by the National Oceanic and Atmospheric
Association (NOAA) and the National Weather Service (NWS), and fatalities continue to occur.
However, a brief analysis of lightning fatalities shows that the total has decreased over time for
the country and Louisiana (Figure 1.3; Curran et al., 2000; Roeder et al., 2015; NWS, 2016).
Louisiana is ranked ninth among the states in lightning-induced deaths per year (Holle,
2016), despite having a population that ranks 25th. Louisiana often has the second highest rate of
lightning frequency in the United States. Florida, Texas, Mississippi, and Alabama also have
high flash frequencies (Holle, 2016). Florida’s high flash rate exists because of its proximity to
the atmospheric features required to create a thunderstorm, such as convection, moisture, and
heat (Zhu et al., 2015). Louisiana is also in a similar position; although it lacks the persistent
convective enhancement of peninsular Florida, the state has a constant supply of warm, moist air
from the Gulf of Mexico that fuels atmospheric
Figure 1.2 The process of a stepped leader and how it creates a Cloud to ground lightning flash.
Negative (positive) channels connect with positive (negative) channels propagating from the surface
(NWS, 2016).

3
instability for a substantial number of days throughout the year. In addition to moisture (Lericos
et al., 2002) and pollution (Smith et al., 2005).
Instrumentation designed to detect lightning has improved in recent decades. This has
allowed atmospheric scientists to create climatological averages of lightning over specific areas,
and of course to research the spatio-temporal patterns of lightning. Although there have been
many tools for examining lightning in past years (e.g. boys cameras, cloud chambers, lightning
chimes), modern ground-based electromagnetic sensor and orbiting satellites in space keep a far
more accurate and precise count of lightning totals on a near-real-time basis over far wider areas
than ever before.
Despite their many advantages, weaknesses of the modern lightning detection systems
exist. Specifically, ground-based measurement systems often detect electromagnetic
Figure 1.3 Total lightning fatalities in the U.S., 1940 to 2015 (bars), compared with
fatalities from other natural hazards (NWS, 2016).

4
perturbations only to a limited height of the atmosphere, whereas satellite instrumentation can
only sense the perturbations down to a limited depth of the atmosphere and may confuse
lightning with other distortions of light in the Earth-atmosphere system (Boccippio et al., 2000;
Boccippio et al., 2002; Ushio et al., 2002; Mach et al., 2007; Beirle et al., 2014, Buechler et al.,
2014). Studies have consistently shown that ground-based detection systems are more precise,
accurate, and reliable than their space-based counterparts (Idone et al., 1998; Biagi et al., 2007;
Holle, 2014; Mallick et al., 2014). Rapid technological advancements continue to further
lightning observation and study.
Lightning detection systems consistently show that strikes are more frequent on tall,
ellipsoid-shaped buildings and surfaces that can generate a large electrical field (Rakov and
Uman, 2003). In natural environments, these land covers consist of open fields or bodies of
water, tall trees, and high points on a mountain. Built-up environmental features such as parking
lots, skyscrapers, communication towers, sports fields, farm plots, and other anthropogenic
landscapes are also favored. Data are now available to assess the validity of the notion that land
use / land cover (LULC) may modify the spatio-temporal patterns of lightning strikes.
An improved understanding of the spatiotemporal patterns of lightning frequency is
important for protecting life and property. Additional understanding of the relationship between
natural and anthropogenic landscapes and lightning can improve protection of life and property.
The objectives of this thesis are to:
1.) Analyze the spatio-temporal distribution of cloud-to-ground (CG) lightning over the
northern Gulf Coast region.
2.) Investigate the influence of land classes on lightning totals and patterns over the
northern Gulf Coast region.

5
Results from this research will not only serve the people of the Louisiana Gulf Coast region, but
will also be useful elsewhere for mitigating lightning damage.
Chapter 2 will provide a more detailed literature review of lightning and LULC change
detection research in recent decades. Chapter 3 will explain the data and methods used to
address the objectives listed above. In Chapter 4, the results and their implications will be
presented. Finally, Chapter 5 will include a summary of the major findings, along with
suggestions for future research.

6
Chapter 2. Literature Review
“An investment in knowledge pays the best interest.”
– Benjamin Franklin
While a majority of recent lightning research is dedicated to understanding the physics of
lightning, recent studies have focused on extracting spatio-temporal patterns from lightning data
(Roeder et al., 2015; Cecil et al., 2015; Dowdy, 2016). In addition, LULC due to anthropogenic
activity has also been explored through geographic research methods (Contiu & Gorza, 2016;
Maclaurin and Leyk, 2016). This chapter will review the spatio-temporal and other
geographically-focused studies.
2.1 Diurnal Lightning Studies
Diurnal patterns of lightning have been investigated thoroughly. Wallace (1975) found
that thunderstorm activity depends upon diurnal kinematic and thermodynamic variables in the
U.S., with most locations experiencing a peak in severe thunderstorms in the afternoon.
Easterling and Robinson (1985) divided the U.S. into nine regions based on diurnal thunderstorm
tendencies and found that the central region’s thunderstorms occur mostly at night, while eastern
and western thunderstorms display an afternoon preference, and those in the Northeast and the
Pacific coast are rare. Lόpez and Holle (1998) showed that Colorado storms are more commonly
characterized by a west to east shift in maximum frequency from early morning to late evening,
while Florida has lightning patterns that tend to be maximized between Cape Canaveral and
Orlando in the afternoon. Carey and Rutledge (2003) analyzed the diurnal characteristics of
lightning over the Kansas/Colorado border to Minnesota; their results showed that the amperage
of a lightning flash depends upon the strength, size, and location of the storm, but overall the
most powerful flashes occur in the afternoon. Smith et al. (2005) found that over the Gulf of

7
Mexico from 1989 – 2002, warm-season lightning is most prevalent during the day over areas
along the coast, and during the night the lightning occurs most frequently over the Gulf.
More recent diurnal studies of lightning have utilized data from recently developed
observation techniques such as the World-Wide Lightning Location Network (WWLLN;
Jacobsen et al., 2006). Rudlosky & Shea (2013) compared results of the WWLLN to the
Lightning Imaging Sensor (LIS) derived lightning counts and found strong similarities between
the two data sets. Utilizing data from the LIS satellite to compile a spatial pattern analysis of
lightning, Sen Roy and Balling (2013) showed that most lightning flashes occur over land during
the day with very few occurring at night. Blakeslee et al. (2014) utilized LIS/Optical Transient
Detector (OTD) remotely-sensed data to determine that global lightning maxima tends to occur
most frequently in late afternoon, with minima tending to occur in the late morning. Holle (2014)
found evidence using data from the National Lightning Detection Network (NLDN) that, over
the U.S., lightning tends to occur between 1200 and 1800 local time, but occurrences before
noon are more common over areas along the Gulf Coast and portions of the East Coast than
elsewhere. Virts et al. (2015) found summer frequencies of lightning strikes to be maximized
during the late afternoon and early evening, in general across the contiguous U.S., with lightning
tending to occur most frequently from sunrise to late morning in the northern Gulf of Mexico –
showing evidence of strong regional influence on diurnal lightning patterns.
2.2 Seasonal Lightning Studies
Seasonal lightning studies have been conducted around the world. Collier et al. (2006)
reported that in southern Africa the highest flash rate is in the summer over Madagascar and
South Africa. In a global study of seasonal lightning variability Yang et al. (2009) determined
that Africa and Asia contains higher rates of CG lightning than any other location on the globe.

8
Tinmaker et al. (2014) identified a bimodal pattern of frequency over the Indian Seas, with peaks
in April and October, corresponding to the timing of the monsoon front. Virts et al. (2015)
showed that summer is the most active lightning season over the Gulf of Mexico and
surrounding coastal areas and that most lightning activity is concentrated over the land. A
lightning climatology for the U.S. Southwest in conjunction with the North American monsoon
showed a drastic increase in lightning during the summer, when the monsoon period is at its
strongest (Holle and Murphy 2015). Dowdy (2016) concluded that ENSO has the strongest
influence on seasonal lightning variability around the globe.
2.3 Lightning Frequency
Climatological studies of lightning across the U.S. have been completed for various
regions, with data for global tropical coverage (Figure 2.1) and global coverage (Figure 2.2) also
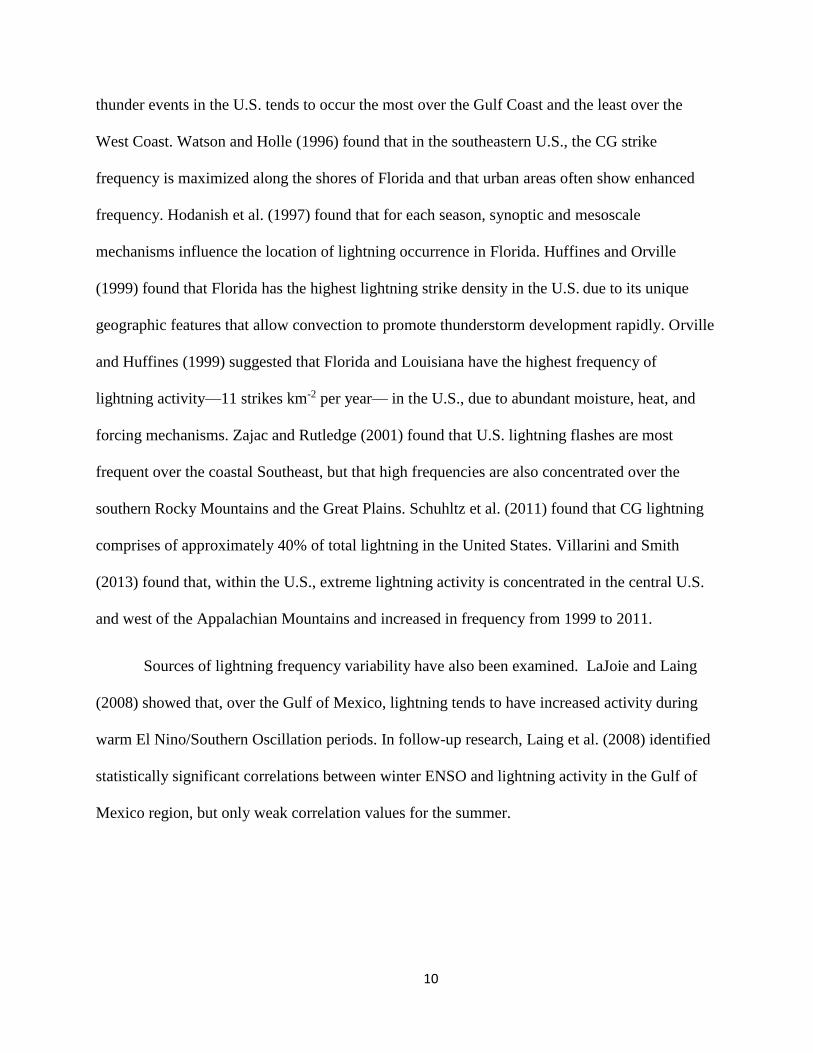
having become recently available. Changnon (1988a, 1988b) showed that the peak frequency of
Figure 2.1 A lightning climatology derived from the Lightning Imaging Sensor / Optical
Transient Detector sensor, which is aboard the Tropical Rainfall Measuring Mission satellite
(NASA, 2016).

9
Figure 2.2 A lightning climatology derived from the Worldwide Lightning Location Network showing the
mean lightning flashes per hour per year (2008–2011) per km2 (Virts et al., 2013).
10
thunder events in the U.S. tends to occur the most over the Gulf Coast and the least over the
West Coast. Watson and Holle (1996) found that in the southeastern U.S., the CG strike
frequency is maximized along the shores of Florida and that urban areas often show enhanced
frequency. Hodanish et al. (1997) found that for each season, synoptic and mesoscale
mechanisms influence the location of lightning occurrence in Florida. Huffines and Orville
(1999) found that Florida has the highest lightning strike density in the U.S. due to its unique
geographic features that allow convection to promote thunderstorm development rapidly. Orville
and Huffines (1999) suggested that Florida and Louisiana have the highest frequency of
lightning activity—11 strikes km-2 per year— in the U.S., due to abundant moisture, heat, and
forcing mechanisms. Zajac and Rutledge (2001) found that U.S. lightning flashes are most
frequent over the coastal Southeast, but that high frequencies are also concentrated over the
southern Rocky Mountains and the Great Plains. Schuhltz et al. (2011) found that CG lightning
comprises of approximately 40% of total lightning in the United States. Villarini and Smith
(2013) found that, within the U.S., extreme lightning activity is concentrated in the central U.S.
and west of the Appalachian Mountains and increased in frequency from 1999 to 2011.
Sources of lightning frequency variability have also been examined. LaJoie and Laing
(2008) showed that, over the Gulf of Mexico, lightning tends to have increased activity during
warm El Nino/Southern Oscillation periods. In follow-up research, Laing et al. (2008) identified
statistically significant correlations between winter ENSO and lightning activity in the Gulf of
Mexico region, but only weak correlation values for the summer.

11
Synoptic-scale spatial patterns have revealed previously unknown characteristics of
thunderstorms. In analyzing summer thunderstorm features over the southeastern U.S., Murphy
and Konrad (2005) found, not surprisingly, that larger thunderstorms tend to produce more
lightning than more localized thunderstorms. Williams (2005) determined that, while lightning
is sensitive to temperature when analyzed under smaller temporal scales, under more extensive
temporal analysis the connection diminishes for global lightning occurrences.
Lightning climatologies focused elsewhere in the world have also been completed in
recent years, in response to newly-available and detailed lightning data availability. Burrows et
al. (2002) reported that Canadian lightning flashes are concentrated most heavily in southern
Alberta, southeast of Nova Scotia, and southern Ontario. Burrows and Kochtubajda (2010)
concurred, concluding that Canadian lightning maxima tends to occur nearest to the U.S. border
in areas where heat, moisture, and instability tend to be abundant. In a review of lightning in the
tropical Western Hemisphere, Pinto et al. (2007) found that lightning flash densities vary from
19 to 65 flashes km-2 year-1. Antonescu and Burecea (2010) showed that the highest density of
lightning strikes in Romania are associated with the Romanian plain convergence zone. Makela
et al. (2011) found that median values of lightning density per day are similar between the U.S.
and Finland, but maximum values per day are much different between the two nations. Virts et
al. (2013) showed that the highest lightning frequency globally occurs over tropical Africa.
Dowdy and Kuleshov (2014) found maximum lightning frequency in/near Australia over the
ocean off the coast during the cooler months. In a global lightning climatology from 1995–2010
using LIS and OTD data, Cecil et al. (2014) showed that the maximum frequency of lightning
activity is in central Africa, but the peak monthly average rate is during the summer (July) in
Brahmaputra Valley, India. The global spatial patterns of frequencies identified by the above

12
studies are not static in time; Koshak et al. (2015) found an increase over the 2003–2012 period
globally.
2.4 Landsat-Based LULC Change Studies
Because lightning data is to be correlated with land use, a review of recent Landsat-based
LULC change is provided here. Singh (1988) defined land change analysis as:
“the process of identifying differences in the state of an object or phenomenon by
observing it at different times. Essentially, it involves the ability to quantify temporal
effects using multi-temporal data sets.”
Although many LULC change studies have been conducted using satellite imagery and remote
sensing techniques, this discussion includes only research analyzing LULC change using Landsat
data and the influence of LULC change on meteorological or climatological variables.
Landsat data consist of Earth imagery captured from various wavelength bands on the
electromagnetic spectrum. Because these images are capable of capturing such a wide range of
spectral signatures, they can be used to analyze a host of environmental issues, including LULC
change.
Several LULC change studies have focused on inventorying derived categories of LULC
in the United States. For example, an urban and regional LULC for Atlanta, Georgia, identified
a slight increase in urban coverage from 1972 to 1974 (Todd, 1977). Vogelmann et al. (1998)
used Landsat data to develop a LULC characterization for the Mid-Atlantic region; their results
found that pesticide runoff could influence land cover change. A detailed analysis of Minnesota
by Yuan et al. (2005) revealed that urban development had increased by up to 32% and natural
environments had decreased by 69% from 1986 to 2002. Huang et al. (2009) found that 30 to
40% of national forest lands in the eastern U.S. have been disturbed between 1990 and 2005.

13
Much Landsat-based research of this type has focused on development in China. For
example, Seto et al. (2002) used an image pixel change technique to illustrate the relationship
between economic growth and LULC in the Pearl River Delta between 1988 and 1996.
Similarly, Zhang et al. (2002) employed two images – one from 1984 and the other from 1997 –
to determine LULC in Beijing by calculating spectral differences using three different methods,
with results showing that changes in structural buildup are more noticeable using the image
differencing technique. Complementary work in China by Liu et al. (2005) revealed the rate of
change from cropland to urban development from 1990 to 2000, with the newly-claimed
cropland less productive than the former cropland. This work was corroborated by Fan et al.
(2007), who found a rapid decrease in cropland in Guangzhou from 1977 to 2007.
LULC change studies abound for other parts of the world too. For example, Lyon et al.
(1998) showed using Landsat imagery for Chiapas, Mexico, that vegetation indices are affected
by the type of statistical calculation used to ascertain the differences in land use, but the
normalized difference vegetation index proved to be the most accurate. Cardille and Foley
(2003) used integrated Landsat imagery along with census data to identify the rapid increase in
agricultural land use in Brazil from 1980 to 1995. Shalaby and Tateishi (2007) showed that
tourist-focused development caused vegetation degradation, water logging, and urban
development in northeastern Egypt from 1987 to 2001. Dewan and Yamaguchi (2009) found that
between 1975 and 2003 much of the green space and bodies of water in Greater Dhaka,
Bangladesh, had been replaced with human-made structures. By using land surface temperature
to calculate the total amount of land change in Malaysia from 1999–2007, Tan et al. (2010)
found that urban area increased substantially, grassland area increased moderately, and barren
and forest area decreased (Tan et al., 2010).

14
Environmental impacts of development have become a ubiquitous concern in recent
decades, with a number of studies using Landsat data to highlight connections between land
modification and the environmental change created by it. For example, Kalnay and Cai (2003)
found that a drastic reduction in diurnal temperature range accompanied urbanization globally.
Tang et al. (2005) found that an increase in urbanization would subsequently lead to an increase
in runoff of harmful chemicals into the Muskegon River watershed in Michigan. Scanlon et al.
(2005) suggested that urban development reduces the amount of moisture in the soil. Seneviratne
et al. (2006) showed that an increase in climatic variability in Europe would place a greater stress
on moisture availability in soil – which in turn would be increasingly limited should urban
expansion continue. Chen et al. (2006) determined that urban heat island patterns were scattered
among the land types in the Pearl River Delta of China, with developed areas (concrete) and bare
land being the warmest. Fortunately, even the long-problematic constraint of cloud cover in
Landsat based studies was found to be of only minor concern in such LULC change studies,
since these typically only require one cloud-free image per year (Ju and Roy, 2008).
2.5 Land Change Influences on Lightning
Despite the abundance of literature on lightning climatology and use of Landsat imagery
for environmental change analysis, there remains a gap in the literature on the overlap of these
two important topics. This section will focus on explaining how changes to atmospheric
particulate flux, often derived from LULC, near developed areas may influence lightning, as well
as how urban environments can perturb the typical lightning behaviors.
Urban areas are well-known to increase the frequency and intensity of thunderstorms
(Ashley et al., 2012; Harberlie et al., 2015). Urban influences on lightning flash frequency could
occur due to increases in atmospheric particulates, enhanced convection, or a greater availability

15
of attractive objects. In an analysis of lightning patterns around 16 major U.S. cities from 1989–
1992, Westcott (1995) found that areas downwind and over cities experienced a 40-80% increase
in lightning activity over adjacent environs. Naccaroto et al. (2003) found a 60–100%
enhancement in CG lightning over urban areas in Brazil, with this increase attributed to
enhanced heat output from urban surfaces. Bentley and Stallins (2005) found that in Atlanta,
Georgia, July is the most active lightning month, and that each season has its own predominant
synoptic conditions for producing lightning when coupled with urban enhancement. In a follow-
up study by Stallins and Bentley (2006), the northeast quadrant of Atlanta was found to support
the most lightning, with the enhancement attributed to increased urban-induced instability.
While high-quality work on the relationship between LULC change and environmental
factors has been conducted, more work is needed to for a more complete understanding. In the
next chapter, data and methods of how this thesis will explore the relationship between LULC
change and lightning flash patterns will be completed.

16
Chapter 3. Data and Methods
“The goal is to turn data into information, and information into insight.”
– Carly Fiorina
Data that will be used for addressing the research objectives described in Chapter 1
consist of NOAA’s gridded lightning data from 1995 to 2011, and National Aeronautics and
Space Administration’s (NASA’s) Geostationary Operational Environmental Satellite (GOES)
Landsat 4–5 imagery from 1996 to 2010. Methods that are to be implemented on these data sets
include a descriptive statistical analysis of lightning frequencies, One-way Analysis of Variance
(ANOVA) and Scheffé’s 95% confidence interval (Scheffé, 1959) test to determine differences
between lightning frequency for each LULC and annual lightning count dataset, linear regression
with a categorical variable (James et al., 2013), and geographically weighted regression (GWR;
Fotheringham, 2002). This chapter will describe how these data sets and procedures will be
manipulated and how they work. In addition, handling of the data prior to analysis will also be
explained.
3.1 Landsat Imagery
The United States Geological Survey (USGS) provides Landsat 4–5 (L4 and L5) data
from 1982 to 2012 through its EarthExplorer portal. Landsat 4–5 images were captured using the
Landsat 4 and 5 satellites, respectively. Aside from a communications update on the L5 satellite,
there are no differences between L4 and L5 bands. The sensors aboard the two satellites are a
multispectral scanner (MSS) and thematic mapper (TM). MSS Images from L4 and L5 comprise
four spectral bands: Band 4 Visible (0.5 to 6 µm), Band 5 Visible (0.6 to 0.7 µm), Band 6 Near-
Infrared (0.7 to 0.8 µm), and Band 7 Near-Infrared (0.8 to 1.1 µm), all with pixel sizes of 57 x 79
m. TM images from L4 and L5 include seven spectral bands: Band 1 Visible (0.45 to 0.52 µm),

17
Band 2 Visible (0.52 to 0.60 µm), Band 3 Visible (0.63 to 0.69 µm), Band 4 Near-Infrared (0.76
to 0.90 µm), Band 5 Near-Infrared (1.55 to 1.75 µm), Band 6 Thermal (10.40 to 12.50 µm) and
Band 7 Mid-Infrared (2.08 to 2.35 µm) – TM pixel sizes are 30 m x 30 m for all bands except for
the thermal band, which has a 120 m x 120 m pixel size. Total scene size of images is 170 km x
185 km.
L4-5 data are utilized because of the generally high quality and because the access to
imagery matches the temporal period of the project. While L7 and L8 both provide accurate data
sets, their temporal periods are limited, in comparison with L4–5, because they were launched in
1999 and 2013, respectively. While change analysis on the imagery available from these sensors
would be possible, it would not match with the temporal period of the gridded lightning data set
used in this study.
NOAA Coastal Change Analysis Program (C-CAP) provides LULC change data for
coastal locations using Landsat imagery, including data for 1996 (Figure 3.1), 2001 (Figure 3.2),
2006 (Figure 3.3), and 2010 (Figure 3.4). These years of data were selected for use instead of a
manual land classification due to the amount of quality control from a reputable source and the
adequate spatial coverage of the data. Because land classification can be a monotonous process
prone to error, utilizing data that are considered high quality by NOAA will minimize concern of
erroneous pixel classification. Due to the extensive number of LULC types, the color
corresponding to each in Figures 3.1–3.4 is shown in Table 3.1.
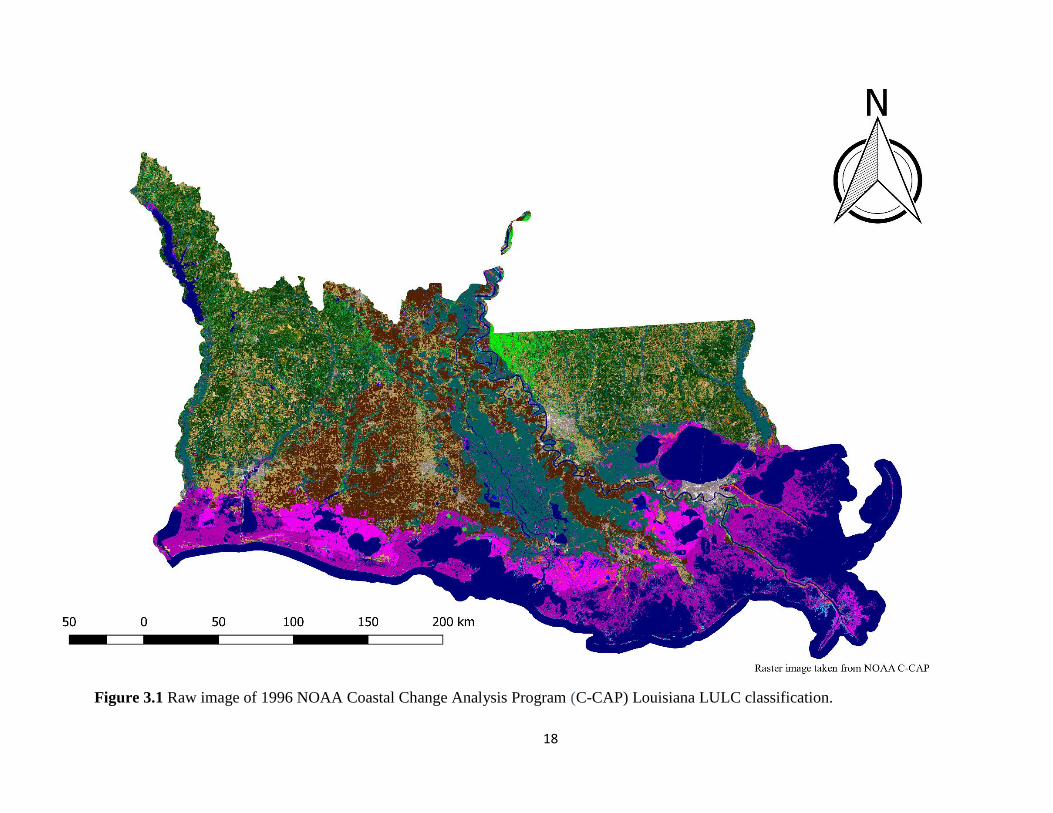
18
Figure 3.1 Raw image of 1996 NOAA Coastal Change Analysis Program (C-CAP) Louisiana LULC classification.

19
Figure 3.2 As in Figure 3.1, but for 2001.

20
Figure 3.3 As in Figure 3.1, but for 2006.

21
Figure 3.4 As in Figure 3.1, but for 2010.

22
Data handling complications for these images are minimal. Since NOAA’s team of
remote sensing scientists has already completed classification as well as latitude and longitude
adjustment, data correction required only a majority resampling interpolation technique. The
purpose was to match the cell sizes and locations to the lightning dataset (Figures 3.5‒3.8).
Majority resampling works by recalculating the average value of a 2 x 2 cell of the input raster
based on the majority value within that cell (Esri, 2016). This type of transformation is preferred
for transformations of LULC data because no new values are calculated, but the majority are
maintained. Means of land classes per year are provided as well (Figure 3.9).
Table 3.1 Colors representing each LULC type within the
classification image maps.

23
Figure 3.5 Majority resampled 1996 Louisiana LULC map.

24
Figure 3.6 As in Figure 3.5, but for 2001.

25
Figure 3.7 As in Figure 3.5, but for 2006.

26
Figure 3.8 As in Figure 3.5, but for 2010.

27
Figure 3.9 LULC totals for the years 1996, 2001, 2006, and 2010. Each line represents a year of the total four periods studied.

28
After completion of the resampling, and after the data have been imported into the R
programming language, the background and unclassified classes are removed to eliminate
software error messages from calculation non-applicable values.
3.2 NOAA/Vaisala NLDN Lightning Data
NOAA provides CG lightning data from 1986 to 2013 through its National Centers for
Environmental Information (NCEI) web portal. For this project, data from 1995 to 2011 are
analyzed, so as to overlap with the temporal period of available data in the NOAA C-CAP data
set. The data are provided to NOAA through a contract with Vaisala Inc.’s NLDN (Figure 3.10).
These data come with their own coordinate reference system, which displays coordinates in
meters instead of latitude/longitude. An adjustment of this projection was made, so that the
lightning data projection matches the LULC classification data.
Figure 3.10 A sample of the lightning data over the U.S. observed by the NLDN and distributed
by NOAA for the year 1995.

29
Because raw data are not available for open distribution to the public, NOAA makes
derived products that can be disseminated. These products include daily tile summaries, daily,
county and state counts for the continental U.S., and 4 km x 4 km Albers Equal Area gridded
summaries, which are distributed in frequency by hour per month, by hour per year, by day, by
month, and by year. In addition, NOAA’s lightning products also consist of a positive polarity
only database. Albers Equal Area was the map projection selected because of the importance of
preserving area in any display of spatial density of lightning strikes.
Frequency per month and per year data are utilized for addressing Research Objective 1
(“Analyze the spatio-temporal distribution of cloud-to-ground lightning in the northern Gulf
Coast region”). Data sets such as the satellite-based LIS/OTD have far too much noise for such
an analysis, because it detects intra-cloud, cloud-to-cloud, and cloud-to-air lightning flashes.
This would misconstrue the sample and introduce bias to the study, because non-CG flashes are
presumably not as directly related to LULC. Therefore, only CG data are used.
The cost of acquiring data from the NLDN directly has largely confined the examination
of the accuracy of the NOAA database to Vaisala employees themselves. Vaisala associated
scientist Kenneth Cummins confirmed that the NLDN was the most accurate of all lightning
location systems in 2009 and would rapidly improve its accuracy in the coming years (Cummins
and Murphy, 2009). Soon afterwards, scientists affiliated with Vaisala revealed accuracy ranges
of their network between 90–95% in the U.S. and 86–92% for the entire globe, with little
variation at night (Demetriades et al., 2010; Cramer and Cummins, 2014).

30
Data manipulation requirements are minimal. Becasue this database is a derived product,
most errors have already been corrected. The first step was importing the netCDF into QGIS and
implementing a projection change from Albers to the projection of the LULC change data used
in this project, which is Albers Conformal Conic, which does not affect the frequency of the data
at all. The second step was completing a “raster align” in QGIS, which is equivalent to the raster
registration tool in ArcMap. This procedure allows the cells of the lightning data to be
superimposed on the cells of the LULC classification data. The raster align function in QGIS
also clips the portion of data from the entire file so that analysis of data can be restricted to the
intended region. A sample of the extracted data is provided for the northern Gulf Coast (Figure
3.11). Lastly, all files were exported as GRID files, which maintains their values in a geocoded
format.
Figure 3.11 Aligned lightning data from the NLDN/NOAA overlaid on the 1995
resampled LULC map.

31
3.3 Lightning Climatology
Data for histograms are collected by importing the data into R statistical programming
software. Once each NetCDF file of gridded lightning data has been imported, annual totals are
compiled and reported as a bar graph, with an overlaying trend line. The presence of anomalies
will inform further analysis.
3.4 Linear Regression with a Categorical Variable
Linear regression (James et al., 2013) is a statistical test used to assess the relationship
between two variables. The assumptions for linear regression are independence of the variables,
homoscedasticity (variance around the regression line is the same for all values), no or little
multicollinearity (independent variables are not related), and normality (variables are distributed
in a bell shape over time). A linear regression with a categorical variable simply takes a
dependent variable and tests it among factors – or LULC in this case.
3.5 One-way Analysis of Variance and Scheffé’s 95% Simultaneous Confidence Interval
Test
One-way ANOVA is a statistical method that tests for a difference between means among
sample sets of two or more variables. Specifically, it determines whether any differences
amongst the means exist between two or more samples. Any significant difference of means
between two or more variables are indicated by a small enough p-value for the ANOVA
(generally > 0.05) that allows one to reject the null hypothesis of no significant differences of
mean between any of the sampled variables. The assumptions for ANOVA are identical to that of
a linear regression test. As such, ANOVA is an appropriate inferential statistical method for
analyzing differences between data sets, and influences of extraneous variables on other various

32
variables within a data set. It offers the advantage over t-tests of providing comparisons of the
mean from multiple variables, taken two at a time, simultaneously. This minimizes the
possibility of committing a type I error (Freund et al., 2010) as compared to conducting multiple
t-tests. The equation for ANOVA is as follows:
𝐹 =𝑀𝑆𝑇
𝑀𝑆𝐸
where F is the ANOVA coefficient, MST is the mean sum of squares due to treatment, and MSE
is the mean sum of squares due to error.
ANOVA will be employed with the LULC classification type being the treatment
variable; gridded lightning frequencies represent the cases for which the mean is calculated and
tested for difference against the mean of the other LULC types. Because the study area is
relatively small, differences in synoptic patterns conducive to lightning are assumed to be
negligible. This analysis will show whether differences exist between groups, and, with further
information on how LULC changes have occurred over time, could give an improved
explanation for changes in lightning totals over the total period of record. ANOVA is easily
executed in R, QGIS, and ArcGIS through add-on modules and packages.
If ANOVA results suggest significant differences in lightning frequency by LULC type
(i.e., a rejection of the null hypothesis), Scheffé’s 95% Simultaneous Confidence Interval Test
(Scheffé, 1959) will be conducted to determine which LULC types differ statistically
significantly from which others.

33
3.6 Geographically Weighted Regression
A GWR (Fotheringham, 2002) and one-way ANOVA test will be completed to address
Research Objective 2 (“Investigate the influence of LULC types and land change on lightning
frequency and patterns over the northern Gulf Coast region”) by determining the extent to which
LULC is associated with lightning patterns over Louisiana. GWR is a geospatial method of
determining the change in relationship across time and space between two spatially similar
values. In contrast to linear regression, GWR considers spatial bounds as a means of weighting
the relationship. GWR is represented by the following equation:
where β(ui,vi) indicates the vector of the location-specific parameter estimates, (ui,vi) represents
the geographic coordinates of location i in space, and is the error term with mean zero and
common variance σ2 (GEOPOPSCI, 2016). The assumptions for GWR are the same as linear
regression or ordinary least squares regression (Fotheringham, 2002). Specifically, the data must
be normally distributed, have no multicollinearity, be homoscedastic, and have random variance
for all independent and dependent variables (Fotheringham, 2002).
GWR will provide evidence regarding whether local LULC changes are associated with
lightning frequency. Potential pitfalls of GWR are location bias and the inability to detect
anomalous LULC-related climatic patterns that could lead to a sudden shift in lightning patterns.
GWR is easily executable in R, QGIS, and ArcGIS through add-on modules and packages. First,
however, an amalgamated lightning raster and the classification rasters must be converted to
point shapefiles in ArcMap. This is because GWR only accepts point data for analysis and must
be given specified coordinate boundaries. Once this step is completed using the raster-to-point

34
tool in ArcMap, each LULC file and lightning file are conjoined to be analyzed by the GWR tool
in ArcMap.
Chapter 4 will describe and interpret the results of these methods.

35
Chapter 4. Results
“Insanity: doing the same thing over and over again and expecting different results.”
– Albert Einstein
4.1 Lightning Climatology
Figures 4.1–4.17 depict histograms showing the number of pixels experiencing various
ranges of a lightning flash annually, in the region bounded by 32.76281ºN, –88.0726ºW,
28.55081ºN, and –94.8024ºW, from 1995 to 2011. Figures 4.1 – 4.17 suggest that in most years
most pixels report between 80 and 100 CG flashes, which means that most areas in the Gulf
Coastal region experience a high frequency of CG lightning per year 5-6 km-2yr-1. Relatively
lower amounts of flashes occur in 2000, 2007, 2010, and 2011, when lightning was placed in
lower count brackets within the histograms. The 2002 through 2005 period experienced the
highest lightning frequencies of pixels with 31 flashes per km-2yr-1. In addition, these years also
had pixels with more than 500 CG flashes for the year. Based on the maps provided with the
histograms, it is apparent that the highest lightning frequencies tend to occur along the
southeastern southcentral portion of the study area near the Louisiana and Mississippi coast.

36
Figure 4.1 Histogram showing number of pixels with 1995 CG lightning frequency ranges at the midpoint shown (i.e., 0–20,
21–30, 31–40, etc.), across the northern Gulf Coast, with mapped frequencies shown in the inset.

37
Figure 4.2 As in Figure 4.1, but for 1996.

38
Figure 4.3 As in Figure 4.1, but for 1997.

39
Figure 4.4 As in Figure 4.1, but for 1998.

40
Figure 4.5 As in Figure 4.1, but for 1999.

41
Figure 4.6 As in Figure 4.1, but for 2000.

42
Figure 4.7 As in Figure 4.1, but for 2001.

43
Figure 4.8 As in Figure 4.1, but for 2002.

44
Figure 4.9 As in Figure 4.1, but for 2003.

45
Figure 4.10 As in Figure 4.1, but for 2004.

46
Figure 4.11 As in Figure 4.1, but for 2005.

47
Figure 4.12 As in Figure 4.1, but for 2006.

48
Figure 4.13 As in Figure 4.1, but for 2007.

49
Figure 4.14 As in Figure 4.1, but for 2008.

50
Figure 4.15 As in Figure 4.1, but for 2009.

51
Figure 4.16 As in Figure 4.1, but for 2010.

52
Figure 4.17 As in Figure 4.1, but for 2011.

53
Figure 4.18 shows the total number of CG lightning strikes in the entire study area by
year, with a temporal trend line. A maximum occurred in 2003, with 2,420,859 CG flashes. The
low value was observed in 2000, when only 1,216,910 CG flashes were recorded. A linear test
for trend identifies no significant temporal trend in areal lightning frequency over the period
(Table 4.1).
Figure 4.18 Bar graph showing the total regional frequency of CG lightning flashes
with a trend line fitted (top), and a map showing the spatial distribution of the 4 km x 4
km pixels across the region for all years 1995–2011.

54
The low R-squared value could either be related to erratic annual frequencies in lightning
occurrence or a small number of years in the data set. A sudden peak in CG lightning activity
existed from 2003–2005, and a decrease in lightning activity after that year.
The 17-year climatology map shows that most of the area over land sees an abundance of
CG lightning flashes per year. Interestingly, there are areas in southern Louisiana (eg. Lake
Charles) on land that see less-frequent lightning than nearby surrounding areas. In addition, areas
near Baton Rouge and the I-10/I-12 corridor heading to New Orleans and Biloxi, respectively,
both show local maxima in lightning frequencies. This could be evidence of the sea breeze
effect, but most likely it is due to the abundance of taller objects that attract lightning by
weakening the electric field between the cloud and the ground. CG lightning over the Gulf of
Mexico appears to be significantly less than CG lightning over land. Aside from the absence of
built-up areas over water, ocean mixing due to winds in a storm make it difficult for an electric
field with the appropriate charge to develop to attract a stepped leader.
Figures 4.19 and 4.20 show the distributions of lightning frequency by LULC. From the
boxplots, it can be noted that developed land types tend to have higher means than the other land
Intercept Slope P-value Adjusted R-
Sq
2.00E+03 1.62E-07 0.992 0.02158
Slope 0.9612
Table 4.1 Shows resulting statistics for trend line fitted to 17-year lightning
climatology.

55
classes. The largest minimum and maximum flashes are also observed in the developed tiles, this
is strong evidence towards an urban-lightning relationship over the temporal period studied.
Figure 4.19 Boxplots of each LULC type and their mean, interquartile range, and extremes
of CG lightning, by 4 km x 4 km pixel, for 1996 (top) and 2001 (bottom).

56
Figure 4.20 As in Figure 4.19, but for 2006 (top) and 2010 (bottom).

57
4.2 Linear Regression
A Kolmogorov-Smirnoff test for normality was completed before proceeding with the
linear regression test, and a p-value below 0.0001 was recorded (Massey, 1951). Figures 4.21 –
4.22 show plots of the residuals between LULC types and the respective years (1996, 2001,
2006, 2010) for the Louisiana portion of this study. Residuals are based on the observed and
predicted values, and since the amount of lightning is so large, high residual values are found.
The negative residuals represent areas of under estimation and the positive residuals represent
over estimation. We observe the highest residuals in urban environments but also in south central
Figure 4.21 Residuals from a linear regression test between 1996 (top) and 2001
(bottom) LULC and lightning.

58
Louisiana. The lowest residuals occur in southwestern Louisiana, with some clustering of high
residuals near the Texas border.
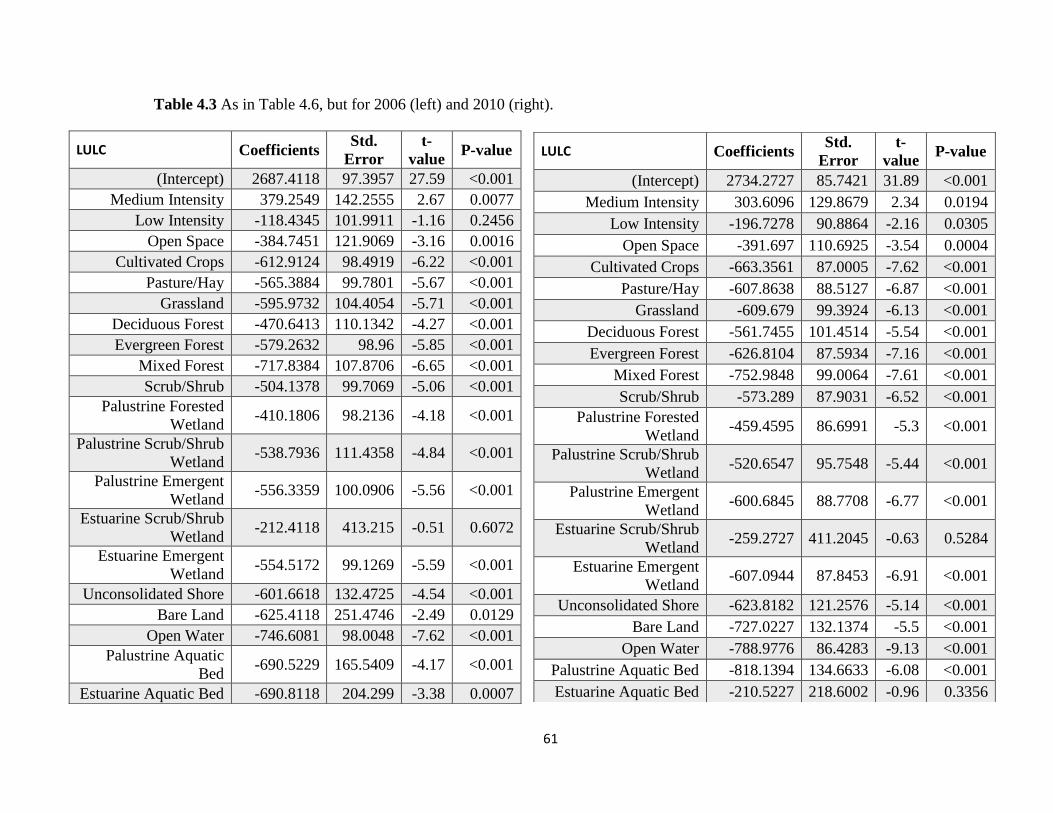
Tables 4.2 – 4.3 show the output of a categorical linear regression between LULC class
and the total CG lightning frequency by year. While few differences exist between years, the
regression analysis identifies a statistically significant relationship between LULC type and
lightning frequency. The level of significance is from 90% to 99%, and most classifications are
significant at the 99% confidence interval. There are no background or unclassified classes
Figure 4.22 As in Figure 4.21, except 2006 (top) and 2010 (bottom).

59
present because these were discarded during data handling to prevent error due to the presence of
unavailable data and unnecessary zero values.

60
LULC Coefficients Std.
Error
t-
value P-value
(Intercept) 2815.2857 107.5224 26.18 <0.001
Medium Intensity 107.2857 152.0597 0.71 0.4805
Low Intensity -250.9269 111.8622 -2.24 0.0249
Open Space -506.0599 129.5461 -3.91 0.0001
Cultivated Crops -742.999 108.5307 -6.85 <0.001
Pasture/Hay -676.2394 109.5541 -6.17 <0.001
Grassland -703.5466 112.8447 -6.23 <0.001
Deciduous Forest -598.5152 119.2243 -5.02 <0.001
Evergreen Forest -712.4158 108.8558 -6.54 <0.001
Mixed Forest -828.7556 116.2374 -7.13 <0.001
Scrub/Shrub -609.3413 110.2748 -5.53 <0.001
Palustrine Forested
Wetland -541.0222 108.2571 -5 <0.001
Palustrine Scrub/Shrub
Wetland -604.9388 121.919 -4.96 <0.001
Palustrine Emergent
Wetland -683.8335 109.8933 -6.22 <0.001
Estuarine Scrub/Shrub
Wetland -340.2857 416.4326 -0.82 0.4139
Estuarine Emergent
Wetland -681.173 109.0824 -6.24 <0.001
Unconsolidated Shore -694.0752 141.7031 -4.9 <0.001
Bare Land -779.0857 209.5998 -3.72 0.0002
Open Water -877.4899 108.0818 -8.12 <0.001
Palustrine Aquatic Bed -855.0635 171.8865 -4.97 <0.001
Estuarine Aquatic Bed -889.619 255.9546 -3.48 0.0005
LULC Coefficients Std.
Error
t-
value P-value
(Intercept) 2815.2857 107.7868 26.12 <0.001
Medium Intensity 132.0476 158.6579 0.83 0.4053
Low Intensity -257.6494 112.2665 -2.29 0.0218
Open Space -432.6607 135.6288 -3.19 0.0014
Cultivated Crops -744.3474 108.7936 -6.84 <0.001
Pasture/Hay -678.639 109.818 -6.18 <0.001
Grassland -718.3264 113.7558 -6.31 <0.001
Deciduous Forest -586.3705 119.895 -4.89 <0.001
Evergreen Forest -692.461 109.0392 -6.35 <0.001
Mixed Forest -779.1244 115.6155 -6.74 <0.001
Scrub/Shrub -635.9409 110.9914 -5.73 <0.001
Palustrine Forested
Wetland -540.7012 108.5051 -4.98 <0.001
Palustrine Scrub/Shrub
Wetland -663.2857 124.8404 -5.31 <0.001
Palustrine Emergent
Wetland -684.4011 110.1786 -6.21 <0.001
Estuarine Scrub/Shrub
Wetland -340.2857 417.4567 -0.82 0.415
Estuarine Emergent
Wetland -683.356 109.3346 -6.25 <0.001
Unconsolidated Shore -673.9011 155.3374 -4.34 <0.001
Bare Land -746.0357 228.6504 -3.26 0.0011
Open Water -875.4381 108.3464 -8.08 <0.001
Palustrine Aquatic Bed -884.1607 178.7443 -4.95 <0.001
Estuarine Aquatic Bed -945.2857 228.6504 -4.13 <0.001
Table 4.2 1996 (left) and 2001 (right) linear regression results between LULC classification and lightning.
61
LULC Coefficients Std.
Error
t-
value P-value
(Intercept) 2734.2727 85.7421 31.89 <0.001
Medium Intensity 303.6096 129.8679 2.34 0.0194
Low Intensity -196.7278 90.8864 -2.16 0.0305
Open Space -391.697 110.6925 -3.54 0.0004
Cultivated Crops -663.3561 87.0005 -7.62 <0.001
Pasture/Hay -607.8638 88.5127 -6.87 <0.001
Grassland -609.679 99.3924 -6.13 <0.001
Deciduous Forest -561.7455 101.4514 -5.54 <0.001
Evergreen Forest -626.8104 87.5934 -7.16 <0.001
Mixed Forest -752.9848 99.0064 -7.61 <0.001
Scrub/Shrub -573.289 87.9031 -6.52 <0.001
Palustrine Forested
Wetland -459.4595 86.6991 -5.3 <0.001
Palustrine Scrub/Shrub
Wetland -520.6547 95.7548 -5.44 <0.001
Palustrine Emergent
Wetland -600.6845 88.7708 -6.77 <0.001
Estuarine Scrub/Shrub
Wetland -259.2727 411.2045 -0.63 0.5284
Estuarine Emergent
Wetland -607.0944 87.8453 -6.91 <0.001
Unconsolidated Shore -623.8182 121.2576 -5.14 <0.001
Bare Land -727.0227 132.1374 -5.5 <0.001
Open Water -788.9776 86.4283 -9.13 <0.001
Palustrine Aquatic Bed -818.1394 134.6633 -6.08 <0.001
Estuarine Aquatic Bed -210.5227 218.6002 -0.96 0.3356
LULC Coefficients Std.
Error
t-
value P-value
(Intercept) 2687.4118 97.3957 27.59 <0.001
Medium Intensity 379.2549 142.2555 2.67 0.0077
Low Intensity -118.4345 101.9911 -1.16 0.2456
Open Space -384.7451 121.9069 -3.16 0.0016
Cultivated Crops -612.9124 98.4919 -6.22 <0.001
Pasture/Hay -565.3884 99.7801 -5.67 <0.001
Grassland -595.9732 104.4054 -5.71 <0.001
Deciduous Forest -470.6413 110.1342 -4.27 <0.001
Evergreen Forest -579.2632 98.96 -5.85 <0.001
Mixed Forest -717.8384 107.8706 -6.65 <0.001
Scrub/Shrub -504.1378 99.7069 -5.06 <0.001
Palustrine Forested
Wetland -410.1806 98.2136 -4.18 <0.001
Palustrine Scrub/Shrub
Wetland -538.7936 111.4358 -4.84 <0.001
Palustrine Emergent
Wetland -556.3359 100.0906 -5.56 <0.001
Estuarine Scrub/Shrub
Wetland -212.4118 413.215 -0.51 0.6072
Estuarine Emergent
Wetland -554.5172 99.1269 -5.59 <0.001
Unconsolidated Shore -601.6618 132.4725 -4.54 <0.001
Bare Land -625.4118 251.4746 -2.49 0.0129
Open Water -746.6081 98.0048 -7.62 <0.001
Palustrine Aquatic
Bed -690.5229 165.5409 -4.17 <0.001
Estuarine Aquatic Bed -690.8118 204.299 -3.38 0.0007
Table 4.3 As in Table 4.6, but for 2006 (left) and 2010 (right).

62
In 1996, there is a relationship between every LULC class and lightning except for
developed medium intensity and estuarine forested wetland (Table 4.2). P-values for both
categories were just above the threshold required for significance (0.4053 and 0.4150). The
results for 2001 (Table 4.6) are similar to those for 1996, which most likely suggests that there
were no LULC changes significant enough to change the relationship, or that the climatology of
lightning is too chaotic to detect a pattern. For 2006 (Table 4.3), high intensity urban is
significantly related to lightning frequency, which could mean that enhanced development of this
type of LULC allowed for an increase in relationship. In 2010 (Table 4.3), high intensity urban
class is still significantly related to lightning frequency, but estuarine aquatic bed is no longer
significantly related. The sudden change could be due to coastal erosion, as much of this type of
classification diminished greatly from 1996 to 2010.

63
4.3 ANOVA & Scheffé’s Analysis
ANOVA results for 1996, 2001, 2006, and 2010 show a statistically significant difference
of means in lightning by LULC type, for all four years studied (Table 4.4). To ascertain which
LULC types differed significantly from which others, a Scheffé’s 95% Simultaneous Confidence
Interval test (Scheffé, 1959) was implemented to test significant differences between groups.
Table 4.4
Results of ANOVA test to test for difference of mean lightning strikes by LULC type,
1996, 2001, 2006, and 2010.
Year Df Sum Sq Mean Sq F value P-Value
1996 20 121865538 6093276.9 37.46 <0.001 5673 922725155.7 162652.06
2001 20 126387289.9 6319364.49 39.04 <0.001 5673 918203403.9 161855
2006 20 129758712.4 6487935.62 40.23 <0.001 5673 914831981.4 161260.71
2010 20 127054334.2 6352716.71 39.28 <0.001 5673 917536359.6 161737.42
The results from Scheffé’s analysis show that certain LULC types consistently hold
higher mean frequencies of CG lightning than certain other land types (Table 4.5 – 4.8). LULC
categories denoted by “a” in tables 4.5 - 4.8 are in the group of LULCs with the highest means
(while not differing significantly from each other), those denoted by “b” in the tables are in the
group of LULCs with the second-highest means (while not differing significantly from each
other), those denoted by “c” are in the group with the lowest means and are not significantly
different from

64
Degrees of Freedom Number of Treatments F Scheffe alpha
5673 21 1.572378 5.607813 0.05
Rankings Land Class Means Groupings
1 Developed, Medium Intensity 2947.333 a
2 Developed, High Intensity 2815.286 ab
3 Developed, Low Intensity 2557.636 ab
4
Estuarine Scrub/Shrub
Wetland 2475 abc
5 Developed, Open Space 2382.625 abc
6 Palustrine Forested Wetland 2274.585 bc
7 Deciduous Forest 2228.915 bc
8 Scrub/Shrub 2179.345 c
9
Palustrine Scrub/Shrub
Wetland 2152 c
10 Unconsolidated Shore 2141.385 c
11 Pasture/Hay 2136.647 c
12 Estuarine Emergent Wetland 2131.93 c
13 Palustrine Emergent Wetland 2130.885 c
14 Evergreen Forest 2122.825 c
15 Grassland/Herbaceous 2096.959 c
16 Cultivated Crops 2070.938 c
17 Bare Land 2069.25 c
18 Mixed Forest 2036.161 c
19 Open Water 1939.848 c
20 Palustrine Aquatic Bed 1931.125 c
21 Estuarine Aquatic Bed 1870 c
Table 4.5 Output of Scheffé’s comparison test for 1996 and all years of lightning.

65
Degrees of Freedom Number of Treatments F Scheffé alpha
5673 21 1.572378 5.607813 0.05
Rankings Land Class Means Groupings
1 Developed, Medium Intensity 2922.571 a
2 Developed, High Intensity 2815.286 ab
3 Developed, Low Intensity 2564.359 ab
4
Estuarine Scrub/Shrub
Wetland 2475 abc
5 Developed, Open Space 2309.226 abc
6 Palustrine Forested Wetland 2274.263 bc
7 Deciduous Forest 2216.77 bc
8
Palustrine Scrub/Shrub
Wetland 2210.347 bc
9 Scrub/Shrub 2205.944 bc
10 Pasture/Hay 2139.046 c
11 Estuarine Emergent Wetland 2134.113 c
12 Grassland/Herbaceous 2131.452 c
13 Unconsolidated Shore 2121.211 c
14 Grassland/Herbaceous 2111.739 c
15 Evergreen Forest 2102.87 c
16 Cultivated Crops 2072.287 c
17 Bare Land 2036.2 c
18 Mixed Forest 1986.53 c
19 Palustrine Aquatic Bed 1960.222 c
20 Open Water 1937.796 c
21 Estuarine Aquatic Bed 1925.667 c
Table 4.6 As in Table 4.5, but for 2001.

66
`
Degrees of Freedom Number of Treatments F Scheffé alpha
5673 21 1.572378 5.607813 0.05
Rankings Land Class Means Groupings
1 Developed, Medium Intensity 3066.667 a
2 Developed, High Intensity 2687.412 ab
3 Developed, Low Intensity 2568.977 ab
4
Estuarine Scrub/Shrub
Wetland 2475 abc
5 Developed, Open Space 2302.667 bc
6 Palustrine Forested Wetland 2277.231 bc
7 Deciduous Forest 2216.77 bc
8 Scrub/Shrub 2183.274 bc
9
Palustrine Scrub/Shrub
Wetland 2148.618 bc
10 Estuarine Emergent Wetland 2132.895 bc
11 Palustrine Emergent Wetland 2131.076 bc
12 Pasture/Hay 2122.023 c
13 Evergreen Forest 2108.149 c
14 Grassland/Herbaceous 2091.439 c
15 Unconsolidated Shore 2085.75 c
16 Cultivated Crops 2074.499 c
17 Bare Land 2062 c
18 Palustrine Aquatic Bed 1996.889 c
19 Estuarine Aquatic Bed 1996.6 c
20 Mixed Forest 1969.573 c
21 Open Water 1940.804 c
Table 4.7 As in Table 4.5, but for 2006.

67
Degrees of Freedom Number of Treatments F Scheffé alpha
5673 21 1.572378 5.607813 0.05
Rankings Land Class Means Groupings
1 Developed, Medium Intensity 3037.882 a
2 Developed, High Intensity 2734.273 ab
3 Developed, Low Intensity 2537.545 ab
4 Estuarine Aquatic Bed 2523.75 abc
5
Estuarine Scrub/Shrub
Wetland 2475 abc
6 Developed, Open Space 2342.576 bc
7 Palustrine Forested Wetland 2274.813 bc
8 Evergreen Forest 2213.618 bc
9 Deciduous Forest 2172.527 bc
10 Scrub/Shrub 2160.984 c
11 Palustrine Emergent Wetland 2133.588 c
12 Estuarine Emergent Wetland 2127.178 c
13 Pasture/Hay 2126.409 c
14 Grassland/Herbaceous 2124.594 c
15 Unconsolidated Shore 2110.455 c
16 Evergreen Forest 2107.462 c
17 Cultivated Crops 2070.917 c
18 Bare Land 2007.25 c
19 Mixed Forest 1981.288 c
20 Open Water 1945.295 c
21 Palustrine Aquatic Bed 1916.133 c
Table 4.8 As in Table 4.5, but for 2010.

68
each other. LULCs with multiple tags, such as “ab” or “abc”, have means that do not differ
significantly from the means of any of the groups in their tags.
The LULC types with the five highest lightning frequencies generally remain consistent
over the course of the 15-year study period. The LULCs that have the highest three means are
“developed” (medium-, high-, and low-intensity, respectively). Outside of the top three, the
significance in differences and changes in means fluctuate across the years. Between 1996 and
2001, changes occurred among the eight highest means, but with no significant changes of the
groups. Between 2001 and 2006, although there are small fluctuations in lightning means, there
are few significant changes in CG lightning groups. Between 2006 and 2010, there are a couple
of significant changes in groupings. Estuarine aquatic bed is ranked 4th in 2010, but it was only
ranked 19th in 2006. In addition, estuarine and palustrine emergent wetland, as well as
scrub/shrub, fell to the third category (c) by 2010. Major changes from 1996 to 2010 are
estuarine aquatic bed increasing in lightning frequency from among the lowest LULC types to
among the highest. This could be due to a change in the amount of estuarine aquatic bed over
time, but figure 3.9 states there was no change. Since it is known that Louisiana is experiencing
coastal erosion (Williams et al., 2012; Visser et al., 2013), aquatic environments are changing
constantly, and could result in changing land-air interactions as well.
4.4 Geographically Weighted Regression
Results from the GWR show static values between all four years of LULC classification
data studied. Total lightning frequencies from 1995 to 2011 were utilized as the dependent
variable, and the LULC classes for each year were the independent variable. Based on the weight
placed on spatial coordinates by the GWR and the derivation of coordinates from raster data that
were affixed to each 4 km x 4 km cell across the study region, few spatial differences in

69
coordinates occurred between years. Residual maps with associated R2 and adjusted R2 values
for southern Louisiana (Figures 4.23–4.26) show little change in residuals for each LULC
classification year studied. Results are only shown for southern Louisiana because of the extent
of the data. This result corroborates the residual maps provided by the linear regression test,
which showed little inter-annual variation in residuals, but only differences in p-values between
lightning relationships and LULC classes. The Akaike Information Criterion (AIC;
Fotherignham, 2002) determines the extent of the kernel used for calculating GWR. Conditional
number determines if local collinearity is present. Any value above 30 represents collinearity
(Fotheringham, 2002), which we do not see for any year examined. Local R2 evaluates the fit of a
local regression model fits, and the standard residuals and predicted values are used to measure
over and under-prediction as well as accuracy of the model. Lastly, areas along the coast, and
the Baton Rouge metropolitan area have high R2 values compared to their surrounding locations.
This is most likely due to a cluster of higher values and urban environments as seen in the
lightning climatology and Scheffé’s analysis.

70
Variable Value
Bandwidth 49591.10953
Residual Squares 205761685.4
Effective Number 43.33715219
Sigma 190.8238073
AICc 75981.34628
R2 0.274347414
R2 Adjusted 0.268910519
Figure 4.23 Resulting conditional number, local R2, standard residuals, and predicted values
from GWR output between total lightning frequency between 1996 land classes and total
lightning.

71
Variable Value
Bandwidth 49591.10953
Residual Squares 205761737.9
Effective Number 43.35031189
Sigma 190.8240538
AICc 75981.36291
R2 0.274347229
R2 Adjusted 0.26890863
Figure 4.24 As in Figure 4.23 but for 2001.

72
Variable Value
Bandwidth 49819.57837
Residual Squares 205814280.6
Effective Number 43.13758223
Sigma 190.8448241
AICc 75982.53375
R2 0.274161929
R2 Adjusted 0.26874947
Figure 4.24 As in Figure 4.23 but for 2001.
Figure 4.25 As in Figure 4.23 but for 2006.

73
Variable Value
Bandwidth 49819.57837
Residual Squares 205886943.3
Effective Number 43.26697396
Sigma 190.8806953
AICc 75984.71472
R2 0.273905672
R2 Adjusted 0.268474552
Figure 4.26 As in Figure 4.23 but for 2010.

74
Chapter 5. Summary/Conclusions
“I am turned into a sort of machine for observing facts and grinding out conclusions.”
– Charles Darwin
Lightning is one of the most dangerous hazards. Because the population of the central
Gulf of Mexico coast region is growing, LULC is continually changing to satisfy the needs of
residents, as well as enhance the area by providing new services to the public. On the other hand,
human interaction and change of environments are impacting typical processes and patterns,
including lightning, indirectly altering conditions across the region. While lightning deaths have
decreased nationally (Curran et al., 2000; NWS, 2016), it is important to maintain an accurate
assessment of all severe weather impacts in the U.S. to mitigate further damage.
The results of this study yielded insightful observations regarding the patterns and
placement of CG lightning in southern Louisiana and its peripheral areas. The lightning
climatology revealed inter-annual frequency and spatial fluctuations for the study area. One
interesting feature is that CG lightning always appears to have its strongest values over land,
which coincide with the results of previous research (Orville et al., 2001; LaJoie & Laing, 2008;
Rose et al., 2008). Another interesting observation from the lightning climatology is the sudden
increase in lightning totals leading up to 2005 when the Gulf Coast experienced an extreme
hurricane season. While this study does not necessarily suggest there is a relationship between
hurricanes and lightning, the environment around that time should be investigated further for any
possible connection. After 2005, there was a sharp decrease in the frequency of CG lightning in
the area. While the trend analysis was not statistically significant, an anomalous period of
increased total lightning between 2003 and 2005 could generate questions about whether changes
in temperature or meteorological forcing mechanisms influenced CG lightning in the region.

75
The results of the linear regression analysis showed strong relationships between all
LULC classes and lightning frequency except for developed medium-intensity and estuarine
forested wetland. Results from Scheffé’s test showed that lightning frequencies in developed
medium-intensity cells were the highest for all four years of LULC classification analyzed.
Results from GWR showed very little change in relationship between LULC and lightning
frequencies for the 1996–2010 period. However, this result could be influenced by the spatial
constraint of the point data. Further analysis with point data would need to be completed to
ascertain the true characteristics of the spatio-temporal patterns of lightning.
Among the other LULC categories, results were mostly consistent between years. This
result is likely due to prevailing climatic patterns, which determine where electrified storms
occur and how much lightning is experienced within that region, and/or the small number of
years analyzed. While the highest means of lightning are in urbanized LULC types, there is some
possibility that the result occurs not because of increased lightning rates over these types but
instead because of increased frequency of thunderstorm tracks over urban areas (Maier et al.,
1981; Nastos et al., 2014). It is in this regard that a higher-resolution data set could provide more
insight into the location of CG lightning flashes over time.
The sudden increase in lightning frequency of the estuarine aquatic bed LULC type to the
top three could again be due to a change in climate forcing mechanisms, or (more likely) due to
the observed local changes in that LULC category (eg. Lightning rod installation or industrial
equipment), thereby enhancing the amount of lightning observed over that class. On land, a
temporal decrease in lightning frequency over deciduous forests occurred, along with an increase
in evergreen forests. Again, these results could be due to changes in LULC, as shown in Figure
3.9.
76
Overall, the results of this thesis provided an abundance of information regarding LULC
relationship to lightning frequency. While urbanized areas tend to have the highest mean
lightning frequencies on a per-pixel basis, variation in other LULC means could lead to greater
shifts in lightning amounts between LULC categories besides the urban types. In addition, with
several ocean, coastal, and land modifications being undertaken in the area now, future trends
could see an increase in urban lightning totals due to more development spurred by population
growth. Ultimately, it is hoped that the results of this thesis will help inhabitants of the Gulf,
particularly in Louisiana, to better prepare for severe thunderstorms and provide industrial
management teams and environmental planners the information needed to establish greater
safety measures to prevent or mitigate damages.

77
References
Antonescu, B., & Burcea, S. (2010). A cloud-to-ground lightning climatology for Romania. Monthly Weather Review, 138(2), 579–591. doi:10.1175/2009mwr2975.1
Ashley, W. S., Bentley, M. L., & Stallins, A. J. (2012). Urban-induced thunderstorm modification in the southeast United States. Climatic Change, 113(2), 481–498.
Beirle, S., Koshak, W., Blakeslee, R., & Wagner, T. (2014). Global patterns of lightning
properties derived by OTD and LIS. Natural Hazards and Earth System Sciences, 14(10), 2715–2726. doi:10.5194/nhess-14-2715-2014
Bentley, M. L., & Stallins, J. A. (2005). Climatology of cloud-to-ground lightning in Georgia, USA, 1992–2003. International Journal of Climatology, 25(15), 1979–1996.
doi:10.1002/joc.1227
Biagi, C. J., Cummins, K. L., Kehoe, K. E., & Krider, E. P. (2007). National lightning detection
network (NLDN) performance in southern Arizona, Texas, and Oklahoma in 2003-
2004. Journal of Geophysical Research-Atmospheres, 112(D5), 17.
doi:10.1029/2006jd007341
Blakeslee, R. J., Mach, D. M., Bateman, M. G., & Bailey, J. C. (2014). Seasonal variations in the lightning diurnal cycle global electric circuit. Atmospheric Research, 135, 228–243.
doi:10.1016/j.atmosres.2012.09.023
Boccippio, D. J., Koshak, W., Blakeslee, R., Driscoll, K., Mach, D., Buechler, D., Goodman, S.
J. (2000). The optical transient detector (OTD): Instrument characteristics and cross-sensor validation. Journal of Atmospheric and Oceanic Technology, 17(4), 441–458.
doi:10.1175/1520-0426(2000)017<0441:totdoi>2.0.co;2
Boccippio, D. J., Koshak, W. J., & Blakeslee, R. J. (2002). Performance assessment of the
optical transient detector and lightning imaging sensor. Part I: Predicted diurnal variability. Journal of Atmospheric and Oceanic Technology, 19(9), 1318–1332.
doi:10.1175/1520-0426(2002)019<1318:paotot>2.0.co;2
Buechler, D. E., Koshak, W. J., Christian, H. J., & Goodman, S. J. (2014). Assessing the
performance of the lightning imaging sensor (LIS) using deep convective clouds. Atmospheric Research, 135, 397–403. doi:10.1016/j.atmosres.2012.09.008
Burrows, W. R., King, P., Lewis, P. J., Kochtubajda, B., Snyder, B., & Turcotte, V. (2002).
Lightning occurrence patterns over Canada and adjacent United States from lightning detection network observations. Atmosphere-Ocean, 40(1), 59–80.
doi:10.3137/ao.400104

78
Burrows, W. R., & Kochtubajda, B. (2010). A decade of cloud-to-ground lightning in Canada: 1999-2008. Part 1: Flash density and occurrence. Atmosphere-Ocean, 48(3), 177–194.
doi:10.3137/ao1118.2010
Cardille, J. A., & Foley, J. A. (2003). Agricultural land-use change in Brazilian Amazonia
between 1980 and 1995: Evidence from integrated satellite and census data. Remote
Sensing of Environment, 87(4), 551-562. doi:10.1016/j.rse.2002.09.001
Carey, L. D., & Rutledge, S. A. (2003). Characteristics of cloud-to-ground lightning in severe and nonsevere storms over the central United States from 1989–1998. Journal of
Geophysical Research-Atmospheres, 108(D15), 21. doi:10.1029/2002jd002951
Cecil, D. J., Buechler, D. E., & Blakeslee, R. J. (2014). Gridded lightning climatology from TRMM-LIS and OTD: Dataset description. Atmospheric Research, 135, 404–414.
doi:10.1016/j.atmosres.2012.06.028
Contiu, S., & Groza, A. (2016). Improving remote sensing crop classification by argumentation-
based conflict resolution in ensemble learning. Expert Systems with Applications, 64,
269-286. doi:10.1016/j.eswa.2016.07.037
Changnon, S. A. (1988a). Climatography of thunder events in the conterminous United States. Part I: Temporal aspects. Journal of Climate, 1(4), 389–398. doi:10.1175/1520-
0442(1988)001<0389:coteit>2.0.co;2
Changnon, S. A. (1988b). Climatography of thunder events in the conterminous United States. Part II: Spatial aspects. Journal of Climate, 1(4), 399–405. doi:10.1175/1520-
0442(1988)001<0399:coteit>2.0.co;2
Chen, X. L., Zhao, H. M., Li, P. X., & Yin, Z. Y. (2006). Remote sensing image-based analysis
of the relationship between urban heat island and land use/cover changes. Remote Sensing of Environment, 104(2), 133–146. doi:10.1016/j.rse.2005.11.016
Collier, A. B., Hughes, A. R. W., Lichtenberger, J., & Steinbach, P. (2006). Seasonal and
diurnal variation of lightning activity over southern Africa and correlation with European whistler observations. Annales Geophysicae, 24(2), 529–542.
Cooray, V. (2015). An Introduction to Lightning. http://dx.doi.org/10.1007/978–94–017–8938–
7. Dordrecht, Netherlands: Springer, 386 pp.
Cummins, K. L., & Murphy, M. J. (2009). An overview of lightning locating systems: History,
techniques, and data uses, with an in-depth look at the U.S. NLDN. IEEE Transactions
on Electromagnetic Compatibility, 51(3), 499-518. doi:10.1109/temc.2009.2023450
Curran, E. B., Holle, R. L., & López, R. E. (2000). Lightning casualties and damages in the United States from 1959 to 1994. Journal of Climate, 13(19), 3448–3464.
doi:10.1175/1520-0442(2000)013<3448:LCADIT>2.0.CO;2

79
Cramer, J. A., & Cummins, K. L. (2014, March). Evaluating location accuracy of lightning
location networks using tall towers. In 23rd International Lightning Detection Conference & 5th International Lightning Meteorology Conference, 18–21.
Demetriades, N. W., Murphy, M. J., & Cramer, J. A. (2010, April). Validation of Vaisala’s
global lightning dataset (GLD360) over the continental United States. In Preprints, 29th
Conference on Hurricanes and Tropical Meteorology, Tucson, AZ, American
Meteorological Society D (Vol. 16).
Dewan, A. M., & Yamaguchi, Y. (2009). Land use and land cover change in greater Dhaka,
Bangladesh: Using remote sensing to promote sustainable urbanization. Applied
Geography, 29(3), 390-401. doi:10.1016/j.apgeog.2008.12.005
Dowdy, A. J. (2016). Seasonal forecasting of lightning and thunderstorm activity in tropical and
temperate regions of the world. Scientific Reports, 6. doi:10.1038/srep20874
Dowdy, A. J., & Kuleshov, Y. (2014). Climatology of lightning activity in Australia: Spatial
and seasonal variability. Australian Meteorological and Oceanographic Journal, 64(2), 103–108.
Easterling, D. R., & Robinson, P. J. (1985). The diurnal-variation of thunderstorm activity in the United-States. Journal of Climate and Applied Meteorology, 24(10), 1048–1058.
doi:10.1175/1520-0450(1985)024<1048:tdvota>2.0.co;2
Esri. (2016). Raster processing toolset: resample. Tool Reference. https://pro.arcgis.com/en/pro-
app/tool-reference/data-management/resample.html
Fan, F. L., Weng, Q. H., & Wang, Y. P. (2007). Land use and land cover change in Guangzhou,
China, from 1998 to 2003, based on Landsat TM/ETM+ imagery. Sensors, 7(7), 1323–
1342. doi:10.3390/s7071323
Freund, R. J., Wilson, W. J., & Mohr, D. L. (2010). Statistical Methods. Third edition.
Burlington, MA: Academic Press, 824 pp.
Fotheringham, A. S., Brunsdon, C., & Charlton, M. (2002). Geographically Weighted
Regression: The Analysis of Spatially Varying Relationships. West Sussex, UK: Wiley.
284 pp.
GISpopsci. (2016). Geographically weighted regression: Introduction to Geographically
Weighted Regression. In Advanced Spatial Analysis. http://gispopsci.org/geographically-
weighted-regression/
Haberlie, A. M., Ashley, W. S., & Pingel, T. J. (2015). The effect of urbanisation on the
climatology of thunderstorm initiation. Quarterly Journal of the Royal Meteorological Society, 141(688), 663–675. doi:10.1002/qj.2499

80
Hodanish, S., Sharp, D., Collins, W., Paxton, C., & Orville, R. E. (1997). A 10-yr monthly lightning climatology of Florida: 1986–95. Weather and Forecasting, 12(3), 439–448.
doi:10.1175/1520-0434(1997)012<0439:aymlco>2.0.co;2
Holle, R. L. (2014). Diurnal variations of NLDN-reported cloud-to-ground lightning in the United States. Monthly Weather Review, 142(3), 1037–1052. doi:10.1175/mwr-d-13-
00121.1
Holle, R. L., & Murphy, M. J. (2015). Lightning in the North American monsoon: An exploratory climatology. Monthly Weather Review, 143(5), 1970–1977.
doi:10.1175/mwr-d-14-00363.1
Holle, R. (2016). Lightning fatalities by state, 2005-2014. Vaisala Inc.
http://www.lightningsafety.noaa.gov/stats/05-14deaths_by_state_maps.pdf
Hu, H., Wang, J., & Pan, J. (2014). The characteristics of lightning risk and zoning in Beijing
simulated by a risk assessment model. Natural Hazards and Earth System Sciences,
14(8), 1985–1997. doi:10.5194/nhess-14-1985-2014
Huang, C. Q., Goward, S. N., Schleeweis, K., Thomas, N., Masek, J. G., & Zhu, Z. L. (2009).
Dynamics of national forests assessed using the Landsat record: Case studies in eastern United States. Remote Sensing of Environment, 113(7), 1430–1442.
doi:10.1016/j.rse.2008.06.016
Huffines, G. R., & Orville, R. E. (1999). Lightning ground flash density and thunderstorm
duration in the continental United States: 1989-96. Journal of Applied Meteorology, 38(7), 1013–1019. doi:10.1175/1520-0450(1999)038<1013:lgfdat>2.0.co;2
Idone, V. P., Davis, D. A., Moore, P. K., Wang, Y., Henderson, R. W., Ries, M., & Jamason, P.
F. (1998). Performance evaluation of the US national lightning detection network in
eastern New York - 1. Detection efficiency. Journal of Geophysical Research-Atmospheres, 103(D8), 9045–9055. doi:10.1029/98jd00154
Jacobson, A. R., Holzworth, R., Harlin, J., Dowden, R., & Lay, E. (2006). Performance
assessment of the world-wide lightning location network (WWLLN), using the Los
Alamos sferic array (LASA) as ground truth. Journal of Atmospheric and Oceanic Technology, 23(8), 1082–1092. doi:10.1175/jtech1902.1
James, G., Witten, D., Hastie, T., and Tibshirani, R. (2013). An Introduction to Statistical
Learning with Applications in R. Springer, New York.
Jensen, J. R. (1981). Urban change detection mapping using Landsat digital data. American Cartographer, 8(2), 127–147.

81
Ju, J. C., & Roy, D. P. (2008). The availability of cloud-free Landsat ETM plus data over the
conterminous United States and globally. Remote Sensing of Environment, 112(3), 1196–1211. doi:10.1016/j.rse.2007.08.011
Kalnay, E., & Cai, M. (2003). Impact of urbanization and land-use change on climate. Nature, 423(6939), 528–531. doi:10.1038/nature01675
Koshak, W. J., Cummins, K. L., Buechler, D. E., Vant-Hull, B., Blakeslee, R. J., Williams, E. R., & Peterson, H. S. (2015). Variability of CONUS lightning in 2003–12 and associated
impacts. Journal of Applied Meteorology and Climatology, 54(1), 15–41.
doi:10.1175/jamc-d-14-0072.1
Laing, A., LaJoie, M., Reader, S., & Pfeiffer, K. (2008). The influence of the El Niño-Southern
Oscillation on cloud-to-ground lightning activity along the Gulf Coast. Part II: Monthly
correlations. Monthly Weather Review, 136(7), 2544-2556. doi:10.1175/2007mwr2228.1
LaJoie, M., & Laing, A. (2008). The influence of the El Niño-Southern Oscillation on cloud-to-
ground lightning activity along the Gulf Coast. Part I: Lightning climatology. Monthly Weather Review, 136(7), 2523–2542. doi:10.1175/2007mwr2227.1
Lericos, T. P., Fuelberg, H. E., Watson, A. I., & Holle, R. L. (2002). Warm season lightning
distributions over the florida peninsula as related to synoptic patterns. Weather and
Forecasting, 17(1), 83-98. doi:10.1175/1520-
0434(2002)017<0083:wsldot>2.0.co;2
Liu, J. Y., Liu, M. L., Tian, H. Q., Zhuang, D. F., Zhang, Z. X., Zhang, W., . . . Deng, X. Z. (2005). Spatial and temporal patterns of China's cropland during 1990–2000: An
analysis based on Landsat TM data. Remote Sensing of Environment, 98(4), 442–456.
doi:10.1016/j.rse.2005.08.012
Lyon, J. G., Yuan, D., Lunetta, R. S., & Elvidge, C. D. (1998). A change detection experiment
using vegetation indices. Photogrammetric Engineering and Remote Sensing, 64(2), 143–150.
López, R. E., & Holle, R. L. (1998). Changes in the number of lightning deaths in the United States during the twentieth century. Journal of Climate, 11(8), 2070–2077.
doi:doi:10.1175/1520-0442-11.8.2070
Mach, D. M., Christian, H. J., Blakeslee, R. J., Boccippio, D. J., Goodman, S. J., & Boeck, W.
L. (2007). Performance assessment of the optical transient detector and lightning
imaging sensor. Journal of Geophysical Research-Atmospheres, 112(D9), 16.
doi:10.1029/2006jd007787
Maclaurin, G. J., & Leyk, S. (2016). Extending the geographic extent of existing land cover data
using active machine learning and covariate shift corrective sampling. International
Journal of Remote Sensing, 37(21), 5213-5233. doi:10.1080/01431161.2016.1230285

82
Maier, M. W., & Piotrowicz, J. M. (1981). A lightning ground flash density climatology for the United-States. Bulletin of the American Meteorological Society, 62(9), 1403–1403.
Makela, A., Rossi, P., & Schultz, D. M. (2011). The daily cloud-to-ground lightning flash
density in the contiguous United States and Finland. Monthly Weather Review, 139(5), 1323–1337. doi:10.1175/2010mwr3517.1
Mallick, S., Rakov, V. A., Hill, J. D., Ngin, T., Gamerota, W. R., Pilkey, J. T., Nag, A. (2014).
Performance characteristics of the NLDN for return strokes and pulses superimposed on steady currents, based on rocket-triggered lightning data acquired in Florida in 2004–
2012. Journal of Geophysical Research-Atmospheres, 119(7), 3825–3856.
doi:10.1002/2013jd021401
Massey, F. J. (1951). The kolmogorov-smirnov test for goodness of fit. Journal of the American
Statistical Association, 46(253), 68-78. doi:10.1080/01621459.1951.10500769
Murphy, M. S., & Konrad, C. E. (2005). Spatial and temporal patterns of thunderstorm events
that produce cloud-to-ground lightning in the interior southeastern United States. Monthly Weather Review, 133(6), 1417–1430. doi:10.1175/mwr2924.1
Naccarato, K. P., Pinto, O., & Pinto, I. (2003). Evidence of thermal and aerosol effects on the
cloud-to-ground lightning density and polarity over large urban areas of southeastern
Brazil. Geophysical Research Letters, 30(1674). doi:10.1029/2003gl017496, 13
NASA. (2016). Lightning and Atmospheric Electricity Research. Global Hydrology Resource
Center. https://lightning.nsstc.nasa.gov/data/data_lis-otd-climatology.html.
Nastos, P. T., Matsangouras, I. T., & Chronis, T. G. (2014). Spatio-temporal analysis of
lightning activity over Greece - preliminary results derived from the recent state precision lightning network. Atmospheric Research, 144, 207–217.
doi:10.1016/j.atmosres.2013.10.021
NWS. (2015). How dangerous is lightning?. National Oceanic and Atmospheric Administration
and National Weather Service. http://www.lightningsafety.noaa.gov/odds.shtml
NWS. (2016). United States lightning deaths. National Weather Service.
http://www.lightningsafety.noaa.gov/fatalities.shtml
Orville, R. E., Huffines, G., Nielsen-Gammon, J., Zhang, R. Y., Ely, B., Steiger, S., Read, W.
(2001). Enhancement of cloud-to-ground lightning over Houston, Texas. Geophysical
Research Letters, 28(13), 2597–2600. doi:10.1029/2001gl012990
Orville, R. E., & Huffines, G. R. (1999). Lightning ground flash measurements over the contiguous United States: 1995-97. Monthly Weather Review, 127(11), 2693–2703.
doi:10.1175/1520-0493(1999)127<2693:lgfmot>2.0.co;2

83
Pinto, O., Pinto, I., & Naccarato, K. P. (2007). Maximum cloud-to-ground lightning flash
densities observed by lightning location systems in the tropical region: A review. Atmospheric Research, 84(3), 189–200. doi:10.1016/j.atmosres.2006.11.007
Rakov, V. A., & Uman, M. A. (2003). Lightning: Physics and Effects: Cambridge University
Press. Pp. 1-700.
Roeder, W. P., Cummins, B. H., Cummins, K. L., Holle, R. L., & Ashley, W. S. (2015).
Lightning fatality risk map of the contiguous United States. Natural Hazards, 79(3), 1681–1692. doi:10.1007/s11069-015-1920-6
Rose, L. S., Stallins, J. A., & Bentley, M. L. (2008). Concurrent cloud-to-ground lightning and
precipitation enhancement in the Atlanta, Georgia (United States), urban region. Earth
Interactions, 12. doi:10.1175/2008ei265.1
Rudlosky, S. D., & Shea, D. T. (2013). Evaluating WWLLN performance relative to trmm/lis. Geophysical Research Letters, 40(10), 2344–2348. doi:10.1002/grl.50428
Scanlon, B. R., Reedy, R. C., Stonestrom, D. A., Prudic, D. E., & Dennehy, K. F. (2005).
Impact of land use and land cover change on groundwater recharge and quality in the southwestern us. Global Change Biology, 11(10), 1577–1593. doi:10.1111/j.1365-
2486.2005.01026.x
Scheffé, H. (1959). The Analysis of Variance. New York: John Wiley. 477 pp.
Schultz, C. J., Petersen, W. A., & Carey, L. D. (2011). Lightning and severe weather: A
comparison between total and cloud-to-ground lightning trends. Weather and Forecasting, 26(5), 744–755. doi:10.1175/waf-d-10-05026.1
Sen Roy, S., & Balling, R. C. (2013). Spatial patterns of diurnal variations in summer-season
lightning activity across the tropical and subtropical regions of the northern hemispheric Americas. Meteorology and Atmospheric Physics, 121(3–4), 199–206.
doi:10.1007/s00703-013-0259-3
Seneviratne, S. I., Luthi, D., Litschi, M., & Schar, C. (2006). Land-atmosphere coupling and climate change in Europe. Nature, 443(7108), 205–209. doi:10.1038/nature05095
Seto, K. C., Woodcock, C. E., Song, C., Huang, X., Lu, J., & Kaufmann, R. K. (2002).
Monitoring land-use change in the Pearl River delta using Landsat TM. International Journal of Remote Sensing, 23(10), 1985–2004. doi:10.1080/01431160110075532
Shalaby, A., & Tateishi, R. (2007). Remote sensing and GIS for mapping and monitoring land
cover and land-use changes in the northwestern coastal zone of Egypt. Applied Geography, 27(1), 28–41. doi:10.1016/j.apgeog.2006.09.004

84
Singh, A. (1988). Digital change detection techniques using remotely-sensed data. International Journal of Remote Sensing, 10(6), 983–1003.
doi:http://dx.doi.org/10.1080/01431168908903939
Smith, J. R., Fuelberg, H. E., & Watson, A. I. (2005). Warm season lightning distributions over
the northern Gulf of Mexico coast and their relation to synoptic-scale and mesoscale environments. Weather and Forecasting, 20(4), 415–438. doi:10.1175/WAF870.1
Stallins, J. A., & Bentley, M. L. (2006). Urban lightning climatology and GIS: An analytical framework from the case study of Atlanta, Georgia. Applied Geography, 26(3–4), 242–
259. doi:10.1016/j.apgeog.2006.09.008
Steiger, S. M., Orville, R. E., & Huffines, G. (2002). Cloud-to-ground lightning characteristics over Houston, Texas: 1989–2000. Journal of Geophysical Research-Atmospheres,
107(D11), 18. doi:10.1029/2001jd001142
Tan, K. C., Lim, H. S., MatJafri, M. Z., & Abdullah, K. (2010). Landsat data to evaluate urban
expansion and determine land use/land cover changes in Penang Island, Malaysia. Environmental Earth Sciences, 60(7), 1509–1521. doi:10.1007/s12665-009-0286-z
Tang, Z., Engel, B. A., Pijanowski, B. C., & Lim, K. J. (2005). Forecasting land use change and
its environmental impact at a watershed scale. Journal of Environmental Management, 76(1), 35–45. doi:10.1016/j.jenvman.2005.01.006
Tinmaker, M. I. R., Aslam, M. Y., & Chate, D. M. (2014). Climatology of lightning activity over the Indian seas. Atmosphere-Ocean, 52(4), 314–320.
doi:10.1080/07055900.2014.941323
Todd, W. J. (1977). Urban and regional land-use change detected by using Landsat data. Journal of Research of the U.S. Geological Survey, 5(5), 529–534.
Ushio, T., Heckman, S., Driscoll, K., Boccippio, D., Christian, H., & Kawasaki, Z. (2002).
Cross-sensor comparison of the lightning imaging sensor (LIS). International Journal of Remote Sensing, 23(13), 2703–2712. doi:10.1080/01431160110107789
Villarini, G., & Smith, J. A. (2013). Spatial and temporal variability of cloud-to-ground
lightning over the continental US during the period 1995-2010. Atmospheric Research, 124, 137–148. doi:10.1016/j.atmosres.2012.12.017
Virts, K. S., Wallace, J. M., Hutchins, M. L., & Holzworth, R. H. (2013). Highlights of a new
ground-based, hourly global lightning climatology. Bulletin of the American Meteorological Society, 94(9), 1381–1391. doi:10.1175/bams-d-12-00082.1
Virts, K. S., Wallace, J. M., Hutchins, M. L., & Holzworth, R. H. (2015). Diurnal and seasonal
lightning variability over the Gulf Stream and the Gulf of Mexico. Journal of the Atmospheric Sciences, 72(7), 2657–2665. doi:10.1175/jas-d-14-0233.1
85
Visser, J. M., Duke-Sylvester, S. M., Carter, J., & Broussard III, W. P. (2013). A computer
model to forecast wetland vegetation changes resulting from restoration and protection
in coastal Louisiana. Journal of Coastal Research, 67(sp1), 51-59.
Vogelmann, J. E., Sohl, T. L., Campbell, P. V., & Shaw, D. M. (1998). Regional land cover
characterization using Landsat thematic mapper data and ancillary data sources.
Environmental Monitoring and Assessment, 51(1-2), 415-428.
doi:10.1023/a:1005996900217
Wallace, J. M. (1975). Diurnal variations in precipitation and thunderstorm frequency over the conterminous United States. Monthly Weather Review, 103(5), 406–419.
doi:10.1175/1520-0493(1975)103<0406:DVIPAT>2.0.CO;2
Watson, A. I., & Holle, R. L. (1996). An eight-year lightning climatology of the southeast
United States prepared for the 1996 summer olympics. Bulletin of the American Meteorological Society, 77(5), 883–890. doi:10.1175/1520-0477(1996)077
<0883:aeylco>2.0.co;2
Westcott, N. E. (1995). Summertime cloud-to-ground lightning activity around major midwestern urban areas. Journal of Applied Meteorology, 34(7), 1633–1642.
doi:10.1175/1520-0450-34.7.1633
Williams, E. R. (2005). Lightning and climate: A review. Atmospheric Research, 76(1–4), 272–
287. doi:10.1016/j.atmosres.2004.11.014
Williams, S. J., Stone, G. W., & Burruss, A. E. (2012). A perspective on the Louisiana wetland
loss and coastal erosion problem. Journal of Coastal Research, 13(3), 593–594.
Yang, H., Pasko, V. P., & Sátori, G. (2009). Seasonal variations of global lightning activity
extracted from Schumann resonances using a genetic algorithm method. Journal of
Geophysical Research-Atmospheres, 114(D01103). doi:10.1029/2008jd009961
Yuan, F., Sawaya, K. E., Loeffelholz, B. C., & Bauer, M. E. (2005). Land cover classification
and change analysis of the twin cities (Minnesota) metropolitan area by multitemporal Landsat remote sensing. Remote Sensing of Environment, 98(2–3), 317–328.
doi:10.1016/j.rse.2005.08.006
Zajac, B. A., & Rutledge, S. A. (2001). Cloud-to-ground lightning activity in the contiguous United States from 1995 to 1999. Monthly Weather Review, 129(5), 999–1019.
doi:10.1175/1520-0493(2001)129<0999:CTGLAI>2.0.CO;2
Zhang, Q., Wang, J., Peng, X., Gong, P., & Shi, P. (2002). Urban built-up land change detection
with road density and spectral information from multi-temporal Landsat TM data. International Journal of Remote Sensing, 23(15), 3057–3078.
doi:10.1080/01431160110104728

86
Zhu, Y. N., Rakov, V. A., Mallick, S., & Tran, M. D. (2015). Characterization of negative
cloud-to-ground lightning in florida. Journal of Atmospheric and Solar-Terrestrial
Physics, 136, 8-15. doi:10.1016/j.jastp.2015.08.006

87
Vita
Nicholas Sokol was born in Charleston, South Carolina, and was raised in several states
including Delaware, Florida, Maryland, New Jersey, North Carolina, Pennsylvania, and South
Carolina. He earned a Bachelor of Science in geography and environmental planning from
Towson University in May 2015. Immediately after his commencement Nicholas attended
Louisiana State University to pursue the M.S. in geography in the Fall 2015. He will receive the
Master of Science degree in Fall 2016.