Embed Size (px)
Citation preview

Corresponding author address:
83
Australian Meteorological and Oceanographic Journal 58 (2009) 83-98
Introduction
Early records of Australia’s past climate variability are es-sential for evaluating the historical context of extreme events – such as the current drought gripping southern Australia – and defining our range of pre-industrial climate variability. Descriptions of Australian temperature, pressure and rain-
fall patterns are largely confined to interpretations of 20th century weather records. For example, even in the early years of the 21st century, we still do not have a robust, pre-20th century history of cycles of drought in southeastern Australia where approximately 58 per cent of the population lives (Australian Bureau of Statistics 2009). To date, there has been limited exploration of Australian historical records for pre-20th century weather information. Aside from the pioneering works of the 19th century (Jevons 1859; Russell 1877), there have been very few attempts to reconstruct Australian pre-20th century climate using ear-ly weather station or documentary records (Nicholls 1988;
A climate reconstruction of Sydney Cove, New South Wales, using weather journal and
documentary data, 1788–1791
Joëlle Gergis and David J. KarolySchool of Earth Sciences, University of Melbourne, Australia
andRob J. Allan
Met Office Hadley Centre, Exeter, United Kingdom
(Manuscript received March 2009;
Revised May 2009)
This study presents the first analysis of the weather conditions experienced at Sydney Cove, New South Wales, during the earliest period of the European settle-ment of Australia. A climate analysis is presented for January 1788 to December 1791 using daily temperature and barometric pressure observations recorded by William Dawes in Sydney Cove and a temperature record kept by William Bradley on board the HMS Sirius anchored in Port Jackson (Sydney Harbour) in the early months of the First Fleet’s arrival in Australia. Remarkably, the records appear comparable with modern day measurements taken from Sydney Observatory Hill, displaying similar daily variability, a distinct seasonal cycle and considerable inter-annual variability. To assess the reliability of these early weather data, they were cross-verified with other data sources, including anecdotal observations recorded in First Fleet documentary records and independent palaeoclimate reconstructions. Some bi-ases in the temperature record, likely associated with the location of the thermom-eter, have been identified. Although the 1788–1791 period experienced a marked La Niña to El Niño fluctuation according to palaeoclimatic data, the cool and warm intervals in Sydney over this period cannot be conclusively linked to El Niño–Southern Oscillation (ENSO) conditions. This study demonstrates that there are excellent opportunities to expand our description of pre-20th century climate vari-ability in Australia while contributing culturally significant material to the emerg-ing field of Australian environmental history.
Dr Joëlle Gergis, School of Earth Sciences, University of Melbourne, Victoria 3010, Australia.Email: [email protected]

84 Australian Meteorological and Oceanographic Journal 58:2 June 2009
Grove 1998). Even less work has been aimed at reconstruct-ing southeastern Australia’s flood, bushfire, dust storm and cyclone history and past societies’ response to historical cli-mate variability. In 1977, a discovery was made that had the potential to illuminate Australia’s meteorological record during the very founding of the colony in New South Wales in 1788. A me-teorological record kept by Lieutenant William Dawes, a sci-entist who sailed on the First Fleet, was discovered in the Library of the Royal Society in London by McAfee (1981). It seems a comment made by one of the founding fathers of Australian meteorology, Henry Chamberlain Russell, that: ‘there seems little doubt that Dawes kept weather records but there are no records of them’ (Russell 1877), deterred meteorologists of the day from pursuing the data. Astonishingly, the daily weather measurements spanning 14 September 1788 to 6 December 1791 were finally copied onto microfilm and presented in an Australian Bureau of Me-teorological Historical Note in 1977 (McAfee 1981), around 190 years after Dawes began his journal. Perhaps because of the large job of transcribing 182 hand-written pages of up to six daily observations of temperature, barometric pressure, winds and weather remarks, further work to digitise the re-cord was not completed. Despite its immense cultural and scientific significance, it took nearly a further thirty years be-fore researchers at the University of Melbourne transcribed the data in the spring of 2008. According to McAfee (1981), a weather journal with comparable detail for this period any-where in the world is a rare find. For the Indo-Australian re-gion, Dawes weather journal is only matched by the English East India Company observations made in Madras (Chen-nai), India, from 1796 onwards (Allan et al. 2002). The aim of this paper is to evaluate and interpret this earli-est weather record kept by Europeans in Australia. We pres-ent the results of a climate analysis for Sydney Cove from January 1788 to December 1791 using the daily temperature and barometric pressure recorded by William Dawes and a temperature record kept by William Bradley on board the supply ship Sirius anchored in Port Jackson (Sydney Har-bour) in the early months of the First Fleet’s arrival in Aus-tralia. Finally, we cross-verify our results with anecdotal ob-servations recorded in First Fleet documentary records and independent palaeoclimate reconstructions.
Data and methods
Historical temperature and pressure measurements: description and caveats
As described by McAfee (1981), Dawes’s weather journal is organised with seven days per page with six columns re-cording: the day and time the observation was taken; the wind direction and speed; weather comments; barometric pressure; temperature; and general remarks. For this study,
Dawes’s temperature readings (up to six daily) were used from 14 September 1788 to 6 December 1791. Note that temperatures were not necessarily taken consistently at the same time every day. For example, some days there may be a specific 6am or 9am reading; at other times, there may only be a ‘before sunrise’ or ‘after sunrise’ reading. Similarly there may be a specific 6pm reading or a ‘sunset’ or ‘after sunset’ evening reading. As temperature readings were originally measured in Fahrenheit, they were converted to degrees Celsius (°C) using the standard conversion equation (Temp (°F)-32)/1.8). For comparison with modern data from Sydney’s Observatory Hill station, daily maximum readings (Tmax), minimum (Tmin) readings and average (Tmean) temperature ((Tmin+Tmax)/2) were extracted for each day. Tmax and Tmin are the highest and lowest values recorded from the temperature readings for each day. Since a maxi-mum-minimum thermometer was not used, these may not be the actual highest and lowest temperatures each day. Di-urnal Temperature Range (DTR) was calculated by subtract-ing Tmin from Tmax each day and is likely underestimated. Noon temperature (Tnoon) readings were also analysed for comparison with the offshore midday temperature readings recorded in ship logs kept by Lieutenant William Bradley aboard HMS Sirius (discussed below). Dawes thermometer is described as being: ‘by Nairne & Blunt, small & divided only to every two degrees [°F], the whole scale from 0 to 212 being in length 6.23 inches. Both were kept constantly out of their cases so that the bulb might be fully exposed to the air, having nothing attached to it but the metal scale in Ramsdens [owned by ‘Mr Furzer’, a quar-termaster on the Sirius] & the wooden scale in Nairne & Blunt’s’ (see McAfee 1981). Although the specific locations where Dawes positioned the thermometers are unknown, McAfee (1981) suggests that they were most likely in a well ventilated position inside the observatory. There was no fireplace in the observatory, and the rooms were fairly well ventilated with a canvas roof on the circular observation room and a canvas shutter on the roof of the main building (McAfee 1981). From the daily range of temperatures, he suggests that there seems little reason to suspect a very airtight or heated room exposed to direct sunlight. Between 14 September 1788 and 1 July 1791, Dawes used a barometer made by Burton supplied by the Board of Lon-gitude. McAfee (1981) reports that the barometric readings may be imperfect because of a crack in the cistern that al-lowed some of the mercury (quicksilver) to escape: ‘It was my intention to have it [the barometer] examined on its re-turn to England, as, owing to the marker having depend-ed upon glue to keep the cistern tight where it had been crack’d, it had but a small quantity of quicksilver, which I had discovered by observing a number of very small glob-ules immediately under it on the floor of the observatory. In packing it up, however, I found a large crack in the cistern,

Gergis et al.: A climate reconstruction of Sydney Cove 85
thro’ which perhaps all the quicksilver would have escaped in the course of the passage [back to England] and have en-dangered breaking the tube; I therefore emptied it entirely and then packed it up’. This issue probably resulted in the absence of barometric readings from 3 September 1789 to November 1789 until it was finally packed away on 2 July 1791 and replaced by a Ramsden model supplied by ‘Mr Furzer’ in the colony. Read-ings taken from 12 July 1791 to 6 December 1791 appear to be far too low to be considered reliable. McAfee (1981) suggests that this may have been due to Dawes’s unfamiliarity with the instrument noted in the back of his journal: ‘With respect to that of Mr Furzer’s [barometer], which he was so obliging as to spare me, it appears to be a very good one of Ramsden construction and is furnished with a gage point, tho’ from the one I had before used, not having any such thing, and my then ignorance of the instrument, it was never attended to, but the bottom of the bag was let down as low as it would come and the observations made without attending to the gage point at all’. As such, pressure readings taken between July and December 1791 were excluded from this analysis to avoid biasing the results. Despite the fact that these pressure readings are unlikely to be as accurate as absolute readings, they do provide some indication of the relative variability of atmospheric pressure experienced in Sydney at the time. Dawes’s original pressures were recorded in inches of mercury (In Hg) so were converted into hectoPascals (hPa) using the standard conversion (hPa=(In Hg) x 33.86). Station pressure was corrected to mean sea level pressure (MSLP) using the hypsometric equation (Wallace and Hobbs 2006) using the Observatory Hill’s elevation of 40.2 metres (Bureau of Meteorology station 066062). The exact locations of the barometer and thermometer are unknown, but according to McAfee (1981), the barometer was most likely located inside with a thermometer attached, as was standard practice at the time. To supplement Dawes’s temperature record back to the arrival of the First Fleet in January 1788, William Bradley’s daily noon temperatures (°F) recorded in a weather journal kept on the HMS Sirius while anchored in Botany Bay (20 January 1788 to 26 January 1788) and Port Jackson (27 Janu-ary 1788 to 13 September 1788) were used. According to a facsimile of Bradley’s journal (Bradley 1969, p. 357) ‘the ther-mometer was kept high in the Captain’s cabin, close to the Timekeeper’. When comparing the small overlap between Bradley’s measurements with Dawes’s, Bradley’s readings are somewhat lower, likely due to the moderating influence of water on daytime temperatures recorded offshore. The average difference in the short period of overlap (16 read-ings between 14 September and 30 September 1788, one missing value) is 2.1°C. Note that since the southern hemisphere summer season (DJF) straddles two calendar years, the year in which the De-cember falls is used to label seasons e.g. for DJF 1788–89,
December lies in 1788 while January and February fall in 1789. With the exception of William Bradley’s single Tnoon readings, only days with more than two temperature or pressure recordings were used to calculate maximum, mini-mum or mean temperature or pressure for Sydney.
Modern climate data: temperature, MSLP and El Niño–Southern Oscillation (ENSO)
Luckily, the site of William Dawes’s original observatory is only 500 m from the modern day Observatory Hill weather station (066062), allowing comparison of Sydney’s 18th cen-tury climate data with modern readings taken from virtually the same location. Note that Dawes original observatory was located at the western side of Sydney Cove, approximately where the southeastern pylon of the Sydney Harbour Bridge stands today. Dawes calculated the latitude and longitude of the location to be 33° 50’S 151° 20’E (McAfee 1981). To evaluate the quality of Dawes’s 18th century data, they were compared with modern climate data from Sydney’s Observatory Hill (station 066062) accessed through the Bu-reau of Meteorology. Daily temperature data (Tmean, Tmax, Tmin) (January 1876 to 31 December 2007) and daily Mean Sea Level Pressure (MSLP) (1 January 1955 to 31 December 2007) were used. Between 1850 and 1954, when high quality MSLP data were unavailable, data for the Sydney Regional Office used in the Met Office’s HadSLP2 reanalysis were used (Allan, pers comm, 2008). Note that the overlapping period of HadSLP2 with the Bureau of Meteorology’s MSLP data (1 January 1955 to 31 December 2003) is highly corre-lated (r=0.981, significant at the 0.01 level), so is unlikely to bias our results. To examine the relationship between contemporary Syd-ney’s climate variables and El Niño–Southern Oscillation (ENSO) conditions, modern Observatory Hill data were correlated with (i) Darwin monthly MSLP sourced from the Bureau of Meteorology (January 1876–December 2007), (ii) Southern Oscillation Index (SOI) values sourced from the Bureau of Meteorology (January 1876–December 2007) and the composite SOI and Niño 3.4 SST Coupled ENSO Index (CEI) of Gergis and Fowler (2005) (January 1876–December 2007). CEI-defined ENSO months presented by Gergis and Fowler (2005) were used to calculate ENSO composites to assess any ENSO forcing on Sydney’s local temperature and MSLP variations during El Niño and La Niña conditions. Next, monthly and seasonal averages were calculated to evaluate changes in the seasonal cycle and inter-annual vari-ability recorded by Dawes’s temperature and MSLP data. Seasonal averages were then standardised to the mean and standard deviation of the modern observational records (1876–2007 period for temperature, 1850–2007 for MSLP) to examine anomalies for each 18th century season relative to Observatory Hill’s long-term climatology and ENSO condi-tions.

86 Australian Meteorological and Oceanographic Journal 58:2 June 2009
Verification using documentary and palaeoclimate records
According to Jones (2008), it is rare for documentary accounts of weather to overlap with instrumental records as diarists were often keen to use the newly developed instruments and quickly abandoned their narrative accounts. Here, we are fortunate to have documentary accounts of weather condi-tions kept in government officials’ journals and diaries (as found in those of David Collins, John Hunter, Arthur Phillip and William Bradley) to compare with Dawes’s instrumen-tal weather measurements, allowing us to objectively verify conditions suggested by the inherently subjective accounts recorded in various documentary records. Finally, the 1788–91 data from Sydney Cove were com-pared with an annual multi-proxy palaeoclimate reconstruc-tion of ENSO events developed by Gergis and Fowler (2009). This provides an opportunity to independently examine whether the early years of the colony were influenced by large-scale, Pacific Basin-wide ENSO events.
Results
Evaluation of the seasonal cycle, 1788–1791
Figure 1 compares the mean seasonal cycle present in Dawes’s 18th century temperature observations (Tmax, Tmin, DTR) with the modern day climatology of Sydney’s Observatory Hill. Remarkably, there is very good agreement between the two temperature records, with the exception of slightly higher readings in the summer months and marginally cooler winter temperatures in Dawes’s observations. This may be due to the way the thermometers were exposed: that is, the absence of Stevenson screens that shield meteorological instruments from the influences of direct heat radiation and provide adequate ventilation, moderating the registration of extremes, which generally explains the differences between 20th century and earlier instrumentation (Nicholls et al. 1996; Torok and Nicholls 1996). The DTR registered by Dawes’s measurements underestimate Observatory Hill’s modern DTR on average by a maximum of 2.5°C in September and a minimum of 0.3°C in February. That is, the winter–spring months display the highest difference from modern DTR. This may reflect inconsistencies in the time of day that measurements were taken by Dawes and less frequent observations, which prevented accurate observations of maximum and minimum temperatures, particularly in the cool season. Figure 2 shows general agreement between the season-al cycle present in a composite of Dawes’s MSLP data and modern MSLP data for Sydney. There are, however, some irregularities seen in the months of February and October where the instrumentation problems discussed earlier are likely to have reduced the number of observations available
Fig. 1 Comparison of seasonal cycle in Sydney’s Observa-tory Hill (solid line) and Dawes’s (dotted line) temper-ature data (a) Tmax, (b) Tmin and (c) Diurnal Tempera-ture Range (DTR).
(a)
(b)
(c)

Gergis et al.: A climate reconstruction of Sydney Cove 87
Fig. 2 Comparison of seasonal cycle in Sydney’s Observa-tory Hill (solid line) and Dawes’s (dotted line) MSLP data (hPa).
Fig. 3 Seasonal cycle comparisons for Dawes (1788–1791) and modern observational data from Sydney’s Ob-servatory Hill (1876–2007) for (a) Tmax, (b) Tmin and (c) MSLP. Box and whiskers plot shows the median (50th), quartiles (25th, 75th). Maximum (minimum) values which are not an outlier (defined as falling be-tween 1.5 and 3 times the Inter-Quartile Range (IQR) from the end of a quartile box) or extreme (over 3 IQRs from the end of a quartile box) are shown by upper (lower) horizontal bar, or whisker.
to calculate monthly averages. Even so, Fig. 3 shows the striking similarity of the overall distribution of Dawes’s tem-perature Tmax, Tmin and MSLP with composites calculated using data available for all years (i.e. 1788–1791). As expected, the modern observational data from Syd-ney display greater variability in Fig. 3 as the composites are calculated using far more observations (1876–2007 pe-riod) compared with Dawes’s three years of observations between September 1788 and December 1791. Neverthe-less, Dawes’s 18th century temperature and MSLP data are clearly successful in reproducing Sydney’s modern seasonal cycle, albeit imperfectly. The ranges of daily extremes in temperature and MSLP from the Dawes data compare well with those from the modern observations for all seasons, except for Tmax in summer, when Dawes’s data are likely to slightly overestimate the highest maximum temperatures due to inadequate thermometer exposure. These results sug-gest that the record is useful for examining relative (rather than absolute) climate variations experienced during the first years of European settlement in Australia. Table 1 and Table 2 provide summary references of the monthly and sea-sonal weather conditions (Tmean, Tmax, Tmin, Tnoon, and MSLP) for the first three years in Sydney Cove (1788–1791). DTR tables are not provided given the clear bias noted in Fig. 1 (c).
(a)
(b)
(c)
Dawes
Dawes
Dawes
Modern observations
Modern observations
Modern observations

88 Australian Meteorological and Oceanographic Journal 58:2 June 2009
Monthly and seasonal averages, Sydney Cove, 1788–91
Monthly means (all years)
Tmean (°C)
Tmax (°C)
Tmin (°C)
Tnoon (°C)
MSLP (hPa)
January 22.9 26.9 18.8 26.4 1015.0February 22.9 26.4 19.5 25.4 1012.8March 21.2 24.9 17.6 23.6 1017.6April 18.8 22.6 15.0 21.6 1018.6May 15.2 19.2 11.3 19.1 1018.9June 12.3 15.6 9.0 15.5 1019.6July 11.6 15.7 7.5 14.9 1018.0August 12.4 17.4 7.4 17.2 1018.0September 15.6 19.9 11.4 19.7 1018.0October 18.2 22.6 13.8 22.6 1013.4November 20.7 25.6 15.9 25.4 1015.5December 22.1 25.8 18.4 26.9 1014.0
Seasonal means (all seasons)
Tmean (°C)
Tmax (°C)
Tmin (°C)
Tnoon (°C)
MSLP (hPa)
DJF 22.8 26.7 18.9 25.9 1013.9MAM 18.4 22.2 14.6 21.7 1018.4JJA 12.1 16.3 7.9 16.1 1018.5SON 18.3 22.8 13.8 22.9 1015.6
Table 1. Monthly and seasonal climatology (Tmean, Tmax, Tmin, Tnoon and MSLP) calculated for Sydney Cove, 1788–1791. Note that (i) MSLP data spanning July to December 1791 were omitted due to data quality is-sues as discussed and (ii) Tnoon monthly and sea-sonal means can sometimes appear slightly higher than Tmax averages as fewer Tnoon readings were available for calculating averages over a common period.
Table 2. Continued
Table 2. Detailed monthly weather summary (Tmean, Tmax, Tnoon,Tmin and MSLP) of Sydney Cove, 1788–1791. Note that (i) MSLP data from July to December 1791 were omitted due to data quality issues as discussed and (ii) Tnoon monthly means can sometimes appear slightly higher than Tmax averages as fewer Tnoon readings were available for calculating averages over a common period.
Tmean monthly averages, Sydney CoveMonthly mean 1788 1789 1790 1791January – 24.0 23.6 21.1February – 23.6 22.7 22.5March – 22.9 20.7 20.0April – 17.6 20.4 18.4May – 13.4 16.1 16.1June – 11.8 12.4 12.6July – 11.8 12.0 11.1August – 12.0 12.7 12.5September 16.9 14.9 15.7 14.9October 18.4 19.0 18.5 17.0November 20.5 23.6 19.5 19.3December 23.1 23.2 21.7 20.4
Tmax monthly averages, Sydney CoveMonthly mean 1788 1789 1790 1791January – 28.4 27.9 24.7February – 27.4 26.4 25.4March – 26.2 25.1 23.3April – 21.5 24.7 21.5May – 16.3 21.2 19.9June – 14.3 16.3 16.0July – 14.9 16.7 15.5August – 15.3 18.2 18.9September 20.0 19.1 21.2 19.1October 21.7 23.8 23.6 21.4November 25.3 29.2 24.4 23.4December 27.6 27.7 25.4 22.4
Tmin monthly averages, Sydney CoveMonthly mean 1788 1789 1790 1791January – 19.6 19.3 17.5February – 19.8 19.1 19.6March – 19.6 16.4 16.8April – 13.7 16.1 15.2May – 10.5 11.1 12.3June – 9.3 8.5 9.1July – 8.7 7.3 6.6August – 8.7 7.3 6.1September 13.9 10.8 10.1 10.7October 15.0 14.2 13.5 12.7November 15.7 18.1 14.6 15.1December 18.6 18.6 18.1 18.3
Tnoon monthly averages, Sydney CoveMonthly mean 1788 1789 1790 1791January 23.1 28.9 27.6 24.5February 22.8 28.2 26.2 25.4March 20.8 27.0 25.0 23.1April 18.3 22.6 24.7 21.4May 16.2 19.7 21.0 20.2June 14.0 17.6 16.2 15.9July 13.4 15.8 16.4 14.5August 15.2 17.5 18.3 18.0September 18.8 21.3 21.5 18.8October 21.2 24.7 23.7 21.2November 25.7 29.2 24.1 23.2December 29.2 28.2 25.1 22.5
MSLP monthly averages, Sydney CoveMonthly mean 1788 1789 1790 1791January – 1014.6 1016.3 1013.9February – 1013.6 1012.4 1012.6March – 1015.9 1016.7 1020.4April – 1013.7 1019.8 1022.4May – 1019.8 1018.1 1018.2June – 1020.2 1017.8 1020.1July – 1019.6 1015.2 –August – 1018.5 1018.1 –September 1017.1 – 1018.7 –October 1010.9 – 1015.6 –November 1013.7 – 1017.7 –December 1015.0 1015.1 1012.6 –

Gergis et al.: A climate reconstruction of Sydney Cove 89
Examining inter-annual climate variability, 1788–1791
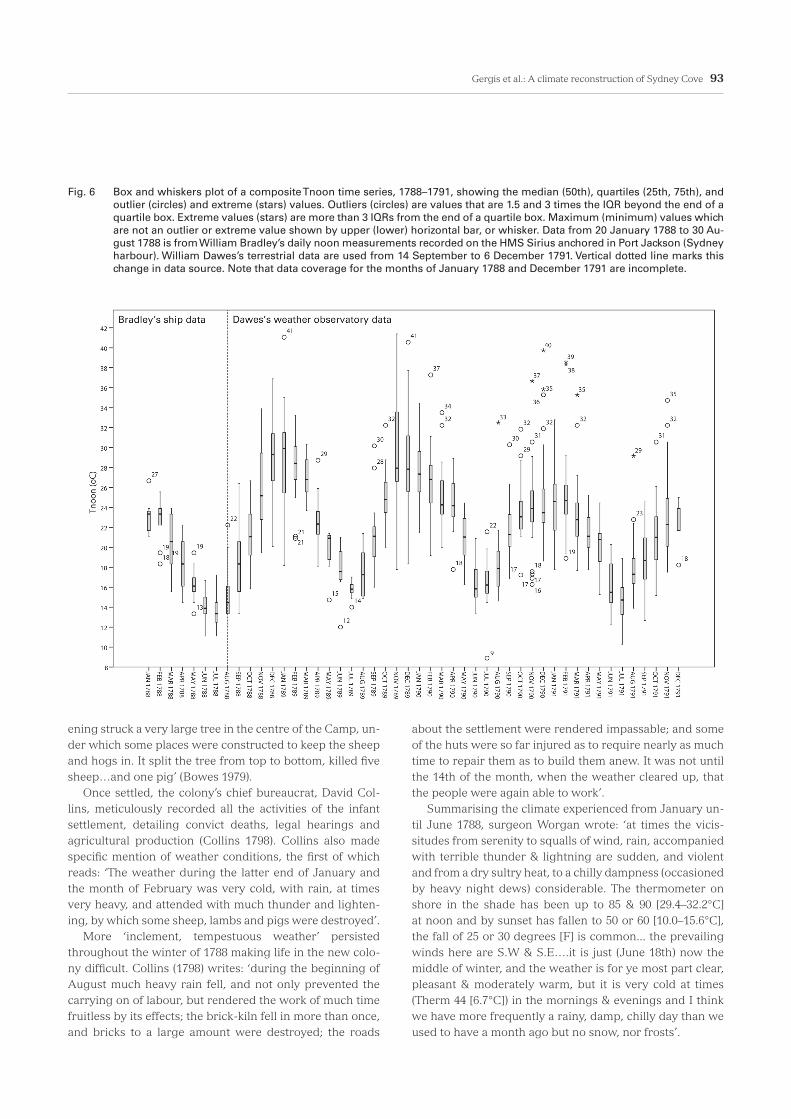
Having assessed the broadscale agreement between the seasonal cycles contained in Dawes’s data and the modern temperature and MSLP records, next we examine the inter-annual variability present in the data (Fig. 4) and assess it relative to Observatory Hill’s long-term climatology (Fig. 5). Figure 4 shows the clear seasonal cycle present in compos-ites of Dawes’s temperature and MSLP data for each month. Figure 5 shows seasonal mean anomalies of temperature and pressure of the Dawes observations relative to the long-term climatology of Observatory Hill. Tmax in the summer (DJF) of 1789 is 2.42 standard deviations (SD) above the long-term summer average, before dropping in 1789 to 2.60 SDs below the JJA long-term averages. Figure 5 shows that from SON 1788 to DJF 1788–89, Tmin was between 1.50 and 2.50 standard deviations above aver-age. This corresponds with a period of low pressure suggest-ing relatively warm and wet conditions (associated with low pressure) may have persisted during this time. By MAM of 1789 lower than average MSLP continued, but this time it is associated with lower than average maximum temperatures until the end of winter 1789. It is possible that cool and wet conditions may have prevailed at this time. In spring 1789, Tmax was 1.79 SDs warmer than average, but unfortunately there is a gap in the MSLP data at this time for comparison. By DJF of 1789–90, the MSLP record returns, indicating a near-normal pressure anomaly of 0.24 standard deviation above average. This corresponds to higher than average Tmax (2.42 SDs) and Tmin (2.41 SDs). There is a period of low MSLP during MAM and JJA of 1790 corresponding to cooler than average Tmin conditions and considerable variability in Tmax (Fig. 5). By SON of 1790, MSLP is 0.38 SDs above normal with slightly warmer (cooler) maximum (minimum) temperatures. MSLP during the summer of 1790–91 is 0.25 SD below average while Tmin anomalies are slightly below average while Tmax during DJF 1790–91 is in line with the long-term, climatological mean. By MAM and JJA of 1791 the MSLP record is between 0.66 and 0.21 SD above aver-age corresponding to lower than average Tmax and Tmin anomalies. Figure 6 is a composite noon temperature record incorpo-rating Bradley’s measurements taken aboard the Sirius from 20 January 1788 to 30 August 1788. As this record covers the first months of European settlement in Australia, it is a cul-turally very significant period so was considered worthy of analysis despite the fact that temperature readings were tak-en offshore (and are therefore slightly cooler than daytime temperatures observed on land). It is interesting to see that maximum summer temperatures in 1788 are considerably cooler (maximum of 26.7°C) compared with temperatures in the thirties and low forties (°C) recorded in subsequent years by Dawes (Fig. 6). Given that ENSO is known to modulate climate variability
in eastern Australia (Allan et al. 1996; Power et al. 1998), next we pose the question: did ENSO events influence the weath-er affecting early European settlement in Australia? On clos-er inspection, it rapidly became clear that the modern ‘ENSO signal’ in Sydney temperature variability is modest. The strongest relationships for temperature are between the CEI and Tmax observed during DJF when r = -0.33, significant at the 0.01 level. Results are slightly lower with the SOI (r=-0.27, significant at the 0.01 level). In terms of the relationship between Sydney’s MSLP and ENSO indices, the strongest correlations are seen with Darwin MSLP during JJA (r=0.49, significant at the 0.01 level) and SON (r=0.50, significant at the 0.01 level). These modest ENSO–local climate relation-ships are very consistent with similar correlations noted elsewhere in the literature (Power et al. 1998; Nicholls 2008) and are discussed further in a later section.
Comparison with colonial documents and palaeoclimate reconstructions
To further examine the climate variability observed in the 1788–91 period, we analysed the corresponding interval independently recorded in (i) First Fleet documentary re-cords and (ii) palaeoclimate ENSO reconstructions. Colonial documents provide a fascinating glimpse of what life ‘behind the numbers’ recorded by William Dawes’s instruments may have been like. Realising that Botany Bay, the First Fleet’s initial landing place, was un-suitable for permanent settlement, Governor Arthur Phillip gave orders for the entire fleet to immediately set sail for Port Jackson (Phillip 1789). On the morning of 24 January 1788, strong headwinds were blowing that prevented the ships from leaving the harbour. Philip Gidley King, a na-val officer on the Supply, writes: ‘the wind blowing strong from the NNE prevented…our getting out…on the 25th…we were obliged …to wait for the ebb tide and at noon we weighed and turned out of the harbour’. In the meantime, the rest of the First Fleet was still try-ing to sail out of Botany Bay as ‘the wind continued to blow strong all this day…in the evening there was a good deal of thunder and lightening’ (Hunter 1793). Surgeon on the Sir-ius, George Worgan writes: ‘Friday 25th…the wind coming to blow hard, right in to the bay, the Sirius and the trans-ports could not possibly get out’ (Worgan 1978). ‘A great sea rolling into the bay’ continued to buffet the ships, caus-ing ripped sails and a lost boom as the ships were blown dangerously close to the rocky coastline. According to Marine Lieutenant Ralph Clark: ‘if it had not been by the greatest good luck, we should have been both on the shore on the rocks, and the ships must most have been all lost, and the greater part, if not the whole on board drowned, for we should have gone to pieces in less than half of an hour’. Finally, after what Arthur Bowes de-scribes as: ‘with the utmost difficulty and danger with many hairbreadth escapes got out of the harbour’s mouth…it was

90 Australian Meteorological and Oceanographic Journal 58:2 June 2009
Fig. 4 Box and whiskers plot of Dawes’s (a) Tmax, (b) Tmin, (c) DTR and (d) MSLP, 1788–1791 showing the median (50th), quartiles (25th, 75th), outlier (circles), extreme (stars). Outliers (circles) are values between 1.5 times the Inter-quartile range (IQR) and 3 IQRs from the end of a quartile box. Extreme values (stars) are more than 3 IQRs from the end of a quartile box. Maximum (minimum) values which are not an outlier or extreme value shown by upper (lower) horizontal bar, or whisker.
(a)
(b)

Gergis et al.: A climate reconstruction of Sydney Cove 91
Fig. 4 Continued
(c)
(d)

92 Australian Meteorological and Oceanographic Journal 58:2 June 2009
next to a miracle that some of the ships were not lost, the danger was so very great’. By 3 o’clock on 26 January 1788 all of the First Fleet ships had safely arrived in Port Jackson (Clark 1981). Despite arriving in the height of the southern hemi-sphere summer, Governor Ar-thur Phillip notes: ‘this country is subject to very heavy storms of thunder and lightening, several trees have been set on fires and some sheep and hogs killed in the camp since we landed’ (Watson 1914). Wor-gan also wrote: ‘the thunder and lightening are astonish-ingly awful here, and by the heavy gloom that hangs over the woods at the time these el-ements are in commotion and from the nature and violence done to many trees we have reason to apprehend that much mischief can be done by light-ening here’ (Worgan 1978). Lieutenant Clark described the turbulent storms: ‘Thursday 31 January – what a terrible night it was … thunder, lightening and rain. Was obliged to get out of my tent with nothing on but my shirt to slacken the tent poles’ (Clark 1981). Stormy weather continued as the last of the convicts fi-nally disembarked the ships on 6 February 1788. Arthur Bowes describes landing dur-ing the startling intensity of a summer storm in Sydney: ‘they had not been landed more than an hour, before they had all got their tents pitched or anything in order to receive them, but there came on the most violent storm of lightening and rain I ever saw. The lightening was incessant during the whole night and I never heard it rain faster. About 12 o’clock in the night one severe flash of light-
Fig. 5 Anomaly plots for Dawes’s weather data (a) Tmax, (b) Tmin, (c) MSLP standardised to the mean and standard deviation of the modern observational records (1876–2007 period for temperature, 1850-2007 for MSLP) with 90% significance level (dotted). Note that none of the MSLP anomalies reach the 90% significance level so it is not plotted in panel (c). P-value estimates suggested here might not be reliable due to issues associ-ated with the absolute values of early instrumental data. That is, there may be contri-butions to the anomalies from the biases in the observations as well as ‘real’ climate anomalies. Thus, the 90% significance levels are plotted here as a guide only for a rela-tive comparison with the modern instrumental record.
(a)
(b)
(c)
Gergis et al.: A climate reconstruction of Sydney Cove 93
ening struck a very large tree in the centre of the Camp, un-der which some places were constructed to keep the sheep and hogs in. It split the tree from top to bottom, killed five sheep…and one pig’ (Bowes 1979). Once settled, the colony’s chief bureaucrat, David Col-lins, meticulously recorded all the activities of the infant settlement, detailing convict deaths, legal hearings and agricultural production (Collins 1798). Collins also made specific mention of weather conditions, the first of which reads: ‘The weather during the latter end of January and the month of February was very cold, with rain, at times very heavy, and attended with much thunder and lighten-ing, by which some sheep, lambs and pigs were destroyed’. More ‘inclement, tempestuous weather’ persisted throughout the winter of 1788 making life in the new colo-ny difficult. Collins (1798) writes: ‘during the beginning of August much heavy rain fell, and not only prevented the carrying on of labour, but rendered the work of much time fruitless by its effects; the brick-kiln fell in more than once, and bricks to a large amount were destroyed; the roads
about the settlement were rendered impassable; and some of the huts were so far injured as to require nearly as much time to repair them as to build them anew. It was not until the 14th of the month, when the weather cleared up, that the people were again able to work’. Summarising the climate experienced from January un-til June 1788, surgeon Worgan wrote: ‘at times the vicis-situdes from serenity to squalls of wind, rain, accompanied with terrible thunder & lightning are sudden, and violent and from a dry sultry heat, to a chilly dampness (occasioned by heavy night dews) considerable. The thermometer on shore in the shade has been up to 85 & 90 [29.4–32.2°C] at noon and by sunset has fallen to 50 or 60 [10.0–15.6°C], the fall of 25 or 30 degrees [F] is common... the prevailing winds here are S.W & S.E….it is just (June 18th) now the middle of winter, and the weather is for ye most part clear, pleasant & moderately warm, but it is very cold at times (Therm 44 [6.7°C]) in the mornings & evenings and I think we have more frequently a rainy, damp, chilly day than we used to have a month ago but no snow, nor frosts’.
Fig. 6 Box and whiskers plot of a composite Tnoon time series, 1788–1791, showing the median (50th), quartiles (25th, 75th), and outlier (circles) and extreme (stars) values. Outliers (circles) are values that are 1.5 and 3 times the IQR beyond the end of a quartile box. Extreme values (stars) are more than 3 IQRs from the end of a quartile box. Maximum (minimum) values which are not an outlier or extreme value shown by upper (lower) horizontal bar, or whisker. Data from 20 January 1788 to 30 Au-gust 1788 is from William Bradley’s daily noon measurements recorded on the HMS Sirius anchored in Port Jackson (Sydney harbour). William Dawes’s terrestrial data are used from 14 September to 6 December 1791. Vertical dotted line marks this change in data source. Note that data coverage for the months of January 1788 and December 1791 are incomplete.

94 Australian Meteorological and Oceanographic Journal 58:2 June 2009
Marine Lieutenant John Watts reports: ‘during the sev-en days we were in Botany Bay [January 1788] the weather was generally fine, and very warm. The thermometer on a mean stood at 78° [25.6°C]. It never exceeded 80° [26.7°C] and one day, which was thick and rainy, the wind blowing strongly from the south, it fell to 63°[17.2°C]. In Port Jackson the weather was at first much the same, but afterwards, the days became very hot, and the nights constantly brought on tremendous thunder, lightning, and rain. The thermometer, at eleven o’clock in the forenoon, was generally about 80° [26.7°C] but when the sea breezes set in it usually fell two or three degrees. One very sultry day was felt soon after the arrival of the fleet. The thermometer, on board, stood at 88° [31.1°C] and on shore, though in the shade, at 92° [33.3°C]. On the 15th of March was a terrible squall of wind, accompa-nied by thunder, lightning, and rain. The thermometer then fell from 80° [26.67°C] to 50° [10°C] and in other squalls it frequently fell 15 or 20 degrees [F]’ (Phillip 1789). This sum-mary seems generally consistent with Bradley’s Tnoon data presented in Fig. 6. As Watkin Tench (1793) recounts: ‘we were eager to es-cape from tents, where a fold of canvas, only, interposed to check the vertic beams of the sun in summer, and the chill-ing blasts of the south in winter…under wretched covers of thatch lay our provisions and stores, exposed to destruction from every flash of lightning’. In July 1789, Collins com-ments on flood marks observed on the Hawkesbury River: ‘they were deterred from remaining any time in the narrow part of the [Hawkesbury] river, as they perceived evident traces of the freshes haven risen to the height of from twenty to forty feet above the level of the water…the vast inunda-tions, which had left such tokens behind them of the height to which they swell the river, seemed rather unfavourable to the purpose of settling near the banks, which otherwise would have been convenient and desirable’. In February 1790 Sydney endured more flooding: ‘the month of February passed in the arrangements and prepa-rations requisite on the occasion, to which the weather was extremely unfavourable; heavy rains, with gales of wind, prevailing nearly the whole time. The rain came down in tor-rents, filling up every trench and cavity which had been dug about the settlement, and causing much damage to the mis-erable mud tenements which were occupied by the convicts; yet, bad as the weather was, several gardens were robbed, and, as at that time they abounded with melons and pump-kins, these became the objects of depredation in common with other productions of the garden’ (Collins 1798). Soon the colony was to learn of the devastating loss of a cargo ship, the Sirius on Norfolk Island on 19 March 1790. When news of the wreck reached Sydney by HMS Supply, Collins (1798) reports: ‘the weather had been very wet dur-ing this month; torrents of rain again laid every place under water; and many little habitations, which has withstood the inundations of the last month, now suffered considerably...
At this time the Supply returned from Norfolk Island, with an account of a disaster which depressed even the unthinking part of the inhabitants, and occasioned universal dismay. A load of accumulated evils seemed bursting upon their heads. The ships that had so long been expected with supplies were still anxiously looked for; and the Sirius, which was to have gone in quest of relief to their distress, was lost upon the reef at Norfolk Island... bad weather immediately ensued, and, continuing for several days, the provisions could not be landed, so high was the surf occasioned by it’. By September 1790, the settlers were fast realising just how unpredictable Australia’s weather could be. Watkin Tench remarks ‘it is changeable beyond any other I ever heard of… clouds, storms and sunshine pass in rapid suc-cession’. But by the middle of 1790, Tench (1793) describes the impact of dry conditions on the colony’s food supplies: ‘vegetables are scarce…owing to want of rain. I do not think that all the showers of the last four months put together, would make twenty-four hours rain. Our farms, what with this and a poor soil, are in wretched condition. My winter crop of potatoes, which I planted in days of despair (March and April last), turned out very badly when I dug them about two months back. Wheat returned so poorly last harvest’ (Tench 1793). It appears that the summer of 1790–91 was a hot and dry summer. Tench comments that, at times, it ‘felt like the blast of a heated oven’. He goes on to describe the heat endured during summer: ‘even [the] heat [of December 1790] was judged to be far exceeded in the latter end of the following February [1791], when the north-west wind again set in, and blew with great violence for three days. At Sydney, it fell short by one degree of [December 1790] but at Rose Hill [Par-ramatta], it was allowed, by every person, to surpass all that they had before felt, either there or in any other part of the world…it must, however, have been intense, from the effects it produced. An immense flight of bats driven before the wind, covered all the trees around the settlement, whence they every moment dropped dead or in a dying state, unable longer to endure the burning state of the atmosphere. Nor did the ‘perroquettes’, though tropical birds, bear it better. The ground was strewn with them in the same condition as the bats’ (Tench 1793). Collins (1798) also comments on the incredible effect of the heat on the local wildlife: ‘Fresh water was indeed ev-erywhere very scarce, most of the streams or runs about the cove being dried up. At Rose Hill [Parramatta], the heat on the tenth and eleventh of the month, on which days at Syd-ney the thermometer stood in the shade at 105°F [40.6°C], was so excessive (being much increased by the fires in the adjoining woods), that immense numbers of the large fox bat were seen hanging at the boughs of trees, and dropping into the water…during the excessive heat many dropped dead while on the wing... In several parts of the harbour the ground was covered with different sorts of small birds, some

Gergis et al.: A climate reconstruction of Sydney Cove 95
dead, and others gasping for water’. Governor Arthur Phil-lip elaborates on the staggering scale of the scene: ‘from the numbers that fell into the brook at Rose Hill [Parramatta], the water was tainted for several days, and it was supposed that more than twenty thousand of them [bats] were seen within the space of one mile’ (Hunter 1793). These accounts of extremely hot, dry conditions corre-spond well to the distinct clustering of warm extremes in Tmax seen in Fig. 4. It is interesting to note that anomalies in Tmax in DJF of 1790–91 (Fig. 5) appear to be consistent with the long-term average while Tmin shows warmer than aver-age conditions (1.96 SDs) and slightly higher than average MSLP conditions (0.44 SDs). This may suggest the true inten-sity of experiencing temperatures over 40°C rather than the fact that the newly arrived Europeans were simply not used to the intense heat of an Australian summer. In April 1791, Arthur Phillip writes: ‘the dry weather continued…the quantity of rain which fell in the month of April [1791], was not sufficient to bring the dry ground into proper order for sowing the grain… this continuance of dry weather, not only hurt their crops of corn very much, but the gardens likewise suffered greatly; many being sown a second and a third time as the seed never vegetated, from want to moisture in the soil’ (Hunter 1793). As a result of the drought, Governor Phillip tightened rations as the food sup-ply of the struggling colony began to dwindle: ‘little more than twelve months back, hogs and poultry were in great abundance, and were increasing very rapidly...but at this time [April 1791] there was seldom any to sell’. Watkin Tench laments ‘I scarcely pass a week in summer without seeing it rise to 100 degrees [37.8°C]; sometimes to 105 [40.6 °C]’. Collins (1798) describes the dry conditions that persisted into June 1791: ‘the ground was so dry, hard and literally burnt up, that it was almost impossible to break it with a hoe; and until this time there has been no hope or probability of the grain vegetating’. On returning from Norfolk Island John Hunter, ex-Captain of the doomed Sirius, described the scene at Sydney Cove: ‘all the streams from which we were formerly supplied…were entirely dried up, so great had been the drought; a circumstance, which from the very intense heat of summer, I think it probable we shall be fre-quently subject to’ (Hunter 1793). By November 1791, when Dawes’s record essentially ends, the worsening drought culminated in the first documented account of water restrictions imposed on Sydney. The small freshwater stream that ran into Sydney Cove proved an ir-regular source of water. To try and control the amount of water flowing out of the colony, ‘holding tanks’ were cut into the sandstone banks to provide storage for the water. Col-lins (1798) writes: ‘By the dry weather which prevailed the water had been so much affected, besides being lessened by the watering of some transports, that a prohibition was laid by the Governor on the watering of the remainder of Sydney...to remedy this evil, the Governor had employed
the stone-mason’s gang to cut tanks out of the rock, which would be reservoirs for the water large enough to supply the settlement for some time’. This became known as the ‘tank stream’, and may be the earliest example of water regulation in Australia’s European history. To assess whether these conditions may be associated with ENSO, next we compare our results with an annually resolved, multi proxy reconstruction of El Niño and La Niña events since A.D. 1525 (Gergis and Fowler 2009). Accord-ing to this analysis, La Niña conditions in 1788 are classified as very strong, weak in 1789 and strong in 1790. A charac-teristic ‘phase flip’ seems to occur in the year 1791 which is classified as a very strong El Niño year in the Gergis and Fowler (2009) record and noted elsewhere in the literature (Quinn and Neal 1992; Whetton and Rutherfurd 1994; Allan and D’Arrigo 1999). Using a composite coral record to re-construct tropical rainfall runoff over the Great Barrier Reef since A.D. 1661, recently Lough (2007) showed that the years 1788 and 1790 were periods of high freshwater flow into the Great Barrier Reef, consistent with north Queensland’s contemporary La Niña teleconnection pattern. Interestingly, while southern Australia appears to have experienced very dry conditions, the year 1791 registers as a year of ‘average’ runoff in northern Australia (Lough 2007).
Discussion
Early temperature and pressure data were analysed for the 1788–1791 period using weather journals kept by William Dawes and William Bradley who arrived on the First Fleet some 220 years ago. Remarkably, the records displayed a distinct seasonal cycle and daily variability comparable with modern day measurements taken from Sydney Observatory Hill and considerable inter-annual variability. To assess the conditions suggested by the early instru-mental data, it is important to cross-verify with other data sources such as early anecdotal accounts recorded in docu-mentary records and independent palaeoclimate reconstruc-tions. Despite the apparent presence of La Niña conditions from 1788–1790 in the Pacific basin (Gergis and Fowler 2009), the temperature and MSLP records kept by William Dawes do not show a signal strong enough to be classed as a La Niña event in Sydney. Given the weak statistical relationships noted during the observational period between ENSO and Sydney climate variables, perhaps this is unsurprising. Our results are consistent with the low correlations between the SOI and Australian temperature and rainfall variability pre-sented by Power et al. (1998) (e.g. r= –0.24, significant at 0.05 level, between Tmax and SOI for the period 1910–1992.). Ac-cording to the ENSO teleconnection maps provided by Allan et al. (1996), the ENSO signal in coastal Sydney is not as pro-nounced as in inland areas. Power et al. (2006) describe how dry/hot conditions occur more frequently during El Niño years and wet/mild conditions occur more frequently during

96 Australian Meteorological and Oceanographic Journal 58:2 June 2009
La Niña years. However, the relationship between ENSO and local climate variability is known to be complex and often nonstationary through time (e.g. Gergis et al. 2006). Documentary accounts of weather conditions recorded by early European settlers provide an independent means of qualitatively assessing the variability recorded by the in-strumental observations. While it is clear from the anecdotal accounts presented here that cool and wet conditions seem to have dominated the early years of the colony from Janu-ary 1788 to winter 1790 and hot and dry weather prevailed from SON of 1790–91 onwards, it is not possible to statisti-cally link this to ENSO conditions based on the observational temperature and MSLP measurements recorded by Dawes and Bradley. This is likely to reflect the weak statistical rela-tionship present between ENSO indices and Sydney’s local climate variables, instrumentation issues or the problems associated with comparing one local record to a large-scale phenomenon such as ENSO. Proxies from a number of EN-SO-influenced regions display substantial differences in the seasonality of response signatures. As a result, data from many regions are needed to adequately capture the spatial variability of ENSO through time (Gergis et al. 2006). It is also important to remember that documentary re-cords tend to emphasise extreme conditions as these were generally the most important events experienced by the re-corder (Jones 2008). Information from different observers may be further biased as the qualitative standards used to re-flect climate conditions are likely to be observer-dependent (Jones 2008). For example, an English writer’s perception of climate was formed in England where a few weeks without rain was considered a ‘drought’ (Jevons 1859). According to Jones (2008) the best measures are those that are objective (e.g. frost day and snow day counts, freezing of rivers, crop harvest dates and yields) and less dependent on individual observers. Nevertheless, these personal accounts do provide us with culturally significant insights into the weather condi-tions experienced by Australia’s first European settlers, how-ever subjective this may be. There is also potential to numerically code qualitative ac-counts for quantitative data analysis following pioneering European methods (Pfister et al. 1998; Glasser and Stangl 2004; Jones 2008). A common procedure when using docu-mentary records is to develop a simple index from the com-ments made by the recorder (Glasser and Stangl 2004). The levels of intensity expressed in a record can be assigned nu-merical values to create a time series. For example, ‘very wet’ may be assigned a ‘+3’ value, ‘wet’ a ‘+2’, ‘above average’ ‘+1’ and ‘normal’ or ‘average’ a value of ‘0’, and so on. Using multivariate statistical techniques (e.g. Empirical Orthogonal Function analysis) these time series can be combined with other palaeo-data for large-scale climate analysis (Glasser and Stangl 2004). Using diverse Australian documentary records for historical climatic reconstructions would be the first study of its kind in our region.
Conclusions
This study presents the first reconstruction of the weather conditions experienced during the first years of European settlement in Australia from 1788 to 1791. Daily temperature and barometric pressure observations recorded by Wil-liam Dawes in Sydney Cove and a temperature record kept by William Bradley on board HMS Sirius anchored in Port Jackson (Sydney Harbour) in the early months of the First Fleet’s arrival in Australia were analysed. Remarkably, the records appear comparable with modern day measurements taken from Sydney Observatory Hill, displaying similar daily variability, a distinct seasonal cycle and considerable inter-annual variability. Cleary there are excellent opportunities to consolidate and expand our understanding of Australia’s pre-20th cen-tury climate and social history using early instrumental and documentary data. Unlike Europe and the Americas, Austra-lia’s documentary archives remain virtually unexplored for climate information. Colonial reports, personal diaries and newspaper stories provide us with rich accounts about past drought, floods and other significant weather events since the first European settlement in 1788, before modern meteo-rological data are available. Documentary records provide a societal record of the impact of past climatic conditions in areas of Australia where early weather records or annually resolved palaeoclimate data are still very limited. Important-ly, these records give us a fascinating glimpse into what life ‘behind the numbers’ would have been like centuries ago. Currently, our description of Australian climate vari-ability is largely confined to the 20th and 21st centuries, the period with an extensive network of regular meteoro-logical observations. With increasing concern about climatic change, variability and extremes, there is a growing demand for reliable, high quality instrumental observations of past weather conditions. Such high quality data are essential for improving the observed representation of the global climate system, enhancing our capacity to assess ocean-atmosphere model integrations and ultimately their simulation of an-thropogenic effects on the climate. In seeking observational evidence for climate variability and change, large amounts of historical observational data have been compiled. Even so, equally large sources of valuable climate data remain un-tapped (Allan 2008). In fact, there are considerable terrestrial and marine data around the world that are still in hard copy form and have not been digitised and stored in international climate data banks (Page et al. 2004). Many countries are not aware of the extent of colonial observations made in their territories or do not have the finances, personnel or infra-structure to digitise data. In an attempt to address this issue, an international ‘data rescue’ initiative, Atmospheric Circulation Reconstructions over the Earth (ACRE), is now underway (see http://www.met-acre.org/). ACRE aims to improve historical daily and

Gergis et al.: A climate reconstruction of Sydney Cove 97
sub-daily terrestrial and marine observational data needed for a series of pioneering surface data reanalyses covering the past 250 years. For an example of the first of these reanal-yses, see Compo et al. (2006) for details on the 20th century reanalysis project. The four-dimensional weather products produced by these reanalyses can then be used for a myriad of climate research, applications, impacts and risk models (Allan 2008). In 2002, the Australian Bureau of Meteorology completed the Computerising the Australian Climate Ar-chive (CLIMAC) project, which digitised historical daily and hourly climate data for 64 sites at 51 key climate locations across Australia (Page et al. 2004). Despite this major effort, copious amounts of early weather data are yet to be digitised and archived. To help address this research gap, researchers at the University of Melbourne are using early Australian instru-mental data, colonial documentary records and palaeocli-mate records to compile a ‘multiple proxy’ history of climate conditions since first European settlement of Australia since 1788. As McAfee (1981) points out, apart from the intrinsic cultural value of Dawes’s meteorological journal, ‘it serves as a monumental foundation on which to start a history of cli-mate for the emerging country of Australia’. In doing so, we can better define a ‘baseline’ of natural climate variability in southeastern Australia, while shedding light on a culturally significant period of Australia’s European settlement. Given the large number of very extreme climate events Australia has been experiencing, further research in this area will provide timely context for understanding and attributing re-cently observed changes in the Australian region.
Acknowledgments
Many thanks to Tony Tran Nguyen (University of Melbourne) for the meticulous transcription of William Dawes’s weather journal. Karl Braganza (Centre for Australian Weather and Climate Research, a partnership between the Australian Bu-reau of Meteorology and the CSIRO) and Ailie Gallant (Uni-versity of Melbourne) kindly provided daily and monthly weather data for Sydney’s Observatory Hill (station 066062). Thanks also for reviews by Simon Torok (CSIRO) and Phil Jones (University of East Anglia) with suggestions that im-proved the clarity of the manuscript.
ReferencesAllan, R.J. 2008. Tiempo Climate Newswatch: Atmospheric Circulation
Reconstructions over the Earth (ACRE) http://www.cru.uea.ac.uk/tiempo/newswatch/interview080204.htm.
Allan, R.J., Reason, C., Carroll, P. and Jones, P. 2002. A reconstruction of Madras (Chennai) mean sea level pressure using instrumental records from the late 18th and early 19th centuries. Int. J. Climatol., 22, 1119-42.
Allan, R.J. and D’Arrigo, R. 1999. ‘Persistent’ ENSO sequences: how un-usual was the 1990–1995 El Nino? The Holocene, 9, 101–18.
Allan, R.J., Lindsay, J. and Parker, D. 1996. El Niño Southern Oscillation and climate variability. CSIRO, Melbourne, Australia.
Australian Bureau of Statistics 2009. Australian Demographic Statistics, Sep 2008 http://www.abs.gov.au/ausstats/[email protected]/mf/3101.0/ (ac-cessed February 2009).
Bowes, A. 1979. The journal of Arthur Bowes Smyth, surgeon, Lady Pen-rhyn, 1787–1789. Australian Documents Library, Sydney, Australia.
Bradley, W. 1969. A voyage to New South Wales, 1786–1792, the journal of Lieutenant William Bradley RN of HMS Sirius. Ure Smith Pty Limited, Sydney, Australia.
Clark, R. 1981. The journal and letters of Lt. Ralph Clark, 1787–1792. Aus-tralian Documents Library in association with the Library of Austra-lian History, Sydney, Australia.
Collins, D. 1798. An account of the English colony in New South Wales : with remarks on the dispositions, customs, manners, &c. of the native inhabitants of that country. To which are added, some particulars of New Zealand, compiled, by permission from the mss. of Lieutenant–Governor King. Cadell and David, London, UK.
Compo, G.P., Whitaker, J.S. and Sardeshmukh, P.D. 2006. Feasibility of a 100 year reanalysis using only surface pressure data. Bull. Amer. Me-teorol. Soc., 87, 175-90.
Gergis, J., Braganza, K., Fowler, A., Risbey, J. and Mooney, S. 2006. Re-constructing El Niño–Southern Oscillation (ENSO) from high–resolu-tion palaeoarchives. J. Quaternary Sci., 21, 707–22.
Gergis, J. and Fowler, A. 2005. Classification of synchronous oceanic and atmospheric El Niño–Southern Oscillation (ENSO) events for palaeo-climate reconstruction. Int. J. Climatol., 25, 1541–65.
Gergis, J. and Fowler, A. 2009. A history of El Niño–Southern Oscillation (ENSO) events since A.D. 1525: implications for future climate change. Climatic Change, 92, 343–87.
Glasser, R. and Stangl, H. 2004. Climate and floods in Central Europe since AD 1000: data, methods, results and consequences. Climatic Change, 25, 485–510.
Grove, R. 1998. Global impact of the 1789–93 El Niño. Nature, 393, 319–9.Hunter, J. 1793. An historical journal of the transactions at Port Jackson
and Norfolk Island: including the journals of Governors Phillip and King, since the publication of Phillip’s voyage: with an abridged ac-count of the new discoveries in the South Seas. John Stockdale, Lon-don, UK.
Jevons, W. S. 1859. Some data concerning the climate of Australia & New Zealand. Waugh’s Australian Almanac for the year 1859: 47–98. James William Waugh, Sydney, Australia.
Jones, P. 2008. Historical climatology – a state of the art review. Weather, 63, 181–6.
Lough, J. 2007. Tropical river flow and rainfall reconstructions from coral luminescence: Great Barrier Reef, Australia. Paleoceanography, 22, doi: 10.1029/2006PA001377.
McAfee, R. J. 1981. Dawes’s Meteorological Journal, Bureau of Meteorol-ogy Historical Note No 2. Australian Government Publishing Service, Canberra, Australia.
Nicholls, N. 1988. More on early ENSOs: evidence from Australian docu-mentary sources. Bull. Amer. Meteorol. Soc., 69, 4–6.
Nicholls, N. 2008. Recent trends in the seasonal and temporal behav-iour of the El Niño–Southern Oscillation. Geophys. Res. Lett. 35, doi:10.1029/2008GL034499.
Nicholls, N., Tapp, R., Burrows, K. and Richards, D. 1996. Historical ther-mometer exposures in Australia. Int. J. Climatol., 16, 705–10.
Page, C., Nicholls, N., Plummer, N., Trewin, B., Manton, M., Alexander, L., Chambers, L., Choi, Y., Collins, D., Gosai, A., Della–Marta, P., Haylock, M., Inape, K., Laurent, V., Maitrepierre, L., Makmur, E., Nakamigawa, H., Ouprasitwong, N., McGree, S., Pahalad, J., Salinger, J., Tibig, L., Tran, T., Vediapan, K. and Zhai, P. 2004. Data Rescue in the Southeast Asia and South Pacific Region: Challenges and Opportunities. Bull. Amer. Meteorol. Soc., 85, 1483–9.
Pfister, C., Luterbacher, J., Schwarz–Zanetti, G. and Wegmann, M. 1998. Winter air temperature variations in western Europe during the early and high Middle Ages (AD 750–1300). The Holocene, 8, 535–52.
Phillip, A. 1789. The Voyage of Governor Phillip to Botany Bay. John Stockdale, Piccadilly.
98 Australian Meteorological and Oceanographic Journal 58:2 June 2009
Power, S., Haylock, M., Colman, R. and Wang, X. 2006. The predictability of interdecadal changes in ENSO activity and ENSO teleconnections. J. Climate, 19, 4755–71.
Power, S., Tseitkin, F., Torok, S., Lavery, B., Dahni, R. and McAvaney, B. 1998. Australian temperature, Australian rainfall and the Southern Oscillation, 1910–1992: coherent variability and recent changes. Aust. Met. Mag., 47, 85–101.
Quinn, W. and Neal, V. 1992. The historical record of El Niño events. Cli-mate Since A.D. 1500: 623–48. R. Bradley and P. Jones. Routledge, London, United Kingdom.
Russell, H. C. 1877. Climate of New South Wales: Descriptive, Historical, and Tabular. C. Potter, Sydney, Australia.
Tench, W. 1793. A Complete Account of the Settlement at Port Jackson. Nicol and Sewell, London, UK.
Torok, S. and Nicholls, N. 1996. A historical annual temperature dataset for Australia. Aust. Met. Mag., 45, 251–60.
Wallace, J. and Hobbs, P. 2006. Atmospheric Science, An Introductory Survey (second edition). Elsevier Academic Press, London, UK.
Watson, F. 1914. Historical records of Australia Series 1: Governors’ des-patches to and from England, Volume: 1788–1796. The Library Com-mittee of the Commonwealth Parliament, Sydney, Australia.
Whetton, P. and Rutherfurd, I. 1994. Historical ENSO teleconnections in the Eastern Hemisphere. Climatic Change, 28, 221–53.
Worgan, G. 1978. Journal of a First Fleet Surgeon 1788. Library Council of New South Wales in association with the Library of Australian His-tory, Sydney, Australia.

Minerva Access is the Institutional Repository of The University of Melbourne
Author/s:
Gergis, Joëlle; Karoly, David J.; Allan, Rob J.
Title:
A climate reconstruction of Sydney Cove, New South Wales, using weather journal and
documentary data, 1788-1791
Date:
2009
Citation:
Gergis, J., Karoly, D. J., & Allan, R. J. (2009). A climate reconstruction of Sydney Cove, New
South Wales, using weather journal and documentary data, 1788-1791. Australian
Meteorological and Oceanographic Journal, 58(2), 83-98.
Publication Status:
Published
Persistent Link:
http://hdl.handle.net/11343/32770
File Description:
A climate reconstruction of Sydney Cove, New South Wales, using weather journal and
documentary data, 1788-1791