Embed Size (px)
Citation preview

A CITY THAT DELIVERSThe role of industrial land in supporting a productive freight and logistics system for Greater Sydney
August 2021
Astrolabe Group are the recognised experts in urban growth and change management with a uniquely empathetic approach to client and community.
This report was prepared for NSW Ports. In preparing the report, Astrolabe has made every effort to ensure the information included is reliable and accurate. Astrolabe is unable to accept responsibility or liability for the use of this report by third parties.
In the spirit of reconciliation, Astrolabe Group acknowledges the Traditional Custodians of country throughout Australia and their connections to land, sea and community.
ABOUT ASTROLABE GROUP
ACKNOWLEDGEMENT OF COUNTRY

3A CITY THAT DELIVERS: NSW PORTS
CONTENTS
5
8
15
27
45
68
Executive summary
Introduction
Context
Challenges
Recommendations for a new policy approach
Conclusion

4A CITY THAT DELIVERS: NSW PORTS
ABBREVIATIONS
DEFINITIONS
IMT
LGA
PCE
TEU
TfNSW
VKT
Industrial land
Freight and logistics land
Western Sydney
Eastern Sydney
Intermodal terminal
Local Government Area
Passenger car equivalent
Twenty-foot equivalent unit
Transport for NSW
Vehicles per kilometre travelled
Land that is zoned for industrial and urban services purposes. This includes land that is zoned Industrial (IN1, IN2, IN1, IN2, IN3, IN4) and some business zoned land (B5, B6, B7).
All land supporting freight and logistics facilities and activities, including transport corridors for road and rail infrastructure
In this report Western Sydney is defined as land generally west of the A3.
In this report Eastern Sydney is defined as land generally east of the A3. This aligns roughly with the definition of the Eastern Harbour City (Eastern City, North and South districts) with the addition of the Auburn and Bankstown Statistical Areas 3 (SA3s) (generally the local government areas (LGAs) of Cumberland and Canterbury Bankstown).

5A CITY THAT DELIVERS: NSW PORTS 5A CITY THAT DELIVERS: NSW PORTS
EXECUTIVE SUMMARY
Industrial land is critical to Sydney’s productivity and growth. These lands serve the nation’s freight and logistics sector and provide space for essential services and other uses. The flow of goods through and around the metropolis requires appropriately located landside assets, connected by rail and road networks, servicing both businesses and customers.
The freight task is growing as the population grows, generating pressure and competition for land, particularly in Eastern Sydney (as defined in this report). We must have the right policy framework in place today, to create the guidance and actions that will guide the right productivity outcomes for Greater Sydney’s future.
This report identifies three key drivers that accelerate the need for an adequate supply of high performing freight and logistics land in the right places:
These drivers require us to do more with the city’s available industrial land. However, optimising industrial land is challenging, with competition from residential and commercial development, and the many different freight and logistics uses (Port-related activities, airfreight related uses, and warehousing and distribution that serve local catchments). In addition, the preferred acquisition of industrial land for infrastructure such as the M8 Motorway and proposed Western Sydney Freight Line further erodes availability.
We cannot risk underutilising freight and logistics land in Greater Sydney because of conflict and encroachment from other land uses. If not planned and managed well, residential uses can lead to the imposition of restrictions and limits to hours of operation and capacity of freight and logistics activities. This impacts the freight and logistics system, which impacts everyone.
• higher population
• consumer behavioural changes accelerated by COVID-19
• increases in freight and logistics costs in terms of land costs, congestion and the impact of encroachment.
6A CITY THAT DELIVERS: NSW PORTS 6A CITY THAT DELIVERS: NSW PORTS
The importance of the freight and logistics system for Greater Sydney extends beyond the gateway sites of Port Botany and international airports. Instead, it should be regarded as a whole system as it interacts with every community and business, just as transport, health, and education systems do.
Despite its importance, however, the Greater Sydney freight and logistics system underperforms compared to those of Melbourne and Brisbane. Land prices, congestion, tolls and labour costs create additional costs for businesses and consumers.
The NSW Productivity Commission’s White Paper 2021 Rebooting the economy is a welcome focus on the role and location of different land uses, and how these influence the welfare of the entire State.
This paper presents an evidence base and recommended policy approach for optimising industrial land to support a productive freight and logistics system for Greater Sydney. We’ve taken a whole-of-system view that considers how components of the freight and logistics system can contribute to whole-of-State welfare and productivity benefits.
Through this paper we:
• define four types of freight and logistics lands, matched to whole-of-system activities, ensuring policy and strategy focuses on how each typology will serve the metropolis
• present an approach to evaluate the costs and benefits of the displacement or substitution of freight and logistics land
• focus on the importance of land around Port Botany and intermodal terminals that is critical to sustained operations
• discuss the importance of targeted policy interventions to maximise the utilisation and performance of freight and logistics land.

7A CITY THAT DELIVERS: NSW PORTS 7A CITY THAT DELIVERS: NSW PORTS
The evidence we present underpin four recommendations to be considered in the Greater Sydney Commission’s Industrial Lands Policy Review:
1. Adopt the recommended typologies for freight and logistics land that recognise the function and significance of different land.
2. Develop effective tools to support decision-making, recognise the broader productivity costs and benefits of freight movements and evaluate decisions that potentially either displace or substitute industrial land.
3. Enable additional land capacity within core freight and logistics areas such as Port Botany and IMTs.
4. Optimise the performance of freight and logistics land.
8A CITY THAT DELIVERS: NSW PORTS
NSW Ports commissioned Astrolabe Group to develop an evidence base to inform the Greater Sydney Commission’s (the Commission) review of the ‘retain and manage’ approach to managing industrial and urban services land. In providing this evidence base, the report also recommends a whole-of-system policy approach that responds to the principles of the NSW Productivity Commission’s White Paper 2021 Rebooting the economy.
The report is underpinned by robust research, a review of literature, spatial and economic analysis, and interviews with industry participants from the freight and logistics sector in Greater Sydney.
One of the key findings is that – with no single lead player to orchestrate and champion the freight and logistics system’s land requirements in Greater Sydney – a coordinated and whole-of-system view is essential to the productivity of significant multi-billion dollar assets such as Port Botany and the NSW Government’s investment in the road and rail freight network, and to leveraging the productivity benefits of industrial land across the city.
Given this finding, our evidence base defines and reframes the freight and logistics system as a critical city system. Like all city systems, place is a vital consideration that influences the operation and productivity of the system.
Port Botany is the primary international trade gateway for Sydney and NSW and requires a high performing freight and logistics system. Industrial lands, as part of this system, support Port and intermodal terminal operational activities, provide land for key movement corridors and provide sites for warehousing and distribution. This makes NSW Ports a primary stakeholder in the review of industrial lands.
INTRODUCTIONINDUSTRIAL LANDS POLICY REVIEW
9A CITY THAT DELIVERS: NSW PORTS
The freight and logistics system is fragmented and complicated, with a range of sites and significant infrastructure, and an array of public and private sector players involved in the planning and management of transport systems, landside planning and development, logistics services, managing the Port, airports, intermodal terminals, and connecting with multiple customers across industry, business and the community.
Industrial land accommodates many different activities and uses; however, freight and logistics activities are a core use, and freight and logistics land is critical to the operation of the system that services the city and NSW as a whole.
We can contribute to a productive NSW through a series of small-scale optimisations across components of the freight and logistics system. We recommend optimisations based on a considered understanding of the role and significance of each component of the system, and key considerations such as proximity to end users, infrastructure access, land supply, planning controls (including approval conditions that impact performance/operation) and the availability of viable alternative sites.
NSW Ports was established in mid-2013 under a 99-year lease to manage Port Botany, Cooks River Intermodal Terminal (IMT) and the Enfield Intermodal Logistics Centre within Greater Sydney and Port Kembla in the Illawarra.
As custodian, NSW Ports is responsible for strategic port development and planning, landside precinct security and safety, operating control of bulk liquids and common user berths, wharf infrastructure maintenance, port access and berths, tenant management, and road and rail access.1
Port Botany handles 99.6% of the container traffic in NSW, and managed 2.5 million twenty-foot equivalent units (TEU) of throughput in year 2019/20.2 Cooks River IMT and the Enfield Intermodal Logistics Centre support the Port Botany freight task, supporting the supply chain and distributing goods across Greater Sydney.
NSW PORTS

10A CITY THAT DELIVERS: NSW PORTS
1 NSW Ports, ‘Purpose & Role: About NSW Ports’, <https://www.nswports.com.au/about-nsw-ports> (accessed 21/07/21)2 Australian Competition and Consumer Commission (2020), Container stevedoring monitoring report 2019–20, < https://www.accc.gov.au/system/files/Container%20stevedoring%20monitoring%20report%202019-20.pdf>3 This represents total TEU movements, including imports and exports from Port Botany. Source: Transport Performance and Analytics (2018) NSW Freight Commodity Demand Forecasts 2016-2056.
Containers through Port Botany are forecast to increase over 200% from an average of 2.4 million TEU per year in 2016 to 7.3 million TEU per year in 2056, with the majority of imported containers destined for Greater Sydney.3
NSW Ports’ 30 Year Master Plan outlines five objectives to sustainably cater for forecast trade growth:
In managing daily operations and meeting long-term objectives, NSW Ports works with several port supply chain stakeholders, including Federal, State and Local governments, terminal operators, intermodal terminal operators, the logistics industry (road and rail transport companies, shipping lines) and the community.
1. Provide efficient road connections to the ports and intermodal terminals
2. Grow rail transport of containers
3. Use land and infrastructure efficiently
4. Grow port capacity
5. Protect the ports and intermodal terminals from urban encroachment.

11A CITY THAT DELIVERS: NSW PORTS
NSW PRODUCTIVITY COMMISSION’S WHITE PAPER 2021
The NSW Productivity Commission’s White Paper 2021 Rebooting the economy triggered the Commission’s Industrial Lands Policy Review.
The White Paper recommends reducing the number of business and industrial zones and broadening permissible activities to enable greater flexibility in terms of the activities that can be carried out on business and industrial land.
These recommendations are made under the assertion that regulation restricts competition, meaning some land is used less intensively than it could be. This relates directly to industrial land covered by the Commission’s policy.
To guide the NSW Ports’ response, this report provides a broader comprehension of how industrial land contributes to freight movements across the system and the productivity of a growing Greater Sydney. It recommends a policy approach that fully appreciates the cumulative impact of the site-by-site erosion of industrial land, to protect the freight and logistics system and avoid system-wide impacts.
• The importance of flows and the bias towards reducing the number of movements and multiple points of handling to reduce costs. Flows can be interrupted by distance, travel speed, volume and ability to schedule seamless movements.
• The links in the supply chain and role of place in supporting these activities. The characteristics of a place determine its suitability in the supply chain. Impacts on place can include land prices, size of sites and access to the transport network.
• How digital transformation of the system will likely lead to lower job densities on sites but higher capital investment. This investment will include high bay warehousing and robotics, with the digital transformation supporting other employment and innovation across Greater Sydney.
A systems approach requires understanding of what land use settings maximise system performance, so that policy makers and industry can program required investment. Fundamentally, this requires consideration of:

12A CITY THAT DELIVERS: NSW PORTS
The allocation, use and location of freight and logistics land impacts all these considerations.
Figure 1 illustrates how residential and other employment uses impact the productivity of freight and logistics land and the potential for freight and logistics land to be optimised to generate greater economic benefits.
Figure 1 Pressures on freight and logistics land and the added value of this land to industry and communities

13A CITY THAT DELIVERS: NSW PORTS
A PROPOSED POLICY APPROACH
We recommend four changes to Industrial Lands Policy in Greater Sydney:
Adopt the recommended typologies for freight and logistics land that recognise the function and significance of different land. This provides a clearer understanding of the land use requirements of the freight and logistics system and appreciates the role of different typologies of land in maintaining efficient freight flows and supporting a 30-minute city.
Develop effective tools to support decision-making to recognise the broader productivity costs and benefits of freight movements and enable evaluation of the cumulative impacts of policy and industrial land decisions that either displace or substitute industrial land.
Enable additional land to be made available within core freight and logistics areas such as around Port Botany and IMTs that are critical to Port operations and enable industry to co-locate. Providing land and setting policies to futureproof land for freight and logistics needs will enable Port Botany to operate at capacity and generate efficiencies across the freight and logistics network.
Establish measures that focus on the performance and productivity of freight and logistics land, particularly in Eastern Sydney where industrial land supply is limited. We need to address constraints, curfews and the erosion of freight and logistics land that impacts the operation and productivity of sites and the efficiency of freight flows across the broader system.
1.
2.
3.
4.
14A CITY THAT DELIVERS: NSW PORTS
A reformed policy approach to industrial lands in Greater Sydney will create opportunities and avoid the erosion of the efficiency of the freight and logistics system. It can protect Port Botany’s competitive standing in the East Coast market, reduce cost to consumers and bring benefits to business and industry in NSW. It can support an approach to policy and planning decisions that encourage land optimisation to support freight and logistics activities and reframe performance measures for industrial land away from number of jobs per site, but rather the contribution of a site to city and State productivity outcomes.
Without these reforms, challenges will only be exacerbated; we cannot afford for limited supply, encroachment, congestion and high land prices to continue, especially given forecast population growth.
This report focuses primarily on sea freight; we refer to sea freight as ‘freight’ throughout this report. This does not ignore the relationship between air and sea freight within the Port Botany precinct; indeed, the proximity of the Port and Airport amplify the benefits of reducing congestion and clustering industrial land to support all freight movements in the area.
Our analysis is focussed on Eastern Sydney, where the Greater Sydney Commission’s retain and manage policy applies to almost all local government areas and the supply of industrial land is constrained. We recognise that industrial land accommodates many different employment activities, however this report focuses on freight and logistics activities on industrial land. Examples provided in this report are representative movements of container freight and have been simplified to provide illustrative examples and support analysis.
We recognise the breadth of freight and logistics activities and that freight type determines movement patterns and important locations around the city. Further analysis is recommended to provide a more comprehensive understanding of all freight and logistics land across Greater Sydney and to understand land requirements and importance of particular locations as it relates to specific freight movements, such as bulk liquids.
15A CITY THAT DELIVERS: NSW PORTS
CONTEXT
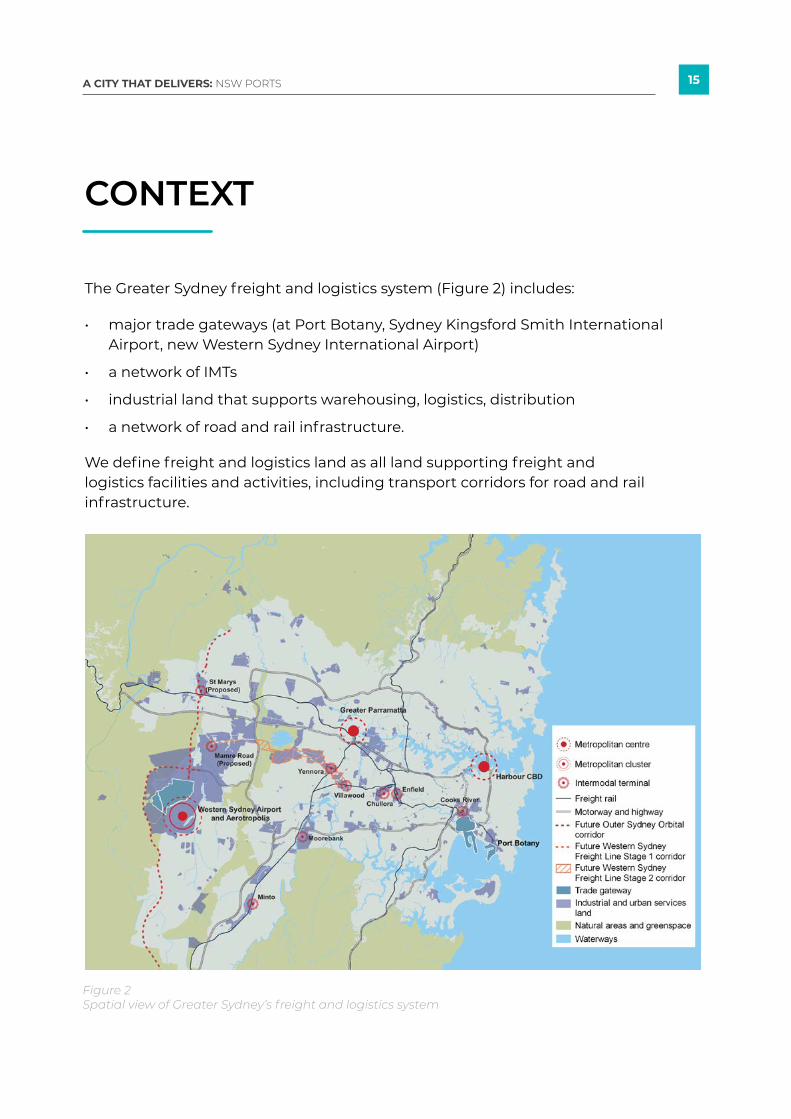
The Greater Sydney freight and logistics system (Figure 2) includes:
We define freight and logistics land as all land supporting freight and logistics facilities and activities, including transport corridors for road and rail infrastructure.
• major trade gateways (at Port Botany, Sydney Kingsford Smith International Airport, new Western Sydney International Airport)
• a network of IMTs
• industrial land that supports warehousing, logistics, distribution
• a network of road and rail infrastructure.
Figure 2 Spatial view of Greater Sydney’s freight and logistics system

16A CITY THAT DELIVERS: NSW PORTS
4 Statistical Area 3 (SA3) geographical areas are designed to provide a regional breakdown of Australia. In major cities, SA3s represent the area serviced by a major transport and commercial hub, and often closely align to large urban LGAs. For more information on geographical boundaries, see: Australian Bureau of Statistics [ABS] Australian Statistical Geography Standard (ASGS) https://www.abs.gov.au/
Figure 3 provides the spatial context of Eastern Sydney and Western Sydney, as defined in this report. Eastern Sydney aligns roughly with the definition of the Eastern Harbour City (Eastern City, North and South districts) with the addition of the Auburn and Bankstown Statistical Areas 3 (SA3s)4 (generally the local government areas (LGAs) of Cumberland and Canterbury Bankstown).
The split between Eastern and Western Sydney is defined well by the A3 (Mona Vale Road, Ryde Road, Lane Cove Road, Devlin Street, Church Street, Concord Road, Homebush Bay Drive, Centenary Drive, Roberts Road, Wiley Avenue and King Georges Road).
Eastern and Western Sydney are illustrated by different characteristics and analysis of:
• supply and nature of industrial land
• population growth and change
• forecasts in freight demand
• function and role of industrial land for freight and logistics
• nature of the freight road and rail network.
Figure 3 Eastern Sydney and Western Sydney.
17A CITY THAT DELIVERS: NSW PORTS
5 NSW Ports (2015), Navigating the Future: NSW Ports’ 30 Year Master Plan, p. 38, <https://www.nswports.com.au/sites/default/files/Uploads/Publications/NSW-Ports-Master-Plan-2015.pdf> 6 Transport for NSW (2018), NSW Freight and Ports Plan 2018-2023, <https://www.transport.nsw.gov.au/projects/strategy/nsw-freight-and-ports-plan>
THE IMPORTANCE OF PORT BOTANY
GROWING DEMAND
Port Botany handles 99.6% of the container traffic in NSW and more than 80% of import containers are delivered within a 40 kilometre radius of Port Botany – either destined for the Sydney market or unpacked at distribution centres and distributed to regional NSW or interstate. This pattern will continue over the next 30 years, with a westward shift in destinations due to an increase in distribution centres in Western Sydney.5
In addition, Port Botany hosts Australia’s largest common user bulk liquids facility, handling 98% of the State’s liquefied petroleum gas (LPG), 30% of refined fuels, and 90% of bulk chemicals for manufacturing.
Every citizen in NSW is connected to the freight and logistics system in some way. It provides the food we eat, the goods we rely on to work, and clothing and household goods. Its efficiency contributes to the cost of food and goods as well as how quickly we can receive what we want when we want it.
The NSW Freight and Ports Plan 2018-2023 estimates that 194 million tonnes of freight was moved around Greater Sydney in 2016 and that the freight task will be 288 million tonnes per annum in 2036 (an increase of 48% since 2016). This is driven by population growth, economic growth and growth in global commodity demand.6
Population growth is driven by a combination of migration (internal and overseas) and young families having children. We see faster growth is seen in greenfield developments in the west and infill and brownfield sites, typically around Greater Parramatta and Olympic Peninsula (GPOP) and the Eastern Harbour City. New housing drives internal migration and attracts younger people. Internal movements are increasing in inner Sydney suburbs, with people arriving for tertiary education and new jobs.

18A CITY THAT DELIVERS: NSW PORTS
While COVID-19 has stymied overseas migration, movements from internal migration and the growth associated with natural increase (the difference between births and deaths) continues. This lull in overseas migration will slow growth for a short time but is likely to return to pre-COVID levels.
In addition to population growth, Transport for NSW (TfNSW) freight forecasts account for:
7 The freight demand forecast data is filtered by movements through Port Botany only. Demand estimates reported here are for freight across all commodities with destinations located in Greater Sydney. Demand estimates provide a measure of demand for freight but not of freight movements. In most cases, the weight of freight demand is greater than the weight of demand because of transfers between transport modes and distribution points.
These economic drivers assume growth in freight demand across Sydney.
A comparison of growth between Eastern Sydney and Western Sydney (Table 1) shows that forecast freight demand is growing at a significantly higher rate than forecast population growth,7 particularly in Eastern Sydney.
• domestic economic drivers including retail growth, employment growth, long supply forecasts, domestic electricity generation and agricultural constraints on outputs
• international demand for commodities, including grain, meat, wine, dairy, and steel.
Eastern Sydney
Population
Freight demand (kt)
Western Sydney
Population
Freight demand (kt)
2016 2056 % Growth
2,365,801
10,626
2,322,504
14,808
3,643,203
26,766
4,639,664
33,015
54%
152%
100%
123%
Table 1 Forecast population and freight demand for Greater Sydney, 2016 to 2056
Source: Transport for NSW, Travel Zone Projections 2019 (TZP19) - NSW Government population and dwelling projections

19A CITY THAT DELIVERS: NSW PORTS
FREIGHT DEMAND FORECASTS
At a macro level, there is growth forecast for freight demand across Eastern Sydney.8
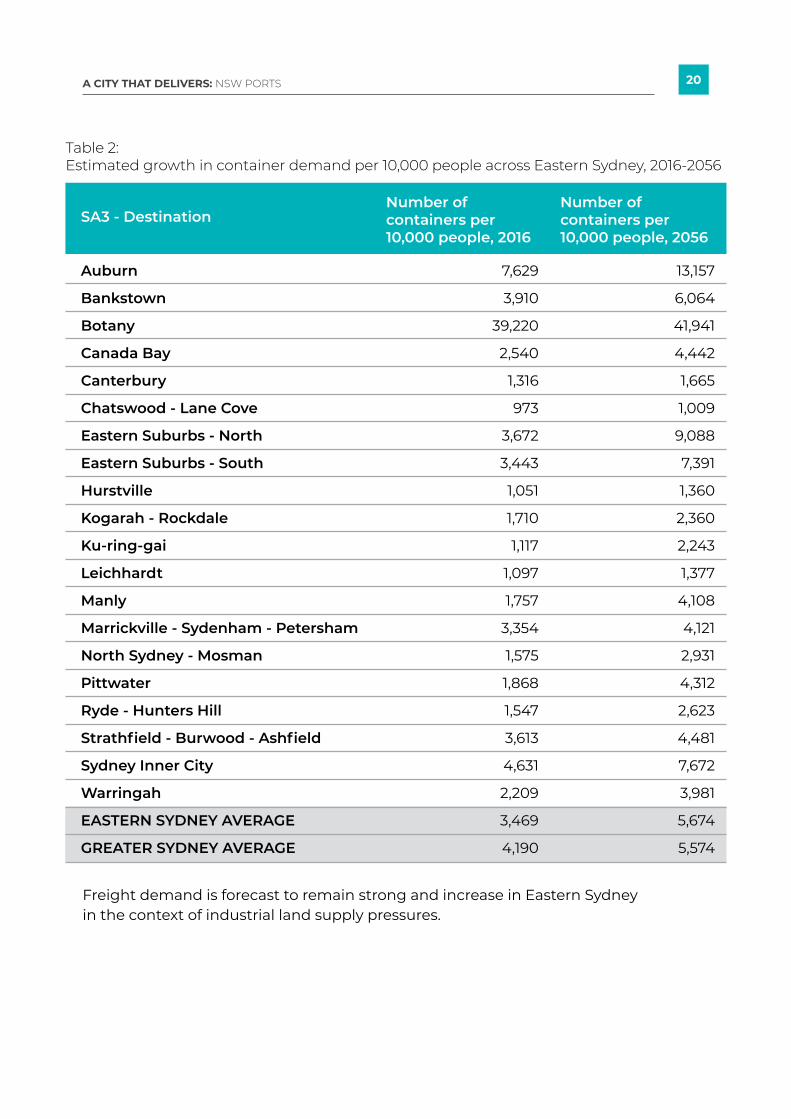
Freight demand can be measured through container demand per capita. Table 2 shows an increase in all areas, indicating an accompanying growth in freight movements. This accounts for higher demand (more people living in each area), alongside growth in demand for commodities among residents.
Places where container demand per capita is higher than the Greater Sydney average are likely to be places that support movement or warehousing of freight, as demand trends are beyond that generated by the population (Figure 4). This has implications for gross distribution and particularly for last-mile delivery across a geography with a constrained road network.
8 Demand estimates for SA3s across Greater Sydney focus on Eastern Sydney as per our definition (SA3s east of the A3) or serviced by IMTs in Eastern Sydney. TfNSW population and freight demand forecasts inform demand estimates. Both data sets are part of the Common Planning Assumptions, agreed projections used by the NSW Government and others to prepare proposals, business plans and strategies.
Figure 4 Areas in Eastern Sydney forecast to generate above average container volumes
20A CITY THAT DELIVERS: NSW PORTS
Freight demand is forecast to remain strong and increase in Eastern Sydney in the context of industrial land supply pressures.
Auburn
Bankstown
Botany
Canada Bay
Canterbury
Chatswood - Lane Cove
Eastern Suburbs - North
Eastern Suburbs - South
Hurstville
Kogarah - Rockdale
Ku-ring-gai
Leichhardt
Manly
Marrickville - Sydenham - Petersham
North Sydney - Mosman
Pittwater
Ryde - Hunters Hill
Strathfield - Burwood - Ashfield
Sydney Inner City
Warringah
EASTERN SYDNEY AVERAGE
GREATER SYDNEY AVERAGE
Number of containers per 10,000 people, 2016
SA3 - Destination Number of containers per 10,000 people, 2056
7,629
3,910
39,220
2,540
1,316
973
3,672
3,443
1,051
1,710
1,117
1,097
1,757
3,354
1,575
1,868
1,547
3,613
4,631
2,209
3,469
4,190
13,157
6,064
41,941
4,442
1,665
1,009
9,088
7,391
1,360
2,360
2,243
1,377
4,108
4,121
2,931
4,312
2,623
4,481
7,672
3,981
5,674
5,574
Table 2: Estimated growth in container demand per 10,000 people across Eastern Sydney, 2016-2056

21A CITY THAT DELIVERS: NSW PORTS
DRIVERS OF CHANGE
1: E-COMMERCE TRENDS AND SHIFTING CONSUMER PREFERENCES
Four drivers of change will impact and influence business operations, supply chain dynamics, and land use and infrastructure requirements in the freight and logistics system.
E-Commerce and online shopping has increased during COVID-19, shifting consumer expectations to on-demand delivery. For example, there was an 80% year-on-year increase in online retail in Greater Sydney in the eight weeks after the pandemic was declared in2020.9
Consumers demand convenience and access to a greater range of goods, all at better prices. A greater volume of goods are delivered to people’s homes, requiring businesses to develop service and delivery models that allow for quick dispatch and delivery at more times of the day and with coverage across Greater Sydney.
Businesses must fulfil increasingly complex and competitive delivery
9 Greater Sydney Commission (2020), City Shaping Impacts of COVID-19, p. 21 10 Arup (2020), The Future of Australian Logistics and Our Cities, p. 14, <https://www.arup.com/perspectives/publications/research/section/the-future-of-australian-logistics-and-our-cities> 11 Colliers Research (2021a), Industrial H1 2021 Research and Forecast Report, <https://www.colliers.com.au/en-au/research/industrial-h1-2021-rfr> 12 Knight Frank (2021), The Last Mile Race Challenging Urban Logistics <https://content.knightfrank.com/research/2271/documents/en/urban-logistics-australia-july-2021-8221.pdf>
commitments while balancing costs and quality customer experience. This has spatial consequences and highlights inefficiencies such as congestion and competition for land and resources in the city’s freight and logistics system.10
Industry must meet two parallel challenges to service online consumer demand: proximity and volume. Occupiers are taking on additional warehouse space to meet demand - servicing online sales requires three times the amount of warehouse space compared to traditional brick and mortar sales.11 This foreshadows demand for well located industrial land for local distribution such as ‘dark stores’ and micro-fulfillment centres.12

22A CITY THAT DELIVERS: NSW PORTS
INDUSTRY INSIGHTS – RETAILER SERVICE RESPONSES
During the peak of COVID-19, supermarket retailers saw unprecedented demand for grocery products, including a doubling in demand for online grocery orders. Local councils and the NSW Government made regulatory changes to facilitate 24/7 grocery deliveries, to assist with this challenge.
The 24/7 deliveries remain in place until March 2022, with flexibility enabling industry to respond to increasing community expectation for on-demand delivery of essential goods. Retaining this flexibility in perpetuity offers opportunities to ease congestion in peak times and to facilitate the economic activity generated through an increase in online deliveries.
As part of planning processes, it will be critical to ensure residential developments incorporate effective measures, including noise attenuation of loading docks, to ensure a balance can be maintained between liveability and productivity.
Proximity to customers is critical for retailers in terms of ecommerce, which is leading to dedicated facilities being constructed close to existing communities across Greater Sydney. It is critically important to ensure planning systems can accommodate these uses - which require 24/7 operations - as these dedicated facilities are increasingly required in inner urban areas as online shopping increases.
23A CITY THAT DELIVERS: NSW PORTS
2: AUTOMATION TECHNOLOGY
Freight and logistics operators are increasingly seeking larger sites. Between 2007 and 2009 the average warehouse size in Greater Sydney was 13,970 square metres; today, this is almost 18,000 square metres, representing a 23% growth.13 Larger sites do not only increase inventory volume to service demand, but allow operators to utilise automation technology.
All around the world, large-scale freight and logistics operations face limited availability of land to meet site requirements. The growth in average warehouse sizes in Sydney lags behind comparative developments in Melbourne and Brisbane, which can better accommodate larger developments on sites.14
The sector is adapting by changing warehousing models to overcome ‘horizontal’ site restrictions; instead, changes in warehousing technology such as high bay automation will require increased building heights. The Greater Sydney Region Plan identifies the need for greater building heights for high bay automation to support the growth of the freight sector in the Central River City.15
13 Colliers Research (2021b), Western Sydney Industrial Development Update 2021. <https://www.colliers.com.au/en-au/research/western-sydney-industrial-development-update-2021>14 Colliers Research (2021a), Industrial H1 2021 Research & Forecast Report, p. 10, <https://www.colliers.com.au/en-au/research/industrial-h1-2021-rfr>15 Greater Sydney Commission (2018) Greater Sydney Region Plan, p. 13116 Xiao, Zuopeng, Quan Yuan, Yonghai Sun, and Xixiong Sun. 2021. ‘New Paradigm of Logistics Space Reorganization: E-Commerce, Land Use, and Supply Chain Management’. Transportation Research Interdisciplinary Perspectives 9 (March): 100300. <https://doi.org/10.1016/j.trip.2021.100300>
• new multi-storey facilities
• renovation of obsolete facilities, involving conversion of existing old buildings
• reorganisation of existing facilities at a regional level: some retailers will move to neighbouring cities, their outmigration linked to land size, land price and market coverage.16
Three major approaches to development are emerging:
24A CITY THAT DELIVERS: NSW PORTS
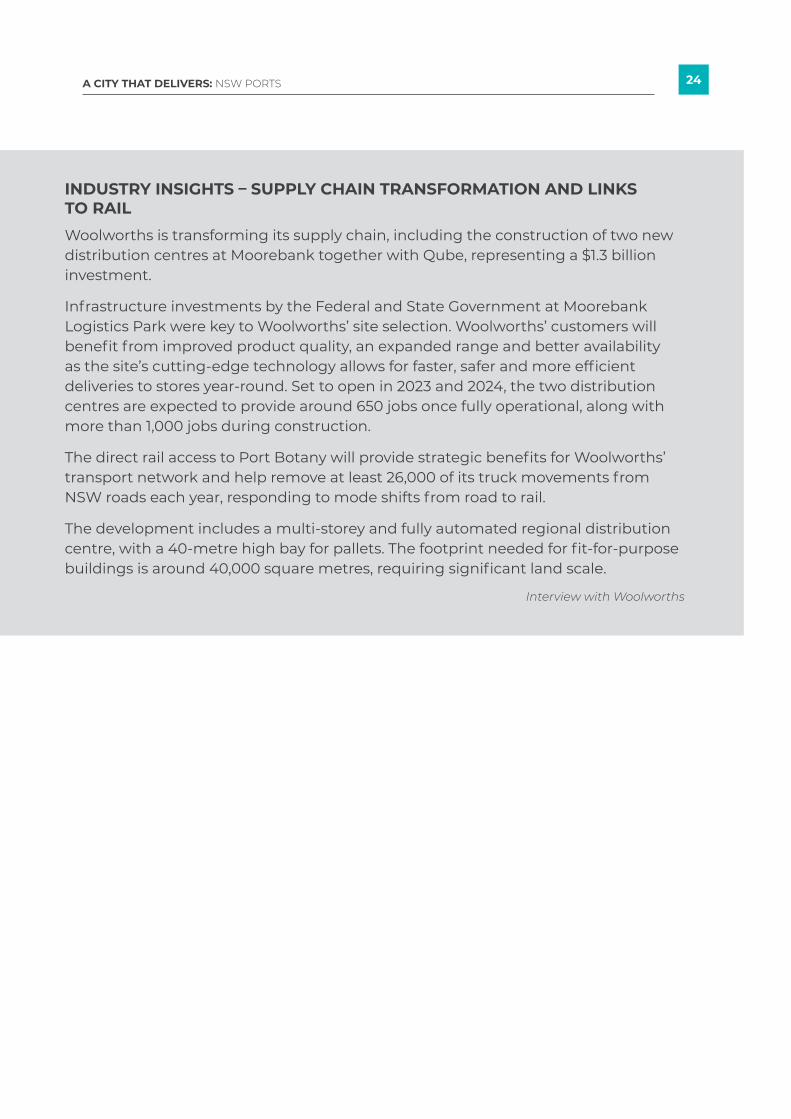
INDUSTRY INSIGHTS – SUPPLY CHAIN TRANSFORMATION AND LINKS TO RAIL Woolworths is transforming its supply chain, including the construction of two new distribution centres at Moorebank together with Qube, representing a $1.3 billion investment.
Infrastructure investments by the Federal and State Government at Moorebank Logistics Park were key to Woolworths’ site selection. Woolworths’ customers will benefit from improved product quality, an expanded range and better availability as the site’s cutting-edge technology allows for faster, safer and more efficient deliveries to stores year-round. Set to open in 2023 and 2024, the two distribution centres are expected to provide around 650 jobs once fully operational, along with more than 1,000 jobs during construction.
The direct rail access to Port Botany will provide strategic benefits for Woolworths’ transport network and help remove at least 26,000 of its truck movements from NSW roads each year, responding to mode shifts from road to rail.
The development includes a multi-storey and fully automated regional distribution centre, with a 40-metre high bay for pallets. The footprint needed for fit-for-purpose buildings is around 40,000 square metres, requiring significant land scale.
Interview with Woolworths

25A CITY THAT DELIVERS: NSW PORTS
3: WORKFORCE AND AUTOMATION
The logistics industry is leveraging innovative technologies and approaches to meet demand. This includes data collection, intelligent systems, Internet of Things and autonomous vehicles. Information flows allow monitoring and analysis of activity on the ground, which can change every element of the supply chain, from enhanced asset tracking to warehouse operations and freight transportation.17
Increasing automation of freight and logistics operations will shape workforce training and development. Woolworths’ Future of Work Fund will fund an online learning and training platform for staff, focusing initially on data analytics, machine learning and robotics, and reskilling staff to operate automated distribution centres.18
Automation may require new ways to measure the productivity of freight and logistics land instead of traditional measures such as the number of jobs on a site, or job density in an employment lands precinct. Automation is an innovation process and important to productivity. The difference is that the benefit realisation
is located ‘offsite’ through system and sector efficiencies – not necessarily ‘onsite’ in warehouses and distribution centres.
Digital transformation of the freight and logistics sector will only improve productivity with the right pre-conditions. Increasing optimisation will put downward pressure on prices, supporting the competitiveness of Greater Sydney’s manufacturers and cost to consumers.
17 Arup (2020), The Future of Australian Logistics and Our Cities, <https://www.arup.com/perspectives/publications/research/section/the-future-of-australian-logistics-and-our-cities>18 Woolworths Group (2021), ‘Retail transformation spurs $50m Woolworths Future of Work Fund’, 8 February 2021, <https://www.woolworthsgroup.com.au/page/media/Latest_News/retail-transformation-spurs-50m-woolworths-future-of-work-fund>
26A CITY THAT DELIVERS: NSW PORTS
4: SUSTAINABILITY, SAFETY AND SUPPLY CHAIN RESILIENCE
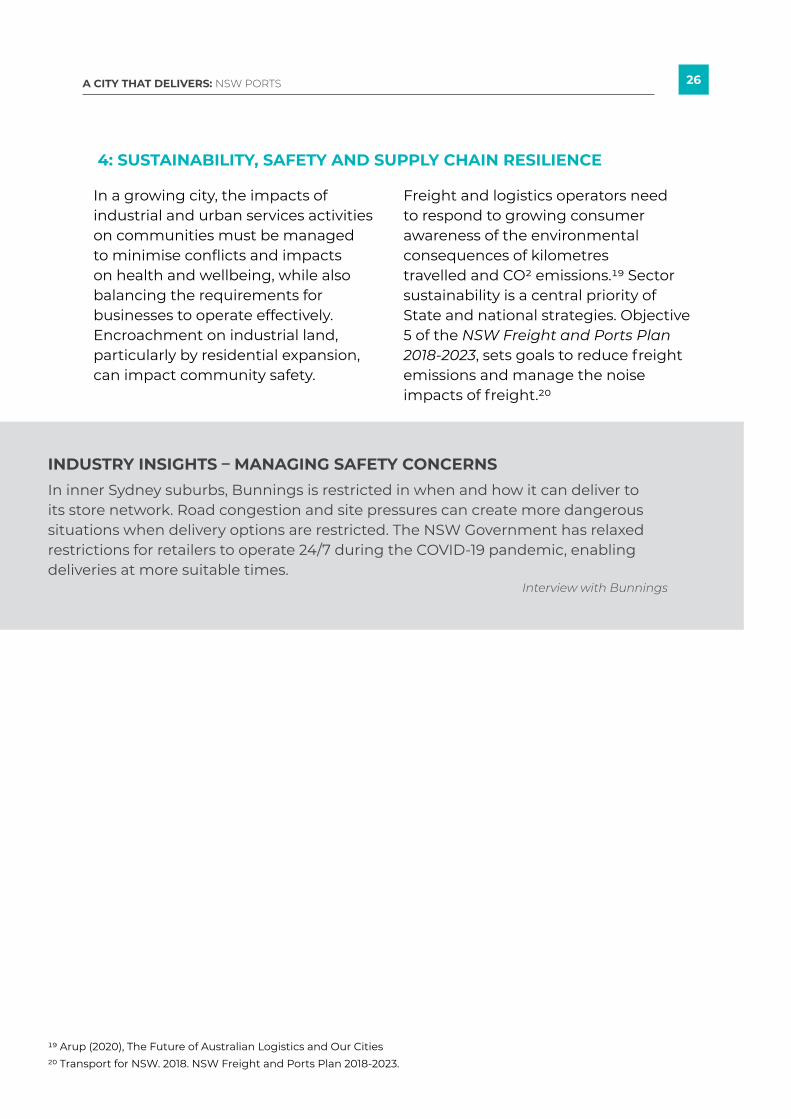
In a growing city, the impacts of industrial and urban services activities on communities must be managed to minimise conflicts and impacts on health and wellbeing, while also balancing the requirements for businesses to operate effectively. Encroachment on industrial land, particularly by residential expansion, can impact community safety.
Freight and logistics operators need to respond to growing consumer awareness of the environmental consequences of kilometres travelled and CO2 emissions.19 Sector sustainability is a central priority of State and national strategies. Objective 5 of the NSW Freight and Ports Plan 2018-2023, sets goals to reduce freight emissions and manage the noise impacts of freight.20
19 Arup (2020), The Future of Australian Logistics and Our Cities 20 Transport for NSW. 2018. NSW Freight and Ports Plan 2018-2023.
INDUSTRY INSIGHTS – MANAGING SAFETY CONCERNSIn inner Sydney suburbs, Bunnings is restricted in when and how it can deliver to its store network. Road congestion and site pressures can create more dangerous situations when delivery options are restricted. The NSW Government has relaxed restrictions for retailers to operate 24/7 during the COVID-19 pandemic, enabling deliveries at more suitable times.
Interview with Bunnings

27A CITY THAT DELIVERS: NSW PORTS
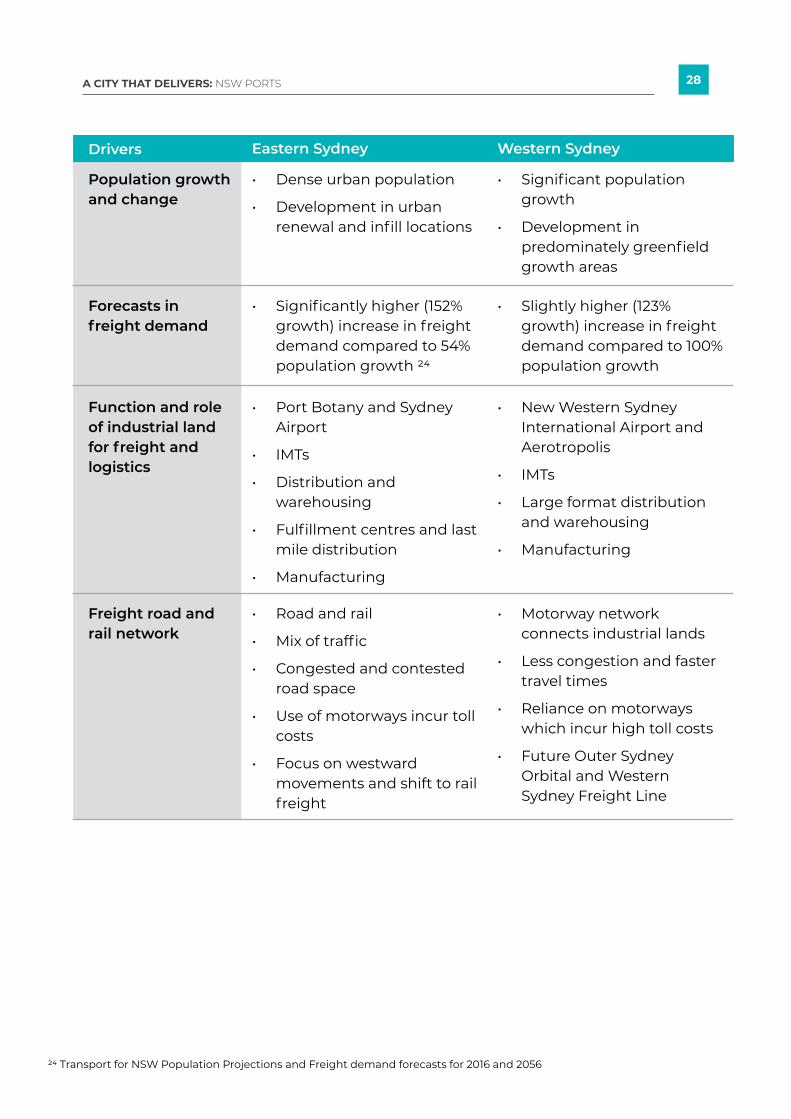
CHALLENGES EASTERN SYDNEY AND WESTERN SYDNEY CHALLENGES DIFFER
Eastern Sydney and Western Sydney differ in terms of spatial structure, patterns of urban development and character. This presents different challenges and requires different policy responses.
Supply and nature of industrial land
• Limited supply, 2,938 hectares zoned industrial land, and limited future supply, 112 hectares of undeveloped industrial land. 21
• 8.7 hectares of industrial land was rezoned for other uses between 2018 and 2020 and an additional 3.3 hectares is expected to be lost through planning proposals in the coming years 22. This is an example of some of the land lost and the true amount could be greater.
• Additional industrial land has been lost to deliver infrastructure projects such as Westconnex (St Peters interchange, M8) and Sydney Gateway.
• Smaller and fragmented lots
• Greater supply, 8,186 hectares zoned industrial land, 2,579 hectares of undeveloped land and 6,529 hectares of future potential land flagged to be rezoned. 23
• Large lots
Eastern SydneyDrivers Western Sydney
Table 3: Overvew of characteristics and challenges for freight and logistics land in Eastern Sydney and Western Sydney
21 NSW Department of Planning, Industry and Environment (2020), Employment Lands Development Monitor 202022 This includes sites with rezoned land greater than 0.1 hectares and planning proposals lodged or gateway approved as recorded for each year. Source: NSW Department of Planning, Industry and Environment, Employment Lands Development Monitor – Sydney Employment Lands Supply data (zoning changes and planning proposals) for 2020, 2019, 2018.23 Ibid.
28A CITY THAT DELIVERS: NSW PORTS
Population growth and change
Forecasts in freight demand
Function and role of industrial land for freight and logistics
Freight road and rail network
• Dense urban population
• Development in urban renewal and infill locations
• Significantly higher (152% growth) increase in freight demand compared to 54% population growth 24
• Port Botany and Sydney Airport
• IMTs
• Distribution and warehousing
• Fulfillment centres and last mile distribution
• Manufacturing
• Road and rail
• Mix of traffic
• Congested and contested road space
• Use of motorways incur toll costs
• Focus on westward movements and shift to rail freight
• Significant population growth
• Development in predominately greenfield growth areas
• Slightly higher (123% growth) increase in freight demand compared to 100% population growth
• New Western Sydney International Airport and Aerotropolis
• IMTs
• Large format distribution and warehousing
• Manufacturing
• Motorway network connects industrial lands
• Less congestion and faster travel times
• Reliance on motorways which incur high toll costs
• Future Outer Sydney Orbital and Western Sydney Freight Line
Eastern SydneyDrivers Western Sydney
24 Transport for NSW Population Projections and Freight demand forecasts for 2016 and 2056
29A CITY THAT DELIVERS: NSW PORTS
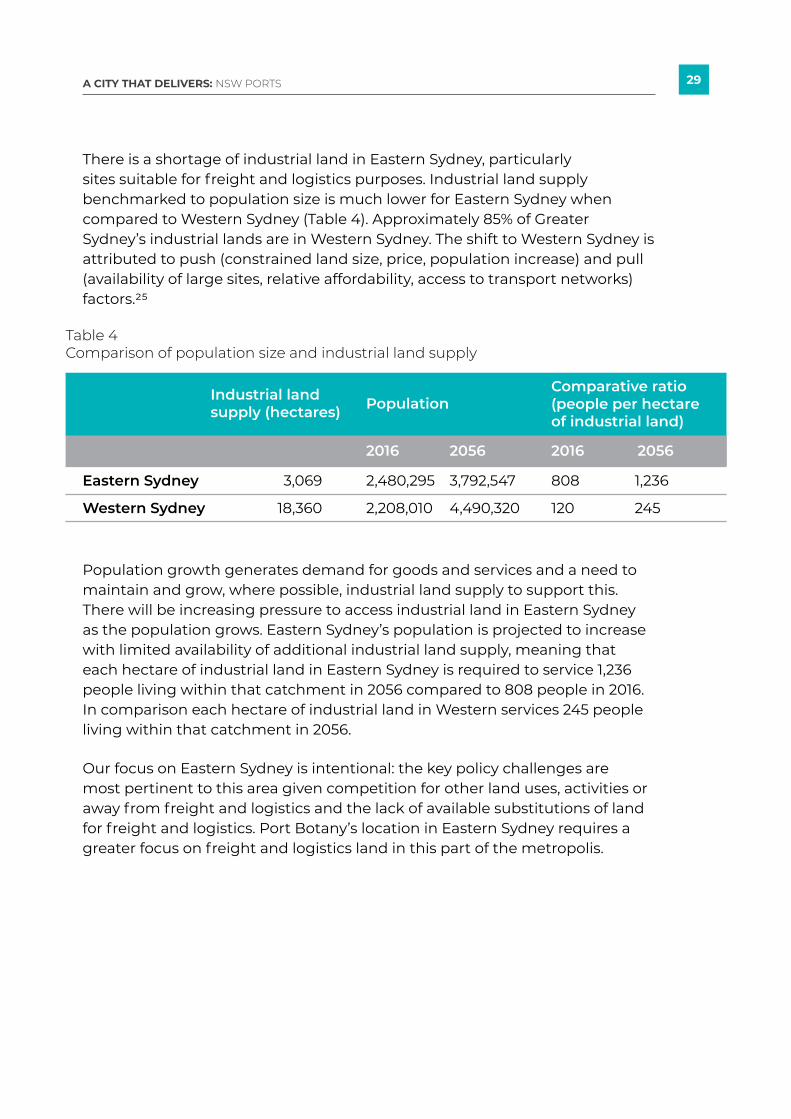
There is a shortage of industrial land in Eastern Sydney, particularly sites suitable for freight and logistics purposes. Industrial land supply benchmarked to population size is much lower for Eastern Sydney when compared to Western Sydney (Table 4). Approximately 85% of Greater Sydney’s industrial lands are in Western Sydney. The shift to Western Sydney is attributed to push (constrained land size, price, population increase) and pull (availability of large sites, relative affordability, access to transport networks) factors.25
Population growth generates demand for goods and services and a need to maintain and grow, where possible, industrial land supply to support this. There will be increasing pressure to access industrial land in Eastern Sydney as the population grows. Eastern Sydney’s population is projected to increase with limited availability of additional industrial land supply, meaning that each hectare of industrial land in Eastern Sydney is required to service 1,236 people living within that catchment in 2056 compared to 808 people in 2016. In comparison each hectare of industrial land in Western services 245 people living within that catchment in 2056.
Our focus on Eastern Sydney is intentional: the key policy challenges are most pertinent to this area given competition for other land uses, activities or away from freight and logistics and the lack of available substitutions of land for freight and logistics. Port Botany’s location in Eastern Sydney requires a greater focus on freight and logistics land in this part of the metropolis.
Industrial land supply (hectares)
Comparative ratio (people per hectare of industrial land)
Population
2016 20162056 2056
Table 4 Comparison of population size and industrial land supply
Eastern Sydney
Western Sydney
3,069
18,360
2,480,295
2,208,010
808
120
3,792,547
4,490,320
1,236
245
30A CITY THAT DELIVERS: NSW PORTS
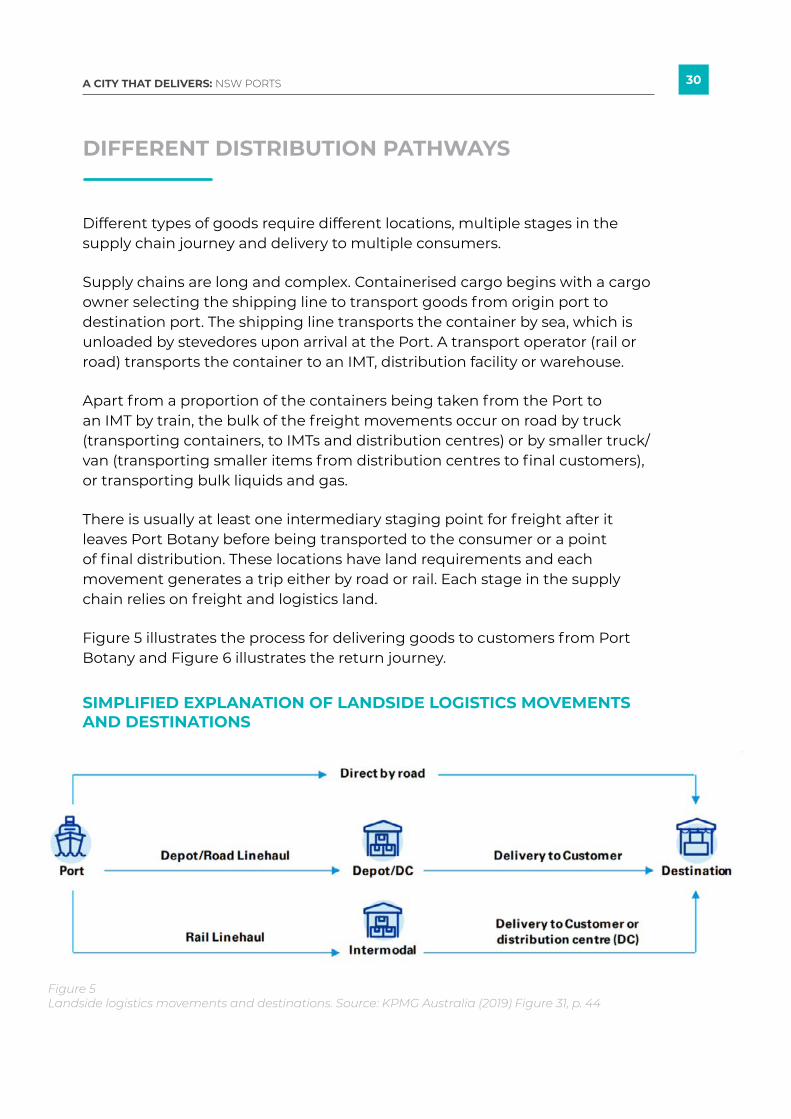
Different types of goods require different locations, multiple stages in the supply chain journey and delivery to multiple consumers.
Supply chains are long and complex. Containerised cargo begins with a cargo owner selecting the shipping line to transport goods from origin port to destination port. The shipping line transports the container by sea, which is unloaded by stevedores upon arrival at the Port. A transport operator (rail or road) transports the container to an IMT, distribution facility or warehouse.
Apart from a proportion of the containers being taken from the Port to an IMT by train, the bulk of the freight movements occur on road by truck (transporting containers, to IMTs and distribution centres) or by smaller truck/van (transporting smaller items from distribution centres to final customers), or transporting bulk liquids and gas.
There is usually at least one intermediary staging point for freight after it leaves Port Botany before being transported to the consumer or a point of final distribution. These locations have land requirements and each movement generates a trip either by road or rail. Each stage in the supply chain relies on freight and logistics land.
Figure 5 illustrates the process for delivering goods to customers from Port Botany and Figure 6 illustrates the return journey.
DIFFERENT DISTRIBUTION PATHWAYS
SIMPLIFIED EXPLANATION OF LANDSIDE LOGISTICS MOVEMENTS AND DESTINATIONS
Figure 5 Landside logistics movements and destinations. Source: KPMG Australia (2019) Figure 31, p. 44

31A CITY THAT DELIVERS: NSW PORTS
SIMPLIFIED REPRESENTATION OF CONTAINER MOVEMENTS BY ROAD (TRIANGULATION)
TWO-WAY TRIPS
In the case of Port Botany, after freight containers arrive and are taken to an IMT or distribution centre or warehouse for unstuffing and distribution, the empty container needs to be transported back to Port Botany.
Most of Australia’s exports are distributed via bulk ports, while imports are overwhelmingly containerised. Around two-thirds of containers exported from Port Botany are empty as local manufacturing or demand internationally for containerised manufactured items or agricultural produce from NSW is nowhere near the volume that is imported.28
This generates trips as well as the need for land as a holding point to store empty containers while waiting for available slots on container ships.
28 KPMG Australia (2019), Quay Conclusions: Finding the Best Choices for Additional Port Capacity in NSW, p. 16, <https://assets.kpmg/content/dam/kpmg/au/pdf/2019/quay-conclusions-best-choices-additional-nsw-port-capacity.pdf>
INDUSTRY INSIGHTS – LAND REQUIREMENTS FOR CONTAINER STORAGERecent loss of land for an empty container park near Port Botany, for government road construction, has created additional pressure for empty container storage as this container park dealt with 18% of empty containers in Greater Sydney.
Operators require close access to the Port because the system operates as a just-in-time model. If you are not close, you need more vehicles to do the same amount of work and there are penalties for delayed delivery. The risk of penalties, in addition to costs from congestion and tolls, are significant and borne by operators. The inability to locate close to Port generates distance-related movements and costs.
Interview with AST Services
Figure 6 Triangulation of containers (storage and return of empty import containers back to the port). Source: KPMG Australia (2019) Figure 31, p. 44

32A CITY THAT DELIVERS: NSW PORTS
29 Sydney Airport (2019), Sydney Airport Master Plan 2039, p. ES-10. <https://www.sydneyairport.com.au/corporate/planning-and-projects/master-plan/master-plan-2039-downloads> 30 Ibid.31 Western Sydney Airport (2021), Australia’s new cargo hub: Western Sydney Airport, <http://www.westernsydney.com.au/opportunities/wsi-cargo-precinct>
AIR FREIGHT
The nature of how air freight is transported via passenger planes means that even with a new Airport in Western Sydney, Sydney Airport will continue to need land around Mascot to accommodate air freight growth. Passenger growth at Sydney Airport will generate additional capacity for air freight and requirements for land.
Sydney Airport generates and facilitates (directly and indirectly) $17.6 billion in freight exports annually. Total freight at Sydney Airport is anticipated to grow from 643,000 tonnes to one million tonnes in the 20 years to 2039 – an increase of 58%.29
Approximately 80% of all air freight is carried in the cargo holds of passenger aircraft.30 This means that while Sydney Airport remains the primary airport for passenger travel into Sydney, the air freight task will require adjacent industrial lands, especially as freight volume into the airport grows. The proximity of Port Botany and Sydney Airport enables clustering of freight and logistics land that can service both sea and air movements.
The new Western Sydney International Airport is expected to operate in a similar manner with passenger travel both enabling and absorbing growth in air freight. Land in the Aerotropolis, around Western Sydney International Airport, will also be connected to Greater Sydney’s road and rail freight network via the proposed Outer Sydney Orbital and Western Sydney Freight Line and connecting to new IMTs at St Marys and Mamre Road. This will link existing industrial land with land developed around the Airport and Aerotropolis that is for safeguarded industrial, enterprise and agribusiness activities.
Land is being made available at Western Sydney International Airport for a cargo precinct with direct airside access. The first stage of the Airport will have the potential to process 220,000 tonnes of air freight annually, supported by approximately 75,000 square metres of cargo terminals31.
33A CITY THAT DELIVERS: NSW PORTS
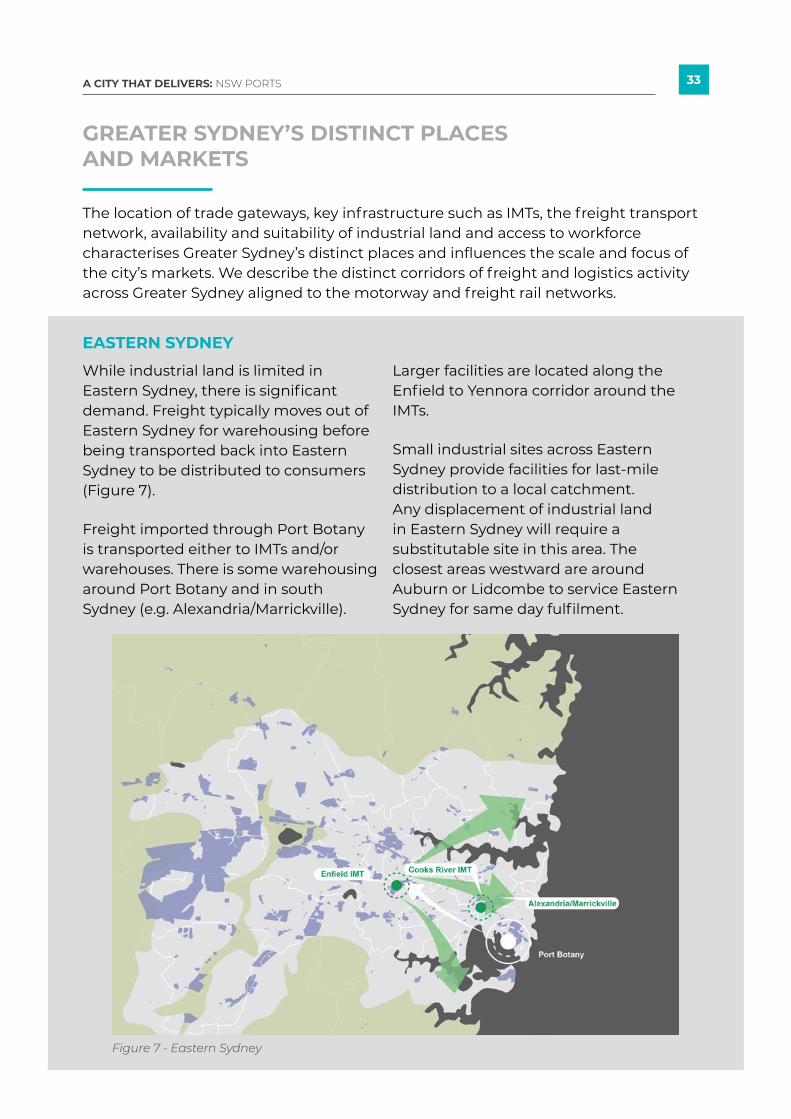
GREATER SYDNEY’S DISTINCT PLACES AND MARKETS
The location of trade gateways, key infrastructure such as IMTs, the freight transport network, availability and suitability of industrial land and access to workforce characterises Greater Sydney’s distinct places and influences the scale and focus of the city’s markets. We describe the distinct corridors of freight and logistics activity across Greater Sydney aligned to the motorway and freight rail networks.
While industrial land is limited in Eastern Sydney, there is significant demand. Freight typically moves out of Eastern Sydney for warehousing before being transported back into Eastern Sydney to be distributed to consumers (Figure 7).
Freight imported through Port Botany is transported either to IMTs and/or warehouses. There is some warehousing around Port Botany and in south Sydney (e.g. Alexandria/Marrickville).
EASTERN SYDNEY
Larger facilities are located along the Enfield to Yennora corridor around the IMTs.
Small industrial sites across Eastern Sydney provide facilities for last-mile distribution to a local catchment. Any displacement of industrial land in Eastern Sydney will require a substitutable site in this area. The closest areas westward are around Auburn or Lidcombe to service Eastern Sydney for same day fulfilment.
Figure 7 - Eastern Sydney
34A CITY THAT DELIVERS: NSW PORTS
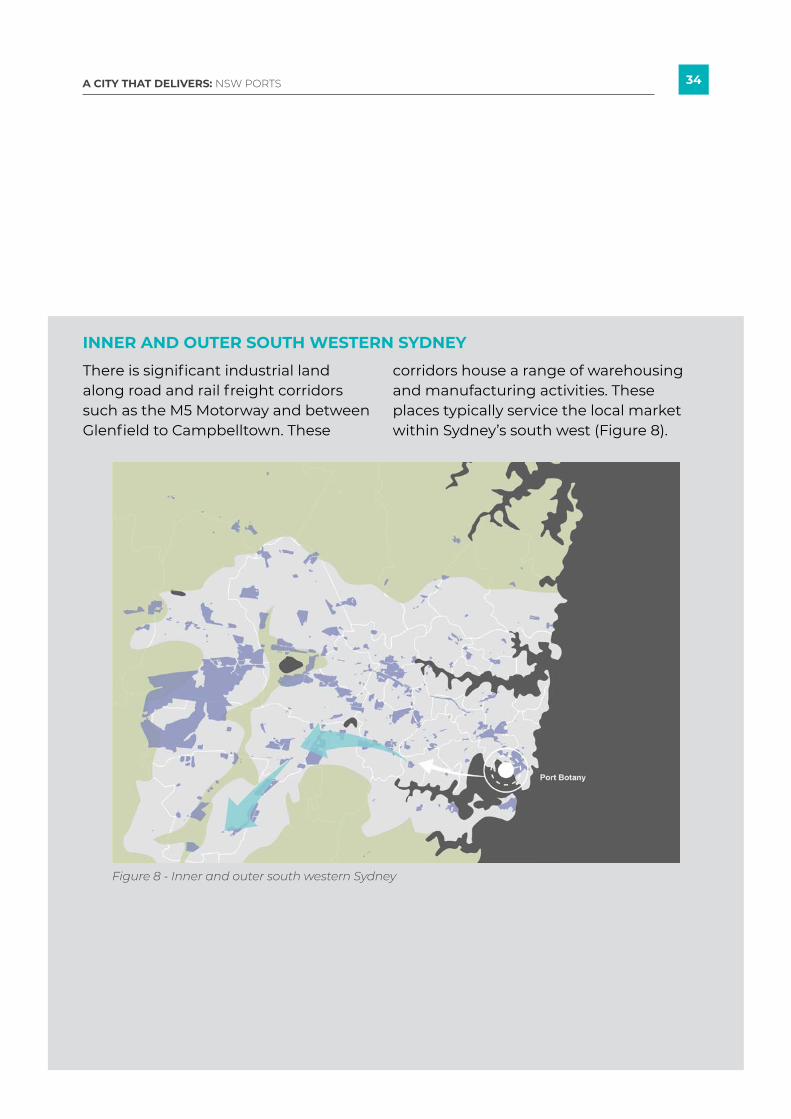
There is significant industrial land along road and rail freight corridors such as the M5 Motorway and between Glenfield to Campbelltown. These
INNER AND OUTER SOUTH WESTERN SYDNEY
corridors house a range of warehousing and manufacturing activities. These places typically service the local market within Sydney’s south west (Figure 8).
Figure 8 - Inner and outer south western Sydney

35A CITY THAT DELIVERS: NSW PORTS
Western Sydney contains the largest supply of industrial land for large-scale freight and logistics. Warehousing and distribution centres cluster around Eastern Creek and also accommodate manufacturing industries. These sites service all of Greater Sydney and other parts of NSW due their connection to the motorway network (Figure 9).
WESTERN SYDNEY
Construction of future links such as the Outer Sydney Orbital, Western Sydney Freight Line and the St Marys and Mamre Road IMT will strengthen this area as a key location for freight and logistics in NSW and enable local markets further opportunity to access international export markets through the Western Sydney International Airport and Aerotropolis.
Figure 9 - Western Sydney
36A CITY THAT DELIVERS: NSW PORTS
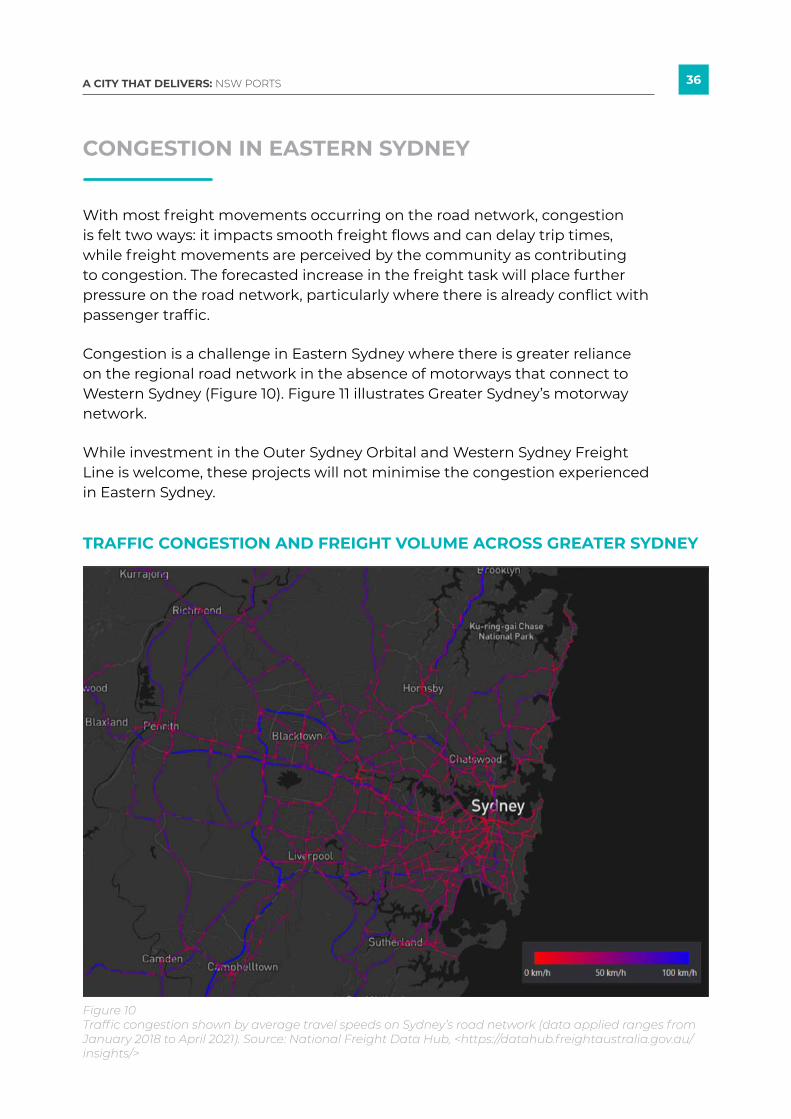
TRAFFIC CONGESTION AND FREIGHT VOLUME ACROSS GREATER SYDNEY
Figure 10 Traffic congestion shown by average travel speeds on Sydney’s road network (data applied ranges from January 2018 to April 2021). Source: National Freight Data Hub, <https://datahub.freightaustralia.gov.au/insights/>
CONGESTION IN EASTERN SYDNEY
With most freight movements occurring on the road network, congestion is felt two ways: it impacts smooth freight flows and can delay trip times, while freight movements are perceived by the community as contributing to congestion. The forecasted increase in the freight task will place further pressure on the road network, particularly where there is already conflict with passenger traffic.
Congestion is a challenge in Eastern Sydney where there is greater reliance on the regional road network in the absence of motorways that connect to Western Sydney (Figure 10). Figure 11 illustrates Greater Sydney’s motorway network.
While investment in the Outer Sydney Orbital and Western Sydney Freight Line is welcome, these projects will not minimise the congestion experienced in Eastern Sydney.
37A CITY THAT DELIVERS: NSW PORTS
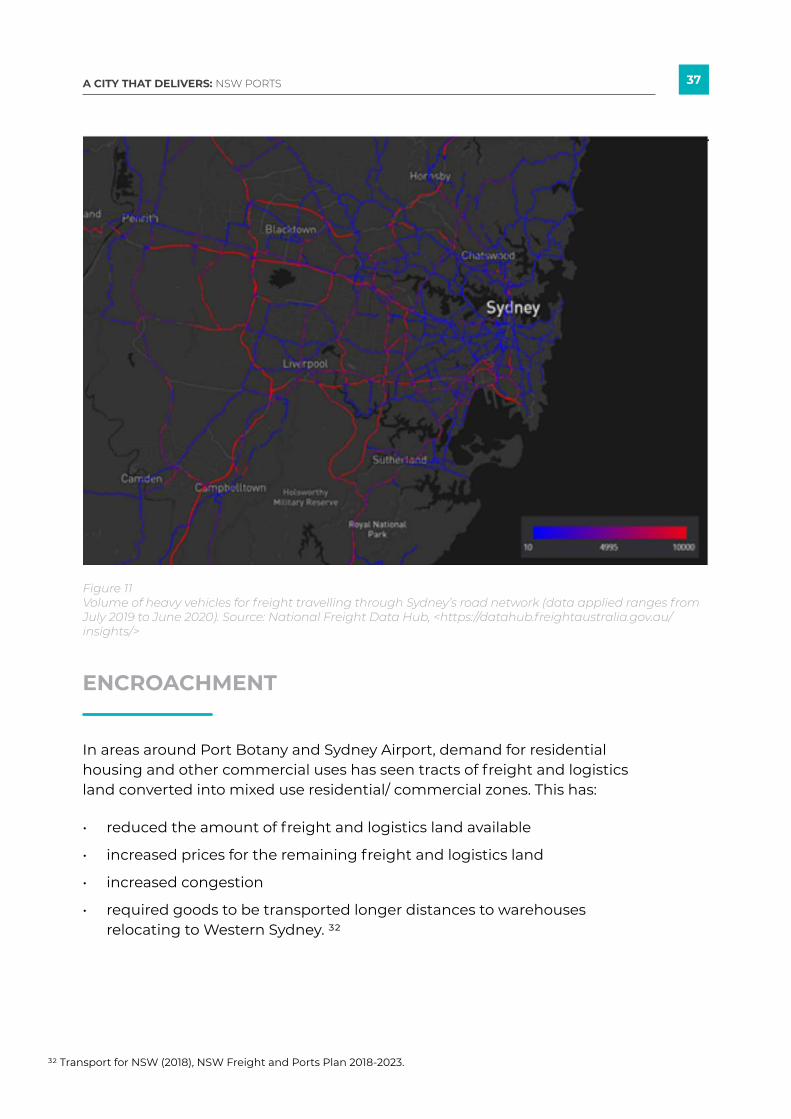
Figure 11 Volume of heavy vehicles for freight travelling through Sydney’s road network (data applied ranges from July 2019 to June 2020). Source: National Freight Data Hub, <https://datahub.freightaustralia.gov.au/insights/>
ENCROACHMENT
In areas around Port Botany and Sydney Airport, demand for residential housing and other commercial uses has seen tracts of freight and logistics land converted into mixed use residential/ commercial zones. This has:
• reduced the amount of freight and logistics land available
• increased prices for the remaining freight and logistics land
• increased congestion
• required goods to be transported longer distances to warehouses relocating to Western Sydney. 32
32 Transport for NSW (2018), NSW Freight and Ports Plan 2018-2023.

38A CITY THAT DELIVERS: NSW PORTS
Table 5: Industrial land available around Sydney’s trade gateways.
Source: Astrolabe, calculations based on land use zoning
Port Botany 5km catchment
Western Sydney International Airport 5km catchment
Residential land (ha)
2,601.4
1,336.3
Residential percentage
37%
17%
Industrial land (ha)
858.8
3,435.9
Industrial percentage
12%
45%
Total (ha)
7,039.7
7,683.2
Industrial land must be protected from encroachment in Eastern Sydney to meet projected increases in Port Botany trade volumes and port functioning; without this, the impacts of encroachment will be felt across the metropolis.
Table 5 illustrates that the amount of residential and commercial land within five kilometres of Port Botany is significantly greater than that planned around the Western Sydney International Airport.

39A CITY THAT DELIVERS: NSW PORTS
Figure 12 illustrates the factors encroaching on freight and logistics land around Port Botany.
Figure 12 Summary of factors encroaching on freight and logistics land around Port Botany. Source: Provided by NSW Ports
The recent loss of an empty container park near Port Botany equates to a need to find storage solutions for 18% of Greater Sydney’s empty containers. Limitations on the availability of industrial land around Port Botany and the failure to identify viable substitutions will impact freight and supply chain flows and efficiency, through increased congestion, travel time and costs, which impacts the cost of consumer products and competitiveness of NSW exports.
Surrounding urban development has led to restricted operations around Port Botany. This limits routes vehicles can take and by narrowing access options, causes congestion and risk to supply chain resilience.

40A CITY THAT DELIVERS: NSW PORTS
FREIGHT AND LOGISTICS LAND AND THE 30-MINUTE CITY
The ambition for a 30-minute city should also apply to freight and logistics. The network of IMTs provides coverage across most of Greater Sydney within 30 minutes (Figure 13). This highlights the importance of the location of core land – any substitution of this land must consider the impacts on travel times and efficient freight flows.
The travel time catchments presented in this section are based on permitted travel speeds for each road along the fastest routes. These show best case scenario travel times from each destination and maps are illustrative of the potential size of catchments within 30 minutes. Realistically, factors such as traffic congestion and accidents which can impact on travel time reliability will decrease the size of travel time catchments.
Figure 13 IMTs in Greater Sydney
41A CITY THAT DELIVERS: NSW PORTS
The loss of freight and logistics land in Eastern Sydney has implications on travel times and costs associated with transporting goods to the vast majority of the population of Greater Sydney.
Figure 14 and Figure 15 illustrate that loss of industrial land in Eastern Sydney will have consumer implications. Without catchment serving industrial land in Eastern Sydney, industrial land in places such as Auburn and in Western Sydney will not provide 30-minute coverage for all communities in Eastern Sydney.33 This reflects best case scenario travel times as traffic congestion and reliability can vary, particularly along the M5, which will reduce the size of the catchment accessible within 30 minutes. Availability, cost and capacity of industrial land in Eastern Sydney would further impact on the ability to deliver, same-day fulfillment.
With the growth of e-commerce requiring more localised, same-day fulfillment centres, the retention of appropriate land is essential. Not dissimilar to maintaining a network of concrete batching plants to support timely delivery within 45 minutes, a network of catchment serving sites enable servicing of local catchments within shorter timeframes that consumers demand.34
33 Travel time is an estimate calculated based on speed limit of the streets and adjusted by grades and surface of the road.34 Ethos Urban (2020), Draft Pyrmont Peninsula Place Strategy – Hymix submission, <https://bit.ly/3g07jpk>
INDUSTRY INSIGHTS – PROXIMITY TO THE CUSTOMER IS KEY IN E-COMMERCE
Catchment-serving sites enable businesses to meet demand for home deliveries. Success is measured through driver times.
Coles fulfills online orders through their network of stores. It also has a dark store in Alexandria to manage additional online demand and support deliveries where curfews impede early morning or late evening delivery slots. Alexandria provides good coverage for the Eastern Sydney catchment.
Customer fulfillment centres can take the pressure off in-store pick ups as the number of customers engaging in online shopping increases.

42A CITY THAT DELIVERS: NSW PORTS
Figure 14 Industrial land in Auburn
Figure 15 Industrial land in Western Sydney

43A CITY THAT DELIVERS: NSW PORTS
LAND COSTS
The price of industrial land varies across Greater Sydney and pricing reflects demand. The industrial and logistics market is ‘experiencing unprecedented levels of tenant demand’’35 Occupiers are moving towards new facilities with a focus on automation and efficiencies, placing pressure on Western Sydney’s industrial land.
The current land value of Sydney’s industrial land is higher than the port cities of Melbourne and Brisbane (see Table 6). In addition, site suitability and availability is more constrained.
While industrial land in Greater Sydney is more expensive, Colliers Research explains that investors still look at the Sydney market favourably because of access to a larger consumer market and lower outbound logistics and transport costs, which can represent up to 80% of the overall supply chain cost.36
Greater Sydney has a locational advantage in that warehouses and distribution centres can service most of the East Coast. However, costs must be monitored; this advantage may be eroded as costs rise and supply chain components are lost to other port cities.
If availability, cost and location of land is not suitable, industry may change service models and/or move out of Sydney. If regional and national distribution centres relocate interstate, this would result in jobs also shifting interstate reducing job creation and growth opportunities in NSW. Decline in workforce in NSW pushes greater reliance on distribution from interstate and weakens NSW supply chain resilience.
Gross supply 2020 (sqm)
Gross supply 2021 (sqm)
Land values ($/sqm) City
Table 6 Market key indicators for industrial and logistics real estate (first half 2021)
Source: Colliers Research (2021b), Western Sydney Industrial Development Update 2021, p.4
Sydney
Melbourne
Brisbane
601,394
906,661
408,701
739,832
843,598
455,000
$806
$438
$321
35 Colliers Research (2021a), Industrial H1 2021 Research & Forecast Report, <https://www.colliers.com.au/en-au/research/industrial-h1-2021-rfr>36 ibid

44A CITY THAT DELIVERS: NSW PORTS
THE IMPLICATIONS OF A NON-COMPETITIVE PORT BOTANY
If Port Botany can no longer compete with the Port of Melbourne and Port of Brisbane, there will be challenges in terms of cost of operations, freight flows and the capacity of the whole system. This will impact the whole metropolis and the social and economic wellbeing of the people of Greater Sydney.
INDUSTRY INSIGHTS – GREATER SYDNEY’S COST COMPETITIVENESS
A summary of different factors that contribute towards the cost of doing business in Sydney. If not understood, addressed or managed, industry participants across the freight and logistics network may take different business decisions which impacts how we receive goods and the cost to customers across Greater Sydney.
• Container movement costs are high in Sydney compared to Brisbane and Melbourne, where there is more capacity for container storage near the port. Container movement costs interstate are lower due to cheaper land, closer to markets and lower delivery costs. Any national manufacturing strategy would consider choosinge Melbourne or Brisbane on a costs basis.
• Cost of land is high in Sydney and the ‘squeeze on industrial land’ west of Eastern Creek is an outcome of supply and demand factors. Rents in this area were $125/sqm 12 months ago. Today the developers/landowners not accepting anything less than $145/sqm. Rents for industrial land in Melbourne can be as low as $75/sqm.
• Road vehicles face congestion and delay due to congestion restricting truck speeds to an average of around 40-45 km/h in Sydney compared to 50-55 km/h in Melbourne and 60-65 km/h in Brisbane. Congestions add costs to trips. A truck needs to generate $100 an hour to be viable.
• Congestion on the rail network means facilities do not operate at capacity. ACFS is building the St Marys IMT, which will be the first staging point before delivery to distribution centres. Freight by rail competes with passenger rail; these limitation mean that at the most 150,000 TEU will be managed when site has capacity for 300,000 TEU.
• Other costs influence location decisions with property costs, the road network, access to labour and tolls all less expensive in other markets.
Interview with ACFS Port Logistics

45A CITY THAT DELIVERS: NSW PORTS
From our analysis, we recommend a new policy approach to guide how industrial land can be planned and managed to support an efficient and productive freight and logistics system.
Our recommendations aim to reframe the policy away from an LGA-by-LGA and site-by-site approach to a whole-of-system understanding of freight and logistics – one that appreciates the interactions between the freight and logistics system and other city systems.
This reframing acknowledges that well located and productive industrial land supports a system and sector that services all of Greater Sydney, makes a major contribution to the NSW economy, and contributes to the state’s reputation as a place to do business. A systems approach enables a greater understanding of what the implications and trade-offs are when setting land and productivity objectives.
This recommended policy approach enables:
A whole-of-system policy approach recognises that decisions made in one location can impact the broader freight and logistics system.
• understanding of the availability of suitable land across Greater Sydney and the implications of spatial substitution, such as costs and trade-offs
• optimisation of the productivity of land and transport systems
• smooth, uninterrupted freight flows to enable the freight and logistics system to operate at full capacity.
RECOMMENDATIONS FOR A NEW POLICY APPROACH
46A CITY THAT DELIVERS: NSW PORTS
1: RECOGNISE THE FUNCTION AND SIGNIFICANCE OF DIFFERENT LAND
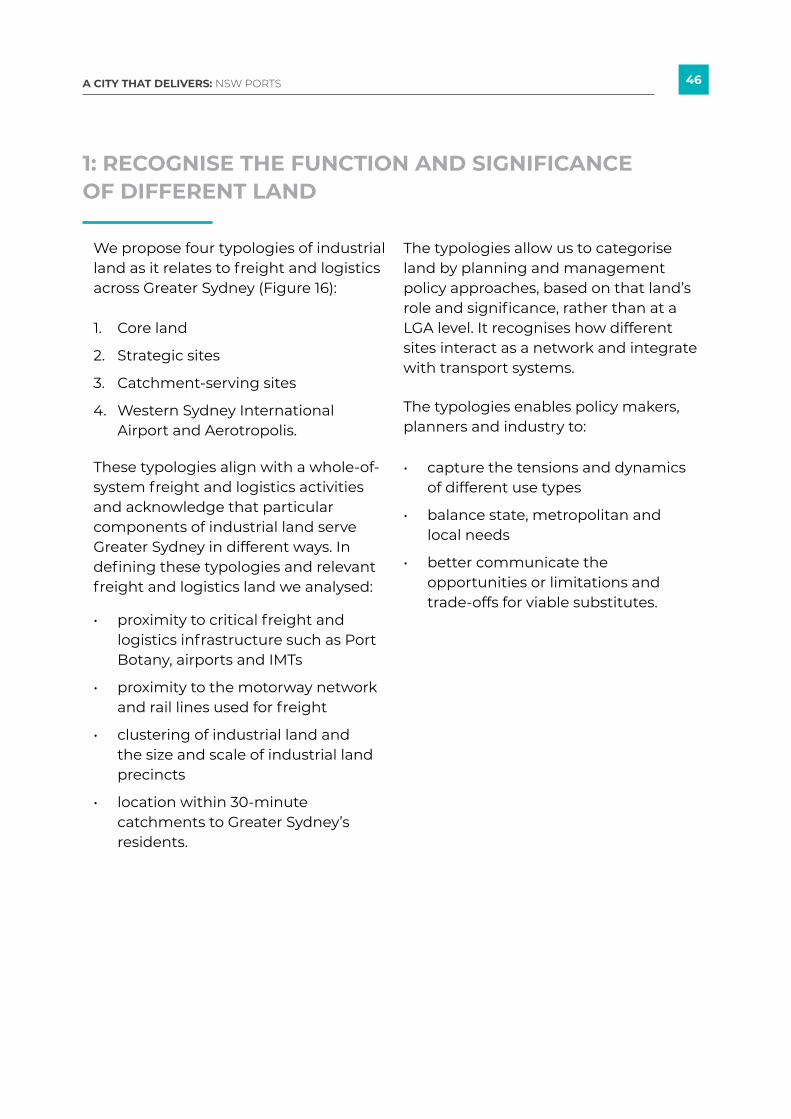
We propose four typologies of industrial land as it relates to freight and logistics across Greater Sydney (Figure 16):
These typologies align with a whole-of-system freight and logistics activities and acknowledge that particular components of industrial land serve Greater Sydney in different ways. In defining these typologies and relevant freight and logistics land we analysed:
The typologies allow us to categorise land by planning and management policy approaches, based on that land’s role and significance, rather than at a LGA level. It recognises how different sites interact as a network and integrate with transport systems.
The typologies enables policy makers, planners and industry to:
1. Core land
2. Strategic sites
3. Catchment-serving sites
4. Western Sydney International Airport and Aerotropolis.
• proximity to critical freight and logistics infrastructure such as Port Botany, airports and IMTs
• proximity to the motorway network and rail lines used for freight
• clustering of industrial land and the size and scale of industrial land precincts
• location within 30-minute catchments to Greater Sydney’s residents.
• capture the tensions and dynamics of different use types
• balance state, metropolitan and local needs
• better communicate the opportunities or limitations and trade-offs for viable substitutes.

47A CITY THAT DELIVERS: NSW PORTS
Strategic sites
Catchment-serving sites
• Located on key road and rail freight network corridors
• Proximity and access to the road and rail freight network
• Can include catchment serving sites that support local distribution
• Industrial land associated with last-mile distribution
• Typically flexible land that supports range of industrial uses
• Support efficient flows of freight and easy access to the transport network
• Support transport operations
• Provide land for distribution, warehousing and storage facilities
• Support consumers and businesses, particularly e-commerce
• Located to service 30-minute catchments
• M2 Motorway corridor
• M4 Motorway corridor
• M7 Motorway corridor
• M5 Motorway corridor
• Glenfield to Campbelltown corridor
• Brookvale
• Taren Point
• Marrickville
Functional characteristics Typology Significance Example locations
Core land • Adjacent to gateways
• Linked to Port and Airport operations
• Directly manage freight or support unique city-serving industries
• Support Port operations such as container imports, exports and storage
• Support activities that rely on proximity to the Port, such as LPG storage
• Support industries that have few opportunities for alternate locations in the city
• Port Botany and Sydney Airport precinct
• IMTs (Cooks River, Enfield, Chullora, Villawood, Yennora, Moorebank, Minto, St Marys (proposed), Mamre Road (proposed),
• Kurnell industrial area
Table 7: Four typologies of freight and logistics land

48A CITY THAT DELIVERS: NSW PORTS
Figure 16 Typologies of freight and logistics land across Greater Sydney
Western Sydney International Airport and Aerotropolis
• Land within enterprise and agribusiness zones around the Western Sydney International Airport
• Support operations at the Airport
• Provide new industrial land for distribution, warehousing and storage facilities
• Rely on extension of the freight transport network
• Mamre Road
• Northern Gateway
• Badgerys Creek
• Aerotropolis Core
Functional characteristics Typology Significance Example locations
49A CITY THAT DELIVERS: NSW PORTS
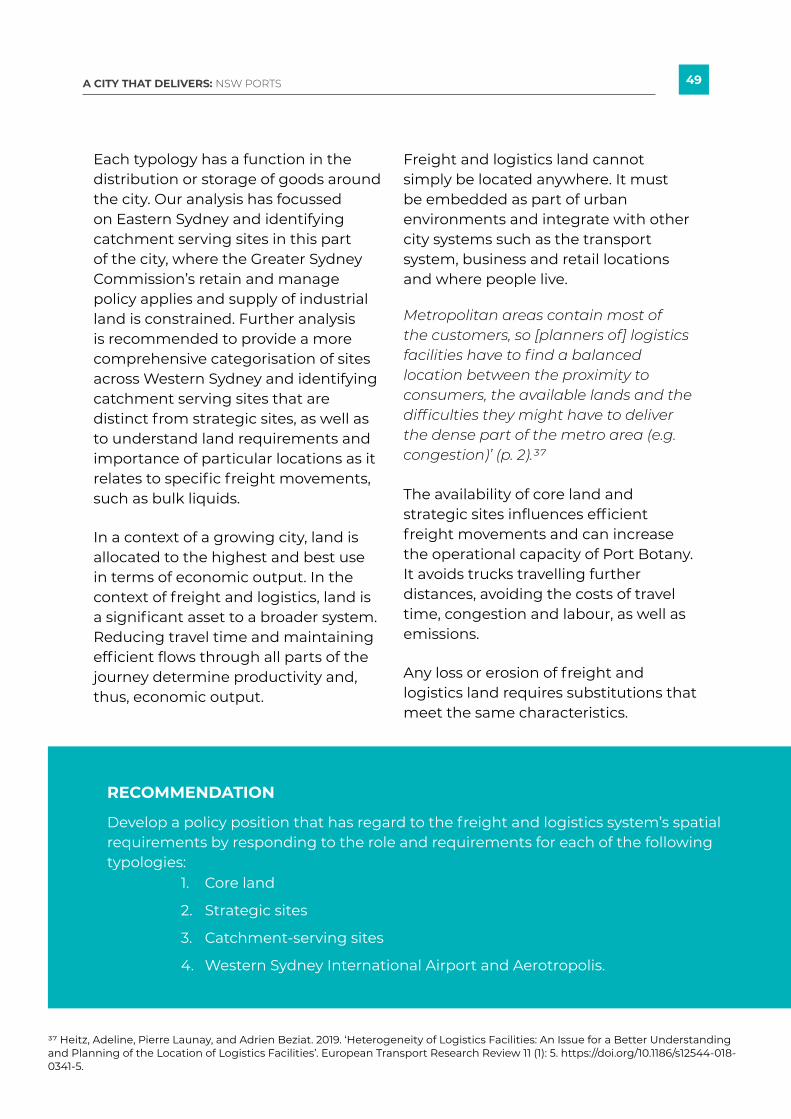
Each typology has a function in the distribution or storage of goods around the city. Our analysis has focussed on Eastern Sydney and identifying catchment serving sites in this part of the city, where the Greater Sydney Commission’s retain and manage policy applies and supply of industrial land is constrained. Further analysis is recommended to provide a more comprehensive categorisation of sites across Western Sydney and identifying catchment serving sites that are distinct from strategic sites, as well as to understand land requirements and importance of particular locations as it relates to specific freight movements, such as bulk liquids.
In a context of a growing city, land is allocated to the highest and best use in terms of economic output. In the context of freight and logistics, land is a significant asset to a broader system. Reducing travel time and maintaining efficient flows through all parts of the journey determine productivity and, thus, economic output.
Metropolitan areas contain most of the customers, so [planners of] logistics facilities have to find a balanced location between the proximity to consumers, the available lands and the difficulties they might have to deliver the dense part of the metro area (e.g. congestion)’ (p. 2).37
Freight and logistics land cannot simply be located anywhere. It must be embedded as part of urban environments and integrate with other city systems such as the transport system, business and retail locations and where people live.
The availability of core land and strategic sites influences efficient freight movements and can increase the operational capacity of Port Botany. It avoids trucks travelling further distances, avoiding the costs of travel time, congestion and labour, as well as emissions.
Any loss or erosion of freight and logistics land requires substitutions that meet the same characteristics.
RECOMMENDATION
Develop a policy position that has regard to the freight and logistics system’s spatial requirements by responding to the role and requirements for each of the following typologies:
1. Core land
2. Strategic sites
3. Catchment-serving sites
4. Western Sydney International Airport and Aerotropolis.
37 Heitz, Adeline, Pierre Launay, and Adrien Beziat. 2019. ‘Heterogeneity of Logistics Facilities: An Issue for a Better Understanding and Planning of the Location of Logistics Facilities’. European Transport Research Review 11 (1): 5. https://doi.org/10.1186/s12544-018-0341-5.

50A CITY THAT DELIVERS: NSW PORTS
2: DEVELOP EFFECTIVE TOOLS TO SUPPORT DECISION-MAKING
Understanding the costs and benefits in relation to the policy approach to planning and managing industrial land and the implications of alternate approaches is important, supporting decisions that maximise benefits to NSW and the people of Greater Sydney.
Costs and benefits can refer to the many different social, economic and environmental impacts generated through freight and logistics activities and because of how freight and logistics activities operate.
The four typologies help to illustrate the relationship between the freight transport network and land use. The location of freight and logistics land determines the size and location of catchments serviced. In the context of
Each movement in the freight supply chain and point of handling creates a cost, which is ultimately borne by customers. Costs increase when additional movements are needed – for example, when goods are transported to Western Sydney before being delivered in Eastern Sydney.
Once a container is offloaded and ready for collection, the cost of distributing freight from Port Botany includes:
• rent on the warehousing site, or opportunity foregone of the land value
• standard costs per vehicle hour to freight the container to its intermodal destination (including externalities)
• standard cost per vehicle hour of unpacked freight to final customer
• cost of labour (truck drivers, handlers)
• cost of returning the container to the Port.
a growing city, and particularly with the pressures of urban development encroaching on industrial land in Eastern Sydney, the implications of losing that land or shifting westward need to be understood in the context of broader productivity impacts to the freight and logistics system and the people of Greater Sydney.
The analysis presented in this section focusses on the movement costs of freight and illustrating the impacts of displacement of industrial land or substitution with land in other locations.
DISPLACING OR SUBSTITUTING FREIGHT AND LOGISTICS LAND

51A CITY THAT DELIVERS: NSW PORTS
Some broader or indirect costs and benefits may not be experienced at a site level yet do impinge on productivity and on society. They include:
The analysis presented in this section has not considered all of these broader and indirect costs and benefits as it is illustrative of the core direct costs associated with the movement of freight.
Limited industrial land capacity in Eastern Sydney and relocation westward – or site substitution - means freight has further to go to reach its final customer. Our modelling shows that when a warehouse moves further from the customer, the number and length of trips in the freight chain get longer, and the cost of freight gets more expensive which increases costs as more vehicle hours are required to distribute the freight.
• Location and agglomeration of freight and logistics land, which impacts on the scale and efficiency of operations across the system.
• Supply chain efficiencies are generated by streamlining the number of staging or handling points in a freight flow. Increasing the number of movements, locations and handling of freight increases costs.
• Efficient operation of freight and logistics land and facilities influenced by planning controls that can limit or restrict the operational capacity of a site with up-stream and down-stream implications on the supply chain.
• Delays and productivity losses when businesses wait for capital equipment, or when people have to wait for an item to be delivered. This could amount to a large amount of money (possibly even greater than the increased transport costs) or a loss of enjoyment; either way, measuring these costs are challenging.
• Road safety measures required to manage the risk of fatalities when freight traffic is mixed with general traffic and high pedestrian areas. Road regulation delegates specific routes for heavy vehicles; however, incentives and disincentives do not move all freight traffic onto more efficient and safer toll roads (avoiding tolls may or may not be offset by longer journey times). The longer a truck is on the road, and the more kilometres travelled on local roads, the higher the likelihood is of a collision involving a truck.
• Congestion can increase when there are more trucks on the road and travelling longer distances. Customers are indirectly impacted if their delivery is delayed by congestion.
• Environmental impacts are experienced by society through air pollution, greenhouse gas emissions, noise, water pollution, the impact of road transport on nature, the landscape and acting as barriers impacting on connection and urban amenity.
52A CITY THAT DELIVERS: NSW PORTS
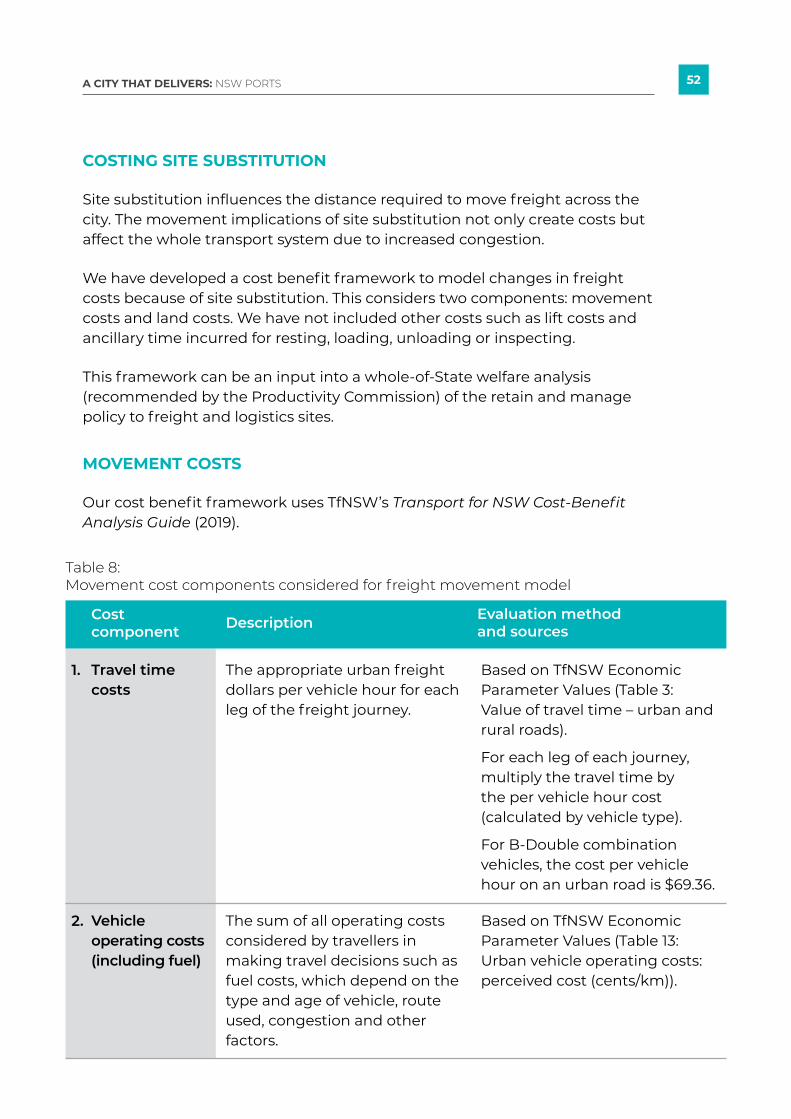
Site substitution influences the distance required to move freight across the city. The movement implications of site substitution not only create costs but affect the whole transport system due to increased congestion.
We have developed a cost benefit framework to model changes in freight costs because of site substitution. This considers two components: movement costs and land costs. We have not included other costs such as lift costs and ancillary time incurred for resting, loading, unloading or inspecting.
This framework can be an input into a whole-of-State welfare analysis (recommended by the Productivity Commission) of the retain and manage policy to freight and logistics sites.
Our cost benefit framework uses TfNSW’s Transport for NSW Cost-Benefit Analysis Guide (2019).
COSTING SITE SUBSTITUTION
MOVEMENT COSTS
Travel time costs
Vehicle operating costs (including fuel)
The appropriate urban freight dollars per vehicle hour for each leg of the freight journey.
The sum of all operating costs considered by travellers in making travel decisions such as fuel costs, which depend on the type and age of vehicle, route used, congestion and other factors.
Based on TfNSW Economic Parameter Values (Table 3: Value of travel time – urban and rural roads).
For each leg of each journey, multiply the travel time by the per vehicle hour cost (calculated by vehicle type).
For B-Double combination vehicles, the cost per vehicle hour on an urban road is $69.36.
Based on TfNSW Economic Parameter Values (Table 13: Urban vehicle operating costs: perceived cost (cents/km)).
Description Cost component
Evaluation method and sources
Table 8: Movement cost components considered for freight movement model
1.
2.

53A CITY THAT DELIVERS: NSW PORTS
Congestion costs
Tolls
Externalities
Costs associated with road congestion. Not paid by the transport company (except where longer trips add to the cost of travel time and wages) but borne by society and other road users and indirectly by customer who experience delays.
Charges relevant to freight destination. Toll charges vary based on site location and access roads used.
Including air pollution, greenhouse gas emissions, noise, water pollution, the impact of road transport on nature, the landscape and acting as barriers impacting on connection and urban amenity, and upstream and downstream costs.
Based on TfNSW Economic Parameter Values (Table 20: Marginal road congestion cost in Sydney). Congestion is costed as cents per vehicles per kilometre travelled (VKT), multiplied by the passenger car equivalent (PCE). The PCE of an articulated truck is the five passenger vehicles.
Toll charges based on roads accessed for the freight journey by vehicle class (effective 1 July 2021).38
Based on TfNSW Economic Parameter Values (Table 39: Externality unit costs for freight vehicles – urban). Externalities are costed at cents per VKT multiplied by kilometres travelled.
Externality unit costs are available for light commercial, rigid and articulated trucks.
Note the move towards heavier, high productivity vehicles that reduce costs to the operator can generate higher maintenance and externalities costs for Government and the community.
Description Cost component
Evaluation method and sources
3.
4.
5.
38 Transport for NSW (2021) ‘Toll charges – costs by toll road’, <https://roads-waterways.transport.nsw.gov.au/sydney-motorways/toll-charges/index.html> (accessed 26/07/2021)
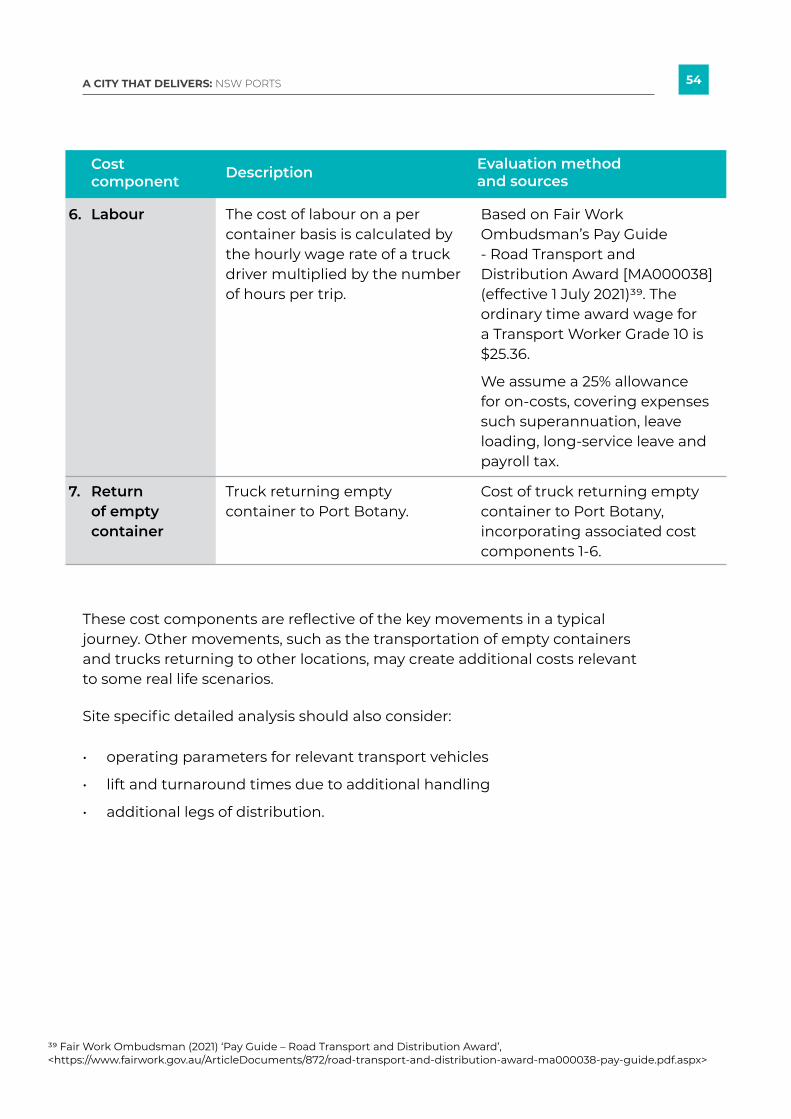
54A CITY THAT DELIVERS: NSW PORTS
Labour
Return of empty container
The cost of labour on a per container basis is calculated by the hourly wage rate of a truck driver multiplied by the number of hours per trip.
Truck returning empty container to Port Botany.
Based on Fair Work Ombudsman’s Pay Guide - Road Transport and Distribution Award [MA000038] (effective 1 July 2021)39. The ordinary time award wage for a Transport Worker Grade 10 is $25.36.
We assume a 25% allowance for on-costs, covering expenses such superannuation, leave loading, long-service leave and payroll tax.
Cost of truck returning empty container to Port Botany, incorporating associated cost components 1-6.
Description Cost component
Evaluation method and sources
6.
7.
39 Fair Work Ombudsman (2021) ‘Pay Guide – Road Transport and Distribution Award’, <https://www.fairwork.gov.au/ArticleDocuments/872/road-transport-and-distribution-award-ma000038-pay-guide.pdf.aspx>
Site specific detailed analysis should also consider:
• operating parameters for relevant transport vehicles
• lift and turnaround times due to additional handling
• additional legs of distribution.
These cost components are reflective of the key movements in a typical journey. Other movements, such as the transportation of empty containers and trucks returning to other locations, may create additional costs relevant to some real life scenarios.

55A CITY THAT DELIVERS: NSW PORTS
This example of freight movement from Port Botany to Alexandria40 uses scenarios based on the availability of local freight and logistics land. The scenarios assume a freight and logistics depot located at Port Botany, meaning all journeys start and end from the Port Botany precinct. If the depot is further from the Port then increased travel time and distance will increase costs.
The example is based on a simple model of one container unstuffed and distributed to one location in Alexandria. This is indicative for final distribution to areas serviced by the Alexandria population serving catchment. It is a simplified and illustrative way to explain how additional freight movements generate greater costs and the cost impacts of decisions where industrial land in the east is displaced further west or substituted for other land uses.
The base case assumes the container goes directly from Port Botany to the Alexandria unstuffing and further distribution. Here, the assumption on distance from Port Botany to Alexandria is 8.8 kilometres, with an assumption this will take 15 minutes.
WORKED EXAMPLE OF MOVEMENT COSTS: ALEXANDRIA
BASE CASE: PORT BOTANY DIRECT TO ALEXANDRIA
40 This worked example only considers road-based freight transport with one container per vehicle. If substitution involved rail freight movement, this should be considered in a rail context. Variables include train length, economic life, number of TEU slots and track access charges. Sites with road and rail access should also consider rail substitution impacts.
Cost ($ AUD) Cost component
Table 9: Base case movement costs
Travel time costs
Vehicle operating cost
Congestion
Tolls
Externalities
Labour
Return of empty container (from Alexandria to Port Botany)
Total travel cost (per vehicle per container)
17.45
12.74
19.75
0
3.50
7.97
61.41
122.82
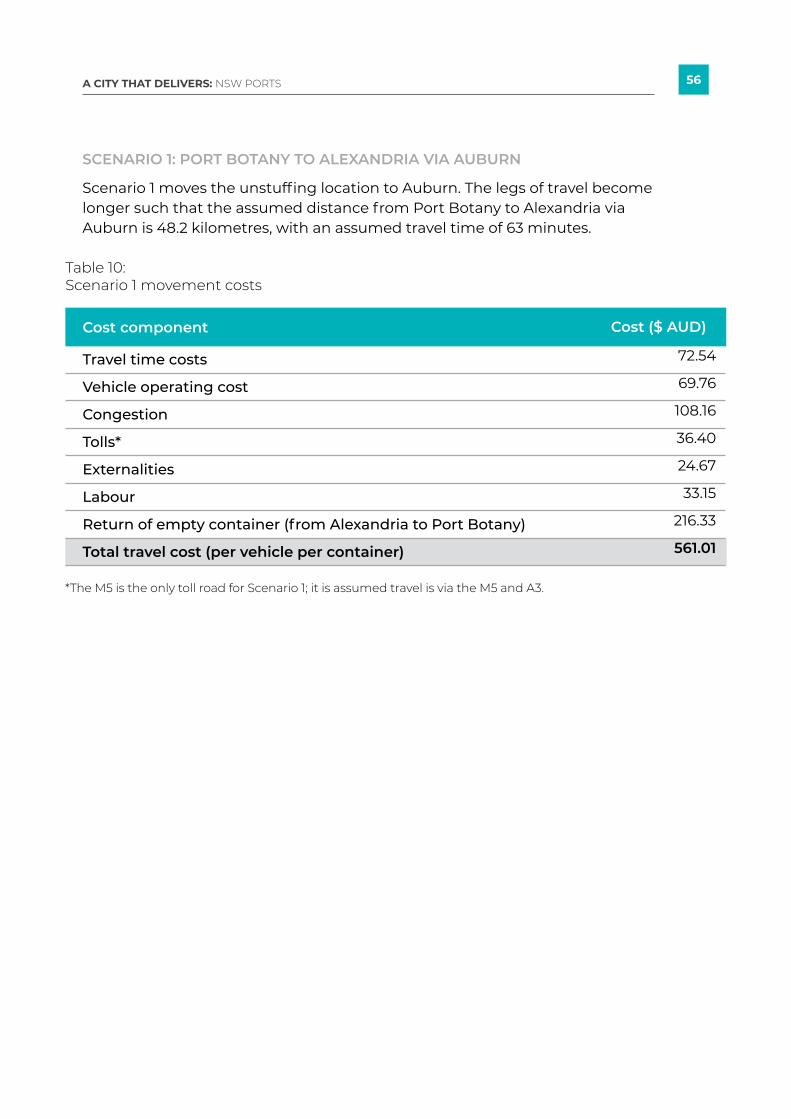
56A CITY THAT DELIVERS: NSW PORTS
Scenario 1 moves the unstuffing location to Auburn. The legs of travel become longer such that the assumed distance from Port Botany to Alexandria via Auburn is 48.2 kilometres, with an assumed travel time of 63 minutes.
SCENARIO 1: PORT BOTANY TO ALEXANDRIA VIA AUBURN
Cost ($ AUD) Cost component
Table 10: Scenario 1 movement costs
*The M5 is the only toll road for Scenario 1; it is assumed travel is via the M5 and A3.
72.54
69.76
108.16
36.40
24.67
33.15
216.33
561.01
Travel time costs
Vehicle operating cost
Congestion
Tolls*
Externalities
Labour
Return of empty container (from Alexandria to Port Botany)
Total travel cost (per vehicle per container)
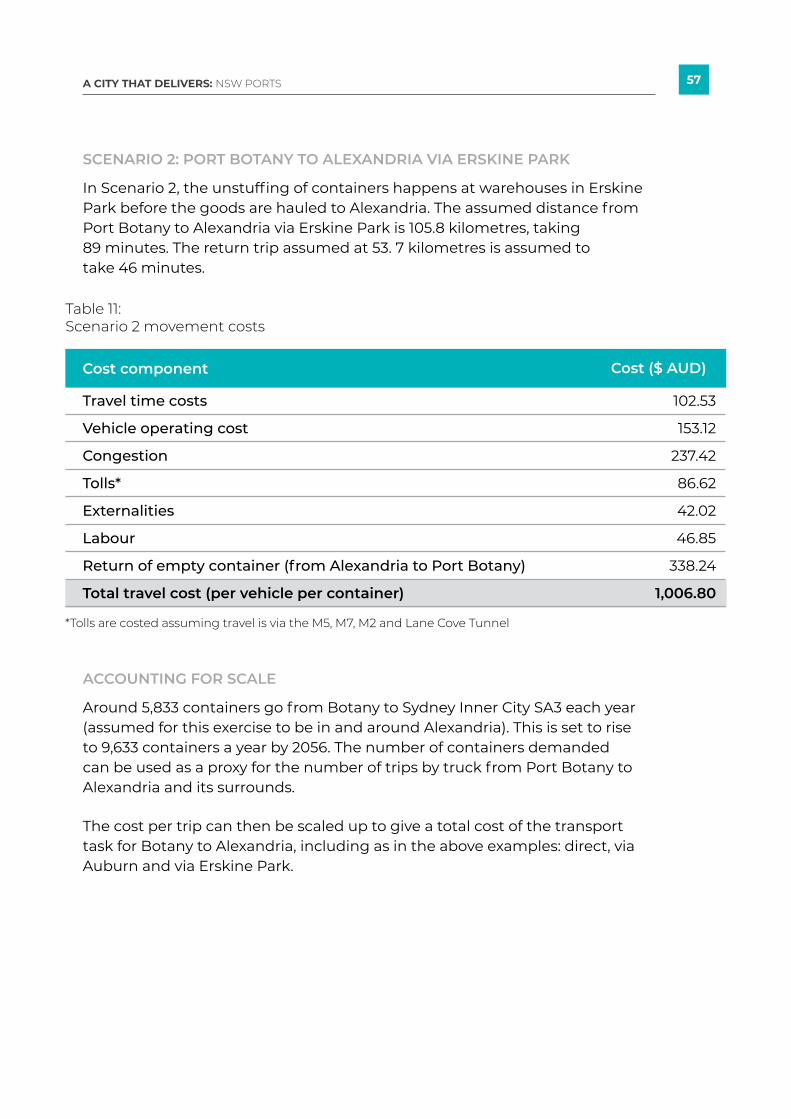
57A CITY THAT DELIVERS: NSW PORTS
In Scenario 2, the unstuffing of containers happens at warehouses in Erskine Park before the goods are hauled to Alexandria. The assumed distance from Port Botany to Alexandria via Erskine Park is 105.8 kilometres, taking 89 minutes. The return trip assumed at 53. 7 kilometres is assumed to take 46 minutes.
Around 5,833 containers go from Botany to Sydney Inner City SA3 each year (assumed for this exercise to be in and around Alexandria). This is set to rise to 9,633 containers a year by 2056. The number of containers demanded can be used as a proxy for the number of trips by truck from Port Botany to Alexandria and its surrounds.
The cost per trip can then be scaled up to give a total cost of the transport task for Botany to Alexandria, including as in the above examples: direct, via Auburn and via Erskine Park.
SCENARIO 2: PORT BOTANY TO ALEXANDRIA VIA ERSKINE PARK
ACCOUNTING FOR SCALE
Cost ($ AUD) Cost component
Table 11: Scenario 2 movement costs
*Tolls are costed assuming travel is via the M5, M7, M2 and Lane Cove Tunnel
102.53
153.12
237.42
86.62
42.02
46.85
338.24
1,006.80
Travel time costs
Vehicle operating cost
Congestion
Tolls*
Externalities
Labour
Return of empty container (from Alexandria to Port Botany)
Total travel cost (per vehicle per container)
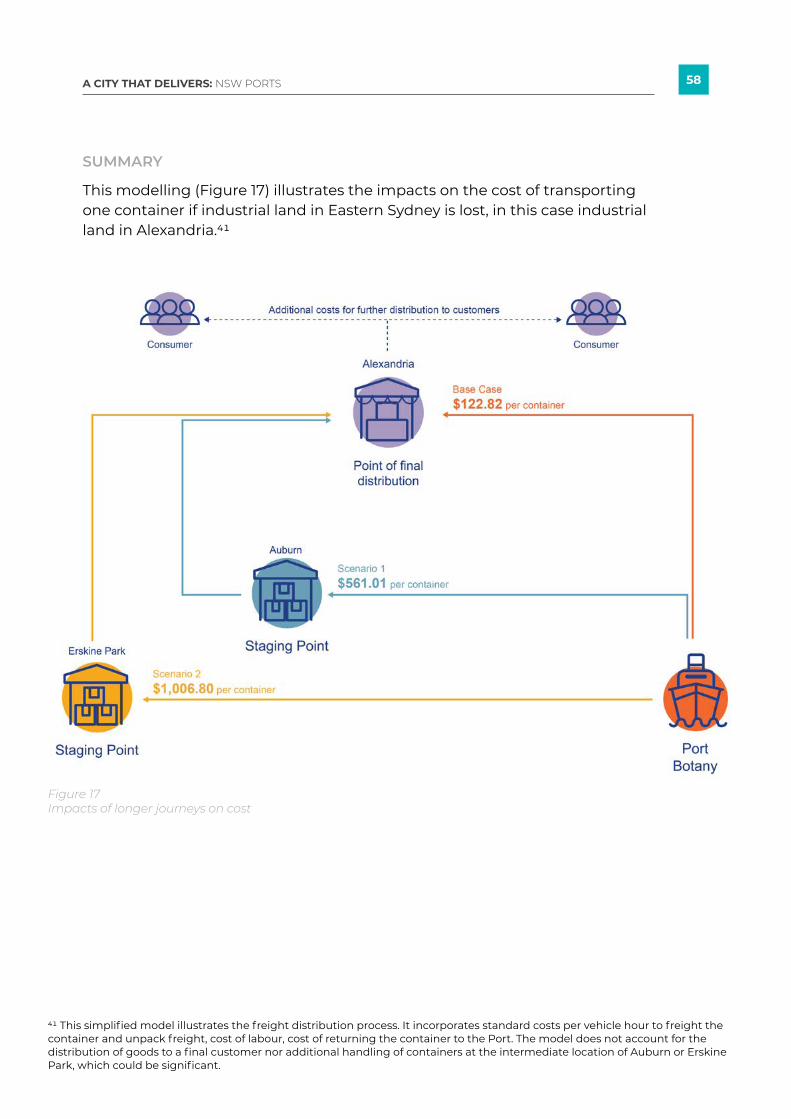
58A CITY THAT DELIVERS: NSW PORTS
This modelling (Figure 17) illustrates the impacts on the cost of transporting one container if industrial land in Eastern Sydney is lost, in this case industrial land in Alexandria.41
SUMMARY
41 This simplified model illustrates the freight distribution process. It incorporates standard costs per vehicle hour to freight the container and unpack freight, cost of labour, cost of returning the container to the Port. The model does not account for the distribution of goods to a final customer nor additional handling of containers at the intermediate location of Auburn or Erskine Park, which could be significant.
Figure 17 Impacts of longer journeys on cost

59A CITY THAT DELIVERS: NSW PORTS
This example is for the transport of just one container. Across the whole supply chain, this could number in the millions of dollars each year and add to the cost of goods to customers across Sydney. In addition, modelling illustrates a simplified journey. In reality, one container of goods will likely be transported by multiple trucks after unpacking. This would increase costs further, reflecting the multiple vehicles required to transport one container.
Change in land use for industrial land to accommodate other land uses such as residential development is a one-off event. However the implications of this one event would be ongoing for the freight and logistics system with costs of additional movements and handling scaling over time and with increasing volumes of freight. Cost benefit analysis needs to consider ongoing costs with scenario and sensitivity analysis.
When a warehouse moves to Erskine Park (or Auburn), it may have larger floorplates, may be closer to a larger Western Sydney population and face lower rents. However, goods are being distributed to the northern or eastern suburbs, distance-related costs represent a significant component of the total freight costs and may not be offset by lower rent.
Cost Scenario Description
Table 12 Alternative freight scenarios and impacts on cost
Base case: Direct journey Port Botany to Alexandria
Scenario 1: Port Botany to Alexandria via Auburn
Scenario 2: Port Botany to Alexandria via Erskine Park
Container goes from Port Botany to the Alexandria for unstuffing and further distribution.
Unstuffing location is moved to Auburn, and goods destined for Alexandria now travel via Auburn rather than direct.
Unstuffing happens at Erskine Park before the goods are hauled to Alexandria.
$122.82
$561.01 - a 357% increase on the base case.
$1,006.80 - a 720% increase on the base case.

60A CITY THAT DELIVERS: NSW PORTS
Land costs associated with site substitution consider the supply and demand factors for container activity, which can impact how a growing population will be serviced by the freight and logistics network, given projected increases in Port trade volumes.
Land costs should assess four components:
An indicative model for land costs includes local supply and demand factors. Detailed analysis is required to assess the effect of site substitution in terms of factors such as:
Market prices can be accessed from a variety of sources. For example, SGS Economics & Planning’s Employment Lands Database (2018) is a useful proxy for average precinct land value. As an immediate action this database should be updated to 2021 values to reflect changes in market pricing.
LAND COSTS
1. Current valuation and pricing of freight and logistics subject site
2. Current valuation and pricing of alternate site west of subject site42
3. Expected future valuation of change in use on subject site43
4. Whether a change in land use in one site can impact the productivity of adjacent sites for freight and logistics purposes (e.g. the imposition of curfews).
• zoning
• planning controls
• lot size
• site physical constraints
42 Assumes that a suitable site is available in another submarket.43 This should have regard to either a change of use under existing controls or a change of planning controls that may require additional Government investment such as infrastructure and/or services.
• encroachment and curfews
• access
• catchments.
RECOMMENDATION
Adopt a cost benefit analysis framework that appreciates the parameters of the freight and logistics system.
Consider variables to determine the increase in freight costs for a change in the distance that goods have to travel if land for population-serving warehousing and distribution is further from customers.
Use the cost benefit analysis framework to assess the availability of viable substitutions or additional land supply for each typology of freight and logistics land.

61A CITY THAT DELIVERS: NSW PORTS
Unlike other classes of infrastructure, Sydney’s port is limited to one location – Port Botany. As a result, the stakeholders that rely on proximity to the Port and support operations also cannot be shifted elsewhere; the footprint of core land needs to reflect this relationship and the significance of proximity and efficient utilisation of land for productivity in the freight and logistics system.
Land for freight and logistics activities and road space is highly contested around Port Botany, which limits efficient operations for stakeholders that rely on co-location to the Port. This also considers the operations of third parties so that Port throughput can be maintained.
CORE LAND IN AND AROUND PORT BOTANY
3: ENABLE ADDITIONAL LAND TO BE MADE AVAILABLE WITHIN CORE AREAS
Freight and logistics land around Port Botany provides space for activities that are critical for port operations. This includes land for container storage as well as road and rail space that enable a high volume of vehicles to access the Port every day.
State Environmental Planning Policy (Three Ports) 2013 (Three Ports SEPP) sets a land use planning and assessment framework for land within and immediately adjacent to Port Botany and provides protections to support the operation of the Port. However, sites and movement corridors beyond what is protected under the Three Ports SEPP need to be considered in context of supporting Port operations. This includes Cooks Cove, Port Botany Golf Club and Port Botany bus depot, which are sites that are being considered for alternate land uses and activities.
With forecast growth, we need to optimise the freight and logistics system – particularly the core land around Port Botany where industry is already experiencing limited supply of land, congestion, curfews and restrictions such as on the movement of heavy vehicles. These limitations also restrict the efficient operation of IMTs.
Protecting existing industrial land supply, including securing large sites with adequate footprint that enable development of freight and logistics facilities, infrastructure and support efficient operations, and identifying opportunities for increasing supply of appropriately sized and located land is critical.

62A CITY THAT DELIVERS: NSW PORTS
The increase in residential development and location of industrial and retail activity around Port Botany is impacting on freight and logistics operations. With more residential and passenger vehicles using the road network around Port Botany, freight and logistics operators are being restricted in the roads they can use which impacts on travel times and access along key routes freight vehicles are dependent on.
When any new sites become available around Port Botany, their viability for freight and logistics activities must be adequately considered alongside other forms of development. For example, the Cooks Cove Precinct immediately west of Sydney Airport is being considered for development; the suitability of this site for freight and logistics uses would generate far greater productivity benefits for the community compared to other uses.
This consideration extends to other potential development sites such as Port Botany bus depot and Botany Golf Club. The whole-of-system – and whole-of-State – benefits generated for freight and logistics and the benefits of relocating previous users of the site to locations that better serve the community need to be considered at a strategic planning level.
INDUSTRY INSIGHTS – VOPAK AUSTRALIA
Vopak Australia is part of Royal Vopak, an international bulk liquid storage and handling provider. Vopak provides critical infrastructure and bulk liquids through three tank terminal facilities in Australia: two at Port Botany and one in Darwin.
Vopak cannot relocate away from the Port given the infrastructure designed and constructed once a tank terminal facility is in place. Any curfews and restrictions impact its operations and the viability of these operations.
Operators like Vopak should be valued and considered as infrastructure assets that are crucial for Greater Sydney.
Continued curfews on industrial land around Port Botany restrict and limit critical operations, meaning the Port is not operating at capacity. If the environment around the Port reduces the viability of operations, customers may choose to stop importing at that location. This directly impacts companies such as Vopak that provide the goods that the people of Greater Sydney need.
Interview with Vopak Australia

63A CITY THAT DELIVERS: NSW PORTS
INDUSTRY INSIGHTS – INDUSTRY SHIFT TO RENEW ASSETS AND DEVELOP HIGH BAY WAREHOUSING
High bay warehousing is designed to be fully automated, enabling high density storage with high shelving. The Building Business Back Better policy paper recognises the role and increasing need for high bay warehousing and proposes planning controls to better support this development.
Large supermarkets are already responding to customer demand by building large scale distribution centres on the East Coast (Table 12). In June 2021 Woolworths announced a fresh food distribution centre at Wetherill Park and a liquor distribution centre at Kemps Creek.45 ALDI has announced plans for three automated distribution centres in Sydney, Melbourne and Brisbane, replacing six existing warehouses46 across these cities.
In addition to protecting core land from erosion and limiting capacity to operate, we need a policy response that anticipates the needs of the industry to design and develop sites that are – and will be – fit-for-purpose, to enable greater utilisation of available land.
Land should not be fragmented, nor subject to onerous curfews, operating conditions and restrictions or encroachment in favour for urban development. This approach ignores the operational environment of critical infrastructure and surrounding core land around IMTs.
High bay warehousing should be viable near the Port; however, subdivision patterns and fragmentation impact the ability for the market to make these investments. The Department of Planning, Industry and Environment’s Explanation of Intended Effect for changing code assessments for warehousing acknowledges an increasing need for high bay warehouses as high as 45 metres in certain sectors.44
Already, we see evidence that the market is repurposing land for freight and logistics uses in Auburn and Lidcombe. With the right planning controls we expect to see more of these moves from Eastern Sydney towards GPOP.
POLICY RESPONSES FOR FORECAST CHANGES
44 NSW Department of Planning, Industry and Environment (2021), Building Business Back Better: Explanation of Intended Effect, <https://bit.ly/3m0BYqq> (accessed 26/07/2021)45 Woolworths Group (2021), ‘Woolworths Group to build two new Sydney distribution centres to support ongoing growth’, < https://bit.ly/37DpEnx> (accessed 14/07/2021)46 Johanson, S. & Powell, D. (2021) ‘Aldi scraps big sheds, opens high-tech distribution hubs’, The Sydney Morning Herald, 10 July 2021, <https://bit.ly/37IoaIsl> (accessed 14/07/2021)
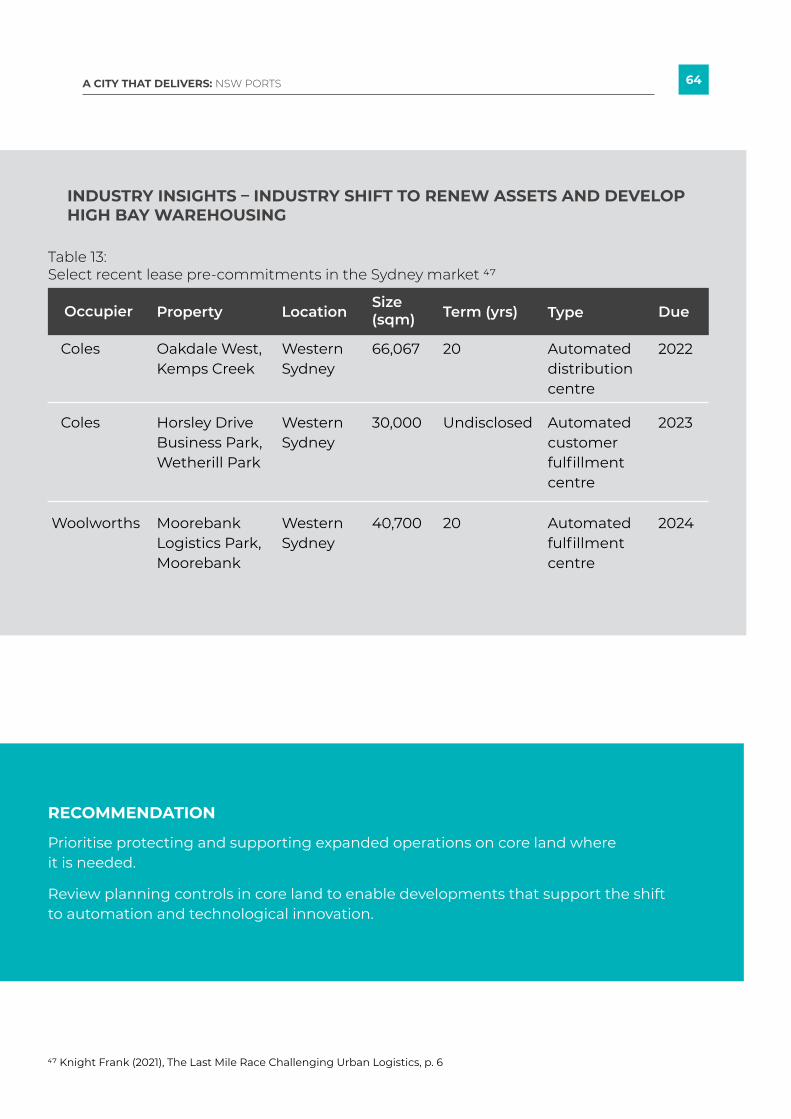
64A CITY THAT DELIVERS: NSW PORTS
INDUSTRY INSIGHTS – INDUSTRY SHIFT TO RENEW ASSETS AND DEVELOP HIGH BAY WAREHOUSING
Property LocationSize (sqm) Term (yrs) Type DueOccupier
Table 13: Select recent lease pre-commitments in the Sydney market 47
Coles
Coles
Woolworths
Oakdale West, Kemps Creek
Horsley Drive Business Park, Wetherill Park
Moorebank Logistics Park, Moorebank
Western Sydney
Western Sydney
Western Sydney
Automated distribution centre
Automated customer fulfillment centre
Automated fulfillment centre
20
Undisclosed
20
2022
2023
2024
66,067
30,000
40,700
RECOMMENDATION
Prioritise protecting and supporting expanded operations on core land where it is needed.
Review planning controls in core land to enable developments that support the shift to automation and technological innovation.
47 Knight Frank (2021), The Last Mile Race Challenging Urban Logistics, p. 6

65A CITY THAT DELIVERS: NSW PORTS
4. IMPROVE THE PERFORMANCE OF EXISTING LAND
With limited additional land supply in Eastern Sydney, we need to put policies in place to optimise this land to support the growing freight task and landside requirements. This requires us to think beyond changes in zoning. Subdivision and encroachment by other employment and non-employment
uses, such as residential development, limit site performance and the ability for it to be modified to improve utilisation and performance.
Trade-offs can enable a mix of uses to operate side by side.
The current performance measure for industrial land - employment density – is articulated in the Greater Sydney Region Plan and some Council employment studies. This suggests that the productivity of industrial land is linked to how many jobs is supported on a site, prompting a preference for development and activities that directly employ more people rather potential development that will make a significant impact on broader metropolitan economic output.
Maintaining appropriate industrial land supply is not about a single issue of maintaining employment opportunities in local areas. Industrial land, in the right locations, is a metropolitan issue that has implications for Greater Sydney’s productivity and competitiveness and, in turn, the costs for citizens in accessing goods.
PRODUCTIVITY MEASUREMENTS

66A CITY THAT DELIVERS: NSW PORTS
Efforts to protect other land uses from freight and logistics activities impacts freight flows and links in the supply chain, which erodes the overall efficiency and productivity of the city’s freight and logistics system.
Wherever there is a point of friction in freight flows this impacts costs. Friction can be in the form of:
CURFEWS AND RESTRICTIONS
• curfews on site operation hours, noise restrictions or site lighting, which can add time to a trip when there is delay in the ability to access or leave a site
• operational restrictions that limit the ability to use certain areas of a site or caps the number of vehicles or personnel on site can add costs and limit the operational capacity and productivity of a site
• road regulations that limit the routes heavy vehicles can use, which can add time to a trip and/or result in congested roads through the funnelling of trucks through particular thoroughfares.
INDUSTRY INSIGHTS – REZONING OF INDUSTRIAL LAND
There are existing industrial sites with good access to major motorways and arterial roads, such as Lidcombe in Parramatta, located within or in close proximity of land that has been rezoned for residential or mixed use development.
In one example, a retailer required 24/7 access from an existing industrial site to facilitate operations. While this is usually allowable in industrial zones, conditions of development consent set a time limit for the 24/7 operations, due to the expected development of residential uses in the coming years.
Limitations and restrictions on sites such as these impact efficient operations and reduce the capacity required to support upstream and downstream freight flows.

67A CITY THAT DELIVERS: NSW PORTS
RECOMMENDATION
Take a whole-of-system view to improve the performance of existing industrial land and steer away from creating site-specific controls that generate system-scale impacts on productivity.
Partner across State agencies and with industry to consider reforms needed to better measure productivity of sites and support performance.

68A CITY THAT DELIVERS: NSW PORTS
Our extensive research, spatial and economic analysis, and interviews with key players operating across the freight and logistics system provides an evidence base that informs our recommendations:
Productive freight and logistics land relies on broader transport policy, regulation and support for the sector to enable efficiency across the system and realisation of full value of the sector to Greater Sydney and NSW.
In addition to its contributions to the Industrial Land Policy Review, NSW Ports should advocate to organisations like the NSW Productivity Commission to consider the productivity of the freight and logistics system through a whole-of-system lens.
A comprehensive whole-of-system approach can unlock broader value from a productive freight and logistics system. This will contribute to the wellbeing to all people and businesses in Greater Sydney and NSW.
CONCLUSION
1. Adopt the recommended typologies for freight and logistics land that recognise the function and significance of different land.
2. Develop effective tools to support decision-making, recognise the broader productivity costs and benefits of freight movements and evaluate decisions that either displace or substitute industrial land.
3. Enable additional land capacity within core freight and logistics areas such as Port Botany and IMTs.
4. Optimise the performance of freight and logistics land.