Embed Size (px)
Citation preview
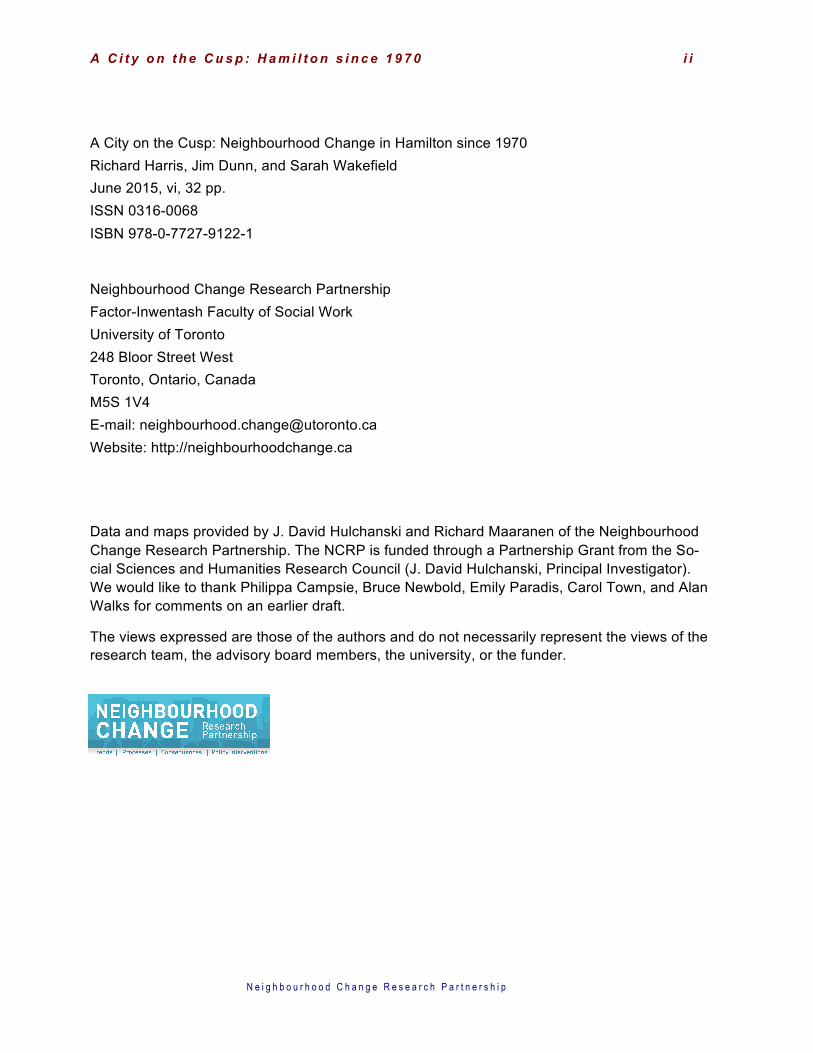
A City on the Cusp: Neighbourhood Change in
Hamilton since 1970
Richard Harris Jim Dunn
Sarah Wakefield
Research Paper 236
June 2015
Funded by the Social Sciences and Humanities Research Council of Canada
through the Neighbourhood Change Research Partnership
www.neighbourhoodchange.ca
ISSN 0316-0068; ISBN 978-0-7727-9122-1
A C i t y o n t h e C u s p : H a m i l t o n s i n c e 1 9 7 0 i i
N e i g h b o u r h o o d C h a n g e R e s e a r c h P a r t n e r s h i p
A City on the Cusp: Neighbourhood Change in Hamilton since 1970 Richard Harris, Jim Dunn, and Sarah Wakefield June 2015, vi, 32 pp. ISSN 0316-0068 ISBN 978-0-7727-9122-1
Neighbourhood Change Research Partnership Factor-Inwentash Faculty of Social Work University of Toronto 248 Bloor Street West Toronto, Ontario, Canada M5S 1V4 E-mail: [email protected] Website: http://neighbourhoodchange.ca
Data and maps provided by J. David Hulchanski and Richard Maaranen of the Neighbourhood Change Research Partnership. The NCRP is funded through a Partnership Grant from the So-cial Sciences and Humanities Research Council (J. David Hulchanski, Principal Investigator). We would like to thank Philippa Campsie, Bruce Newbold, Emily Paradis, Carol Town, and Alan Walks for comments on an earlier draft.
The views expressed are those of the authors and do not necessarily represent the views of the research team, the advisory board members, the university, or the funder.
i i i A C i t y o n t h e C u s p : H a m i l t o n s i n c e 1 9 7 0
N e i g h b o u r h o o d C h a n g e R e s e a r c h P a r t n e r s h i p
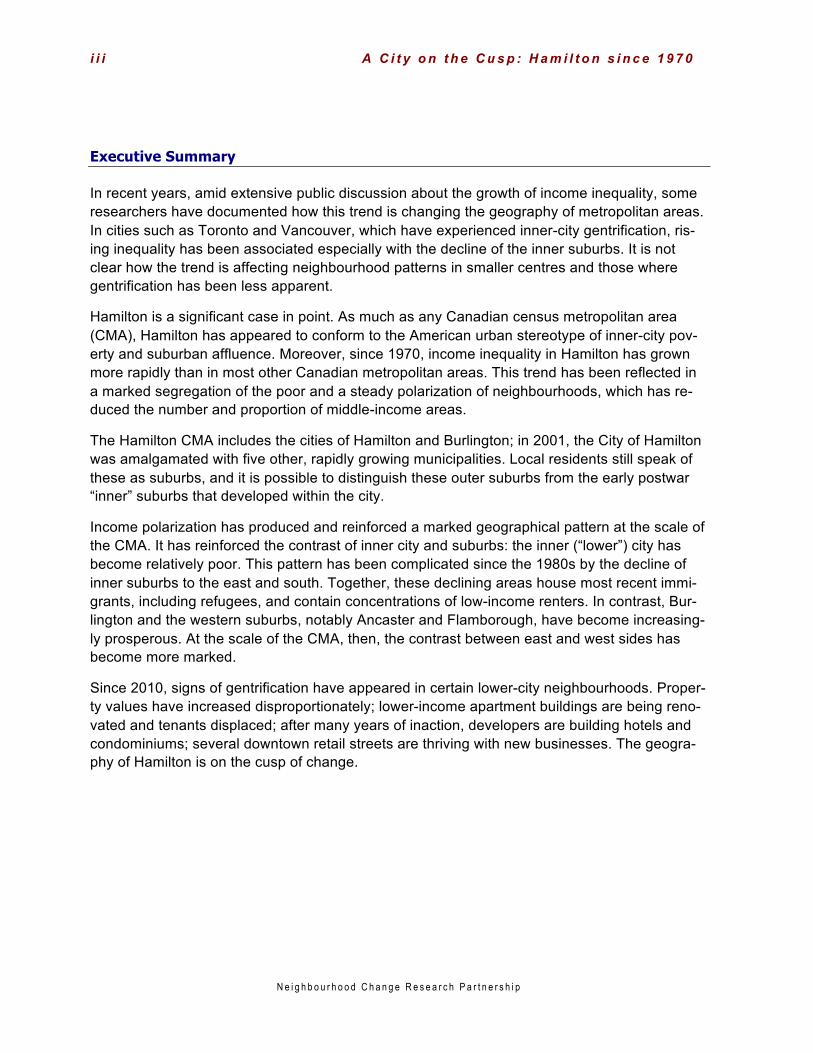
Executive Summary
In recent years, amid extensive public discussion about the growth of income inequality, some researchers have documented how this trend is changing the geography of metropolitan areas. In cities such as Toronto and Vancouver, which have experienced inner-city gentrification, ris-ing inequality has been associated especially with the decline of the inner suburbs. It is not clear how the trend is affecting neighbourhood patterns in smaller centres and those where gentrification has been less apparent.
Hamilton is a significant case in point. As much as any Canadian census metropolitan area (CMA), Hamilton has appeared to conform to the American urban stereotype of inner-city pov-erty and suburban affluence. Moreover, since 1970, income inequality in Hamilton has grown more rapidly than in most other Canadian metropolitan areas. This trend has been reflected in a marked segregation of the poor and a steady polarization of neighbourhoods, which has re-duced the number and proportion of middle-income areas.
The Hamilton CMA includes the cities of Hamilton and Burlington; in 2001, the City of Hamilton was amalgamated with five other, rapidly growing municipalities. Local residents still speak of these as suburbs, and it is possible to distinguish these outer suburbs from the early postwar “inner” suburbs that developed within the city.
Income polarization has produced and reinforced a marked geographical pattern at the scale of the CMA. It has reinforced the contrast of inner city and suburbs: the inner (“lower”) city has become relatively poor. This pattern has been complicated since the 1980s by the decline of inner suburbs to the east and south. Together, these declining areas house most recent immi-grants, including refugees, and contain concentrations of low-income renters. In contrast, Bur-lington and the western suburbs, notably Ancaster and Flamborough, have become increasing-ly prosperous. At the scale of the CMA, then, the contrast between east and west sides has become more marked.
Since 2010, signs of gentrification have appeared in certain lower-city neighbourhoods. Proper-ty values have increased disproportionately; lower-income apartment buildings are being reno-vated and tenants displaced; after many years of inaction, developers are building hotels and condominiums; several downtown retail streets are thriving with new businesses. The geogra-phy of Hamilton is on the cusp of change.
A C i t y o n t h e C u s p : H a m i l t o n s i n c e 1 9 7 0 i v
N e i g h b o u r h o o d C h a n g e R e s e a r c h P a r t n e r s h i p
Authors
Richard Harris is Professor of Geography at McMaster University. His research has concerned the history of housing, housing policy, and suburban development in the 20th century, with par-ticular reference to Canada and the United States. His most recent book is Building a Market: The Rise of the Home Improvement Industry, 1914–1960 (Chicago, 2012). He is a Fellow of the Royal Canadian Geographical Society and of the Royal Society of Canada.
James R. Dunn, Ph.D., is a Professor in the Department of Health, Aging and Society at McMaster University and a Scientist at the Centre for Research on Inner City Health at St. Mi-chael’s Hospital in Toronto. He is Director of the McMaster Institute for Healthier Environments and since 2011 has been co-editor-in-chief of the Journal of Epidemiology & Community Health. His work includes projects on the health and social impacts of public housing redevel-opment, the impact of neighbourhood redevelopment initiatives on health and child develop-ment, and the development of cross-sectoral policy implementation solutions for urban health problems.
Sarah Wakefield is an Associate Professor in the Department of Geography and Program in Planning at the University of Toronto; she is also the Director of the Health Studies Program in University College, Toronto. Her research has two main themes: food security policy and prac-tice and improving neighbourhood health. These are connected by an interest in understanding how individuals and organizations work to create just, healthy, and sustainable communities. She works closely with community organizations and health policy actors.

v A C i t y o n t h e C u s p : H a m i l t o n s i n c e 1 9 7 0
N e i g h b o u r h o o d C h a n g e R e s e a r c h P a r t n e r s h i p
Table of Contents
1. INTRODUCTION ................................................................................................................................. 7
2. GENERAL TRENDS IN HAMILTON ................................................................................................... 8
3. THE CHANGING SOCIAL GEOGRAPHY OF HAMILTON .............................................................. 13
4. EMERGING PATTERNS ................................................................................................................... 25
5. POLICIES AND PROSPECTS .......................................................................................................... 29
6. REFERENCES .................................................................................................................................. 31

A C i t y o n t h e C u s p : H a m i l t o n s i n c e 1 9 7 0 v i
N e i g h b o u r h o o d C h a n g e R e s e a r c h P a r t n e r s h i p
List of Figures
Figure 1: Change in Neighbourhood Income Distribution in the Hamilton Census Metropolitan Area, 1970–2010 ................................................................................................................ 10
Figure 2: Change in Neighbourhood Income Distribution in the Municipality of Burlington, 1970–2010 ................................................................................................................................... 11
Figure 3: Districts and Neighbourhoods in the Hamilton Census Metropolitan Area ................. 14
Figure 4: Percentage of Total Income from the Government, Persons 15 and over, by Census Tracts, Hamilton CMA, 1990 .............................................................................................. 15
Figure 5: Percentage of Total Income from the Government, Economic Families by Census Tracts, Hamilton CMA, 2005 .............................................................................................. 16
Figure 6: Average Individual Income, Hamilton Census Metropolitan Area, 1970 ..................... 18
Figure 7: Average Individual Income, Hamilton CMA, 1980 ...................................................... 19
Figure 8: Average Individual Income, Hamilton CMA, 2000 ...................................................... 20
Figure 9: Average Individual Income, Hamilton CMA, 2010 ...................................................... 21
Figure 10: Change in Census Tract Average Individual Income, Hamilton CMA, 1980–2010 ... 22
Figure 11: Formerly Middle Income Neighbourhoods in the Hamilton CMA, Change in Census Tract Average Individual Income, 1980–2010 .................................................................... 23
Figure 12: Recent Immigrant (1965–1971) Percentage of the Population by Census Tracts, Hamilton CMA, 1971 .......................................................................................................... 26
Figure 13: Recent Immigrant (2001–2006) Percentage of the Population by Census Tracts, Hamilton CMA, 2006 .......................................................................................................... 27
Figure 14: Rental Housing Disadvantage Index, Hamilton CMA, 2006 ..................................... 28
N e i g h b o u r h o o d C h a n g e R e s e a r c h P a r t n e r s h i p
1. Introduction
Hamiltonians like to think of their city as Canada’s best-kept secret. For almost half a century, such a claim became more and more implausible, not least to their neighbours in Toronto. Across Canada, no city showed more clearly than Hamilton the consequences of deindustriali-zation, the polarization of incomes that has affected almost every community in North America, and the consequent polarization of neighbourhoods. But just lately the patterning, if not the de-gree, of inequality has begun to shift. Hamilton is on the cusp of change.
The period since the oil shock of 1973 has reshaped most North American cities. Globalization has contributed to the loss of manufacturing jobs, many of them unionized and well-paid. In ways that have recently attracted widespread attention, wage and salary incomes have grown steadily more polarized (Chen, Myles, and Picot, 2012; Piketty, 2014; Walks, 2013a). As a re-sult, in a period when immigration levels have remained high, and have involved a widening range of countries of origin, a growing number of immigrants have found it difficult to establish a firm economic foothold in Canada (Haan, 2005). Segregation by income has increased, and to varying degrees all cities have experienced a growing polarization of neighbourhoods. In the 1970s, most neighbourhoods were, in income terms, broadly middle class; today, a growing number are either rich or poor, marking a trend that appears to be continuing (Hulchanski, 2010; Walks, 2013a; c.f. Bischoff and Reardon, 2013).
In this context, Canadian cities have tended to follow one of two trajectories. A number, includ-ing Toronto, Vancouver, and to a lesser degree Montreal, have seen a revival of the inner city (Hulchanski, 2010; Ley and Lynch, 2012; Rose and Twigge-Molecey, 2012; Walks and Maar-anen, 2008). This trend has been associated with gentrification of older, single-family dwellings and, especially in recent years, with a boom in the construction of high-rise condominiums (Rosen and Walks, 2013). The poor, including lower-income immigrants, have been displaced to – or have found their place in – the inner suburbs, areas which were developed in the early postwar decades.
A very different trajectory has been followed by a number of other Canadian municipalities, typ-ically smaller or mid-sized cities. These, too, have seen a relative decline of their inner suburbs (Pavlic, 2014). What sets them apart is that they have experienced a continuing inner-city de-cline that is comparable with, although by no means as severe as, that of many cities in the American Midwest and Northeastern Seaboard. Hamilton is a prime case in point.

N e i g h b o u r h o o d C h a n g e R e s e a r c h P a r t n e r s h i p
2. General Trends in Hamilton
To this day, the image that most travellers have of Hamilton is defined by the view of its water-front as seen from the Skyway Bridge that carries the Queen Elizabeth Way between Toronto and Niagara Falls. Hamilton was once an image of steel mills belching steam and smoke; today it is quieter, showing evidence of an active port but also of more than its share of rust and dere-liction.
Such images once captured Hamilton’s economy, but no longer. As late as the 1980s, when the Department of Geography at McMaster University produced a collection of essays on Ham-ilton, it was still possible to speak of Steel City (Dear, Drake, and Reeds, 1987; Weaver, 1982: 162–169). But even in the 1970s, the share of the city’s workforce that was employed in blue-collar jobs had fallen sharply, from 44.6 percent to 34.6 percent, a trend accentuated by the re-cession of the early 1980s (Webber and Fincher, 1987: 240–241).
Since then, factories have closed, while Dofasco and Stelco (the latter now known as U.S. Steel, and currently abandoning its Hamilton operations), the owners of the two major steel mills, have steadily shed jobs. Centrally located blue-collar jobs are still available, in older metal-fabricating plants and other industries and around the port. Suburban factory jobs have been growing, for example in meat-packing, notably around the airport, which has become a significant freight hub. But these jobs no longer define the city.
The decline of manufacturing has been more than matched by the growth of service industries, notably hospitals and postsecondary education institutions. McMaster University, established on the City’s west side in 1930, has grown rapidly since the 1960s. It has doubled in size since the mid-1980s alone, with a current full-time student enrolment of 26,000. Mohawk, a communi-ty college established in 1967, has grown even more rapidly and teaches almost 13,000 (most-ly part-time) students. McMaster is associated with a research park, prominent medical re-search facilities, and a teaching hospital, while other hospitals serve the city and a wider region. Today, these are the major employers and have helped the city record an unemployment rate that in recent years has frequently been lower than the provincial average. In the aggregate, then, Hamilton has weathered its industrial decline quite well.
The devil is in the details. For many decades, Hamilton has contained much more than its share of the welfare and service-dependent poor, including those with physical and mental dis-abilities. In this regard, its hospitals and service agencies act as magnets on a regional scale.
A C i t y o n t h e C u s p : H a m i l t o n s i n c e 1 9 7 0 9
N e i g h b o u r h o o d C h a n g e R e s e a r c h P a r t n e r s h i p
The numbers involved were increased by the deinstitutionalization of the mentally ill, a policy promoted in Ontario as in many other jurisdictions from the 1960s (Dear and Wolch, 1987), while further challenges have arisen in recent years as Hamilton became a favoured destina-tion for refugees.
As a result, in 2005 the proportion of the city’s residents who were dependent on government transfers (11.8 percent) was among the highest in country (Walks, 2013a: 27). So, too, was the incidence of poverty. It has been estimated that in 2006, 12.4 percent of the city’s population was in “severe” housing need (spending more than half of their income on housing), while an additional 19 percent were in “core” need (spending more than 30 percent) (Gaetz et al., 2013: 17). Many occupy rooming houses or rental units in what were once single-family dwellings, about a third of which violate zoning regulations, and some also fail to meet fire and electrical codes (van Dongen, 2012). And the incidence of “housing poverty,” whereby households spend an excessively high proportion of their income on housing, rivals that in Toronto and Vancou-ver, where housing is much more expensive, and easily exceeds that of Winnipeg, a city with a comparably high proportion of low-income households.
Deindustrialization, coupled with the large numbers of refugees, low-income immigrants, and the welfare poor, helps to explain why Hamilton has been more affected by general income trends than most other Canadian cities. Income inequality has increased in Canada in recent decades, as it has in most developed nations (Piketty, 2014). The increase was especially rapid between 1980 and 2000 (Walks, 2013a: 2).
Hamilton has fared worse than the average. The standard measure of income inequality is the Gini coefficient, which can range from a value of 0 (perfect income equality) to 1.0 (complete inequality). In 1980, the Gini for the pretax income of individuals in the Hamilton CMA was 0.34, the lowest among the 12 largest CMAs in the country (Walks, 2013a: 28). Over the next two decades, on this measure, inequality increased more rapidly than in any other major CMA, by a quarter. By 2000 the value was 0.386, fourth-highest among the 12 CMAs.
The Gini measures the range of variation. Other indices have been constructed to measure the extent to which incomes are polarized towards, or cluster at, the ends of the income distribu-tion. Here, too, the recent Canadian and international trend has been towards an increase; again, the rate of increase was greater in Hamilton than in any other Canadian metropolitan ar-ea (Walks, 2013a). If there is any Canadian city in which we might expect to find a growing dis-parity among neighbourhoods, Hamilton is it.
And indeed that is what we do find, but first we must briefly explain how the following analysis was conducted. The evidence reported here is based on research undertaken by the project on Neighbourhood Change and Building Inclusive Communities, directed by David Hulchanski at the University of Toronto and funded by the Social Sciences and Humanities Research Council of Canada. Previous reports from this project have documented neighbourhood change in To-ronto, Montreal, Vancouver, Halifax, and Winnipeg (Hulchanski, 2010; Ley and Lynch, 2012; Rose and Twigge-Molecey, 2012; Prouse at al., 2014).
In each case, the core data series pertains to the pre-tax incomes, received from all sources, of individuals, averaged at the census tract scale. For the purposes of analysis and comparison,
1 0 A C i t y o n t h e C u s p : H a m i l t o n s i n c e 1 9 7 0
N e i g h b o u r h o o d C h a n g e R e s e a r c h P a r t n e r s h i p
tracts are divided into five categories based on the average income of individuals. Middle-income tracts are defined as those in which average incomes fall within the range of 20 percent above or below the average for the census metropolitan area (CMA). Two categories define tracts that are “low income” (20-40 percent below average) or “very low income” (more than 40 percent below). Correspondingly, two categories define “high” and “very high income” tracts.
Although social homogeneity was one of the original criteria in defining census tract bounda-ries, those have usually remained fixed even while the social character of the tracts has changed. For that reason and others, tract boundaries rarely correspond precisely to those used by local residents in defining the limits of their neighbourhood. Nonetheless, following an established practice in social science research and except as noted, in the following discussion we will refer interchangeably to “tracts” and “neighbourhoods.”
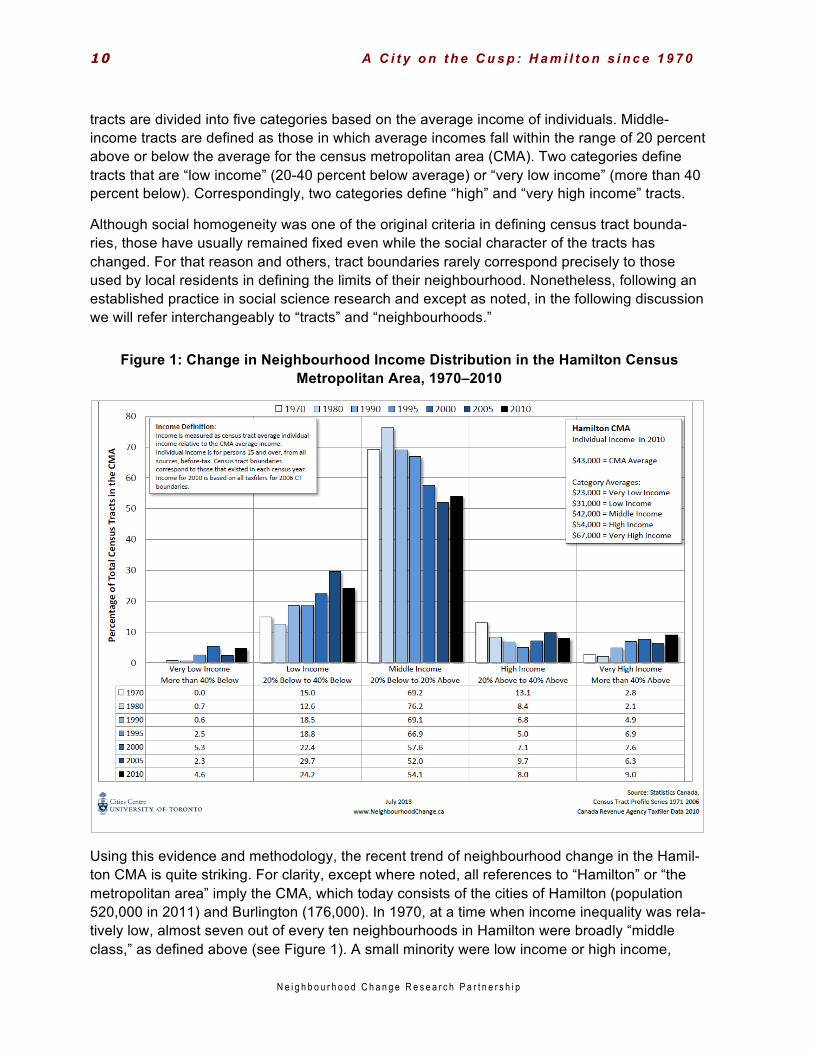
Figure 1: Change in Neighbourhood Income Distribution in the Hamilton Census Metropolitan Area, 1970–2010
Using this evidence and methodology, the recent trend of neighbourhood change in the Hamil-ton CMA is quite striking. For clarity, except where noted, all references to “Hamilton” or “the metropolitan area” imply the CMA, which today consists of the cities of Hamilton (population 520,000 in 2011) and Burlington (176,000). In 1970, at a time when income inequality was rela-tively low, almost seven out of every ten neighbourhoods in Hamilton were broadly “middle class,” as defined above (see Figure 1). A small minority were low income or high income,

A C i t y o n t h e C u s p : H a m i l t o n s i n c e 1 9 7 0 1 1
N e i g h b o u r h o o d C h a n g e R e s e a r c h P a r t n e r s h i p
while none had very low incomes and hardly any had very high. Overwhelmingly, the typical neighbourhood in Hamilton-Burlington was middle class, especially in 1980. Here we may see the lingering effects of the postwar boom.
Since 1980, however, the rise of income inequality and polarization has been reflected in the social geography of the metropolitan area. Decade by decade, the proportion of middle-class neighbourhoods in the CMA has fallen: to 69 percent in 1990, 58 percent in 2000, and 51 per-cent by 2010 (see Figure 2). Within the City of Hamilton alone, the proportion is much lower. There has been a corresponding growth in the various types of high-income and low-income neighbourhoods. The most notable change has been in the proportion of low-income tracts, whose share doubled between 1980 and 2010.
Figure 2: Change in Neighbourhood Income Distribution in the Municipality of Burlington, 1970–2010
One of the consequences has been an increase in the segregation of the very poor which, by 2001, was greater in Hamilton than in any other among 10 major Canadian cities. Indeed the authors of one study, who chose to examine Hamilton in detail because its experience was ex-treme, suggested that in 2001 very low wage-earners in Hamilton were “the most segregated

1 2 A C i t y o n t h e C u s p : H a m i l t o n s i n c e 1 9 7 0
N e i g h b o u r h o o d C h a n g e R e s e a r c h P a r t n e r s h i p
[of any city] … in recent Canadian history” (Stanger-Ross and Stanger-Ross, 2012: 225). At the other end of the income spectrum, the most significant increase was in the number of very high income tracts, the share of which jumped from 2.8 to 9.0 between 1970 and 2010. The decline of Hamilton’s middle-income neighbourhoods may not have been quite as striking as that expe-rienced within the City of Toronto over the same period, and neither was the growth of very low or very-high income neighbourhoods (Hulchanski, 2010: 8). 1 The polarization has moved more slowly and not gone as far, but the trend is very much the same.
Unfortunately, the comparison with Toronto is not straightforward. In defining the boundaries of CMAs, Statistics Canada attempts to frame urban areas that are substantially self-contained. For several decades, urban development has been more or less continuous along the northern shore of Lake Ontario between downtown Toronto and downtown Hamilton. One sign of this was the incorporation of Burlington as a city in 1974. Today, large numbers of people commute between the cities of Hamilton and Burlington, and also from both places in the direction of To-ronto. Burlington is just as much a suburb of Toronto as it is a part of Hamilton, while Burlingto-nians would insist that it is its own place.
Treated as such, we can see that it has hardly shared in the neighbourhood trends that have defined the rest of the Hamilton CMA. It has always been predominantly middle class, with a significant minority of high- and very high-income neighbourhoods (Figure 2). Here, the growth of income inequality is signalled quite subtly, by a relative increase in the number of very high income tracts and the appearance of a lone low income area by 2010.
If it is problematic to treat the Hamilton CMA as a single entity, then, that is doubly true for Bur-lington. Lately, some governmental agencies have begun to speak of the GTHA, the Greater Toronto and Hamilton Area, an urbanized region that is increasingly recognized in transit plan-ning. No urban place is an island but, by comparison with all other major urban centres across Canada, the City of Hamilton and the Hamilton CMA are the least self-contained: many people working in Hamilton live elsewhere, and vice versa.
____________________________________________________
1 It is unlikely that the trend at the scale of Toronto CMA would be as striking as that within the central city.
N e i g h b o u r h o o d C h a n g e R e s e a r c h P a r t n e r s h i p
3. The Changing Social Geography of Hamilton
The recent polarization of incomes and neighbourhoods in Hamilton has mapped itself out in a striking fashion, building on patterns that have been established for a century or more. The so-cial geography of Hamilton has always been powerfully shaped by the physical geography of its setting (Figure 3). It is bounded by Lake Ontario, and more specifically Hamilton Harbour, to the north, and almost as influentially by a section of the Niagara escarpment to the south, known locally as “The Mountain.”
This escarpment, the most famous feature of which is Niagara Falls, rises sharply by 300 feet, and for decades represented a barrier to southward settlement with the city. This barrier was breached only to a limited extent before the Second World War, so that it defines a real, as well as the perceptual, boundary of Hamilton’s inner or “lower” city, the area “below the Mountain.” When widespread car ownership and a growing number of access routes made the Mountain more accessible after 1945, there was a steady exodus of better-paid wage and salary workers from the lower city. In almost every Canadian city, there is a clear distinction between suburbs that were developed before and after 1945, but in Hamilton the escarpment elevates and un-derlines that divide (Maoh, Koronios and Kanaroglou, 2010).
Complicating this distinction is the contrast, also very typical in North America between the east and west sides. In the early phase of development of the industrial city, prevailing westerly winds brought smells and dirt to the east side of town. Since the mid 19th century, Hamilton’s industry has been concentrated in the region between downtown and the long shoreline of the Harbour. The eastern suburbs were predominantly working class. Because many of Hamilton’s industries required skilled labour and paid good wages, the residents of these working-class districts were proudly respectable. As Sylvia Fraser, who grew up in one of them from the late 1930s to the early 1950s, has put it, these areas contained “good neighbours united by the tough virtues of honesty, industry, sobriety and the certain knowledge that life is short, difficult, unpredictable and likely to get more so” (Fraser, 1972: 35; c.f. Synge, 1978: 103).
In contrast, middle- and upper-class settlement moved south, to the foot of the escarpment, and then from the 1920s westwards, into Westdale (Weaver, 1982: 103). Pollution controls and the decline of manufacturing have moderated the environmental contrasts, but not eliminated them. In any event, decades of development have created a built environment that still strongly favours the west. This bias, of course, also favoured the western suburbs of Flamborough, Dundas, and Ancaster over the eastern suburb of Stoney Creek until 2001, when all were
1 4 A C i t y o n t h e C u s p : H a m i l t o n s i n c e 1 9 7 0
N e i g h b o u r h o o d C h a n g e R e s e a r c h P a r t n e r s h i p
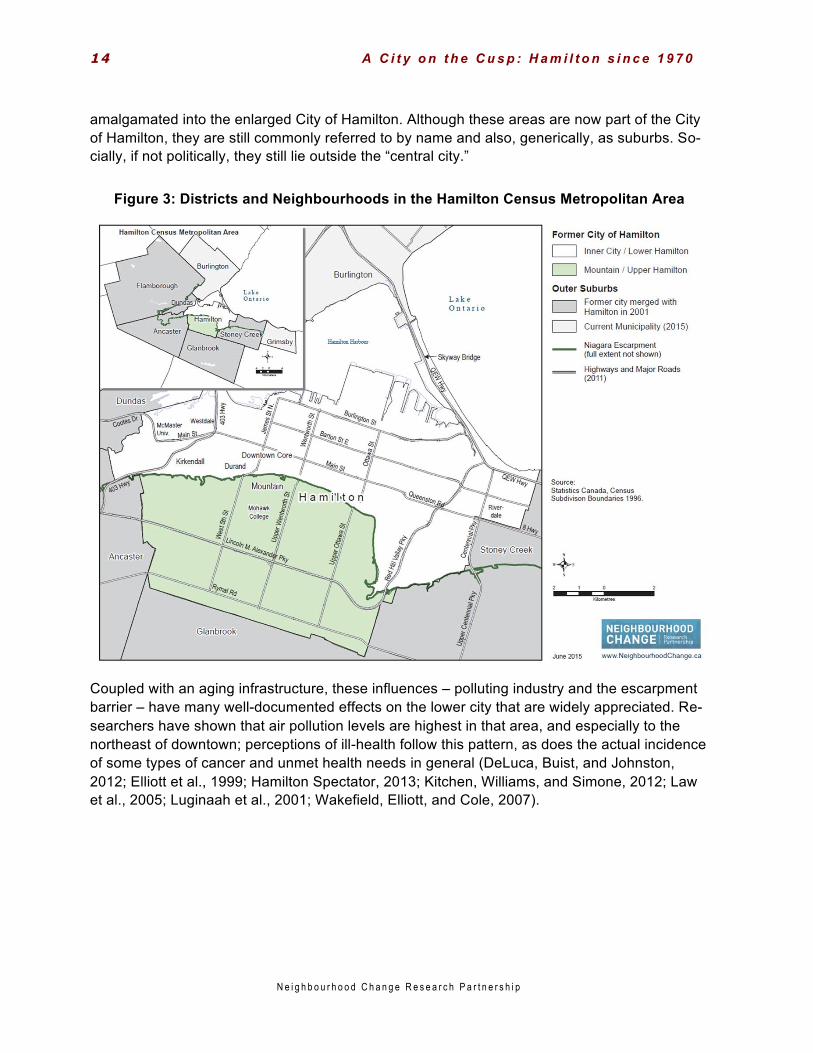
amalgamated into the enlarged City of Hamilton. Although these areas are now part of the City of Hamilton, they are still commonly referred to by name and also, generically, as suburbs. So-cially, if not politically, they still lie outside the “central city.”
Figure 3: Districts and Neighbourhoods in the Hamilton Census Metropolitan Area
Coupled with an aging infrastructure, these influences – polluting industry and the escarpment barrier – have many well-documented effects on the lower city that are widely appreciated. Re-searchers have shown that air pollution levels are highest in that area, and especially to the northeast of downtown; perceptions of ill-health follow this pattern, as does the actual incidence of some types of cancer and unmet health needs in general (DeLuca, Buist, and Johnston, 2012; Elliott et al., 1999; Hamilton Spectator, 2013; Kitchen, Williams, and Simone, 2012; Law et al., 2005; Luginaah et al., 2001; Wakefield, Elliott, and Cole, 2007).
A C i t y o n t h e C u s p : H a m i l t o n s i n c e 1 9 7 0 1 5
N e i g h b o u r h o o d C h a n g e R e s e a r c h P a r t n e r s h i p
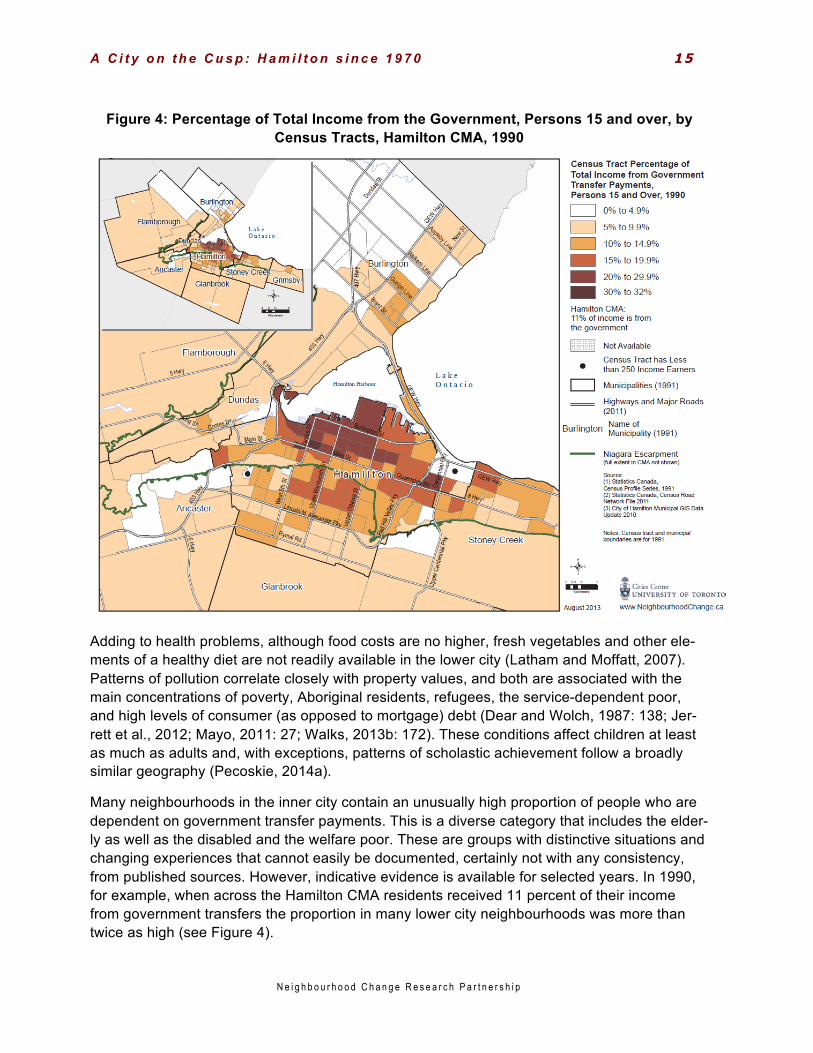
Figure 4: Percentage of Total Income from the Government, Persons 15 and over, by Census Tracts, Hamilton CMA, 1990
Adding to health problems, although food costs are no higher, fresh vegetables and other ele-ments of a healthy diet are not readily available in the lower city (Latham and Moffatt, 2007). Patterns of pollution correlate closely with property values, and both are associated with the main concentrations of poverty, Aboriginal residents, refugees, the service-dependent poor, and high levels of consumer (as opposed to mortgage) debt (Dear and Wolch, 1987: 138; Jer-rett et al., 2012; Mayo, 2011: 27; Walks, 2013b: 172). These conditions affect children at least as much as adults and, with exceptions, patterns of scholastic achievement follow a broadly similar geography (Pecoskie, 2014a).
Many neighbourhoods in the inner city contain an unusually high proportion of people who are dependent on government transfer payments. This is a diverse category that includes the elder-ly as well as the disabled and the welfare poor. These are groups with distinctive situations and changing experiences that cannot easily be documented, certainly not with any consistency, from published sources. However, indicative evidence is available for selected years. In 1990, for example, when across the Hamilton CMA residents received 11 percent of their income from government transfers the proportion in many lower city neighbourhoods was more than twice as high (see Figure 4).

1 6 A C i t y o n t h e C u s p : H a m i l t o n s i n c e 1 9 7 0
N e i g h b o u r h o o d C h a n g e R e s e a r c h P a r t n e r s h i p
A very similar pattern was still apparent 15 years later among economic families, that is, households that contain two or more related persons. In the CMA as a whole, families obtained 9 percent of their income from transfers, but in 22 tracts the proportion was more than twice that level. Of these, no fewer than 21 were neighbourhoods in the lower city (Figure 5).
Figure 5: Percentage of Total Income from the Government, Economic Families by Census Tracts, Hamilton CMA, 2005
It would be a mistake to interpret these maps too literally, because they reflect diverse experi-ences. But together they point to the continuing concentration of the welfare and service-dependent poor in Hamilton’s inner city. Dependency and a lack of resources make people feel powerless. In a couple of lower-city neighbourhoods, voter turnout now hovers around 20 per-cent, while other indicators reveal low levels of social capital and a weaker sense of place (Kitchen, Williams, and Simone, 2012; Mayo, 2011: 56; Williams and Kitchen, 2012). Many of these were once proud working-class neighbourhoods, but times have changed.
This array of specific features combines to form a broader pattern and stereotype. Thirty years ago, Martin Taylor (1987: 144-145) documented the generally low social status of Hamilton’s inner city, a pattern that had already begun to deepen during the 1960s. To some extent this decline was more apparent than real. Some older homes were torn down and replaced by

A C i t y o n t h e C u s p : H a m i l t o n s i n c e 1 9 7 0 1 7
N e i g h b o u r h o o d C h a n g e R e s e a r c h P a r t n e r s h i p
apartment buildings; families were replaced by singles and young couples who were not poor but who, temporarily, had lower household incomes.
This pattern persisted into the early 1970s, however, when a more substantial decline began. By then, a number of Canadian cities had begun to show some signs of incipient gentrification, but not Hamilton (Filion, 1987). It was one of five cities (out of nine documented) in which not a single inner-city census tract gained in terms of socioeconomic status during the 1970s (Filion, 1987: 229). Subsequently, its central city declined more rapidly than the average. In 1970, av-erage household income in the city was still 92.4 percent of that in the CMA as a whole; by 1980 this ratio had slipped to 87.6 percent, and by 2000, 76.5 percent, after which it stabilized (Walks, 2010; c.f. Martin Prosperity Institute, 2012). Only two other CMAs, out of 22 nationwide, had lower ratios in 2005. By the 2000s, then, Hamilton was the Canadian city that showed the most consistent income contrast between the inner city and the rest of the metro area.
If the broad pattern is clear, the mental maps of Hamiltonians are simpler still. No matter where they live, residents of postwar neighbourhoods draw a sharp line between the upper and lower city (Shanks, Coates, and Harris, 2016). Indeed, for many of them the inner city is terra incogni-ta, and they are happy to keep it that way.
Suburban stereotypes and resentment were reinforced by the process of amalgamation, carried through by the provincial government against strong suburban opposition in 2001 (Spicer, 2013). This brought previously independent municipalities into an expanded City of Hamilton. Suburban residents resented their loss of identity and autonomy; they also opposed the result-ing equalization of the tax base which, in many cases, raised their taxes. More than a decade later the issue is still alive: in the civic election of 2010, the successful mayoral candidate vowed to reopen the issue with the provincial government. It was a futile gesture but an effec-tive electoral ploy: the result of the vote confirmed the suburban nature of his base.
Over the years local media, notably the Hamilton Spectator, the daily newspaper, have done what they could to counter the negative image of Hamilton’s downtown and adjacent neigh-bourhoods. In 2013, for example, they supported an extensive study of the Barton Street corri-dor. Extending eastwards from the north end of downtown, Barton is the artery of a series of neighbourhoods that have experienced long-term and cumulatively devastating decline. In a week-long series of articles, Spectator reporter Steve Buist (2013) looked for signs of possible regeneration. His rich, but anecdotal evidence was met with some local skepticism (Robertson, 2013). More plausibly, the Spectator, and a recently opened CBC office, have trumpeted signs of revival in other neighbourhoods, and most importantly the downtown. But the newspaper has not shrunk from sponsoring studies that have documented the problems of the lower city, these being grouped under the umbrella of an award-winning “Code Red” series (DeLuca, Buist, and Johnstone, 2012; Hamilton Spectator, 2013).

1 8 A C i t y o n t h e C u s p : H a m i l t o n s i n c e 1 9 7 0
N e i g h b o u r h o o d C h a n g e R e s e a r c h P a r t n e r s h i p
Figure 6: Average Individual Income, Hamilton Census Metropolitan Area, 1970
Many aspects of Hamilton’s lower city have been documented, then, and some cross-sectional studies have shown metro-wide variations. But broad secular trends have never been satisfac-torily documented in a way that enables comparisons to be made with other Canadian cities. This is now possible, using standardized evidence drawn from the NCRP project. The chal-lenge here was to make appropriate adjustments for changes in census tract boundaries and reported income categories, and to compensate for the inadequacy of the income data reported in the voluntary census of 2011, officially known as the National Household Survey.2 The result-ing series of maps from 1970 through 2010 confirm the patterns indicated by previous re-search, but set them in a firmer context and reveal a striking trend.
The income map of Hamilton in 1970 (Figure 6) confirms the persistent importance of the es-carpment and of east-west contrasts. With one exception, the low-income tracts defined a compact area adjacent to the downtown core and extending northeastwards towards the water-front. Again with one exception, isolated high-income neighbourhoods were to be found only to the west, above and below the Mountain, and more numerously in several parts of Burlington. Two of the three high-income tracts within the city and lying just below the escarpment were
____________________________________________________
2 For details see Maaranen (2013).

A C i t y o n t h e C u s p : H a m i l t o n s i n c e 1 9 7 0 1 9
N e i g h b o u r h o o d C h a n g e R e s e a r c h P a r t n e r s h i p
long-standing areas of middle and upper-middle class settlement dating from the late 19th and early 20th centuries. They correspond approximately to the neighbourhoods of Durand and, im-mediately to the west, Kirkendall (Figure 3). Further west lies Westdale, developed mostly dur-ing the interwar period, which prospered when McMaster University was established on its western edge. Outside of these high and low-income enclaves, most of the city was broadly middle class, as were its suburbs.
Figure 7: Average Individual Income, Hamilton CMA, 1980
Since 1980, the trend has been towards a steady polarization of neighbourhoods. This was even apparent during the 1970s when, as noted previously, the proportion of middle-class tracts actually increased slightly. By 1980, the first very low income tract had emerged, imme-diately adjacent to downtown, while the low-income cluster consolidated in an eastward direc-tion along the Barton artery (Figure 7). Meanwhile, the western suburbs emerged as consistent-ly high-income. This trend became entrenched during the 1980s and 1990s.
2 0 A C i t y o n t h e C u s p : H a m i l t o n s i n c e 1 9 7 0
N e i g h b o u r h o o d C h a n g e R e s e a r c h P a r t n e r s h i p
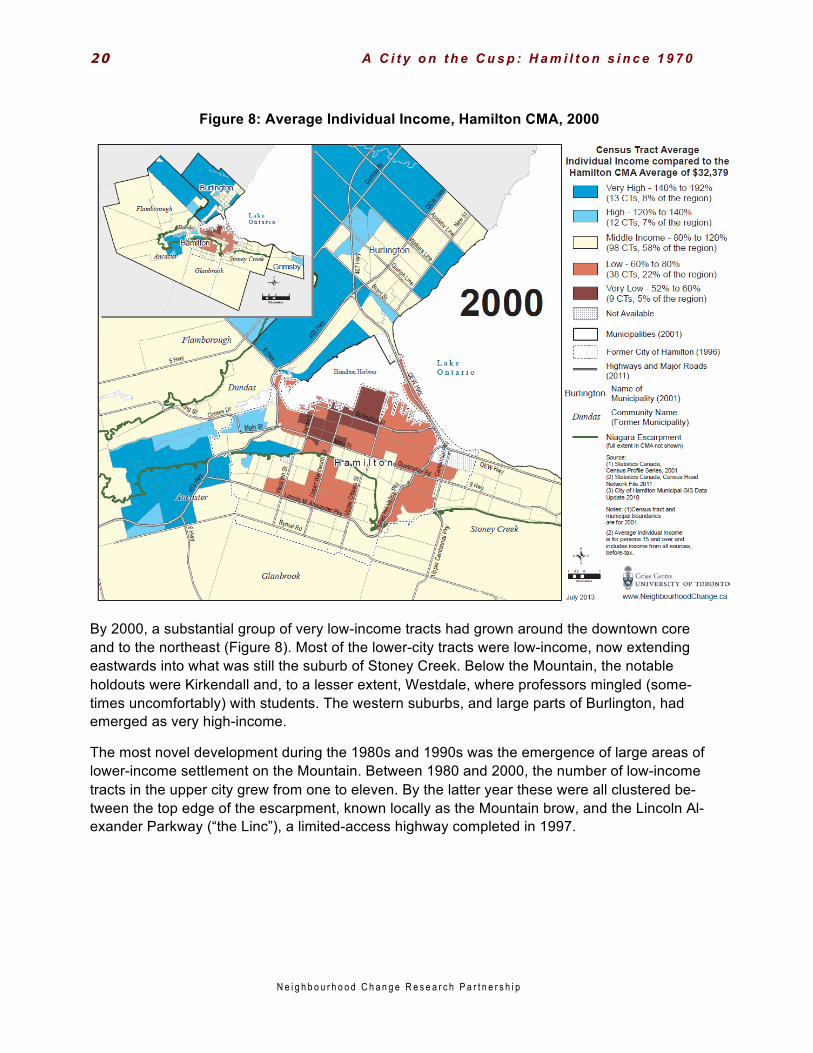
Figure 8: Average Individual Income, Hamilton CMA, 2000
By 2000, a substantial group of very low-income tracts had grown around the downtown core and to the northeast (Figure 8). Most of the lower-city tracts were low-income, now extending eastwards into what was still the suburb of Stoney Creek. Below the Mountain, the notable holdouts were Kirkendall and, to a lesser extent, Westdale, where professors mingled (some-times uncomfortably) with students. The western suburbs, and large parts of Burlington, had emerged as very high-income.
The most novel development during the 1980s and 1990s was the emergence of large areas of lower-income settlement on the Mountain. Between 1980 and 2000, the number of low-income tracts in the upper city grew from one to eleven. By the latter year these were all clustered be-tween the top edge of the escarpment, known locally as the Mountain brow, and the Lincoln Al-exander Parkway (“the Linc”), a limited-access highway completed in 1997.

A C i t y o n t h e C u s p : H a m i l t o n s i n c e 1 9 7 0 2 1
N e i g h b o u r h o o d C h a n g e R e s e a r c h P a r t n e r s h i p
Figure 9: Average Individual Income, Hamilton CMA, 2010
Hamilton is unusual among North American cities in that its city limits have grown steadily to embrace the expanding edge of urban settlement, so these were neighbourhoods that had al-ways been part of the City. But in other respects these areas are Hamilton’s version of what are elsewhere referred to as the inner (or older) ring of suburbs. In Toronto, as in most Canadian and U.S. cities, this is a zone that has recently experienced a relative decline, and in particular a significant increase in the incidence of poverty. In this regard, the experience of the older neighbourhoods on the Mountain has been very typical.
The pattern established by 2000 then stabilized (Figure 9). The west end of the city, including what had once been the western suburbs of Ancaster and Dundas, remained consistently affluent. During the 2000s, there was some slight reshuffling in terms of exactly which census tracts in the lower city could be counted as very low-income, as there was among the low-income tracts on the Mountain. Too much should not be made of this, because in some cases a change of a couple of percentage points nudged a tract above or below the relevant cut-off. More meaningful was the emergence of a very low-income tract, corresponding to the neighbourhood of Riverdale, towards the eastern fringe. Here, then, is a more marked example of inner-suburban decline.
2 2 A C i t y o n t h e C u s p : H a m i l t o n s i n c e 1 9 7 0
N e i g h b o u r h o o d C h a n g e R e s e a r c h P a r t n e r s h i p
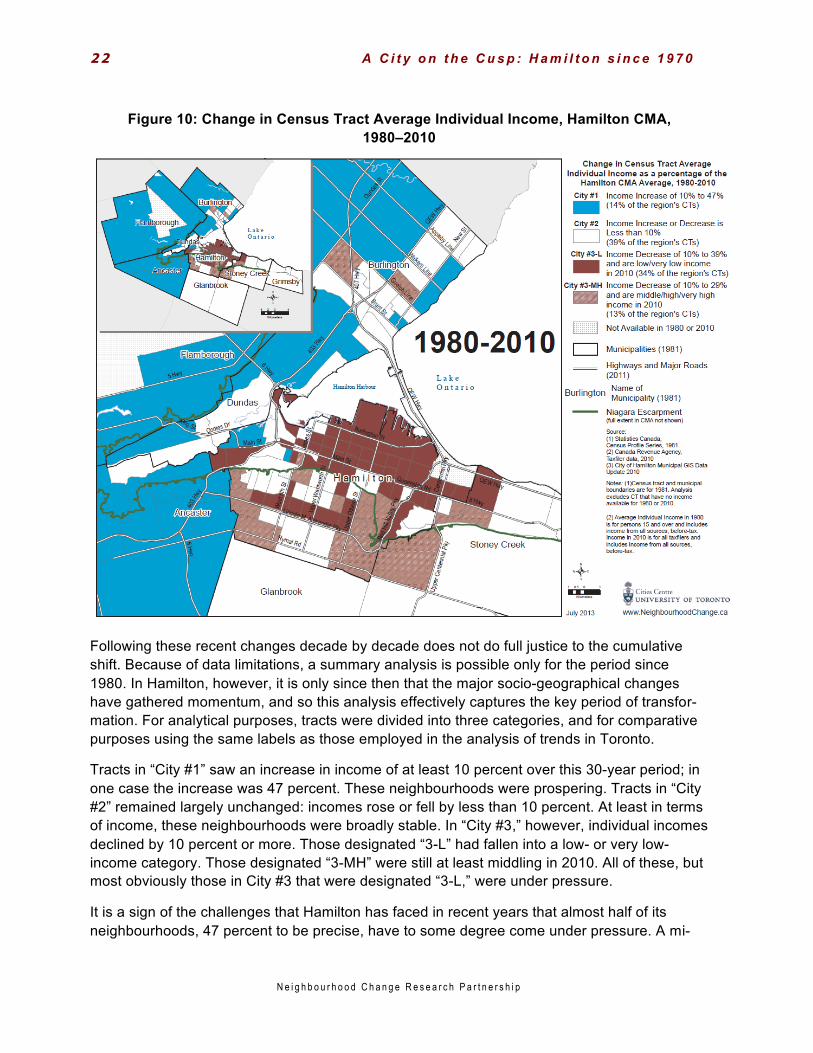
Figure 10: Change in Census Tract Average Individual Income, Hamilton CMA, 1980–2010
Following these recent changes decade by decade does not do full justice to the cumulative shift. Because of data limitations, a summary analysis is possible only for the period since 1980. In Hamilton, however, it is only since then that the major socio-geographical changes have gathered momentum, and so this analysis effectively captures the key period of transfor-mation. For analytical purposes, tracts were divided into three categories, and for comparative purposes using the same labels as those employed in the analysis of trends in Toronto.
Tracts in “City #1” saw an increase in income of at least 10 percent over this 30-year period; in one case the increase was 47 percent. These neighbourhoods were prospering. Tracts in “City #2” remained largely unchanged: incomes rose or fell by less than 10 percent. At least in terms of income, these neighbourhoods were broadly stable. In “City #3,” however, individual incomes declined by 10 percent or more. Those designated “3-L” had fallen into a low- or very low-income category. Those designated “3-MH” were still at least middling in 2010. All of these, but most obviously those in City #3 that were designated “3-L,” were under pressure.
It is a sign of the challenges that Hamilton has faced in recent years that almost half of its neighbourhoods, 47 percent to be precise, have to some degree come under pressure. A mi-
A C i t y o n t h e C u s p : H a m i l t o n s i n c e 1 9 7 0 2 3
N e i g h b o u r h o o d C h a n g e R e s e a r c h P a r t n e r s h i p
nority of these, almost all of them on the fringes of the built-up area, have declined somewhat but are still (at least) middling in income (Figure 10). In some cases, their relative decline may simply be what happens when partially developed areas of single-family homes are filled out with townhouses. But fully one-third have not only declined but now also fall into the low- or very low-income categories.
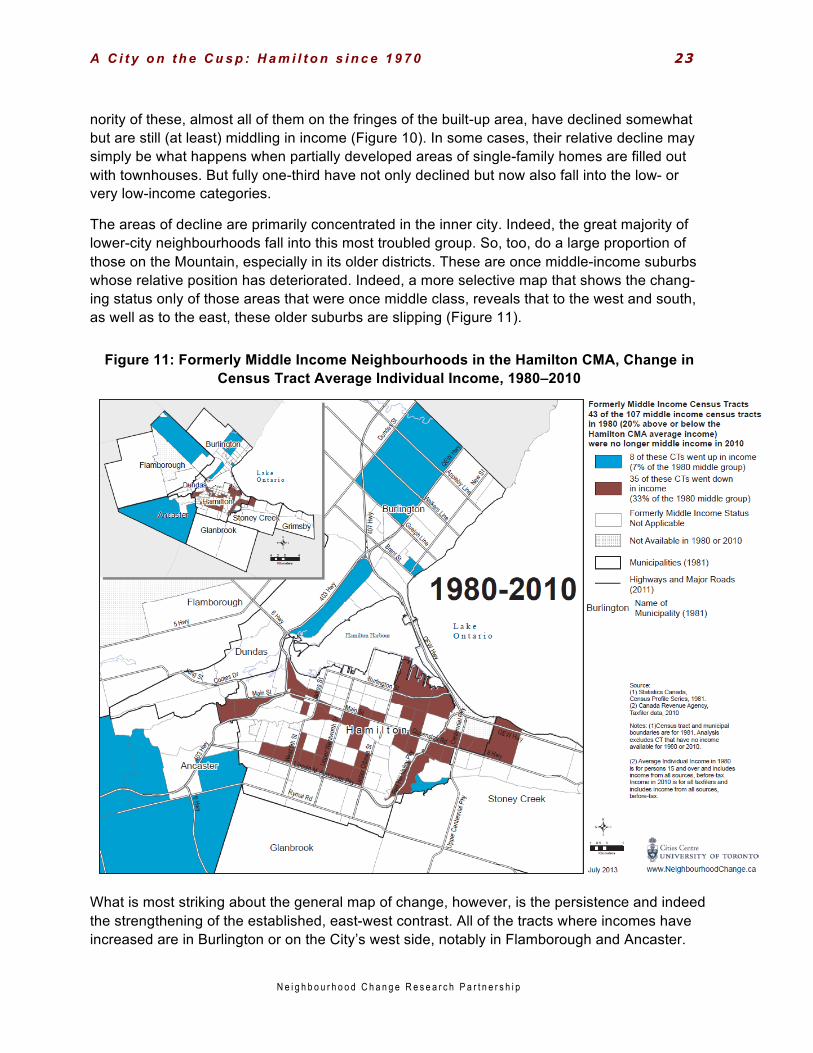
The areas of decline are primarily concentrated in the inner city. Indeed, the great majority of lower-city neighbourhoods fall into this most troubled group. So, too, do a large proportion of those on the Mountain, especially in its older districts. These are once middle-income suburbs whose relative position has deteriorated. Indeed, a more selective map that shows the chang-ing status only of those areas that were once middle class, reveals that to the west and south, as well as to the east, these older suburbs are slipping (Figure 11).
Figure 11: Formerly Middle Income Neighbourhoods in the Hamilton CMA, Change in Census Tract Average Individual Income, 1980–2010
What is most striking about the general map of change, however, is the persistence and indeed the strengthening of the established, east-west contrast. All of the tracts where incomes have increased are in Burlington or on the City’s west side, notably in Flamborough and Ancaster.
2 4 A C i t y o n t h e C u s p : H a m i l t o n s i n c e 1 9 7 0
N e i g h b o u r h o o d C h a n g e R e s e a r c h P a r t n e r s h i p
The great majority of tracts lying north, south, and especially east of downtown have been in decline.
The influences at work here are different from those that created the original contrast. Air pollu-tion and visual blight do affect the east side more, but the west side has the growing advantage of being within much easier commuting distance of the expanding Greater Toronto Area (GTA), including the municipalities of Burlington, Oakville, and Mississauga, which are strung out along the north shore of Lake Ontario in the direction of Toronto. Many of the new residents of Ancas-ter and Flamborough have been driven out of the GTA by high housing costs and use Highway 403 to drive back to work.
Hints of a similar effect may be discerned in the far east end, around the intersection of the Queen Elizabeth Way (QEW), which links Toronto with Buffalo and Niagara Falls across the Skyway Bridge, and the Red Hill Parkway, which connects the QEW with the Linc and points west. Here, too, GTA-bound commuters may find cheaper housing, and the completion of the Red Hill Parkway in 2007 has further improved the accessibility of this district. On a modest scale, it will probably continue to prosper.

N e i g h b o u r h o o d C h a n g e R e s e a r c h P a r t n e r s h i p
4. Emerging Patterns
In a general way, Hamiltonians are familiar with many of the patterns and trends outlined above. Above all, for decades the growing problems of the inner city were widely discussed. The contrast between eastern and western sectors is also well known, although the scale and broad consistency of recent shifts, documented here for the first time, may surprise many. A third trend has received less attention, although it is now well developed.
Whether measured in terms of income, or dependence on transfer payments, a significant number of postwar neighbourhoods lying above the escarpment and to the east in Stoney Creek have been in a slow but steady decline since the 1980s (see Figures 5, 10, and 11). Several influences are at work. People who moved into new, single-family homes in the early postwar decades have often aged in place, retired, and now live on reduced incomes. As in many Canadian suburbs, the tracts that were developed from the 1950s to the 1970s included many townhouses and medium-rise apartment buildings. Many of these have always housed younger people with modest incomes; sometimes inadequate maintenance has made them progressively less attractive.
Both types of accommodation have come under pressure from a variety of low-income renters. These include the rapidly growing number of students enrolled at Mohawk College, located centrally in the older part of the Mountain, as well as a growing number of immigrants and refu-gees. In 1971, immigrants coming to Hamilton settled first in neighbourhoods that were imme-diately adjacent to the downtown, overwhelmingly in the lower city (Figure 12). Since inner-city housing stock has remained relatively cheap, many still cluster close to the core, but a growing number settle first on the Mountain and the further east end (Figure 13). Today, the tract with the highest proportion of recent immigrants is Riverdale, in Stoney Creek. Echoing the title of a recent, influential survey of immigrant districts around the world, this neighbourhood has re-cently been described as Hamilton’s “arrival city” (Mayo, Klassen, and Bahkt, 2012: 37; c.f. Saunders, 2010).
Riverdale contains recently arrived Roma, Somalis, and emigrants from other African nations, quite a number of whom are refugees. Hamilton’s refugee population is not substantial in abso-lute terms, amounting to only 2.7 percent of the population in 2011, but large in comparison to that of most other Canadian cities. Refugees’ patterns of settlement may be regarded as an in-dicator of affordable housing and, potentially, of neighbourhood change. Unfortunately, alt-

2 6 A C i t y o n t h e C u s p : H a m i l t o n s i n c e 1 9 7 0
N e i g h b o u r h o o d C h a n g e R e s e a r c h P a r t n e r s h i p
hough the 2011 National Household Survey did gather information on refugee status, a low re-sponse rate compelled Statistics Canada to suppress data for a number of inner-city tracts.
Figure 12: Recent Immigrant (1965–1971) Percentage of the Population by Census Tracts, Hamilton CMA, 1971
Even so, the available evidence indicates clusters of refugees near downtown, on the Moun-tain, and in Stoney Creek, including Riverdale, and there is a broad swath of neighbourhoods across the Mountain where the proportion of refugees was near or above the CMA average. Not surprisingly, these are also areas where a high proportion of residents have difficulty find-ing decent and affordable housing.
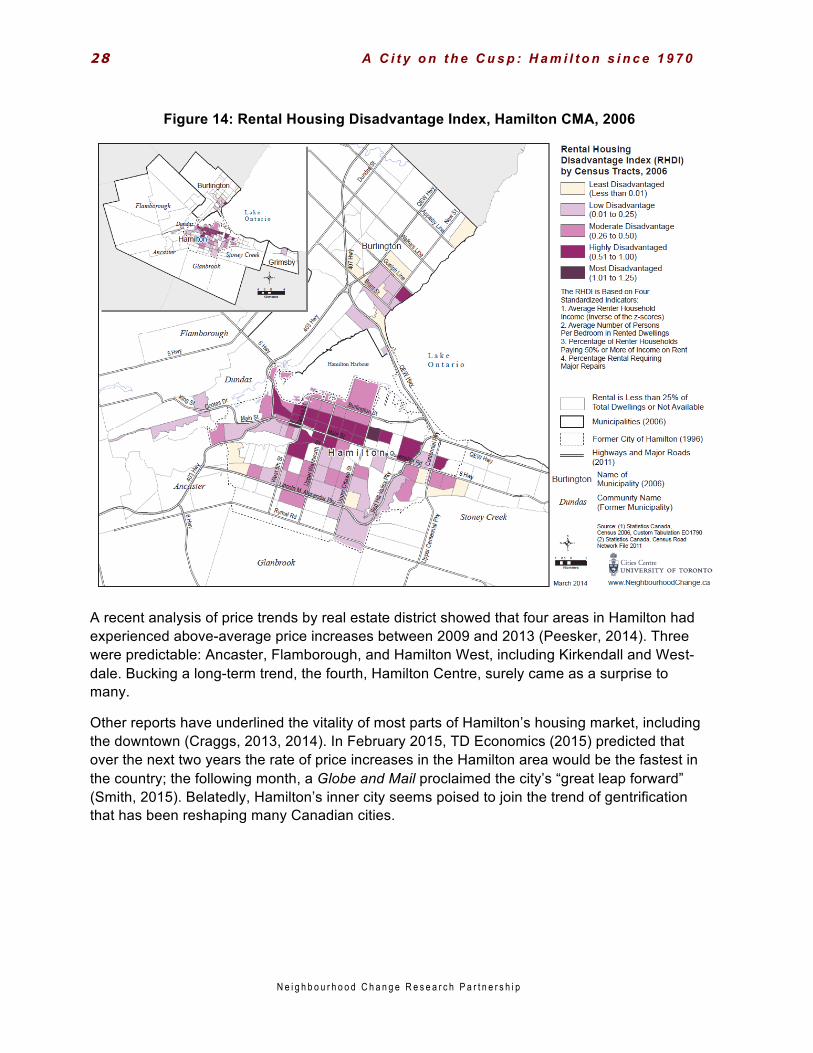
A composite index of housing disadvantage, which combines affordability, crowding, and dwell-ing quality shows that the main neighbourhoods with problems straddle the escarpment, rather than falling, as might have been expected, largely below it (Figure 14). Increasingly, the inner suburbs are experiencing a decline. Because – in Hamilton even more than in many other cities – those districts are poorly served by transit, the focus of policy concern should be shifting.
This point is underlined by a fourth trend, incipient and increasingly celebrated, but not readily apparent from available, published data. The steady expansion of the GTA, and the growing in-corporation of Hamilton into its commutershed, is now affecting the lower city as well as Ancas-

A C i t y o n t h e C u s p : H a m i l t o n s i n c e 1 9 7 0 2 7
N e i g h b o u r h o o d C h a n g e R e s e a r c h P a r t n e r s h i p
ter and Flamborough. Parts of Hamilton below the Mountain are attracting commuters who val-ue older streetscapes and walkable commercial strips, such as the Locke Street area in the Kirkendall neighbourhood in the west end.
Figure 13: Recent Immigrant (2001–2006) Percentage of the Population by Census Tracts, Hamilton CMA, 2006
The ongoing renovation and planned re-opening of a commuter rail station just north of down-town, with the promise of all-day service to downtown Toronto, is fuelling interest in the North End. Commuters are not the whole, or even the main story. The rapidly growing success of Su-percrawl, an arts and music festival held annually on James Street just north of downtown; the revival of James Street north itself; a growing construction boom for downtown condos and ho-tels; and anecdotal evidence of the migration of members of Toronto’s arts community to cen-trally located neighbourhoods in Hamilton, indicate a revival of the downtown that is gathering momentum. In 2001, although Hamilton nominally hosted the Canadian Music Awards (the Ju-nos), most of the associated events were held in Toronto; when Hamilton again hosted in 2015, everyone stayed and celebrated locally.
2 8 A C i t y o n t h e C u s p : H a m i l t o n s i n c e 1 9 7 0
N e i g h b o u r h o o d C h a n g e R e s e a r c h P a r t n e r s h i p
Figure 14: Rental Housing Disadvantage Index, Hamilton CMA, 2006
A recent analysis of price trends by real estate district showed that four areas in Hamilton had experienced above-average price increases between 2009 and 2013 (Peesker, 2014). Three were predictable: Ancaster, Flamborough, and Hamilton West, including Kirkendall and West-dale. Bucking a long-term trend, the fourth, Hamilton Centre, surely came as a surprise to many.
Other reports have underlined the vitality of most parts of Hamilton’s housing market, including the downtown (Craggs, 2013, 2014). In February 2015, TD Economics (2015) predicted that over the next two years the rate of price increases in the Hamilton area would be the fastest in the country; the following month, a Globe and Mail proclaimed the city’s “great leap forward” (Smith, 2015). Belatedly, Hamilton’s inner city seems poised to join the trend of gentrification that has been reshaping many Canadian cities.

N e i g h b o u r h o o d C h a n g e R e s e a r c h P a r t n e r s h i p
5. Policies and Prospects
Municipalities exert only a limited influence on the scale and patterning of urban growth. For many years, the City of Hamilton attempted to stem the decline of downtown, for example, by offering tax breaks or tax holidays for businesses and land developers. In the face of industrial decline and steady suburban expansion – which, it must be said, the suburbs and a regional municipality aided and abetted – these efforts met with little success at first. They have played a part in the recent revival of downtown investment, although broader market trends have been the major determinants. Apart from the expansion of the GTA, already noted, these include a growing demand for older, walkable urban environments and the long-term decline of many of Hamilton’s older neighbourhoods, which has created what, to many potential gentrifiers, ap-pears to be a very affordable stock of housing.
One of the changes that has increased the attractiveness of these districts was the passage of provincial legislation in 2005 which designated a Greenbelt that encompasses the entire GTHA. This move, coupled with municipal policies that promote intensification, redirected growth pres-sures into areas of existing urban settlement. There is a continuing debate about how effective such policies have been, and they are currently under review (Allen and Campsie, 2013). But growth pressures have been, and are likely to remain, substantial, so that reinvestment in the lower city appears inevitable.
In this context, one of the City’s recent initiatives may have a significant impact. In 2005, the City of Hamilton and the Hamilton Community Foundation (HCF) convened an ongoing Roundtable for Poverty Reduction. The HCF initiated a related Tackling Poverty Together pro-ject that initially identified eight “hubs” in disadvantaged neighbourhoods: seven in the lower city and one on the Mountain. Often located in a school, these hubs offered “centralized com-munity work,” in some ways akin to that of settlement houses established in many North Ameri-can cities in the early 20th century (Eby, Kitchen, and Williams, 2012; Hamilton Community Foundation, 2009).
Then, in 2010, the publication of what turned out to be the Hamilton Spectator’s first “Code Red” series attracted a good deal of local attention, prompting the City to appoint a “poverty czar.” Inspired by the example of the City of Toronto, a Neighbourhood Development Strategy was devised which targeted funds and staff resources to selected low-income neighbourhoods, for the most part coinciding with the HCF’s hubs (Eby, Kitchen, and Williams, 2012; Mayo,

3 0 A C i t y o n t h e C u s p : H a m i l t o n s i n c e 1 9 7 0
N e i g h b o u r h o o d C h a n g e R e s e a r c h P a r t n e r s h i p
Klassen, and Bahkt, 2012; Johnson, 2012).3 The goals were to strengthen the neighbourhoods by bringing residents together and to provide them with better supports. There have been some initial successes and already some hints of a downside. On James Street North, commercial rents have soared, pushing some businesses off the street (Reilly, 2014). Nearby, the corpo-rate owners of several high-rises are now renovating with a view to raising rents. This will al-most certainly displace many tenants, including the 50 who currently receive rent supplements (Clairmont and Fragomeni, 2015). But the more general and longer-term effects are as yet un-clear (Pecoskie, 2014b).
It is too soon to say what, if any, the effects of the City’s initiatives will be. The experience of the federal Neighbourhood Improvement Program (NIP) of the 1970s indicates some of the possibilities. At a time when it was still widely assumed that some neighbourhoods were be-yond redemption, NIP funds were targeted at areas that had experienced moderate decline but were still deemed to be salvageable. In cities like Toronto, the timing was fortuitous: many NIP areas prospered and in time gentrified.
The neighbourhoods that Hamilton has recently targeted are typically more deteriorated than those that received NIP funds, being among the most challenged in the city. But times have changed: across Canada, the revitalization of inner-city neighbourhoods is no longer seen as unlikely but, rather, almost inevitable. Almost all older neighbourhoods are thought to have po-tential. It is likely that several of the targeted neighbourhoods in Hamilton, notably those that are centrally located, will revive. In time – and of course the timeline is impossible to predict – so will others. Those furthest away from the centre, however, including some declining areas on the Mountain that are ill-served by transit, and those that do not have the ready appeal of historic cachet and walkability, will face greater challenges.
____________________________________________________
3 For background, and a description of these neighbourhoods, see: http://www.hamilton.ca/ProjectsInitiatives/NeighbourhoodDevelopment/

N e i g h b o u r h o o d C h a n g e R e s e a r c h P a r t n e r s h i p
6. References
Allen, R., and Campsie, Philippa. 2013. Implementing the Growth Plan for the Greater Golden Horseshoe. Toronto: Neptis Foundation. http://www.neptis.org/publications/implementing-growth-plan-greater-golden-horseshoe
Bischoff, K., and Reardon, S.F. 2013. “Residential segregation by income, 1970-2009.” In John R. Logan, ed., The Lost Decade? Social Change in the U.S. after 2000. New York: Russell Sage.
Buist, S. 2013. “Barton Street’s lost promise.” Hamilton Spectator, May 18.
Chen, W.-H., Myles, J., and Picot, G. 2012. “Why have poorer neighbourhoods stagnated economically while the richer have flourished? Neighbourhood income inequality in Canadian cities.” Urban Studies 49(4): 877–896
Clairmont, S. and Fragomeni, C. 2015. “Residents told to move or pay more rent.” Hamilton Spectator, Feb.18.
Craggs, S. 2013. “Sold! How a hot real estate market is changing Hamilton.” CBC Hamilton http://www.cbc.ca/news/canada/hamilton/news/sold-how-a-hot-real-estate-market-is-changing-hamilton-1.1317197
Craggs, S. 2014. “Get used to taller buildings as Hamilton’s boom continues.” CBC Hamilton, Nov.4. http://www.cbc.ca/news/canada/hamilton/news/get-used-to-taller-buildings-as-hamilton-s-housing-boom-continues-1.2823667
Dear, M.J., Drake, J.T., and Reeds, L.G. eds. 1987. Steel City: Hamilton and Region. Toronto: University of Toronto Press.
Dear, M. and Wolch, J. 1987. Landscapes of Despair: From Deinstitutionalization to Homelessness. Princeton, NJ: Princeton University Press.
DeLuca, P., Buist, S., and Johnston, N. 2012. “The Code Red project: Engaging communities in health system change in Hamilton, Canada.” Social Indicators Research 108(2): 317–327.
Eby, J., Kitchen, P., and Williams, A. 2012. “Perceptions of quality of life in Hamilton’s neighborhood hubs: A qualita-tive analysis.” Social Indicators Research 108(2): 299–315.
Elliott, S., Cole, D., Krueger, P., Voorberg, N., and Wakefield, S. 1999. “The power of perception: Health risk at-tributed to air pollution in an urban industrial neighborhood.” Risk Analayis 19: 615–628.
Filion, P. 1987. “Concepts of the inner city and recent trends in Canada.” The Canadian Geographer 31(3): 223–232.
Fraser, S. 1972. Pandora. Toronto: McClelland and Stewart.
Gaetz, S., Donaldson, J., Richter, T., and Gulliver, T. 2013. “The state of homelessness in Canada 2013.” Homeless Hub Paper #4. Toronto: Canadian Homelessness Research Network Press.
Haan, M. 2005. “The decline of immigrant homeownership advantages: Life cycles, declining fortunes and changing housing careers in Montreal, Toronto and Vancouver 1981-2001.” Urban Studies 42(12): 2191–2212.
Hamilton Community Foundation. 2009. TPT II: Building Strong Communities. Hamilton: Hamilton Community Foun-dation.

3 2 A C i t y o n t h e C u s p : H a m i l t o n s i n c e 1 9 7 0
N e i g h b o u r h o o d C h a n g e R e s e a r c h P a r t n e r s h i p
Hamilton Spectator. 2013. “Code Red. Cancer: The Enemy Within.” Hamilton Spectator, Oct.26. http://www.thespec.com/news-story/4176953-code-red-cancer-the-enemy-within/
Jerrett, M., Burnett, R., Kanaroglou, P., Eyles, J., Finkelstein, N., Giouis, C., and Brook, J. 2001. “A GIS-environmental justice analysis of particulate air pollution in Hamilton, Ontario.” Environment and Planning A 33: 955–973.
Johnson, P. 2012. “Neighbourhood Development Strategy (CM11007). City of Hamilton. http://www.hamilton.ca/NR/rdonlyres/FC73E139-6402-4CE6-BF38-7B92F782A129/0/May09EDRMS_ n167008_v1_7_3__CM11007.pdf
Kitchen, P., Williams, A., and Simone, D. 2012. “Measuring social capital in Hamilton, Ontario.” Social Indicators Re-search 108(2): 215–238.
Latham, J. and Moffatt, T. 2007. “Determinants of variation in food costs and availability in two socioeconomically contrasting neighborhoods of Hamilton, Ontario, Canada.” Health and Place 13: 273–287.
Law, M., Willson, K., Eyles, J., Elliott, S., Jerrett, M., Moffatt, T., and Luginaah, I. 2005. “Meeting health needs, ac-cessing health care: The role of neighborhood.” Health and Place 11: 367–377.
Luginaah, I., Jerrett, M., Elliott, S., Eyles, J., Parizeau, K., Birch, S. et al. 2001. “Health profiles of Hamilton: Spatial characterisation of neighborhoods for health investigations.” GeoJournal 53: 135–147.
Maaranen, R. 2013. “Design Rationale for the CMA Census Tract Income Map and Graph Series, 1970 to 2010.” Neighbourhood Change Research Partership, University of Toronto, Toronto.
Maoh, H., Koronios, M., and Kanaroglou, P. 2010. “Exploring the land development process and its impact of urban form in Hamilton, Ontario.” Canadian Geographer 54(1): 68–86.
Martin Prosperity Institute. 2012. “Insight: Wealth in suburbia. Is uniformity a good thing?” MPI Insight June 13. http://martinprosperity.org/2012/06/13/insight-wealth-in-suburbia/
Mayo, S. 2011. Hamilton’s Social Landscape. Hamilton: Social Planning and Research Council of Hamilton.
Mayo, S., Klassen, S., and Bahkt, L. 2012. Neighbourhood Profiles. Hamilton: Social Planning and Research Council of Hamilton.
Pavlic, D. 2014. “Fading inner suburbs? A historio-spatial analysis of prosperity indicators in the urban zones of the 15 largest census metropolitan areas. Unpublished M.A. thesis, University of Waterloo. https://uwspace.uwaterloo.ca/handle/10012/5930
Pecoskie, T. 2014a. “Keeping score: Day 4. Unlocking Potential.” Hamilton Spectator, April 16.
Pecoskie, T. 2014b. “Healthy neighbourhoods, healthy neighbours,” Hamilton Spectator, 13 Sept.
Peesker, A. 2014. “Hot housing market shifts landscape for local buyers.” Hamilton Spectator, July 19.
Piketty, T. 2014. Capital in the Twenty-First Century. Cambridge, MA: Belknap Press.
Prouse, V., Grant, J.L., Radice, M., Ramos, H., and Shakotko, P. 2014. “Neighbourhood Change in Halifax Regional Municipality, 1970 to 2010. Applying the ‘Three Cities’ Model.” NCRP Halifax Case Study. Dalhousie University, Halifax.
Reilly, E. 2014. “James North’s success forces artist off street.” Hamilton Spectator, Dec.19.
Robertson, A. 2013. “Poverty Inc.” Urbanicity, July.
Rose, D., and Twigge-Molecey, A. 2013. A City-Region Growing Apart? Taking Stock of Income Disparity in Greater Montréal, 1970–2005. Toronto: University of Toronto Cities Centre Research Paper 222.
Rosen, G. and Walks, A. 2013 “Rising cities: Condominium development and the private transformation of the me-tropolis.” Geoforum. 49: 160–172
Saunders, D. 2010. Arrival City:The Final Migration and Our Next World. Toronto: Knopf.
Shanks, A., Coates, V., and Harris, R. 2016. “Doubts about ‘suburbs’ in Canada”, in Harris, R. and Vorms, C., eds, What’s in a Name? Talking about ‘Suburbs’ Toronto: University of Toronto Press (forthcoming)
Smith, S. 2015. “Hamilton’s great leap forward.” Globe and Mail, March 27.
Spicer, Z. 2012. “Post-amalgamation politics: How does consolidation impact community decision-making?” Canadi-an Journal of Urban Research 21(2): 1–22.

A C i t y o n t h e C u s p : H a m i l t o n s i n c e 1 9 7 0 3 3
N e i g h b o u r h o o d C h a n g e R e s e a r c h P a r t n e r s h i p
Stanger-Ross, J. and Stanger-Ross, H.S. 2012. “Placing the poor: The ecology of poverty in postwar Canada.” Jour-nal of Canadian Studies 46(1): 213–240.
Synge, J. 1978. “Self help and neighbourliness: Patterns of life in Hamilton.” In I. Abella and D. Millar, eds., The Ca-nadian Worker in the Twentieth Century Toronto: Oxford University Press, pp.97-104.
Taylor, S.M. 1987. “Social change in Hamilton, 1961–1981.” In M.J.Dear, J.T.Drake, and L.G. Reeds, eds., Steel City: Hamilton and Region, pp.138–155. Toronto: University of Toronto Press.
TD Economics. 2015. Canadian Regional Housing Outlook. Trading spaces. Feb.12. Toronto: TD Economics. http://www.td.com/document/PDF/economics/special/RegionalHousing_Feb2015.pdf
Van Dongen, M. 2012. “Licensing plan threatens one-third of city’s in-house rentals: report.” Hamilton Spectator, Dec. 5.
Wakefield, S., Elliott, S.J., and Cole, D.C. 2007. “Social capital, environmental health and collective action: A Hamil-ton, Ontario case study.” The Canadian Geographer 51(4): 428–443.
Walks, R.A. 2010. “New divisions: Social polarization and neighbourhood inequality in the Canadian city.” In T. Bunt-ing, P. Filion, and R. Walker, eds., Canadian Cities in Transition: New Directions in the Twenty-First Century, 4th Edition, pp. 170–190. Toronto: Oxford University Press.
Walks, A. 2013a. “Income inequality and polarization in Canada’s cities: An examination and new form of measure-ment.” Toronto: University of Toronto Cities Centre Research Paper 227.
Walks, A. 2013b. “Mapping the urban debtscape: The geography of household debt in Canadian cities.” Urban Ge-ography 34(2): 153–187.
Walks, A., and Maaranen, R. 2008. The Timing, Patterning and Forms of Gentrification and Neighbourhood Upgrad-ing in Montreal, Toronto, and Vancouver, 1961 to 2001. Toronto: University of Toronto, Cities Centre Research Paper 211.
Weaver, J. 1982. Hamilton: An Illustrated History. Toronto: Lorimer.
Webber, M., and Fincher, R. 1987. “Urban policy in Hamilton in the 1980s.” In M.J. Dear, J.T. Drake, and L.G. Reeds, eds., Steel City: Hamilton and Region, pp.238–225. Toronto: University of Toronto Press.
Williams, A., and Kitchen, P. 2012. “Sense of place and health in Hamilton, Ontario: A case study.” Social Indicators Research 108: 257–276.