Embed Size (px)
Citation preview
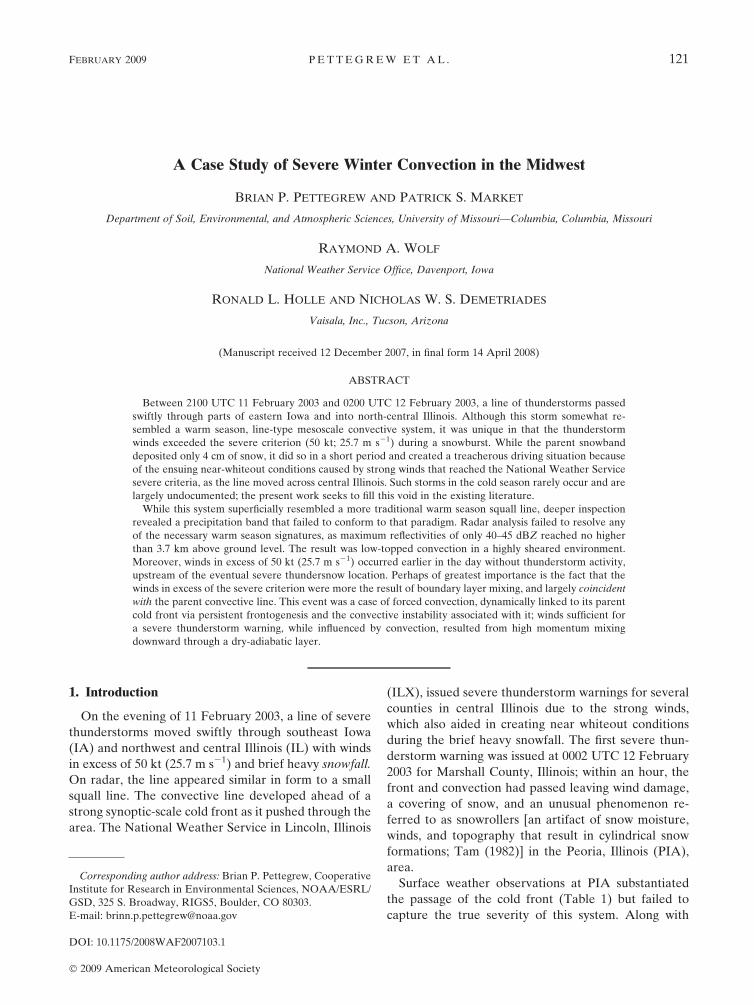
A Case Study of Severe Winter Convection in the Midwest
BRIAN P. PETTEGREW AND PATRICK S. MARKET
Department of Soil, Environmental, and Atmospheric Sciences, University of Missouri—Columbia, Columbia, Missouri
RAYMOND A. WOLF
National Weather Service Office, Davenport, Iowa
RONALD L. HOLLE AND NICHOLAS W. S. DEMETRIADES
Vaisala, Inc., Tucson, Arizona
(Manuscript received 12 December 2007, in final form 14 April 2008)
ABSTRACT
Between 2100 UTC 11 February 2003 and 0200 UTC 12 February 2003, a line of thunderstorms passed
swiftly through parts of eastern Iowa and into north-central Illinois. Although this storm somewhat re-
sembled a warm season, line-type mesoscale convective system, it was unique in that the thunderstorm
winds exceeded the severe criterion (50 kt; 25.7 m s21) during a snowburst. While the parent snowband
deposited only 4 cm of snow, it did so in a short period and created a treacherous driving situation because
of the ensuing near-whiteout conditions caused by strong winds that reached the National Weather Service
severe criteria, as the line moved across central Illinois. Such storms in the cold season rarely occur and are
largely undocumented; the present work seeks to fill this void in the existing literature.
While this system superficially resembled a more traditional warm season squall line, deeper inspection
revealed a precipitation band that failed to conform to that paradigm. Radar analysis failed to resolve any
of the necessary warm season signatures, as maximum reflectivities of only 40–45 dBZ reached no higher
than 3.7 km above ground level. The result was low-topped convection in a highly sheared environment.
Moreover, winds in excess of 50 kt (25.7 m s21) occurred earlier in the day without thunderstorm activity,
upstream of the eventual severe thundersnow location. Perhaps of greatest importance is the fact that the
winds in excess of the severe criterion were more the result of boundary layer mixing, and largely coincident
with the parent convective line. This event was a case of forced convection, dynamically linked to its parent
cold front via persistent frontogenesis and the convective instability associated with it; winds sufficient for
a severe thunderstorm warning, while influenced by convection, resulted from high momentum mixing
downward through a dry-adiabatic layer.
1. Introduction
On the evening of 11 February 2003, a line of severe
thunderstorms moved swiftly through southeast Iowa
(IA) and northwest and central Illinois (IL) with winds
in excess of 50 kt (25.7 m s21) and brief heavy snowfall.
On radar, the line appeared similar in form to a small
squall line. The convective line developed ahead of a
strong synoptic-scale cold front as it pushed through the
area. The National Weather Service in Lincoln, Illinois
(ILX), issued severe thunderstorm warnings for several
counties in central Illinois due to the strong winds,
which also aided in creating near whiteout conditions
during the brief heavy snowfall. The first severe thun-
derstorm warning was issued at 0002 UTC 12 February
2003 for Marshall County, Illinois; within an hour, the
front and convection had passed leaving wind damage,
a covering of snow, and an unusual phenomenon re-
ferred to as snowrollers [an artifact of snow moisture,
winds, and topography that result in cylindrical snow
formations; Tam (1982)] in the Peoria, Illinois (PIA),
area.
Surface weather observations at PIA substantiated
the passage of the cold front (Table 1) but failed to
capture the true severity of this system. Along with
Corresponding author address: Brian P. Pettegrew, Cooperative
Institute for Research in Environmental Sciences, NOAA/ESRL/
GSD, 325 S. Broadway, RIGS5, Boulder, CO 80303.
E-mail: [email protected]
FEBRUARY 2009 P E T T E G R E W E T A L . 121
DOI: 10.1175/2008WAF2007103.1
� 2009 American Meteorological Society

damage reports of downed trees and utility poles (see
the National Oceanic and Atmospheric Administration
publication Storm Data), spotter and observer reports
of measured/estimated wind gusts included
1) 2345 UTC 11 February 2003, Galesburg, IL; 53-kt
(27.2 m s21) wind gust;
2) 0032 UTC 12 February 2003, Roanoke, IL; 54-kt
(27.8 m s21) wind gust; and
3) 0041 UTC 12 February 2003, Tremont, IL; 51-kt
(26.2 m s21) wind gust.
Unique cases such as this one, which do not clearly
fall into common operational paradigms, present some-
what of a challenge to forecasters regarding how best to
communicate the weather hazard. At the National
Weather Service, two responses that would be consid-
ered for such an event include a severe thunderstorm
warning (SVR) and a high-wind warning (HWW).
Typically, the SVR is issued for thunderstorms likely to
produce hail of 0.75-in. diameter or greater and/or sur-
face wind gusts of 58 miles per hour (mph; 25.7 m s21)
or greater. HWWs are usually issued for expected sur-
face wind gusts of 58 mph (25.7 m s21) or higher (in
most parts of the country) due to synoptic-scale pres-
sure gradients, terrain-forced winds such as mountain
waves, or mesoscale winds associated with a wake low
behind a squall line. We will explore the nature of the
best response in section 7 of this paper.
Therefore, the case studied here is one of a convec-
tive line with few of the accepted characteristics of a
typical squall line in the warm season. Additionally,
winds occurred during thunderstorm activity sufficient
to require the issuance of a severe thunderstorm warn-
ing, even though the origin of those strong winds was
due only in part to the convective circulation. To better
understand the event, this paper takes the following
form: Section 2 reviews the related literature; section 3
looks briefly at the data and methods used in this study;
in section 4 we provide a synoptic overview for the time
period when the system was near its peak; section 5
supports the synoptic analysis with mesoscale analyses
from the Rapid Update Cycle (RUC) model and
soundings from both the time of the event and from 12
h prior to it; section 6 is devoted to observed radar and
lightning aspects of this convective system, including a
discussion on how this line of thunderstorms compares
TABLE 1. Automated surface observations from PIA, DVN, and HON, on 11 and 12 Feb 2003, following METAR code: time (UTC),
sky follows METAR abbreviations, ceiling (CIG; ft), visibility (VIS; statute miles), current weather (WX) follows METAR coding,
temperatures (T; 8F) and dewpoint temperatures (Td; 8F), wind direction (DIR; 8), wind speed and gusts (speed; kt), and the altimeter
setting (ALTI; in.). Entries with an asterisk also featured lightning in remarks, as determined by the Automated Lightning Detection
and Ranging (ALDAR) system equipped on ASOS; those with an ‘‘M’’ are missing.
Date Time Sky CIG VIS WX T Td DIR Speed ALTI
PIA 11 Feb 2054 BKN 8500 10 33 21 240 19G24 29.79
11 Feb 2154 OVC 6000 10 34 23 240 19G24 29.76
11 Feb 2254 FEW 7000 10 36 23 250 17G25 29.75
11 Feb 2354 BKN 6000 10 38 25 250 19G30 29.74
12 Feb 0036 BKN 3000 2.5 2SN 32 28 310 21G34 29.83
12 Feb 0044 BKN 3000 9 2SN 32 26 310 17G29 29.84
12 Feb 0054 OVC 3900 9 32 25 310 15G25 29.86
12 Feb 0154 CLR 10 25 14 310 11G20 29.93
DVN 11 Feb 1954 BKN 7000 10 34 29 240 24G30 29.70
11 Feb 2054 BKN 5500 8 37 21 240 23G35 29.66
11 Feb 2154 5 38 22 250 25G35 29.64
11 Feb 2242 1.25 2SN 36 27 300 36G43 M
11 Feb 2245 0.25 1SN 32 27 310 35G43 29.70
* 11 Feb 2254 0.5 SN 31 26 300 26G43 29.71
* 11 Feb 2257 2 2SN 31 26 310 21G32 29.71
* 11 Feb 2304 6 31 23 310 29G41 29.72
11 Feb 2354 CLR 10 23 15 310 19G30 29.82
12 Feb 0054 CLR 10 19 6 320 26G35 29.90
HON 11 Feb 1455 FEW 4700 10 31 25 250 16 29.67
11 Feb 1555 CLR 8 BLSN 34 27 280 25G36 29.66
11 Feb 1633 SCT 2800 0.5 BLSN M M 340 40G54 M
11 Feb 1636 BKN 2800 0.25 BLSN M M 340 35G54 M
11 Feb 1642 BKN 4400 0.75 BLSN M M 350 25G43 M
11 Feb 1655 OVC 5000 5 BLSN 25 21 350 30G34 29.76
11 Feb 1734 OVC 7500 5 BLSN M M 340 28G35 M
11 Feb 1755 BKN 2500 5 BLSN 22 14 340 23G33 29.88
122 W E A T H E R A N D F O R E C A S T I N G VOLUME 24
with squall lines typically observed with severe weather
in the Midwest; and in section 7, we offer a brief sum-
mary of the results and some concluding remarks on the
operational significance of this event.
2. Background
The event studied here was atypical of thundersnow
cases, in that the event in question was not a case of
elevated convection. While most thundersnow events in
the Midwest occur in the presence of an extratropical
cyclone (Market et al. 2002) resulting from some type
of elevated instability, this event appeared to maintain
a quality more related to warm season and warm sector
severe weather rooted in the planetary boundary layer,
of the like associated with squall lines. Previous snow
event studies involving wintertime convection, such as
Kocin et al. (1985) and Schneider (1990), have been
completed with the aid of mesoscale models. Yet, these
events were part of large synoptic-scale systems more
typical of a cold season extratropical cyclone scenario
described by established climatologies (Holle et al.
1998; Market et al. 2002).
Previous studies of such convective snowstorms are
sparse in the existing literature. Kocin et al. (1985) per-
formed a model evaluation of a convective snowburst
event along the Atlantic seaboard, where the primary
objective of the analysis was to demonstrate the prac-
ticality of using a mesoscale modeling system to fore-
cast such phenomena; it also served to document dy-
namic processes associated with such events. Similar to
the case of 11 February 2003, their 8 March 1984 system
displayed excessive snow rates with near-blizzard con-
ditions. However, the snowburst studied by Kocin et al.
(1985) was due to the formation of a secondary surface
low downstream of the primary surface low pressure
center associated with strong dynamical forcing aloft.
The authors also found the presence of a low-level jet
(a similarity to the case studied here, as we will see
shortly) associated with warm air advection. Schneider
(1990) documented meteorological conditions associ-
ated with large-amplitude gravity wave disturbances. In
particular, he studied the cyclone from 13 to 14 Decem-
ber 1987 in which an elongated band of snow fell from
the Texas Panhandle up into Michigan due to a large-
amplitude gravity wave, which also caused cloud-to-
ground lightning, heavy snowfall, and blizzard condi-
tions. Synoptic conditions included a deepening synop-
tic trough along with an associated 300-hPa jet streak
and strong vorticity advection over an intensifying ex-
tratropical cyclone.
More recent work has focused on shallow, cold sea-
son convection, although not specifically on systems
generating snowfall. Van den Broeke et al. (2005) ex-
amined two convective lines that formed along a sur-
face cold front, similar to the event described here.
Cloud-to-ground lightning production was linked to the
existence and location of vertical instability in the
lower, warmer part of the convective cloud; the specific
criteria for which are discussed later within the context
of this case. Damaging winds were also associated with
the convective systems examined by van den Broeke
et al. (2005), although on a more widespread basis (suf-
ficient to be classified as a derecho; see Corfidi et al.
2006) than what is seen with the present case. Instead, it
was the whiteout conditions (albeit brief), brought on by
the combination of wind meeting the criterion for a
severe thunderstorm (coincident with lightning) and
falling snow, that makes this case important.
3. Data
Surface and upper-air observations form the founda-
tion of this paper, with special emphasis on radiosonde
observations at 1200 UTC 11 February 2003 and 0000
UTC 12 February 2003. For synoptic analysis, these
upper-air data were fit to a 150-km grid via objective
analysis using the Barnes (1973) objective analysis ap-
proach. To understand the storm-scale structure, addi-
tional observed data employed were the Weather Sur-
veillance Radar-1988 Doppler (WSR-88D) level II data
from the radars at ILX and Davenport, Iowa (DVN).
Lightning flash information were taken from Vaisala’s
National Lightning Detection Network; this network
had a median location accuracy of 500 m and a detec-
tion efficiency of 85%–90% in the region of study
(Cummins et al., 1998).
Rapid Update Cycle initial field analyses were used
for some synoptic, meso-a, and meso-b diagnostic
variables. The RUC is well established in the opera-
tional community as a means of high-resolution analysis
and short-term forecasting (Benjamin et al. 2004a,b).
Analysis from the RUC came from only one run at one
time, but different scales were employed for different
purposes. The 80-km RUC initial field was used spe-
cifically for diagnostic variables using geostrophic as-
sumptions in the synoptic analysis as suggested by
Barnes et al. (1996), the chief example being the Q-
vector diagnostic. A finer-scale 20-km RUC initial field
grid was used for mesoscale diagnostic variables that
forego the geostrophic assumption and make use of the
total wind (i.e., frontogenesis).
4. Analysis
The synoptic and mesoscale environment for 0000
UTC 12 February 2003 revealed a dynamic pattern that
was both similar and dissimilar to line-type convection.
An observational analysis of the synoptic and meso-
FEBRUARY 2009 P E T T E G R E W E T A L . 123

FIG. 1. Composites of reflectivity, and observed data (standard plotted station models) with subjective analysis of sea level pressure
(black solid contours; every 4 hPa), valid at (a) 1500, (b) 1800, and (c) 2100 UTC 11 Feb 2003, and at (d) 0000 UTC 12 Feb 2003.
124 W E A T H E R A N D F O R E C A S T I N G VOLUME 24

FIG. 1. (Continued)
FEBRUARY 2009 P E T T E G R E W E T A L . 125

scale environments provided insight into this case of
wintertime, line-type convection, including the pres-
ence of strong mass gradients at the surface and aloft
that preconditioned the convective environment to be
one with already strong wind speeds.
a. Synoptic-scale analysis
Aligned along and beneath the upper trough axis, the
cold front was depicted in the surface analyses (Figs.
1a–d) progressing from South Dakota at 1500 UTC 11
February 2003 (Fig. 1a) to northern Missouri and Illi-
nois by 0000 UTC 12 February 2003 (Fig. 1d). It is
noteworthy that the bulk of the precipitation associated
with the cold frontal zone was upstream of the surface
cold frontal boundary during the morning hours (Figs.
1a and 1b), but that the area transitioned to being im-
mediately prefrontal during the afternoon hours and
especially at the time of the thundersnow event (Figs.
1c and 1d). We also note a significant pressure gradient
ahead of the cold front in the warm sector as well as in
the cold air behind it, throughout the day and especially
over central Illinois at 0000 UTC 12 February 2003
(Fig. 1d), which supported winds of 30 kt and higher as
we shall see presently.
Indeed, surface observations at DVN (Table 1) re-
vealed the impact of this front well. At DVN, the tem-
perature had fallen 1.18C between 2154 and 2242 UTC
on 11 February while the dewpoint had risen from
25.68 to 22.88C in the same time period. This latter
behavior resulted from sublimation of falling snow as
well as moisture advection ahead of the frontal bound-
ary. The altimeter had fallen 0.02 in. during the hour
prior. Heavy snow was falling by 2245 UTC, just after
frontal passage, with sustained northwest winds at 35 kt
(18 m s21) and gusts to 43 kt (22 m s21). Several con-
ditions were indicative of an intense cold front. First
was the 33-min snow shower that began at 2216 UTC
and ended at 2259 UTC. Second, the sky cleared (below
12 000 ft) by 2354 UTC while the dewpoint dropped to
158F (29.48C). Finally, a moderate veer of 608 in wind
direction in less than an hour was tempered by the
persistence of blustery conditions behind the front. The
temperature change was gradual at first, but then ac-
celerated at sunset. A similar pattern was observed at
Peoria, Illinois (Table 1).
Observations from earlier in the day at Huron, South
Dakota (HON), also showed the passage of the cold
front (Table 1). In addition to the usual cold frontal
signatures, HON exhibited wind gusts in excess of the
severe criterion but in the absence of lightning or even
falling precipitation. Additionally, the strongest wind
gusts at all three stations came after the pressure had
ebbed and begun to rise; a similar signature was found
in the 6-min observations from Moline, Illinois (Fig. 2),
with wind gusts of 42 kt at 2318 UTC. This latter point
matches well with the pressure gradient observed in the
area near that time (Fig. 1d). Yet, no subsequent pres-
sure fall was recorded as would be expected if a meso-
high had formed in association with a typical squall line.
We shall explore the origins of such strong surface
winds in the ensuing sections.
At 0000 UTC 12 February 2003, a 300-hPa polar jet
FIG. 2. Twelve hours (0900–2100 CST) of 5-min altimeter setting values (in.) from the
Automated Surface Observing System (ASOS) at the airport in Moline, IL. Pertinent remarks
from the encoded aviation routine weather report (METAR) are annotated onto the plot.
126 W E A T H E R A N D F O R E C A S T I N G VOLUME 24

(Fig. 3) flowed southward out of central Canada with a
core centered over the Ohio Valley and wind speeds of
up to 135 kt (69 m s21). Southern Iowa and central
Illinois resided near the core of this jet streak but to-
ward the left entrance region, the latter area typically
associated with upper-level convergence (Moore and
Van Knowe 1992), which was diagnosed there (Fig. 3,
inset). While this is atypical for the ideal occurrence of
severe weather, where strong mass convergence below
and strong mass divergence aloft are preferred, other
investigators have documented similar atypical ar-
rangements (Rose et al. 2002). Nevertheless, the domi-
nance of lower- to midtropospheric forcing for ascent
was verified in this case (Fig. 3, inset).
A low-amplitude shortwave trough axis at 500 hPa
(Fig. 4) from just west of Hudson Bay, southwest
through Wisconsin, and into Kansas revealed a signifi-
cant slope into the cold air, consistent with a strong cold
front. The roughly circular absolute vorticity maximum
(20 3 1025 s21) in the base of the short-wave trough
over Lake Superior suggested quasigeostrophic forcing
for ascent downstream across eastern Iowa and north-
ern Illinois, poleward of the 300-hPa jet (Fig. 3). The Q
vectors from the 80-km RUC initial fields (Fig. 5) indi-
cated a significant area of Q-vector convergence over
central Illinois at 0000 UTC, further supporting evi-
dence for midtropospheric forcing for ascent.
Analysis of the 850-hPa data (Fig. 6) indicated a
trough axis running parallel to the surface frontal
boundary, extending from the Great Lakes into Iowa
and Missouri. Along the trough axis, dewpoint depres-
sions remained relatively low with ILX reporting a
dewpoint depression of 68C, indicating a moist environ-
ment. Other stations along the trough in Iowa, Wiscon-
FIG. 3. Observed data [standard station models; temperatures and dewpoints (8C); wind barbs and flags (kt); height (gpm)] and
objective analyses (contours) of the observed data valid at 0000 UTC 12 Feb 2003 for 300 hPa over the continental United States.
Geopotential height is contoured (every 120 gpm; black, solid), with isotachs shaded (every 20 kt, starting at 110 kt); grayscale shading
is indicated by grayscale bar left of image. Figure inset depicts the divergence (solid) and vertical motion (dashed) at 0000 UTC 12 Feb
2003 at DVN; horizontal scale represents variations in both divergence (31025 s21) and vertical motion (mb s21).
FEBRUARY 2009 P E T T E G R E W E T A L . 127

sin, and Michigan maintained dewpoint depressions of
less than 58C, revealing a more moist pretrough envi-
ronment. Temperatures behind the 850-hPa trough
dropped drastically, suggesting a front at this level.
Thus, there is evidence that prefrontal moisture and a
frontal lifting mechanism were present at this level. Of
particular interest here are the wind speeds, which were
also faster at ILX (57 kt) and DVN (66 kt) at this level
than at any other station.
b. Mesoscale analysis
Initial fields from the 20-km RUC were used to ex-
amine the mesoscale environment prior to and at the
time of this event. Plots of low-level (925 hPa) fronto-
genesis and vertical motion as well as the convective
available potential energy (CAPE) based upon a parcel
with the mean characteristics of the lowest 50-hPa layer
revealed an environment with the necessary ingredients
for convection, albeit shallow. At 2100 UTC 11 Febru-
ary 2003 (Fig. 7a), 925-hPa frontogenesis was found
along and behind the location of the surface cold front.
Significant areas had frontogenesis values .5.0 K (100
km)21 (3 h)21, and there was a significant region along
the frontal zone where v values were less than 210 and
even 215 mb s21. In addition, CAPE values (nonexis-
tent in the region as recently as 1800 UTC) blossomed
and were maximized in area and magnitude, exceeding
50 J kg21 over a large area coincident with the area
where v values #210 mb s21. This arrangement agrees
well with the bulk of the precipitation being immedi-
ately along and ahead of the surface frontal zone at this
time (Fig. 1c).
Hourly analyses showed much the same pattern, al-
though the CAPE values showed a gradual decrease in
area and magnitude, with only a small area of values
.10 J kg21 in evidence by 0000 UTC 12 February 2003
(Fig. 7b). However, the 925-hPa frontogenesis had in-
creased substantially, with a closed contour of values in
excess of 10.0 K (100 km)21 (3 h)21 over extreme
southeastern Iowa. Vertical motion values of 220 mb
s21 were collocated with the small area of CAPE
(Fig. 7b) and the region ahead of the cold front where
FIG. 4. Observed data (standard station models) and objective analyses (contours) of observed data valid at 0000 UTC 12 Feb 2003
for 500 hPa over the continental United States. Geopotential height (every 60 gpm; black, solid) and absolute vorticity (every 2 3 1025
s21; shaded over 10 3 1025 s21); grayscale shading is indicated by the grayscale bar left of image.
128 W E A T H E R A N D F O R E C A S T I N G VOLUME 24

precipitation was occurring (Fig. 1d) and whiteout
conditions were being experienced. Together, the
analyses in Fig. 7 depict a dynamically forced region of
ascent immediately along and ahead of the surface cold
front capable of raising near-surface parcels to their
lifting condensation level (LCL) and realizing modest
amounts of CAPE.
Cross-section analysis revealed a zone of frontogen-
esis (Fig. 8) that sloped upward and northward, running
roughly parallel to the 280-K ue contour. Above and to
the south of the frontogenesis maximum was a narrow
upward vertical velocity maximum (,230.0 mb s21),
which was complemented by the rather broad, sloping
area of descent behind the surface frontal zone. These
analyses demonstrate that a significant direct thermal
circulation was likely because of the strong frontoge-
netic forcing. In addition to the convective instability
diagnosed along the surface frontal zone, these RUC
grids also depicted relatively deep (;100 hPa) dry-
adiabatic layers along and just ahead of the surface
frontal zone (Fig. 9), thus providing little inhibition for
parcels to be lifted to their LCL. While the synoptic
setting has already been shown to be capable of sup-
porting sustained surface winds .25 kt (12.8 m s21)
and .50 kt (25.7 m s21) at 850 hPa, these mesoscale
analyses establish the lower troposphere as a region
conducive to vertical mixing.
5. Sounding analysis
a. Lincoln, Illinois
We begin by examining the soundings from ILX,
both of which flew on the day in question in the warm
air ahead of the advancing cold front. ILX received a
5.3-cm (2.1 in.) snowfall early on 11 February 2003 and
the 1200 UTC sounding (Fig. 10) flew near the end of
the overnight snowfall under mostly cloudy sky condi-
tions. Very cold temperatures existed in the lowest 100
hPa. The wind profile revealed significant veering in
the lowest 100 hPa, with a weakly sheared unidirec-
tional flow throughout much of the troposphere above
the boundary layer.
FIG. 5. The Q vectors and Q-vector divergence in the 400–700-hPa layer from the thinned 80-km RUC initial fields
valid at 0000 UTC 12 Feb 2003. The Q vectors are in black vector form while negative values of the Q-vector
divergence are contoured (every 2 3 10214 s23 hPa21; black, dashed). Observations from several stations discussed in
the text (HON, DVN, MLI, PIA, and ILX) are also identified and located in this figure.
FEBRUARY 2009 P E T T E G R E W E T A L . 129

Analysis of the subsequent sounding at 0000 UTC 12
February 2003 revealed a much warmer, moister envi-
ronment in the lowest 200 hPa (Fig. 10). This sounding
flew in the warm air 100 km in advance of the surface
frontal zone (note the weaker but persistent warm ad-
vection signature in the lower troposphere). However,
surface temperatures were damped by the early eve-
ning flight time as well as the persistent snow field still
on the ground at that time. Standard analysis of CAPE
for a mean parcel from the lowest 100 hPa yielded a
null value. The CAPE based upon the most unstable
parcel lifted from 862 hPa produced a meager 3 J kg21,
although it is noteworthy that the atmospheric profile
was nearly dry adiabatic from that level up to ;625
hPa.
b. Davenport, Iowa
As with the morning sounding at ILX, the flight from
DVN at 1200 UTC 11 February 2003 was also well
ahead of the advancing cold front and also exhibited
very cold air near the surface (Fig. 11). The wind profile
at the time had a similar unidirectional shear signature
to that at ILX (Fig. 10). Also in parallel with the ILX
flights, the DVN sounding at 0000 UTC 12 February
2003 exhibited significant 12-h warming in the lowest
200-hPa layer along with 12-h moistening in the lowest
100 hPa (Fig. 11). In contrast to the ILX evolution (Fig.
10), the DVN atmosphere also exhibited cooling and
significant drying in the midtroposphere (700–500-hPa
layer), which encouraged the creation of potential in-
stability.
We also note that the DVN sounding at 0000 UTC 12
February 2003 (Fig. 11) was launched as the precipita-
tion band approached. As a result, surface tempera-
tures were changing rapidly, and the unadjusted sound-
ing suggested a superadiabatic surface layer. The 0000
UTC DVN sounding shown here (Fig. 11) requires ad-
justment of the surface ambient and dewpoint tempera-
tures, determined by extrapolating the lapse rate in the
925–975-hPa layer down to the surface (980 hPa).
These corrections yielded a nearly dry-adiabatic surface
layer beneath the frontal inversion based at 892 hPa.
Above the inversion, the atmosphere was conditionally
FIG. 6. Observed data (standard station models) and objective analyses (contours) of observed data valid at 0000 UTC 12 Feb 2003
for 850 hPa over the continental United States. Geopotential height (every 60 gpm; black, solid) and temperature (every 58C; black,
dashed) are both contoured.
130 W E A T H E R A N D F O R E C A S T I N G VOLUME 24

unstable in a layer from 850 to 687 hPa. Correspond-
ingly, the most unstable parcel originates from the
826-hPa level, but yielded a minor CAPE value of only
3 J kg21.
The preceding analysis depicts a strongly forced, low-
instability situation of the kind described by van den
Broeke et al. (2005). Additionally, experiments with an
adjusted DVN sounding from 0000 UTC 12 February
FIG. 7. The 20-km RUC analysis at 925 hPa of Petterssen frontogenesis [every 5 K (100 km)21
(3 h)21; black, solid], v vertical velocity (every 5 mb s21; black, dashed), and CAPE for the
mean parcel in the lowest 50 hPa (shaded every 20 J kg21 above 10 J kg21; grayscale shading is
indicated by the grayscale bar left of image) for (a) 2100 UTC 11 Feb 2003 and (b) 0000 UTC
12 Feb 2003. Dark solid line in (b) represents the cross-section line used in Fig. 8.
FEBRUARY 2009 P E T T E G R E W E T A L . 131

2003 failed to yield significant CAPE. Figure 12 depicts
one such adjusted DVN sounding from 0000 UTC 12
February 2003, where the surface temperature and
dewpoint reflect those from DVN at 2200 UTC 11 Feb-
ruary 2003 (1–2 h prior to the radiosonde launch). Also,
the boundary layer has been adjusted to a well-mixed,
dry-adiabatic condition in the lowest 50 hPa, and tem-
peratures have been warmed by 18C above the inver-
sion level to 700 hPa (to offset the demonstrated cool-
ing between the morning and evening balloon ascents),
with subsequent superadiabatic layers removed. These
changes are made in order to approximate warm air
immediately ahead of the surface frontal zone. This
idealized sounding produced only 169 J kg21 of CAPE
(for a parcel from the lowest 50 hPa). Yet, the resulting
sounding possessed CAPE in excess of 100 J kg21, a
lifting condensation level with a temperature warmer
than 2108C, and a relatively low equilibrium level (592
hPa) colder than 2208C. These conditions are all
FIG. 8. Cross-section analysis from 20-km RUC initial fields valid at 0000 UTC 12 Feb 2003 showing equivalent potential temperature
(every 2 K; solid black), v vertical velocity (5, 0, 210, 220, and 230 mb s21; dashed), and Petterssen frontogenesis [1, 3, 5, and 7 K (100
km)21 (3 h)21; shaded], along a line from Rice Lake, WI (RPD), to Paducah, KY (PAH), which is shown in boldface in Fig. 7b.
FIG. 9. Virtual potential temperature profile of the lower tro-
posphere from the RUC 20-km initial field at 0000 UTC 12 Feb
2003 for DVN, with wind barbs on right (kt).
132 W E A T H E R A N D F O R E C A S T I N G VOLUME 24

FIG. 10. Skew T–logp plots of observed sounding data for ILX at 1200 UTC 11 Feb 2003
[temperature and dewpoint temperature (8C); both solid] and 0000 UTC 12 Feb 2003 [tem-
perature and dewpoint temperature (8C); both dashed]. On the right, winds (kt) are plotted
for the 1200 UTC 11 Feb 2003 sounding (immediately right of plot) and the 0000 UTC 12 Feb
2003 sounding (at far right).
FIG. 11. Skew T–logp plots of observed sounding data for DVN at 1200 UTC 11 Feb 2003
[temperature and dewpoint temperature (8C); both solid] and 0000 UTC 12 Feb 2003 [tem-
perature and dewpoint temperature (8C); both dashed]. On the right, winds (kt) are plotted
for the 1200 UTC 11 Feb 2003 sounding (immediately right of plot) and the 0000 UTC 12 Feb
2003 sounding (at far right).
FEBRUARY 2009 P E T T E G R E W E T A L . 133

thought necessary for the creation of lightning (van den
Broeke et al. 2005). Moreover, winds were free to mix
down in the lowest 50 hPa (and perhaps from as high as
892 hPa), a layer that contained winds in excess of 50 kt.
6. Storm-scale analysis
a. Radar analysis
WSR-88D data in Iowa and Illinois were examined to
evaluate the characteristics of this line and contrast it
with its warm season counterparts, the more common
rain and severe weather producing squall lines. The
strongest radar reflectivities in this case were located
along a line parallel to the fast-moving surface cold
front (Fig. 13a). Throughout the lifetime of the event,
maximum reflectivities averaged between 40 and 45
dBZ. Storm tops never exceeded 3.7 km, and the high-
est reflectivities were limited to the lower portions of
the strongest cells. Little change in radar characteristics
was noted overall (Fig. 13b), except that maximum re-
flectivities were more widespread in areal coverage as
the line reached extreme eastern Iowa into northern
and central Illinois during the late afternoon and early
evening.
The convective line in this case showed none of the
characteristics of traditional severe-weather-producing
squall lines based on an analysis of radar reflectivity
and velocity data. There was no rear-inflow jet, strati-
form precipitation region, or front-to-rear flow as de-
scribed by Smull and Houze (1987) and Houze et al.
(1989). Nor did this line evolve through the stages of
squall-line evolution as described by Rasmussen and
Rutledge (1993). What we see instead is a convective
line along the cold frontal zone that most closely re-
sembled the parallel stratiform mesoscale convective
system (MCS) archetype of Parker and Johnson (2000).
Yet, during the period when severe weather was occur-
ring (and several hours before and after), the system
studied here did not assume the life cycle suggested by
Parker and Johnson (2000), where an expanding area of
FIG. 12. Modified DVN sounding for 0000 UTC 12 Feb 2003. Changes include surface temperature (8C) and dewpoint (8C) from the
2200 UTC 11 Feb 2003 DVN ASOS, as well as a well-mixed, dry-adiabatic environment in the lowest 50 hPa. Temperatures between
the 0000 UTC sounding inversion top (826 hPa) and 700 hPa have been warmed by 18C. Superadiabatic layers have been removed.
134 W E A T H E R A N D F O R E C A S T I N G VOLUME 24

stratiform precipitation would exist on the left flank of
the line. Not only did the stratiform region not develop,
but there was no tendency for cell decay on the left
flank or new cell generation on the right as would be
expected with the parallel stratiform MCS archetype.
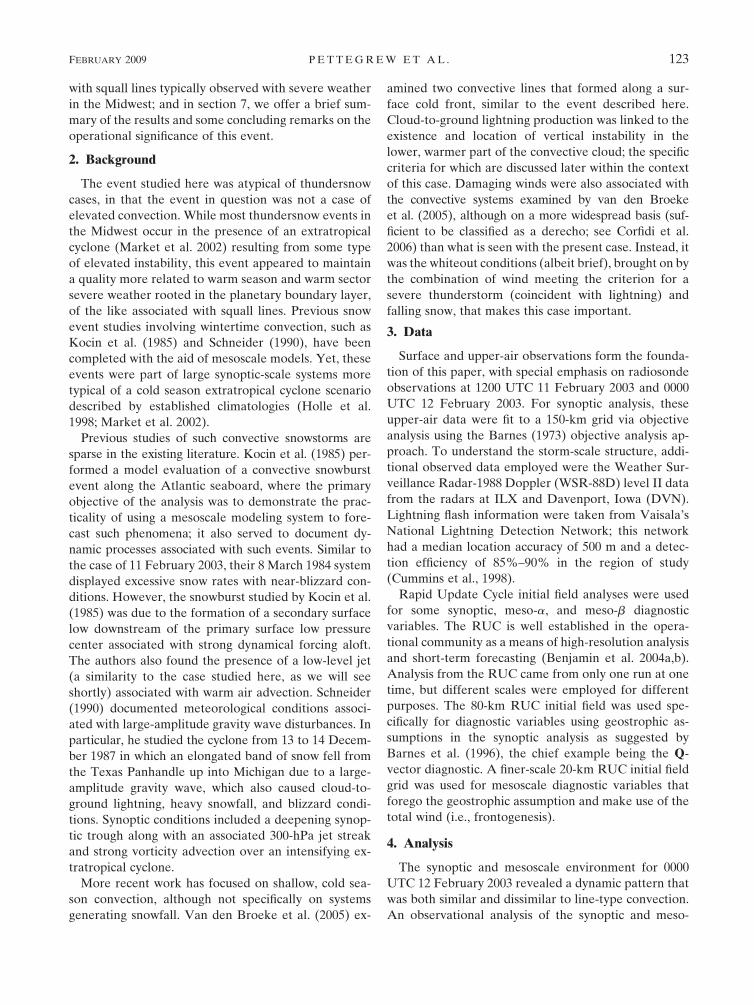
Moreover, the convective line was found to tilt slightly
down shear (Fig. 13c), a condition corroborated by the
velocity cross section (Fig. 13d), and which persisted
through the decay of this line, likely due to a lack of
sufficient CAPE ahead of the front and the convective
line, and the strong ambient vertical wind shear (e.g.,
Weisman 1993). Thus, the severe winds were not the
result of squall-line convection but rather of the vertical
mixing associated with the mesoscale and synoptic-
scale systems.
b. Lightning analysis
While the analysis of lightning data does not shed
light on the origin of the severe thunderstorm winds, it
does show clearly the temporal and spatial extents of
the thunderstorm activity. Moreover, the ensuing
analysis is unique in that it represents relatively rare
documentation of lightning behavior in a continental
winter precipitation thunderstorm event. Indeed,
storms producing snow and lightning of the nature of
this event are rare, and our purpose here is to document
the lightning characteristics of this snow and severe-
wind-producing squall line. Finally, the operational util-
ity of this analysis will be established in the cross sec-
tions to be discussed presently, showing the means by
which forecasters might better anticipate lightning in
such an event.
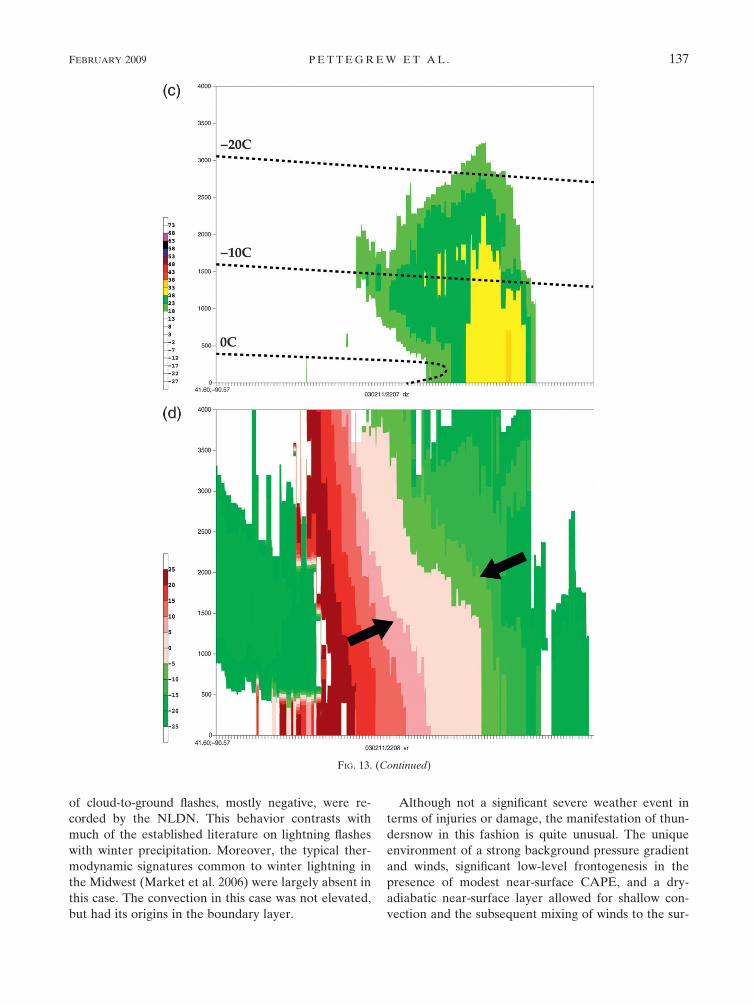
A total of 101 cloud-to-ground (CG) flashes were
detected in the region by Vaisala’s National Lightning
Detection Network (NLDN) during an 8-h period be-
tween 1900 UTC 11 February 2003 and 0300 UTC 12
February 2003 (Fig. 14). Grouped into 2-h bins, the
lightning data showed well the progression of the con-
vective line toward the southeast. Analysis of these
NLDN data showed that only 4 of the 101 flashes were
of positive polarity, the mean peak current being 217.4
kA, with a standard deviation of 618.5 kA. The nega-
tive CG flashes had a median multiplicity (the number
of CG return strokes detected within a particular flash)
of 2 and a range of 1–14 in this event sample. The
positive flashes had low multiplicity values of 1 (two
cases) and 2 (two cases), and a maximum peak current
value of 132 kA. The 26 flashes that occurred in the
area of severe wind reports between 2300 UTC 11 Feb-
ruary 2003 and 0100 UTC 12 February 2003 were all
negative CG flashes.
That these lightning flashes predominantly lowered a
negative charge to ground stands in contrast to the
larger body of work on winter lightning (e.g., Takeuti et
al. 1978; Brook et al. 1982), most of which had been
conducted in Japan. The historical research focus on
western Japan has yielded a robust body of work (see
Rakov and Uman 2003 for a thorough review) with an
emphasis on surface-influenced events that are akin to
those that form downstream of the North American
Great Lakes. Also, our results differed from the find-
ings of Holle and Watson (1996), who studied two cen-
tral United States storms that exhibited lightning with
winter precipitation and found lightning behavior simi-
lar to that on the east coast of Asia, where the dominant
polarity detected is positive.
Yet, these results do tend to corroborate the hypoth-
esis of Taniguchi et al. (1982) and Brook et al. (1982)
that shear in the cloud layer may have some control
over the polarity of a given lightning flash. A look at the
nearby soundings (Figs. 10 and 11) suggests a fairly
uniform speed and directional shear profile throughout
the cloud layer, allowing for a more erect convective
column, which is thought to be more conducive to nega-
tive flashes. Moreover, the cross-section analysis of the
radar data from the Lincoln, Illinois, WSR-88D (Figs.
13c and 13d) supports this view as well. With RUC
temperatures superimposed onto the cross section, we
can visualize the region where temperatures exceeded
2108C, from which unstable parcels originated and
rose to their LCL at ;1100 m (also warmer than
2108C; see Figs. 10 and 12). Reflectivity values of 20
dBZ extended above the 2208C level at ;2800 m (Fig.
13c), consistent with the modified sounding for DVN
(Fig. 12) suggesting an equilibrium level above the
2208C level.
7. Summary
On the evening of 11 February 2003, a line of severe
thunderstorms moved across northern and central Illi-
nois bringing high winds and blinding snowfall at rates
of up to several inches per hour. Spawned along the
leading edge of a cold front, the resulting line of low-
topped convection had its roots in the boundary layer.
A 20-km RUC analysis supported the formation of con-
vection along the cold front through a dry-adiabatic
layer within the PBL, with a layer of potential instabil-
ity above, which is largely consistent with observations
taken at the time of the event. The bulk of the severe
weather came just after sunset as the convective line
moved southward.
The thermodynamic profile, while conducive to light-
ning production, was also cold enough to support snow-
fall, thus culminating in a severe thunderstorm with
snow. In support of the spotter observations, a number
FEBRUARY 2009 P E T T E G R E W E T A L . 135

FIG. 13. Plots of WSR-88D radar base reflectivity for (a) the 0.518 tilt from DVN at 2207 UTC 11 Feb 2003, (b) the 0.48 tilt from ILX
at 0045 UTC 12 Feb 2003, (c) a cross-section plot of reflectivity (dBZ; see color bar on left) for the DVN radar at 2207 UTC 11 Feb
2003 along the line depicted in (a), and d) a cross-section plot of base velocity (m s21; see color bar on left) for the DVN radar at 2207
UTC 11 Feb 2003 also along the line depicted in (a). Included in (c) are temperatures (every 108C; dashed) from the RUC initial fields
valid at 2200 UTC 11 Feb 2003. Boldfaced arrows in (d) approximate flow along a radial.
136 W E A T H E R A N D F O R E C A S T I N G VOLUME 24
of cloud-to-ground flashes, mostly negative, were re-
corded by the NLDN. This behavior contrasts with
much of the established literature on lightning flashes
with winter precipitation. Moreover, the typical ther-
modynamic signatures common to winter lightning in
the Midwest (Market et al. 2006) were largely absent in
this case. The convection in this case was not elevated,
but had its origins in the boundary layer.
Although not a significant severe weather event in
terms of injuries or damage, the manifestation of thun-
dersnow in this fashion is quite unusual. The unique
environment of a strong background pressure gradient
and winds, significant low-level frontogenesis in the
presence of modest near-surface CAPE, and a dry-
adiabatic near-surface layer allowed for shallow con-
vection and the subsequent mixing of winds to the sur-
FIG. 13. (Continued)
FEBRUARY 2009 P E T T E G R E W E T A L . 137
face in excess of the severe criterion. As such, our
analysis has also demonstrated that a severe thunder-
storm warning was the best response to an event of this
nature.
Since the character of this event was unique com-
pared to squall lines more commonly associated with
those producing severe convective winds, but also did
not quite fit the mesoscale or synoptic-scale paradigms,
the forecaster had to judge which vehicle (SVR or
HWW) would illicit the most appropriate response to
the hazard. In this case, the forecaster selected the
SVR. There is much logic to this choice. The fast-
moving nature of the line, the rapid onset and decrease
of severe winds, and the spatial scale affected most
closely resembles the impact from a severe warm sea-
son squall line rather than either a high wind event due
to the synoptic-scale pressure gradient or a mesoscale
wake low event. Since the convective line in this case
was producing lightning, albeit in limited amounts,
these were indeed thunderstorms. The main difference
from the warm season counterpart would have been the
snow and blowing snow creating near-zero visibilities
and travel impacts, and this could easily have been
mentioned in the text of the SVR.
Acknowledgments. This work is supported in part by
the National Science Foundation (NSF), Award ATM-
0239010. Any opinions, findings, conclusions, or recom-
mendations expressed herein are those of the author(s)
and do not necessarily reflect the views of NSF. The
authors also wish to express their gratitude to Mr. Jo-
seph Clark for his help with GIS and the drafting of
several figures, and to Steve Lack for his help with the
processing of WSR-88D level II data. Also, we thank
three anonymous reviewers whose efforts helped to im-
prove the final manuscript. Finally, Rapid Update
Cycle data were obtained from the Atmospheric Ra-
diation Measurement (ARM) Program sponsored by
the U.S. Department of Energy, Office of Science, Of-
fice of Biological and Environmental Research, Envi-
ronmental Sciences Division.
REFERENCES
Barnes, S. L., 1973: Mesoscale objective map analysis using
weighted time-series observations. NOAA Tech. Memo.
ERL NSSL-62, National Severe Storms Laboratory, Norman,
OK, 60 pp.
——, F. Caracena, and A. Marroquin, 1996: Extracting synoptic-
scale diagnostic information from mesoscale models: The Eta
Model, gravity waves, and quasigeostrophic diagnostics. Bull.
Amer. Meteor. Soc., 77, 519–528.
Benjamin, S. G., G. A. Grell, J. M. Brown, T. G. Smirnova, and R.
Bleck, 2004a: Mesoscale weather prediction with the RUC
hybrid isentropic–terrain-following coordinate model. Mon.
Wea. Rev., 132, 473–494.
——, and Coauthors, 2004b: An hourly assimilation–forecast
cycle: The RUC. Mon. Wea. Rev., 132, 495–518.
Brook, M., M. Nakano, P. Krehbiel, and T. Takeuti, 1982: The
electrical structure of the Hokuriku winter thunderstorms. J.
Geophys. Res., 87, 1207–1215.
FIG. 14. A CG lightning flash summary plotted from 1900 UTC 11 Feb through 0300 UTC 12 Feb
2003 using flash data from the NLDN.
138 W E A T H E R A N D F O R E C A S T I N G VOLUME 24

Corfidi, S. F., S. J. Corfidi, D. A. Imy, and A. L. Logan, 2006: A
preliminary study of severe wind-producing MCSs in envi-
ronments of limited moisture. Wea. Forecasting, 21, 715–734.
Cummins, K. L., M. J. Murphy, E. A. Bardo, W. L. Hiscox, R. B.
Pyle, and A. E. Pifer, 1998: A combined TOA/MDF technol-
ogy upgrade of the U.S. National Lightning Detection Net-
work. J. Geophys. Res., 103, 9035–9044.
Holle, R. L., and A. I. Watson, 1996: Lightning during two central
U. S. winter precipitation events. Wea. Forecasting, 11, 599–
614.
——, J. V. Cortinas Jr., and C. C. Robbins, 1998: Winter thunder-
storms in the United States. Preprints, 16th Conf. on Weather
Analysis and Forecasting, Phoenix, AZ, Amer. Meteor. Soc.,
298–300.
Houze, R. A., Jr., S. A. Rutledge, M. I. Biggerstaff, and B. F.
Smull, 1989: Interpretation of Doppler weather radar dis-
plays of midlatitude mesoscale convective systems. Bull.
Amer. Meteor. Soc., 70, 608–619.
Kocin, P. J., L. W. Uccellini, J. W. Zack, and M. L. Kaplan, 1985:
A mesoscale numerical forecast of an intensive convective
snowburst along the East Coast. Bull. Amer. Meteor. Soc., 66,
1412–1424.
Market, P. S., C. E. Halcomb, and R. L. Ebert, 2002: A climatol-
ogy of thundersnow events over the contiguous United
States. Wea. Forecasting, 17, 1290–1295.
——, and Coauthors, 2006: Proximity soundings of thundersnow
in the central United States. J. Geophys. Res., 111, D19208,
doi:10.1029/2006JD007061.
Moore, J. T., and G. E. VanKnowe, 1992: The effect on jet-streak
curvature on kinematic fields. Mon. Wea. Rev., 120, 2429–2441.
Parker, M. D., and R. H. Johnson, 2000: Organizational modes of
midlatitude mesoscale convective systems. Mon. Wea. Rev.,
128, 3413–3436.
Rakov, V. A., and M. A. Uman, 2003: Lightning: Physics and Ef-
fects. Cambridge University Press, 687 pp.
Rasmussen, E. N., and S. A. Rutledge, 1993: Evolution of quasi-
two-dimensional squall lines. Part I: Kinematic and reflectiv-
ity structure. J. Atmos. Sci., 50, 2584–2606.
Rose, S. R., P. V. Hobbs, J. D. Locatelli, and M. T. Stoelinga,
2002: Use of a mesoscale model to forecast severe weather
associated with a cold front aloft. Wea. Forecasting, 17, 755–
773.
Schneider, R. S., 1990: Large-amplitude mesoscale wave distur-
bances within the intense Midwest extratropical cyclone of 15
December 1987. Wea. Forecasting, 5, 533–558.
Smull, B. F., and R. A. Houze Jr., 1987: Rear inflow in squall lines
with trailing stratiform precipitation. Mon. Wea. Rev., 115,
2869–2889.
Takeuti, T., M. Nakano, M. Brook, D. J. Raymond, and P. Kreh-
biel, 1978: The anomalous winter thunderstorms of the
Hokuriku coast. J. Geophys. Res., 83, 2385–2394.
Tam, F., 1982: Snowrollers. Weatherwise, 35, 276–277.
Taniguchi, T., C. Magona, and T. Endoh, 1982: Charge distribu-
tion in active winter clouds. Res. Lett. Atmos. Electricity, 2,
35–38.
van den Broeke, M. S., D. M. Schultz, R. H. Johns, J. S. Evans,
and J. E. Hales, 2005: Cloud-to- ground lightning production
in strongly forced, low-instability convective lines associated
with damaging wind. Wea. Forecasting, 20, 517–530.
Weisman, M. L., 1993: The genesis of severe, long-lived bow
echoes. J. Atmos. Sci., 50, 645–670.
FEBRUARY 2009 P E T T E G R E W E T A L . 139