Embed Size (px)
Citation preview
Concerned Rentech Shareholders
A Case Study in Agency Costs
March 27, 2014
Concerned Rentech Shareholders
2
Disclaimer
THIS DOCUMENT IS FOR DISCUSSION AND GENERAL INFORMATIONAL PURPOSES ONLY. IT DOES NOT HAVE REGARD TO THE SPECIFIC
INVESTMENT OBJECTIVE, FINANCIAL SITUATION, SUITABILITY, OR THE PARTICULAR NEED OF ANY SPECIFIC PERSON WHO MAY RECEIVE IT,
AND SHOULD NOT BE TAKEN AS ADVICE ON THE MERITS OF ANY INVESTMENT DECISIONS. THIS DOCUMENT IS NOT AN OFFER TO SELL OR THE
SOLICITATION OF AN OFFER TO BUY INTERESTS IN A FUND OR INVESTMENT VEHICLE MANAGED BY ENGAGED CAPITAL LLC (“ENGAGED”) AND
IS BEING PROVIDED TO YOU FOR INFORMATIONAL PURPOSES ONLY. THIS DOCUMENT IS NOT (AND SHOULD NOT BE RELIED ON AS) LEGAL,
TAX, OR INVESTMENT ADVICE. AN OFFERING OF INTERESTS IN A FUND WILL BE MADE ONLY BY MEANS OF A CONFIDENTIAL PRIVATE
OFFERING MEMORANDUM AND ONLY TO QUALIFIED INVESTORS IN JURISDICTIONS WHERE PERMITTED BY LAW.
FIGURES PROVIDED HEREIN ARE ROUNDED AS APPLICABLE AND ARE IN THOUSANDS UNLESS INDICATED OTHERWISE. CERTAIN
INFORMATION CONTAINED HEREIN CONSTITUTES FORWARD-LOOKING STATEMENTS. THESE FORWARD-LOOKING STATEMENTS ARE HIGHLY
SPECULATIVE AND REPRESENT THE OPINIONS OF ENGAGED AND/OR ITS PRINCIPALS, WHOSE OPINIONS MAY CHANGE. THERE IS NO
GUARANTEE THAT SUCH FORWARD-LOOKING STATEMENTS WILL OCCUR. DUE TO THE VARIOUS RISKS AND UNCERTAINTIES, ACTUAL EVENTS
OR RESULTS OR ACTUAL PERFORMANCE OF INVESTMENTS MAY DIFFER MATERIALLY FROM THOSE REFLECTED OR CONTEMPLATED IN SUCH
FORWARD-LOOKING STATEMENTS. IN ADDITION, A PORTION OF THE INFORMATION CONTAINED HEREIN INCLUDES OPINIONS, STATEMENTS,
ESTIMATES AND ANALYSIS BASED ON THE INVESTMENT MODELS, PREDICTIONS, AND ASSUMPTIONS THAT ARE PROPRIETARY TO ENGAGED
AND/OR ITS PRINCIPALS. THERE IS NO GUARANTEE WITH RESPECT TO THE ACCURACY OR COMPLETENESS OF SUCH OPINIONS,
STATEMENTS, ESTIMATES, MODELS, PREDICTIONS, AND ASSUMPTIONS. TO THE EXTENT THESE OPINIONS, STATEMENTS, ESTIMATES,
MODELS, PREDICTIONS, AND ASSUMPTIONS ARE NOT CORRECT OR COMPLETE, ACTUAL EVENTS AND OUTCOMES MAY VARY SUBSTANTIALLY
FROM THOSE SHOWN.
CERTAIN INFORMATION CONTAINED HEREIN HAS BEEN OBTAINED FROM PUBLISHED AND NON-PUBLISHED SOURCES AND HAS NOT BEEN
INDEPENDENTLY VERIFIED BY ENGAGED, WHO DOES NOT ASSUME RESPONSIBILITY FOR THE ACCURACY OR COMPLETENESS OF SUCH
INFORMATION. ENGAGED HAS NOT SOUGHT OR OBTAINED CONSENT FROM ANY THIRD PARTY TO USE ANY STATEMENTS OR INFORMATION
INDICATED HEREIN AS HAVING BEEN OBTAINED OR DERIVED FROM STATEMENTS MADE OR PUBLISHED BY THIRD PARTIES. ANY SUCH
STATEMENTS OR INFORMATION SHOULD NOT BE VIEWED AS INDICATING THE SUPPORT OF SUCH THIRD PARTY FOR THE VIEWS EXPRESSED
HEREIN. NO WARRANTY IS MADE THAT DATA OR INFORMATION, WHETHER DERIVED OR OBTAINED FROM FILINGS MADE WITH THE SEC OR
FROM ANY THIRD PARTY, ARE ACCURATE. THERE IS NO OBLIGATION TO UPDATE THE MATERIALS HEREIN. ENGAGED RESERVES THE RIGHT
TO CHANGE ANY OF ITS OPINIONS EXPRESSED HEREIN AT ANY TIME AS IT DEEMS APPROPRIATE.
NO AGREEMENT, ARRANGEMENT, COMMITMENT OR UNDERSTANDING EXISTS OR SHALL BE DEEMED TO EXIST BETWEEN OR AMONG
ENGAGED AND ANY THIRD PARTY OR PARTIES BY VIRTUE OF FURNISHING THIS DOCUMENT. NEITHER THIS DOCUMENT NOR ANY
INFORMATION CONTAINED HEREIN MAY BE PUBLISHED OR DISTRIBUTED IN ITS CURRENT OR ANY MODIFIED FORM WITHOUT THE PRIOR
WRITTEN AUTHORIZATION OF ENGAGED. BY ACCEPTING THIS DOCUMENT, YOU ACKNOWLEDGE AND AGREE THAT ALL OF THE INFORMATION
CONTAINED IN THIS DOCUMENT SHALL BE KEPT STRICTLY CONFIDENTIAL BY YOU.
Concerned Rentech Shareholders
Table of Contents
Executive Summary 5 - 11
Rentech’s Operations
Alternative Energy: Big ambition, zero success 12 - 17
East Dubuque: Break-even plant became a “piggybank” 18 - 22
Agrifos: An expensive acquired “headache” 23 - 29
Pellet Projects: High execution risk, minimal expertise 30 - 37
Cost Structure: The principal/agent problem 38 - 54
Executive Compensation: Excessive pay for under-performance 55 - 61
The Path Forward 62 - 70
Our Nominees 71 - 75
Appendix 76 - 91
3

Concerned Rentech Shareholders
Concerned Rentech Shareholders (“CRS”)
Engaged Capital, LLC, (“Engaged Capital”) was established in 2012 by a group of professionals with
significant experience in activist investing in North America and was seeded by Grosvenor Capital
Management, L.P., one of the oldest and largest global alternative investment managers. Engaged
Capital is a limited liability company owned by its principals and formed to create long-term
shareholder value by bringing an owner’s perspective to the managements and boards of under-
valued public companies. Engaged Capital manages both a long-only and long/short North American
equity fund. Engaged Capital’s efforts and resources are dedicated to a single investment style,
“Constructive Activism” with a focus on delivering superior, long-term, risk-adjusted returns for
investors. Engaged Capital is based in Newport Beach, California.
Lone Star Value Management, LLC (“Lone Star Value”) is an investment firm that invests in
undervalued securities and engages with its portfolio companies in a constructive way to help
maximize value for all shareholders. Lone Star Value was founded by Jeff Eberwein who was formerly
a Portfolio Manager at Soros Fund Management and Viking Global Investors. Lone Star Value is
based in Old Greenwich, CT.
4
Concerned Rentech Shareholders
Executive Summary:
Our History With Rentech (“RTK”)
CRS has been a large shareholder of RTK since 2012 (currently owns 4.7%)
Since late 2012, CRS has been in active dialogue with management, and
more recently the Board, regarding various ways to improve shareholder
returns
Our decision to nominate four highly qualified candidates to RTK’s Board in
2014 was truly a “last resort” after over twelve months of fruitless
communications
We are aware that the Board is actively interviewing other director candidates
of its choosing while at the same time refusing to communicate with CRS on
Board composition or consider our candidates
We believe the Board is not concerned with its fiduciary duty but is instead
seeking to further entrench itself at the expense of RTK’s shareholders
5

Concerned Rentech Shareholders
Executive Summary:
Our Concerns With RTK
Long track record of value destructive capital allocation and poor operational
execution including:
Spending close to $500 million on the failed alternative energy strategy
Purchasing Agrifos for ~$160 million while fertilizer prices were near an all-time high
Current stated strategy involves continuing to raise and deploy significant
additional capital
Wasteful cost structure exemplified by excessive executive compensation
Industrial/Materials firm headquartered in West Los Angeles
Corporate overhead is 23% of sales, close to ~$400K/head
Under current CEO, RTK has underperformed peers by over 250% while executive
compensation remains in the top quartile of RTK’s peer group
Current leadership is a legacy of the Company’s failed alternative energy
venture
6
Concerned Rentech Shareholders
Operational Changes
Reduce corporate overhead costs
Develop a credible plan to fix Agrifos and limit inventory risk going forward
Independently evaluate the best risk-adjusted path to grow wood assets
Realize maximum value for shareholders from wood assets, including a
possible MLP or spin-off
Strategic Changes
Seek to elect CRS’ four highly qualified nominees to the Board
Align executive compensation with drivers of shareholder value
Establish a disciplined capital allocation program that will deliver the best
risk-adjusted returns, not growth at any cost
Explore all value enhancing alternatives that could benefit shareholders
independent of management, including sale of assets and/or tax plan
Executive Summary:
Our Plan for RTK
7

Concerned Rentech Shareholders
Opportunity Current Leadership’s Approach Why Shareholder Representation is Needed
Reduce
corporate
costs
• Maintain bloated cost structure
• Excessive compensation
• Plans to grow into cost structure require
~9x increase in revenues
• Management appears to benefit at the expense of shareholders
• Current cost structure incentivizes management to pursue risky
growth strategies in order to justify the status quo
• Wasteful spending reduces cash available for value creation
Correct
capital
allocation
• Disastrous track record of funding risky
ventures and poor acquisitions
• Strategy to pursue inorganic growth
despite limited operational experience
• Management is incentivized to grow the size of the company, even
when value is not created for shareholders
• Company’s “growth plans” are used to justify management’s
compensation and corporate cost structure
Fix Agrifos • Hope for favorable market dynamics
• Offer explanations which lack credibility
• Current leadership did not understand Agrifos’ business
• Independent analysis needed to asses issues and develop a plan
Maximize
value of
wood assets
• Learn on the job and hope to execute
• Pursue additional pellet acquisitions and
development projects before ever
operating a single plant
• MLP wood business in the future
• Growth in wood business will require additional acquisitions/projects
– current leadership’s capital allocation history is exceptionally poor
• Issues with current projects highlight a penchant for risk taking
(already exploring additional deals without having ever shipped a
pellet, collateralizing RNF shares, proceeding without a JV partner)
• In our view, shareholder representation will in no way impair RTK’s
ability to create value with the wood assets – it will enhance capital
allocation discipline, execution focus, and risk mitigation
Explore plan
to reduce tax
leakage
• Evaluated by management’s advisors
• Directors concluded tax strategy would
not create value
• Decided to not pursue tax strategy
• Management is incentivized to NOT consider tax strategy plan
• Shareholder representation is, in our view, the only feasible way to
ensure the tax proposal is reviewed with shareholders in mind
Consider
strategic
alternatives
for RNF
• Shun interest in fertilizer assets from
credible strategic buyers
• Continue to use RNF to fund RTK
growth (AE first, now wood pellets)
• Current RTK CEO and CFO have
positions at both RTK and RNF
• We believe strategic acquirers have recently approached the
Company regarding RNF and were rebuffed by management
• Shareholder representation needed to ensure path forward
maximizes value for shareholders, regardless of management impact
Executive Summary:
Multiple Ways To Create Value For Shareholders
8

Concerned Rentech Shareholders
This Board and management team have, in our view, proven they are not
credible stewards of shareholder capital
Rentech is no longer an alternative energy venture – neither the Board nor
management have the background to govern an industrials/materials company
The Company’s wood strategy requires the allocation of significant additional
shareholder capital – shareholders must have true representatives in the
boardroom to ensure these decisions are made with their best interests in mind
Value enhancing alternatives must be explored independent of management
We believe change is needed given the incumbent Board’s apparent tolerance
of drastic stock underperformance…
NOW is the time for change at Rentech
Executive Summary:
Board Reconstitution Required to Protect Shareholders
9
Total Return Performance
Ramsbottom
6 Mo 1 Yr 2 Yr 3 Yr 5 Yr Start as CEO
RTK (14%) (23%) (5%) 65% 225% (48%)
Peer Group Avg. 18% 42% 65% 92% 479% 218%
Relative Performance (32%) (64%) (71%) (27%) (254%) (266%)
Returns through 3/21/14. Source: FactSet. Peer Group based on 2013 Peer Group as in RTK 2013 10K.

Concerned Rentech Shareholders
We believe the value of RTK’s assets is not reflected in today’s
share price
Multiple opportunities to create shareholder value by:
Optimizing legacy cost structure
Fixing capital allocation strategy
Developing wood assets for potential MLP
Evaluating strategic interest in Rentech Nitrogen Partners (“RNF”)
Exploring tax efficient legal structures
Capitalizing on the above opportunities requires a
reconstituted board that includes shareholder representation
Managed for the benefit of its shareholders,
we believe RTK is worth $2.56-$4.35 per share1
Executive Summary:
Significant Upside Is Available in RTK Shares
10 1) See Appendix N and slide 70 for details

Concerned Rentech Shareholders
Executive Summary:
Our Nominees
11
Jeffrey J. Brown
Private equity background with extensive transaction experience
Served on the Board of Directors of over 40 companies (Chairman of 10)
Has served as Chairman of Audit, Compensation, and Finance Committees
Jeffrey E. Eberwein
Experienced investor with specific expertise in the energy and materials sectors
Served on the Board of Directors of multiple public companies
Has served as Chairman of Audit, Compensation, and Nominating Committees
Larry Holley
Over 35 years of experience in the fertilizer, chemical and mining industries
Past member of the board and executive committee of The Fertilizer Institute
Valuation consultant to private equity firms in the fertilizer industry
Glenn W. Welling
Over 20 years experience advising boards and management how to increase valuation
Experienced investor, business operator, investment banker, and strategy consultant
Extensive expertise in the areas of valuation, strategy, capital allocation, executive
compensation, and investor communications

Concerned Rentech Shareholders
Alternative Energy (“AE”)
“The Only Fuel Burned Was Shareholder Capital”
12
Concerned Rentech Shareholders All estimates for project costs are from RTK. Source: Company SEC filings, transcripts. See Appendices A & G for details.
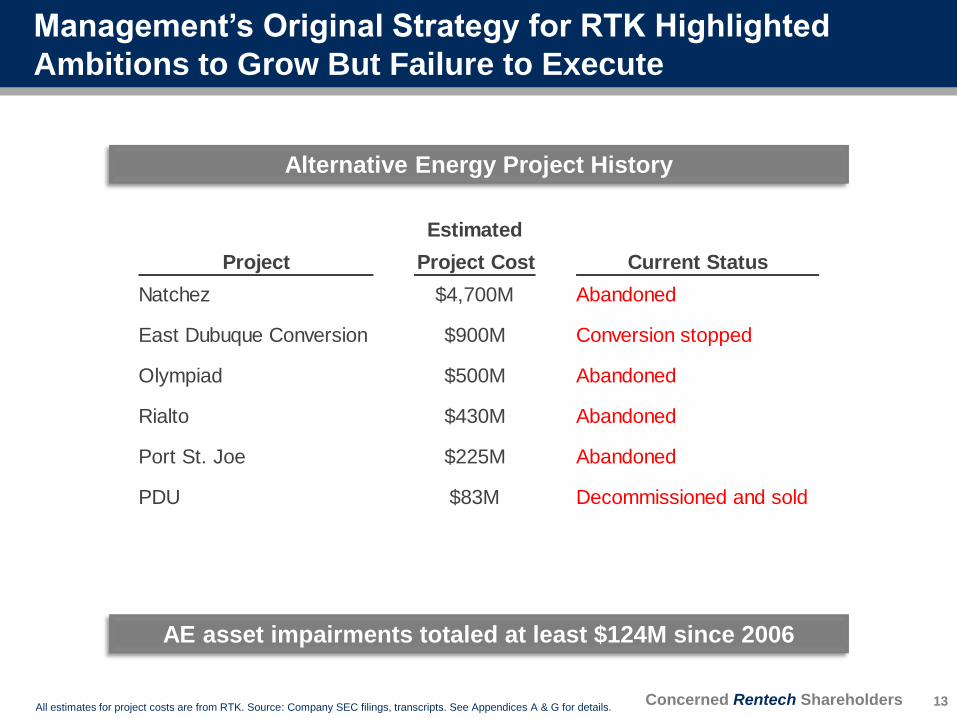
AE asset impairments totaled at least $124M since 2006
Management’s Original Strategy for RTK Highlighted
Ambitions to Grow But Failure to Execute
13
Alternative Energy Project History
Estimated
Project Project Cost Current Status
Natchez $4,700M Abandoned
East Dubuque Conversion $900M Conversion stopped
Olympiad $500M Abandoned
Rialto $430M Abandoned
Port St. Joe $225M Abandoned
PDU $83M Decommissioned and sold

Concerned Rentech Shareholders * 2011 includes fiscal 2011 plus quarter ended December 2011. All other periods fiscal year ended September, except 2012.
Cash expense is sum of cash SG&A, R&D, and capex attributable to AE segment. Source: company SEC filings.
Almost half a billion dollars of investment generated zero revenue
$11 $40
$147
$258
$301
$354
$438
$482
$ --
$50
$100
$150
$200
$250
$300
$350
$400
$450
$500
2005 2006 2007 2008 2009 2010 2011* 2012
AE
Ca
sh
Ex
pe
ns
es
($
M)
Cumulative Alternative Energy Cash Expenses
Asset Impairments Were Only A Fraction of the Total
Investment in the Failed AE Strategy
14

Concerned Rentech Shareholders
Debt$80
RNF FCF
RNF IPO
Equity
Other
$984
($429)
Agrifos
Wood Fibers
($288)
Other AE
($144)
($43)
$ --
$200
$400
$600
$800
$1,000
$1,200
Sources of Cash AE FCF Acquisitions RNF Growth Capex Special Dividend Total Change In Cash
So
urc
es a
nd
Uses o
f C
ash
($M
)
Sources & Uses of Cash: 2007 - 2013
RNF FCF comprised of GAAP fertilizer FCF through 2011, then distributions to RTK from RNF afterwards. From 2012 on, assume difference
between RNF GAAP FCF and RNF distribution accounted for as growth capex or use of debt. Equity adjusted for Agrifos acquisition and other
AE stock deals. Debt adjusted for debt assumed in wood fiber acquisition. AE FCF includes Fulghum in 2013. All figures from public filings.
Majority raised on
the back of East
Dubuque…and
spent on AE
High cost capital
raised by AE
East Dubuque Has Been the Piggybank Used to Fuel
Management’s Various Business Ventures…
15
…Unfortunately, the Illinois plant cannot produce enough
cash today to satisfy management’s appetite for capital

Concerned Rentech Shareholders
In our view, management enriched itself at the expense of shareholders by continuing
to spend on AE while the strategy was clearly bankrupt
Two months before RTK wrote down the majority of its AE assets, management was
openly intent on spending RNF’s IPO proceeds
“A successful IPO would help us secure a source of ongoing capital to fund our alternative energy business.”
– CEO Hunt Ramsbottom, August 10, 2011
This fact was not lost on frustrated shareholders:
“Will you commit to shareholders that there is a certain ceiling on how much money you’re willing to lose in the
part of the business outside of Rentech Nitrogen, because I think right now the market doesn’t have any
confidence in how big that number might be?” – March 16, 2012 earnings call
“You guys have a phenomenally high cost of capital right now – I mean, to do anything other than buyback stock
with the cash you have, you would have to have one of the most amazing investment opportunities in the history of
earth.” – March 16, 2012 earnings call
“In spite of a booming subsidiary [RNF], Rentech is barely profitable because you guys are spending tens of
millions of dollars for zero revenue…Do shareholders need to sue in order to stop you from wasting their money?”
– November 8, 2012 earnings call
An earlier shutdown of AE could have saved investors
millions but would have likely left corporate management
struggling to justify their role in the nitrogen fertilizer business
AE Losses Continued Well After the Strategy Had Failed
16
Concerned Rentech Shareholders
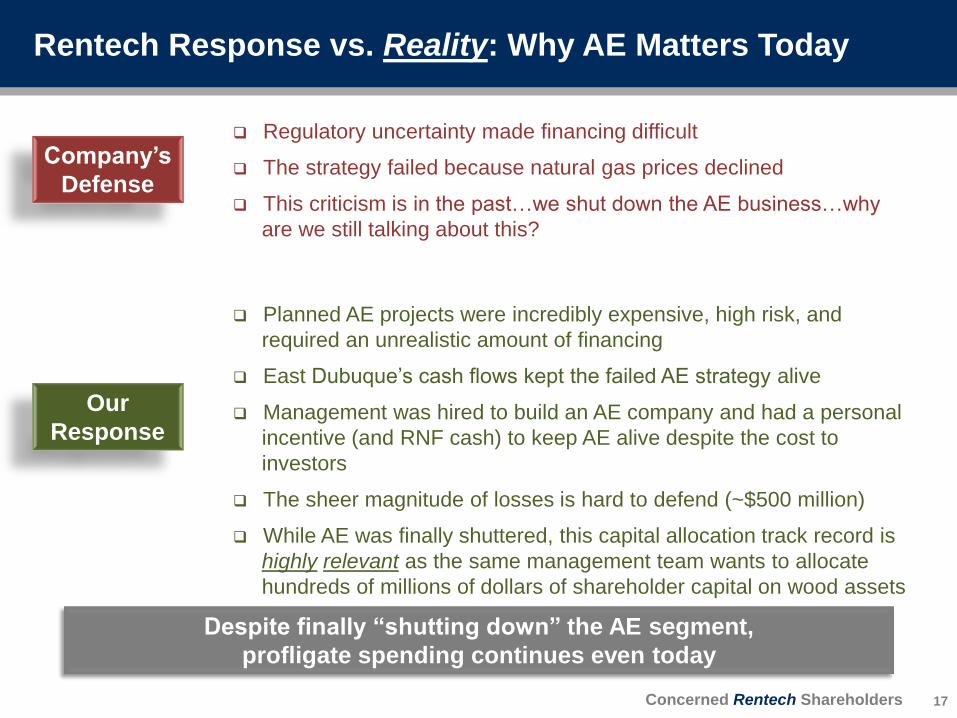
Regulatory uncertainty made financing difficult
The strategy failed because natural gas prices declined
This criticism is in the past…we shut down the AE business…why
are we still talking about this?
Company’s
Defense
Planned AE projects were incredibly expensive, high risk, and
required an unrealistic amount of financing
East Dubuque’s cash flows kept the failed AE strategy alive
Management was hired to build an AE company and had a personal
incentive (and RNF cash) to keep AE alive despite the cost to
investors
The sheer magnitude of losses is hard to defend (~$500 million)
While AE was finally shuttered, this capital allocation track record is
highly relevant as the same management team wants to allocate
hundreds of millions of dollars of shareholder capital on wood assets
Our
Response
Despite finally “shutting down” the AE segment,
profligate spending continues even today
Rentech Response vs. Reality: Why AE Matters Today
17

Concerned Rentech Shareholders
18
East Dubuque Nitrogen Fertilizer Facility
“The Break-Even Plant That Became A Piggybank”

Concerned Rentech Shareholders
“Rentech plans to convert REMC's natural gas fed ammonia fertilizer plant into a
poly-generation facility that will use clean coal gasification technology to produce
Rentech's ultra-clean diesel fuel, fertilizer and electricity from Illinois #6 coal.” – April
26, 2006 press release
“Several changes in the macro-environment have occurred since we developed our
plan to convert REMC from natural gas to coal, which in the aggregate make the
proposed conversion less economical at this point in time.” – CEO Hunt Ramsbottom
December 4, 2007 business update call
“[East Dubuque’s] EBITDA was zero when we bought it…So we were running
scenarios on that plant of a breakeven during this conversion or if we had to shut it
down, we knew what that number was just to shut it down” – CEO Hunt Ramsbottom
December 14, 2007 earnings call
Management spent ~$50 million on the
East Dubuque conversion plan as part of its AE strategy
East Dubuque Was Purchased as Part of the AE Strategy
19
Concerned Rentech Shareholders
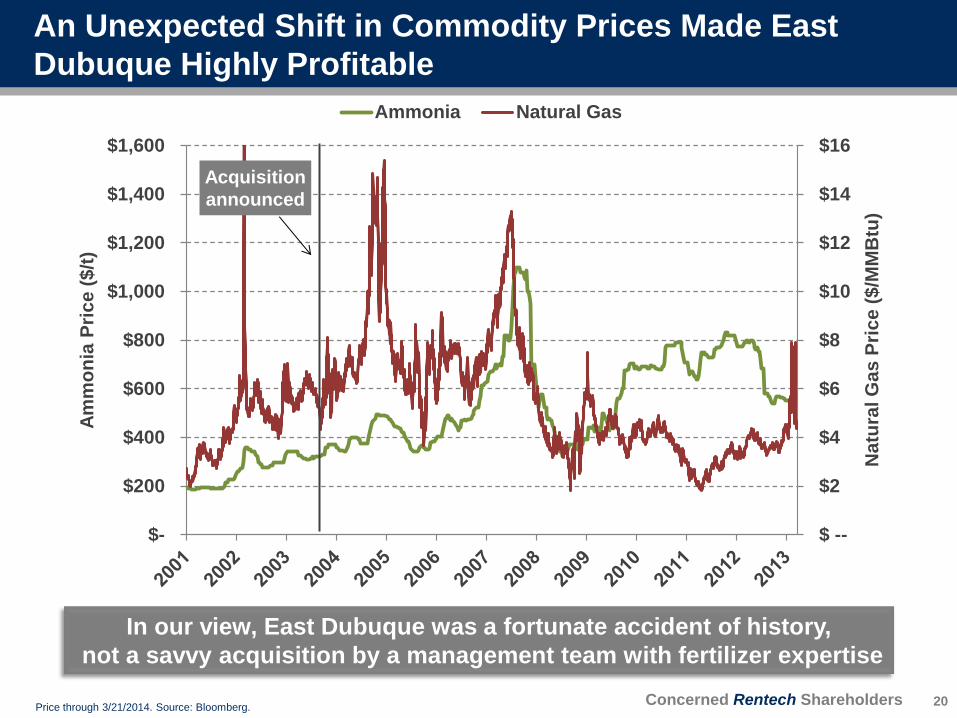
In our view, East Dubuque was a fortunate accident of history,
not a savvy acquisition by a management team with fertilizer expertise
$ --
$2
$4
$6
$8
$10
$12
$14
$16
$-
$200
$400
$600
$800
$1,000
$1,200
$1,400
$1,600
Na
tura
l G
as
Pri
ce
($
/MM
Btu
)
Am
mo
nia
Pri
ce
($/t
)
Ammonia Natural Gas
Acquisition
announced
Price through 3/21/2014. Source: Bloomberg.
An Unexpected Shift in Commodity Prices Made East
Dubuque Highly Profitable
20

Concerned Rentech Shareholders
2006 10K “We plan to convert the existing nitrogen fertilizer complex from natural gas to a coal fed integrated
fertilizer and FT fuels production facility using coal gasification.”
2007 10K
“We initially planned to convert the East Dubuque Plant into a coal gasification to fertilizer and synthetic
fuels facility by adding the Rentech Process, but as discussed above we have shifted our focus to the
Natchez Project. Therefore we will continue to operate the East Dubuque Plant for the production of
nitrogen fertilizer products.”
2008 10K “As our primary strategy is focused on synthetic fuels, we do not intend to develop or buy new fertilizer-
only plants, although fertilizer may be a co-product in future plants.“
2009 10K “Although our primary strategy is focused on synthetic fuels, in fiscal year 2009 our operating
revenues were almost exclusively from sales at the East Dubuque Plant.”
2011 10K
“Rentech has adopted a revised strategy for the commercialization of its alternative energy
technologies. The new strategy includes reduced spending on research and development and pursuit of
projects that are smaller and require less capital to be invested by Rentech than those recently under
development by the Company.”
2012 10K
“We intend to enhance shareholder value by (i) continuing to grow and manage RNP, a publicly traded
fertilizer master limited partnership;(ii) terminating our research and development activities related to
our alternative energy technologies…”
“TODAY”
2013 10K
“We intend to enhance shareholder value by (i) continuing to operate and expand RNP; (ii) expanding
and managing our wood chipping business… (iii) building the wood pellet business… and expanding the
wood pellet business… (iv) broadening our wood fibre business… and (v) closing the sale of our
existing alternative energy technologies and related assets.”
An accident of history led RTK from an alternative energy venture to an
industrial/materials company…under the same Board and management
Source: company SEC filings
East Dubuque’s Improving Profitability Led to A
Significant Migration in RTK’s Business Strategy
21

Concerned Rentech Shareholders
We deserve credit for purchasing the East Dubuque facility
Fertilizer MLP created significant shareholder value
Company’s
Defense
East Dubuque was purchased under the AE strategy and became
profitable because of unanticipated changes in commodity prices
The RNF IPO certainly created shareholder value, but management
has siphoned off the rich MLP cash flows from RTK investors
What qualifies this Board and management team to oversee an
industrial/materials company?
Our
Response
Rentech Response vs. Reality: RTK Simply Got Lucky
East Dubuque changed the future of RTK;
unfortunately its cash flow has “paid for many sins”
22

Concerned Rentech Shareholders
23
Agrifos Ammonium Sulfate Fertilizer Facility
“The Headache Purchased for $160 Million”

Concerned Rentech Shareholders
The ammonium sulfate (“AS”) market is relatively new and still developing
The large acquisition was led by the former AE management team with only
limited fertilizer expertise
When acquired by RNF, Agrifos had only produced AS for ~1.5 years and had
only operated at targeted production rates for two months
EBITDA guidance of $25M in 2013 clearly embedded a “blue skies” scenario
as the plant had only a limited operating history
The acquisition was completed when nitrogen fertilizer prices were near all-
time highs (>$700 per ton)
The Board approved the $158M purchase of an unknown, unproven asset
and freely admitted to us their crystal ball was wrong
With Agrifos, RTK’s poor capital allocation practices migrated to RNF
Agrifos Acquisition Was Loaded With Risk From the Start
24
Concerned Rentech Shareholders
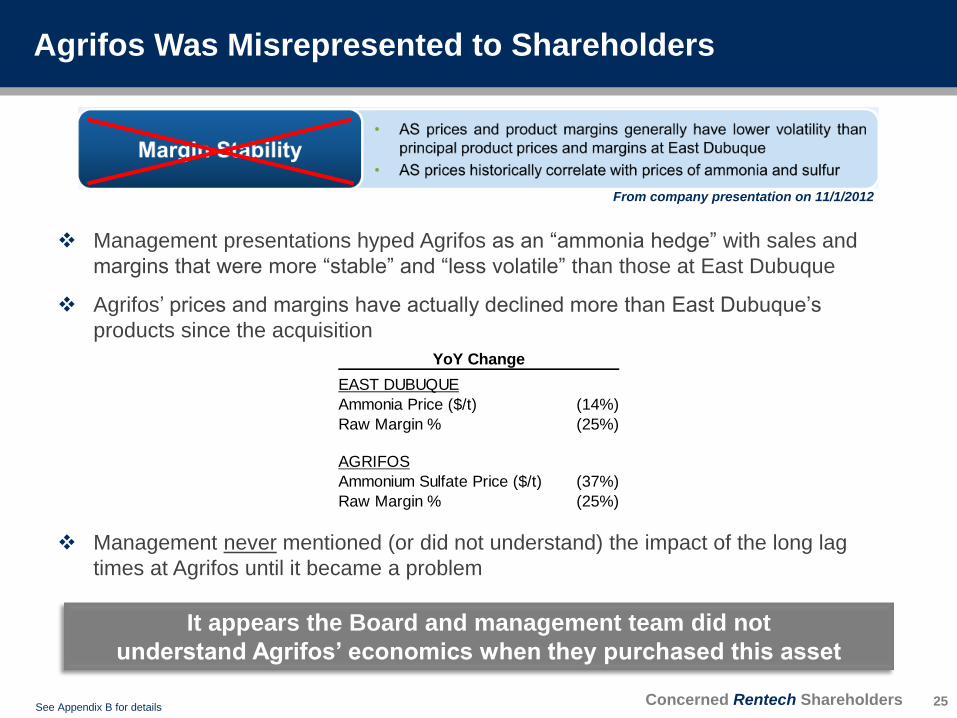
From company presentation on 11/1/2012
Management presentations hyped Agrifos as an “ammonia hedge” with sales and
margins that were more “stable” and “less volatile” than those at East Dubuque
Agrifos’ prices and margins have actually declined more than East Dubuque’s
products since the acquisition
Management never mentioned (or did not understand) the impact of the long lag
times at Agrifos until it became a problem
It appears the Board and management team did not
understand Agrifos’ economics when they purchased this asset
YoY Change
EAST DUBUQUE
Ammonia Price ($/t) (14%)
Raw Margin % (25%)
AGRIFOS
Ammonium Sulfate Price ($/t) (37%)
Raw Margin % (25%)
Agrifos Was Misrepresented to Shareholders
25 See Appendix B for details

Concerned Rentech Shareholders
544 544
529
482
428
350
400
450
500
550
600
4Q12 1Q13 2Q13 3Q13 Actual
20
13
Es
t. A
S S
hip
me
nts
(0
00
to
ns
)
2013 Est. Ammonium Sulfate Shipment Guidance
Estimated deliveries from RTK guidance. Source: RTK earnings reports
Hard to explain decline in shipment volumes
based solely on the weak pricing environment
Problems Are Not Entirely Due to Commodity Prices
26
Concerned Rentech Shareholders
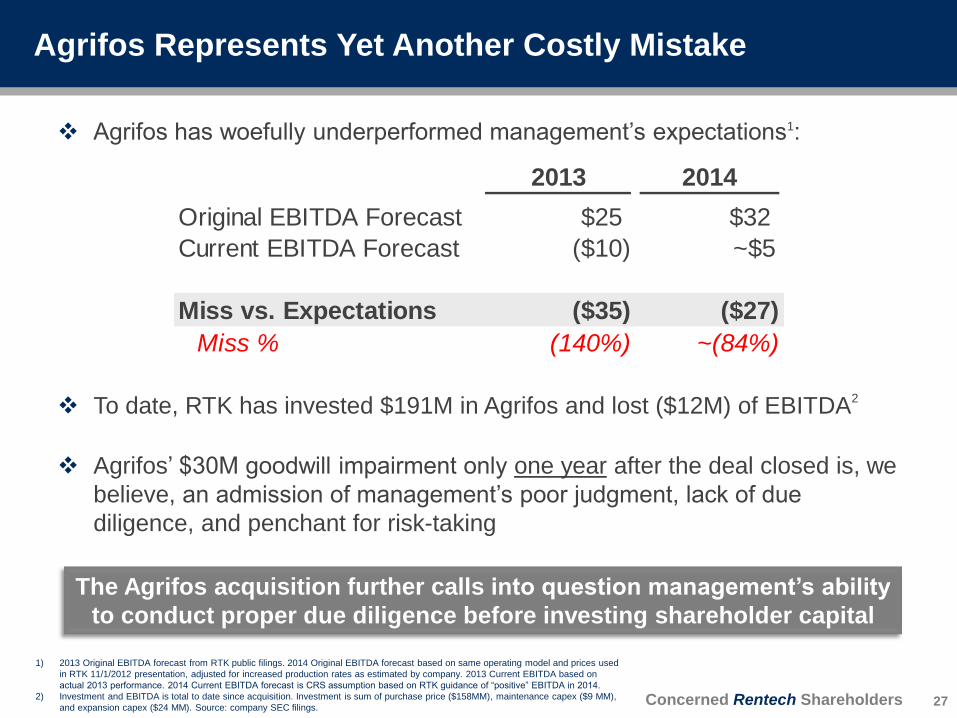
Agrifos has woefully underperformed management’s expectations1:
To date, RTK has invested $191M in Agrifos and lost ($12M) of EBITDA2
Agrifos’ $30M goodwill impairment only one year after the deal closed is, we
believe, an admission of management’s poor judgment, lack of due
diligence, and penchant for risk-taking
The Agrifos acquisition further calls into question management’s ability
to conduct proper due diligence before investing shareholder capital
1) 2013 Original EBITDA forecast from RTK public filings. 2014 Original EBITDA forecast based on same operating model and prices used
in RTK 11/1/2012 presentation, adjusted for increased production rates as estimated by company. 2013 Current EBITDA based on
actual 2013 performance. 2014 Current EBITDA forecast is CRS assumption based on RTK guidance of “positive” EBITDA in 2014.
2) Investment and EBITDA is total to date since acquisition. Investment is sum of purchase price ($158MM), maintenance capex ($9 MM),
and expansion capex ($24 MM). Source: company SEC filings.
Agrifos Represents Yet Another Costly Mistake
27
2013 2014
Original EBITDA Forecast $25 $32
Current EBITDA Forecast ($10) ~$5
Miss vs. Expectations ($35) ($27)
Miss % (140%) ~(84%)

Concerned Rentech Shareholders
Agrifos Significantly Increased Financial Leverage at RNF
28
RTK bought Agrifos for $158M and in return they
received a $10M EBITDA loss and a levered balance sheet
3Q12 4Q13
Pro-forma Diff vs.
Pre-Agrifos ex-Agrifos Actual Actual
Debt $27 $105 $320 $215
Cash $55 $27 $34 $7
Net Debt (Cash) ($28) $78 $286 $208
LTM EBITDA $126 $77 $66 ($10)
Net Debt/EBITDA (0.2x) 1.0x 4.3x 3.3x
Distributable Cash Flow $89 $94 $5
Less: Distribution of Cash Reserves $ -- $30 $30
Distributions ex Use of Cash Reserves $89 $64 ($25)
See Appendices C & D for details

Concerned Rentech Shareholders
Problems primarily caused by an unexpected drop in commodity
prices, not company-specific issues
Majority of underperformance due to lag between buying inputs and
selling product
Performance should recover if nitrogen pricing improves
Company’s
Defense
We believe management did not fully understand Agrifos’ economic
model
Risk caused by lag time between input purchases and product sales
was easily identifiable with basic due diligence
Paying ~$160M while fertilizer prices were near all-time highs
demonstrates a penchant for risk-taking
Not surprising when fertilizer assets are acquired by an alternative
energy management team
Our
Response
Bottom line: ~$160M spent on a plant that has lost money
Rentech Response vs. Reality: Clearly A Bad Deal
29
Concerned Rentech Shareholders
The Wood Pellets Strategy
“Execution Risk Multiplied By Limited Expertise”
30
Concerned Rentech Shareholders
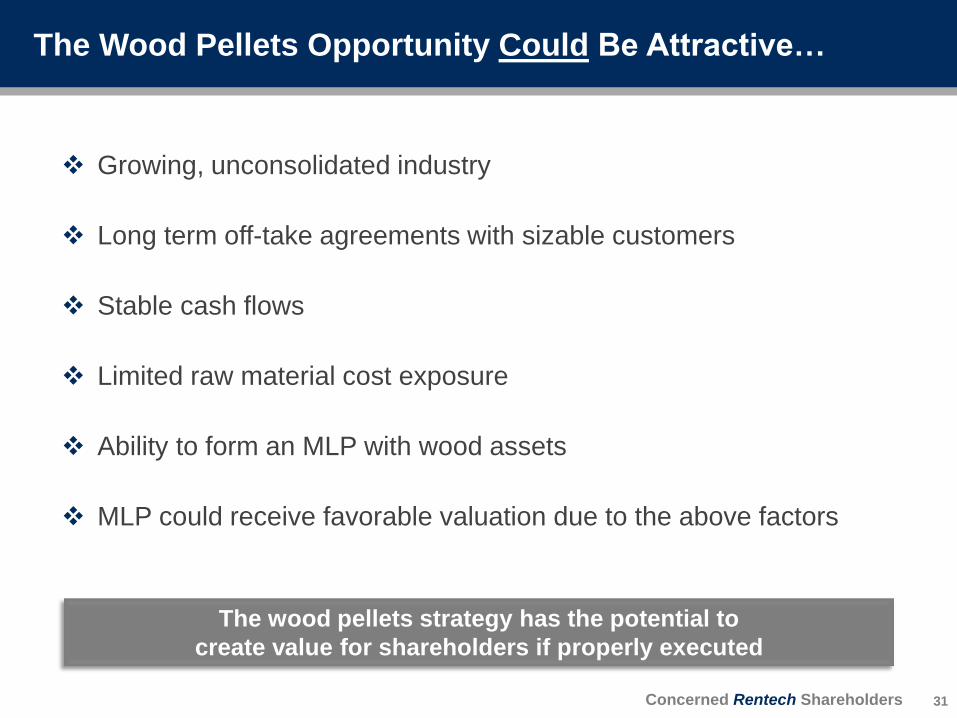
Growing, unconsolidated industry
Long term off-take agreements with sizable customers
Stable cash flows
Limited raw material cost exposure
Ability to form an MLP with wood assets
MLP could receive favorable valuation due to the above factors
The wood pellets strategy has the potential to
create value for shareholders if properly executed
The Wood Pellets Opportunity Could Be Attractive…
31
Concerned Rentech Shareholders
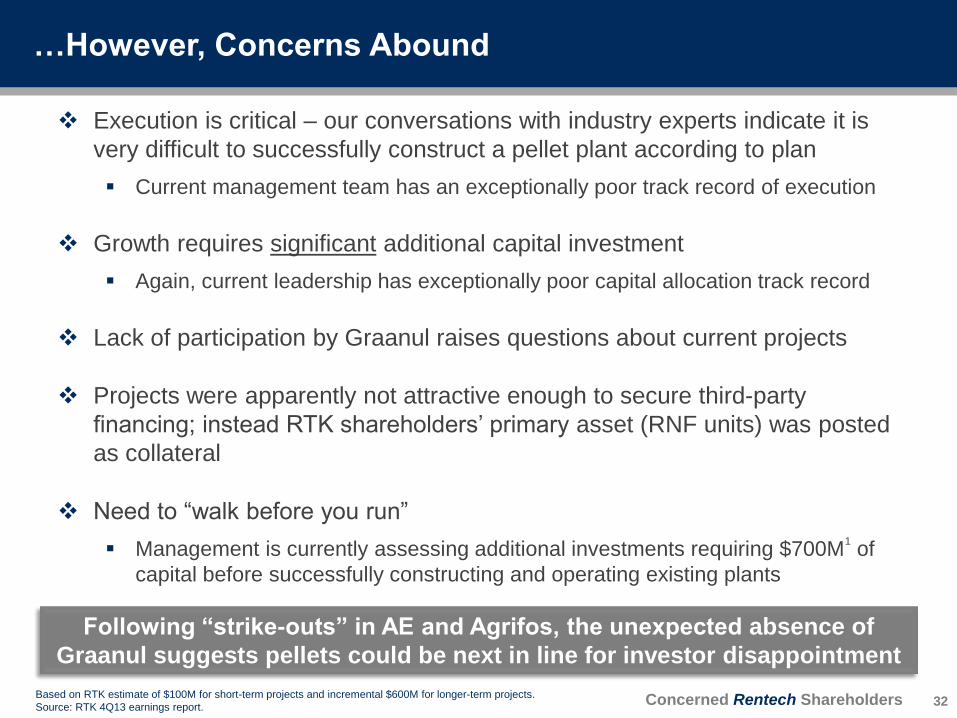
Execution is critical – our conversations with industry experts indicate it is
very difficult to successfully construct a pellet plant according to plan
Current management team has an exceptionally poor track record of execution
Growth requires significant additional capital investment
Again, current leadership has exceptionally poor capital allocation track record
Lack of participation by Graanul raises questions about current projects
Projects were apparently not attractive enough to secure third-party
financing; instead RTK shareholders’ primary asset (RNF units) was posted
as collateral
Need to “walk before you run”
Management is currently assessing additional investments requiring $700M1 of
capital before successfully constructing and operating existing plants
Following “strike-outs” in AE and Agrifos, the unexpected absence of
Graanul suggests pellets could be next in line for investor disappointment
…However, Concerns Abound
32 Based on RTK estimate of $100M for short-term projects and incremental $600M for longer-term projects.
Source: RTK 4Q13 earnings report.

Concerned Rentech Shareholders
Project Economics Appeared Very Attractive for Graanul
33
Investors are left to wonder why Graanul would choose
to pass on the projects if the above economics were real
Orignial Pellet Project Estimates
Total Pellet EBITDA $15.0
RTK EBITDA $7.5
Graanul EBITDA $7.5
Total Project Cost $70.0
RTK Loan to JV $35.0
RTK Equity Contribution $17.5
Graanul Equity Contribution $17.5
Graanul Economics
EBITDA Multiple 2.3x
Pretax ROI 43%
CRS estimates based on RTK public commentary describing JV arrangement
Concerned Rentech Shareholders
4Q05 1Q06 2Q06 3Q06 4Q06 1Q07 2Q07 3Q07 4Q07 1Q08 2Q08 3Q08
Est. Completion DateCalendar
2006
Fiscal
2007
Early-mid
2007
Mid
2007
Q3
2007
Q3
2007
Q3
2007
Spring
2008
Spring
2008
Spring
2008
June
2008
August
2008
$21$23
$30
$40 $40 $40
$45 $45
$61
$66
$83 $83
$00
$10
$20
$30
$40
$50
$60
$70
$80
$90
RT
K E
sti
ma
te o
f P
DU
Co
st
($M
)
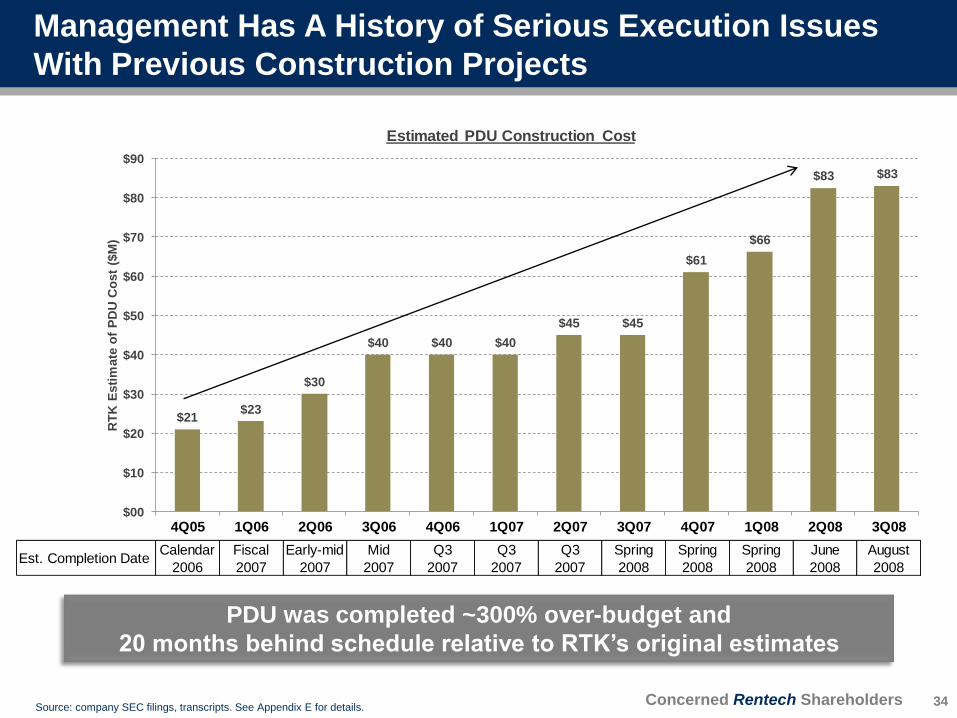
Estimated PDU Construction Cost
PDU was completed ~300% over-budget and
20 months behind schedule relative to RTK’s original estimates
Source: company SEC filings, transcripts. See Appendix E for details.
Management Has A History of Serious Execution Issues
With Previous Construction Projects
34
Concerned Rentech Shareholders
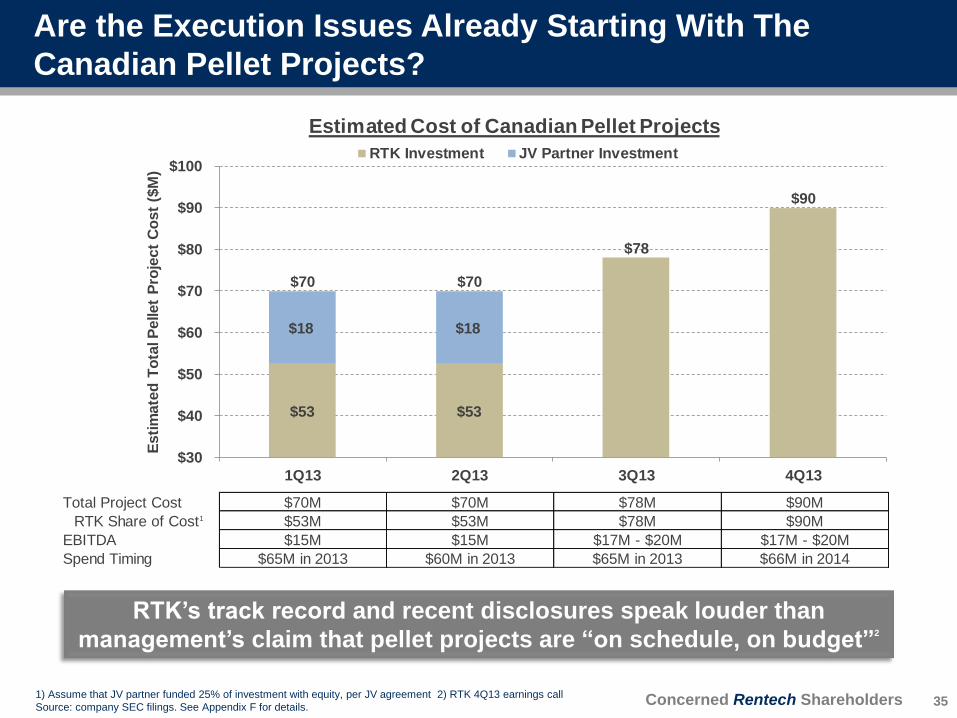
RTK’s track record and recent disclosures speak louder than
management’s claim that pellet projects are “on schedule, on budget”2
Total Project Cost $70M $70M $78M $90M
RTK Share of Cost1 $53M $53M $78M $90M
EBITDA $15M $15M $17M - $20M $17M - $20M
Spend Timing $65M in 2013 $60M in 2013 $65M in 2013 $66M in 2014
$53 $53
$18 $18
$70 $70
$78
$90
$30
$40
$50
$60
$70
$80
$90
$100
1Q13 2Q13 3Q13 4Q13
Esti
mate
d T
ota
l P
ellet
Pro
ject
Co
st
($M
)
Estimated Cost of Canadian Pellet Projects
RTK Investment JV Partner Investment
1) Assume that JV partner funded 25% of investment with equity, per JV agreement 2) RTK 4Q13 earnings call
Source: company SEC filings. See Appendix F for details.
Are the Execution Issues Already Starting With The
Canadian Pellet Projects?
35

Concerned Rentech Shareholders
Estimated
Project Project Cost
Natchez $4,700M
East Dubuque Conversion $900M
Olympiad $500M
Rialto $430M
Port St. Joe $225M
Plans to Spend An Incremental $700M Are Reminiscent of
Past Alternative Energy Ambitions…All of Which Failed
36 Source: company SEC filings. See Appendices A & G for details.
Previous Projects/Acquisitions Result
East Dubuque Conversion Spent $48M on conversion; later impaired
PDU Construction Spent $83M vs original $21M cost estimate
Natchez Project $27M impairment
Rialto Project $27M impairment
Port St. Joe Project $5M impairment
SilvaGas Acquisition $8.5M impairment
ClearFuels Acquisition $7M impairment
Agrifos Acquisition Lost $10M vs original $25M profit estimate

Concerned Rentech Shareholders
Projects have always been on plan
Graanul and RTK jointly decided to keep the Canadian pellet projects
outside the JV
Using RNF shares as collateral does not present a material risk…in
fact it was a smart financing tool
Company’s
Defense
Senior management has no experience in the wood pellet industry
Who knows the truth as to why Graanul passed on the project, but it
does not make economic sense from the “outside”
Regardless, withdrawal of Graanul has added significant execution
and financial risk
Using RNF shares as collateral was reckless in our opinion – leaves
minimal room for execution problems
Optimizing returns requires significant additional investment while the
capital allocation track record of current leadership is abysmal
Our
Response
Rentech Response vs. Reality: Oversight is Sorely Needed
37
With significant additional capital required to bring a wood
MLP to market, shareholder representation on the Board is critical

Concerned Rentech Shareholders
38
Corporate Cost Structure
“A Wilshire Blvd Industrial Company at $400k/head?”
≠

Concerned Rentech Shareholders
$14
$21
$24
$16
$19
$27
$22
$28
$25
$26 $25
$29
$19
$24
$29 $30
$34 $32
$ --
$5
$10
$15
$20
$25
$30
$35
$40
2006 2007 2008 2009 2010 2011* 2012 2013 2014E
RT
K e
x-R
NF
Co
rpo
rate
& A
E S
G&
A (
$M
)
Cash SG&A Stock Compensation
* 2011 includes fiscal 2011 plus quarter ended Dec. 2011. All other periods prior to 2011 use fiscal year ended September.
Excludes SG&A of RNF, Fulghum Fibres, and wood pellet operating SG&A. CRS assumes SG&A for wood pellet business
development is a corporate expense, and includes $1.9M, $5.5M, and $5.0M of such expenses in 2012, 2013, and 2014
respectively. 2013 excludes $4.4M of AE R&D reclassified as SG&A.
Source: company SEC filings. See Appendix H details.
SG&A Expense Largely Unchanged Despite Closing the
Alternative Energy Business…
39
Oct 2011:
RTK revises AE
strategy; impairs
remaining projects

Concerned Rentech Shareholders
Vast majority of historical “Alternative Energy” SG&A expense was,
in reality, nothing more than a bloated corporate cost structure
Source: RTK 2013 10K and 2012 10K
…Primarily Because ~80% of Alternative Energy SG&A
Was Actually Corporate/Unallocated Expense
40
SG&A Expense: Fiscal 2012
Previous Financials
Fertilizer $18,376
Alternative Energy $29,864
RTK Total SG&A $48,240
Restated Financials
Fertilizer $18,376
Fulghum Fibers $ --
Wood Pellets $1,919
Energy Technologies $4,514
Corporate & Unallocated $23,432
Non-Fertilizer SG&A $29,864
RTK Total SG&A $48,240
Concerned Rentech Shareholders
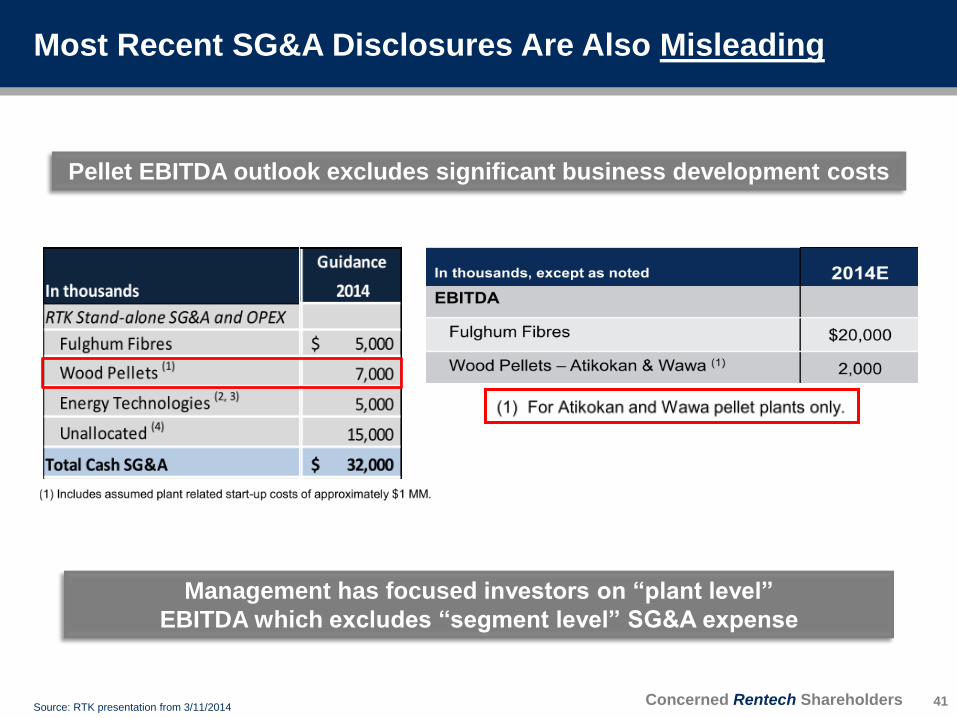
Pellet EBITDA outlook excludes significant business development costs
Management has focused investors on “plant level”
EBITDA which excludes “segment level” SG&A expense
Source: RTK presentation from 3/11/2014
Most Recent SG&A Disclosures Are Also Misleading
41

Concerned Rentech Shareholders
Pellet
Business
Development
$5MM
SG&A
Wood Fibre
Business
Outlook
$32 - 35MM
EBITDA
Either pellet SG&A is subtracted from Wood Fibres earnings…
CASH SG&A EXPENSE
RTK reported Corporate/Unallocated $15 MM
Wood Pellet Business Development $5 MM
Total Corporate Cash SG&A $20 MM
…or it is an additional Corporate/Unallocated expense
Currently, RTK excludes business development costs from
both corporate expenses and Wood Fibre projected EBITDA
From company presentation on 2/12/2014
Business Development Expenses Must Be Counted
42 Source: RTK presentation from 3/11/2014, CRS assumptions. See Appendices H & I for details.
Concerned Rentech Shareholders
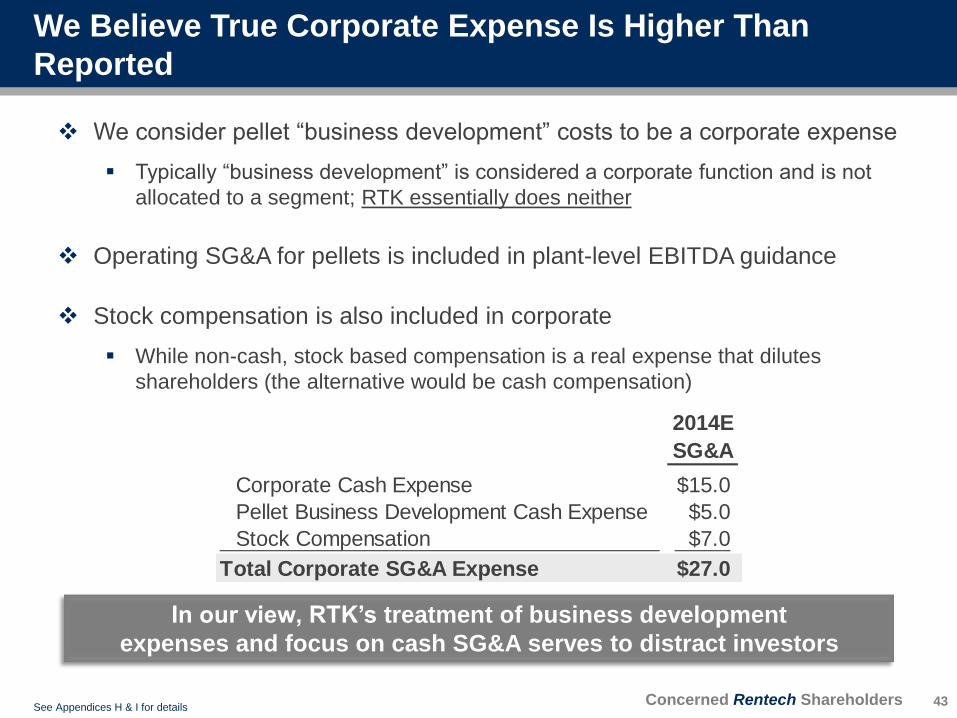
2014E
SG&A
Corporate Cash Expense $15.0
Pellet Business Development Cash Expense $5.0
Stock Compensation $7.0
Total Corporate SG&A Expense $27.0
We consider pellet “business development” costs to be a corporate expense
Typically “business development” is considered a corporate function and is not
allocated to a segment; RTK essentially does neither
Operating SG&A for pellets is included in plant-level EBITDA guidance
Stock compensation is also included in corporate
While non-cash, stock based compensation is a real expense that dilutes
shareholders (the alternative would be cash compensation)
In our view, RTK’s treatment of business development
expenses and focus on cash SG&A serves to distract investors
We Believe True Corporate Expense Is Higher Than
Reported
43 See Appendices H & I for details
Concerned Rentech Shareholders
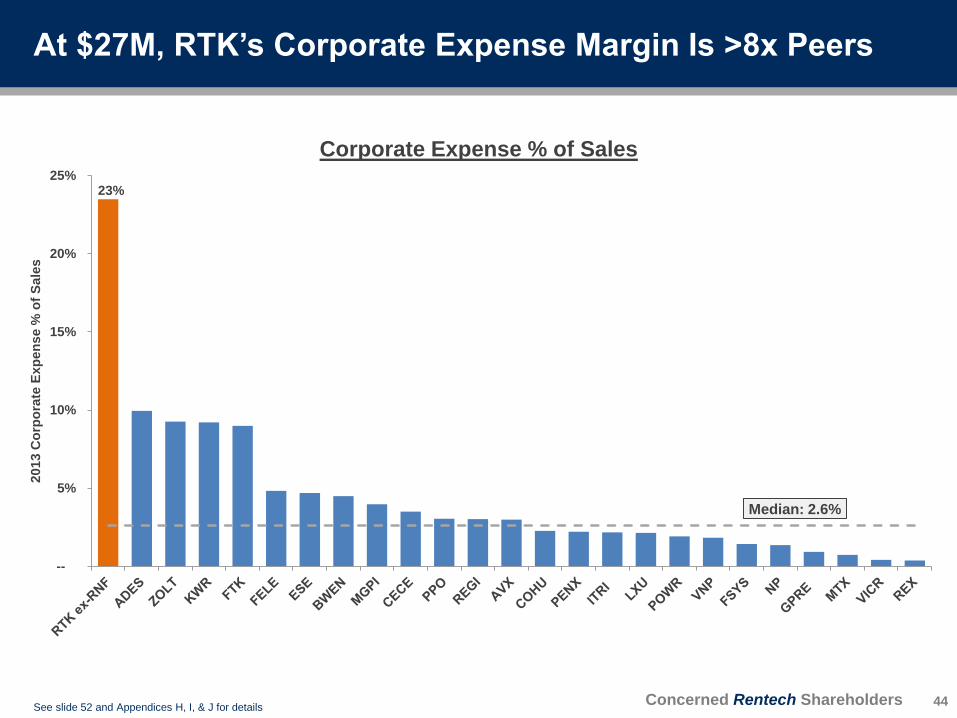
23%
--
5%
10%
15%
20%
25%
20
13
Co
rpo
rate
Ex
pe
ns
e %
of
Sa
les
Corporate Expense % of Sales
Median: 2.6%
At $27M, RTK’s Corporate Expense Margin Is >8x Peers
44 See slide 52 and Appendices H, I, & J for details
Concerned Rentech Shareholders
$ --
$500
$1,000
$1,500
$2,000
$2,500
$3,000
$3,500
20
13
Sa
les
($M
)
Sales
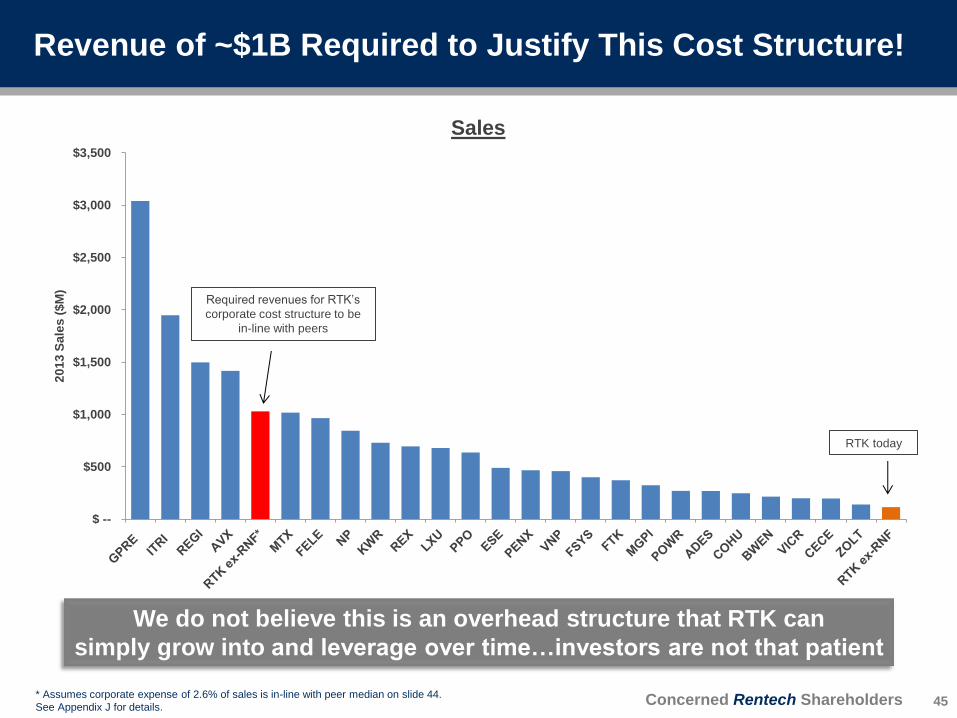
* Assumes corporate expense of 2.6% of sales is in-line with peer median on slide 44.
See Appendix J for details.
We do not believe this is an overhead structure that RTK can
simply grow into and leverage over time…investors are not that patient
Required revenues for RTK’s
corporate cost structure to be
in-line with peers
Revenue of ~$1B Required to Justify This Cost Structure!
45
RTK today

Concerned Rentech Shareholders
Corporate Required
Expense Capital
Sales % of Sales Investment
$1,200 2.3% $1,381
$1,000 2.7% $1,111
$800 3.4% $841
$600 4.5% $571
$400 6.8% $301
$200 13.5% $31
Acceptable
corporate expense
% of sales
To Avoid Cutting Costs, the Way to Justify Today’s
Corporate Structure Is Racing to Spend Significant Capital
46
Despite what the Board and management may think, this is
not a “blank check” company or a venture capital platform
See Appendix I and slides 44 & 45 for details.

Concerned Rentech Shareholders
2004 2005 2006 … 2014
RTK Executive Offices: Denver, CO Denver, CO Los Angeles, CA Los Angeles, CA
RTK Operation Locations: Colorado Colorado Colorado Alabama Mississippi
Oklahoma Illinois Arkansas Texas
Florida Virginia
Georgia Canada
Illinois Chile
Louisiana Uruguay
Maine
December 2005
Ramsbottom named CEO
Source: company SEC filings, presentation, and website
How Did Rentech Land in West L.A.?
47
Could RTK’s excessively high corporate costs have
something to do with the Company’s West L.A. location?
CEO Hunt Ramsbottom's Prior Employment History
Previous Employer Years Location
M2 Automotive 1997 - 2004 Santa Monica, CA
Thompson PBE 1989 - 1997 Marina del Rey, CA
Kellow Brown Carson, CA

Concerned Rentech Shareholders
Corporate HQ:
Wilshire Blvd., West L.A. Fulghum Fibres mills
RNF facilities
Wood pellet mills
Corporate HQ
Source: company SEC filings, presentation, and website
West L.A. Headquarters Drive Corporate Expense,
While Money Is Made In Less Glamorous Places
48
LEGEND
Concerned Rentech Shareholders
Management Offers Multiple Defenses of RTK’s Cost
Structure…Each With Major Flaws
We have discussed RTK’s cost structure with management for the past year
We have yet to hear an explanation that makes sense
Last summer, management even hired advisors from an investment bank to
help defend the Company’s cost structure against our assertions
The advisor’s defense was not only unhelpful, but actually directly contradicted
management…and this occurred during the same meeting!
Management’s primary arguments in defense of its cost structure are:
1) Cost structure best assessed using RTK Consolidated financials (including RNF)
Management claims RTK ex-RNF’s costs may be high, but RNF’s cost are
low, and all together RTK Consolidated is in-line with peers
2) SG&A is a more relevant expense metric than corporate expense
Management claims different segment allocation methodologies could result
in inconsistent corporate allocations and reduced comparability
49
In the following slides we will address each of these defenses
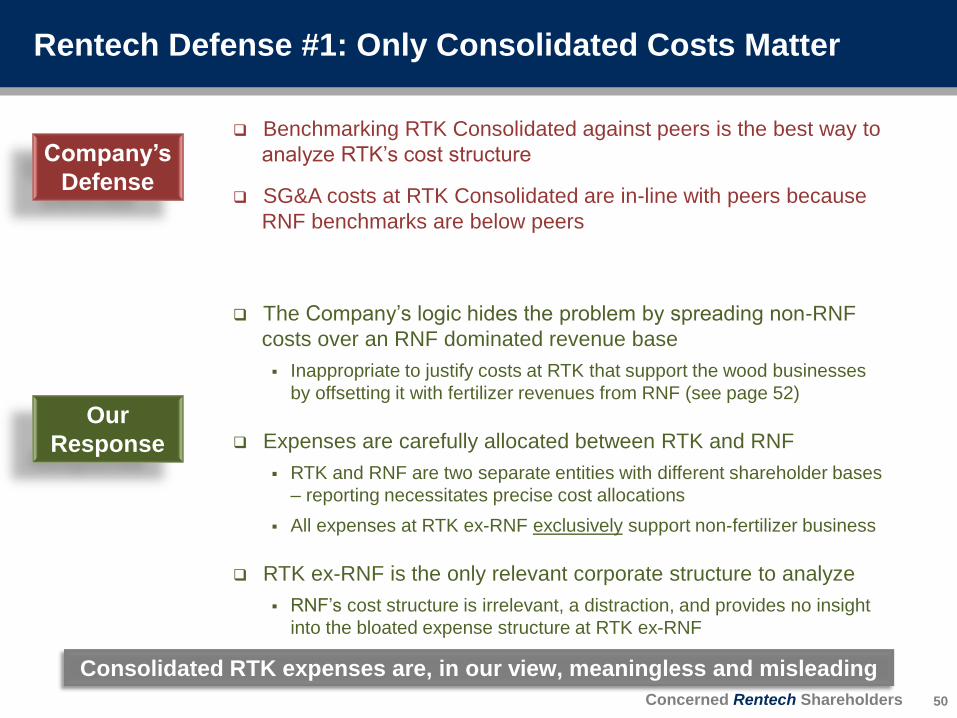
Concerned Rentech Shareholders
Company’s
Defense
Our
Response
Consolidated RTK expenses are, in our view, meaningless and misleading
Rentech Defense #1: Only Consolidated Costs Matter
Benchmarking RTK Consolidated against peers is the best way to
analyze RTK’s cost structure
SG&A costs at RTK Consolidated are in-line with peers because
RNF benchmarks are below peers
The Company’s logic hides the problem by spreading non-RNF
costs over an RNF dominated revenue base
Inappropriate to justify costs at RTK that support the wood businesses
by offsetting it with fertilizer revenues from RNF (see page 52)
Expenses are carefully allocated between RTK and RNF
RTK and RNF are two separate entities with different shareholder bases
– reporting necessitates precise cost allocations
All expenses at RTK ex-RNF exclusively support non-fertilizer business
RTK ex-RNF is the only relevant corporate structure to analyze
RNF’s cost structure is irrelevant, a distraction, and provides no insight
into the bloated expense structure at RTK ex-RNF
50

Concerned Rentech Shareholders
Company’s Defense for Using RTK Consolidated Appears
Contradictory and Flawed
The investment banking advisor’s defense cited an allocation issue,
claiming that RTK ex-RNF’s costs included expenses to support RNF
This contradicts management, who have adamantly and consistently
maintained that cost allocations between RTK and RNF are accurate
Given that RTK and RNF are separate public companies with different
shareholder bases, we agree that cost allocations are likely precise
Once we pressed the issue, management rejected their advisor’s defense
(in the same meeting it was presented) and tried a different explanation
Management then argued that RNF’s costs were low because RNF benefits
from a shared services arrangement with RTK (i.e. shared IT, HR, legal etc.)
This explanation makes sense, however, this implies RTK ex-RNF’s costs should
be lower than peers too, as both RTK and RNF benefit from this arrangement
51
Use of RTK Consolidated is irrelevant and distracts from
what we believe is an indefensible corporate cost structure

Concerned Rentech Shareholders
RTK Consolidated
Revenue: $491
SG&A: $53
SG&A % Sales = 11%
RNF
Revenue: $376
SG&A: $20
SG&A % Sales = 5%
RTK ex-RNF
Revenue: $115
SG&A: $33
SG&A % Sales = 29%
Fulghum Fibres
Revenue: $95
SG&A: $5
SG&A % Sales = 5%
Wood Pellets
Revenue: $20
SG&A: $1
SG&A % Sales = 5%
Corporate*
Revenue: $0
SG&A: $27
SG&A % Sales = 23%
Assumes Alternative Energy business completely shut down. RNF SG&A and revenue estimate based on FactSet
consensus estimates. See Appendices H & I for details.
* SG&A % of sales based on total RTK ex-RNF
“Peeling the Onion”
72 employees = ~$400K/head
Consolidated Financials Conveniently Hide An
Indefensible Corporate Structure
52

Concerned Rentech Shareholders
Company’s
Defense
Our
Response
RTK ex-RNF’s SG&A margin and corporate
expense margin are both excessive relative to peers
Rentech Defense #2: Total SG&A Is Relevant Metric
More appropriate to analyze SG&A than corporate expense
Different segment allocation methodologies could result in
inconsistent corporate allocations
As a subset of operating expenses, corporate expense is a more
granular measure than total SG&A
Corporate expense allows for comparisons across different businesses,
as categories are more uniform across companies
We would expect similar results from almost any industry group
(approximately 1% - 4% of sales)
Analyzing total SG&A does not account for differences in
operating models (i.e. services vs. products)
There is typically an inverse relationship between gross margin and
SG&A (see following page)
Measuring total SG&A instead of corporate is another apparent
attempt to hide the real source of the cost problem at RTK
Regardless, RTK ex-RNF’s SG&A still compares poorly to peers
53

Concerned Rentech Shareholders
--
10%
20%
30%
40%
50%
60%
--
5%
10%
15%
20%
25%
30%
35%
40%
CLNE ENOC RTKex-RNF
MXWL AVD WPP LXU AEIS ADES IPI ZOLT HWKN MTX NP BCPC PENX KS REX FF
20
13
Ca
sh
Gro
ss
Ma
rgin
20
13
SG
&A
% o
f S
ale
s
SG&A % of Sales Cash Gross Margin
Unlike RTK, the peers’ high SG&A margins are
explained by business models which generate high gross margins
See Appendix H, I, & K and slide 52 for details
Median: 10%
Different Operating Models Are Clearly Present in RTK’s
Peer Group
54
Concerned Rentech Shareholders
Executive Compensation
“Mediocrity Has Its Rewards”
55
Concerned Rentech Shareholders
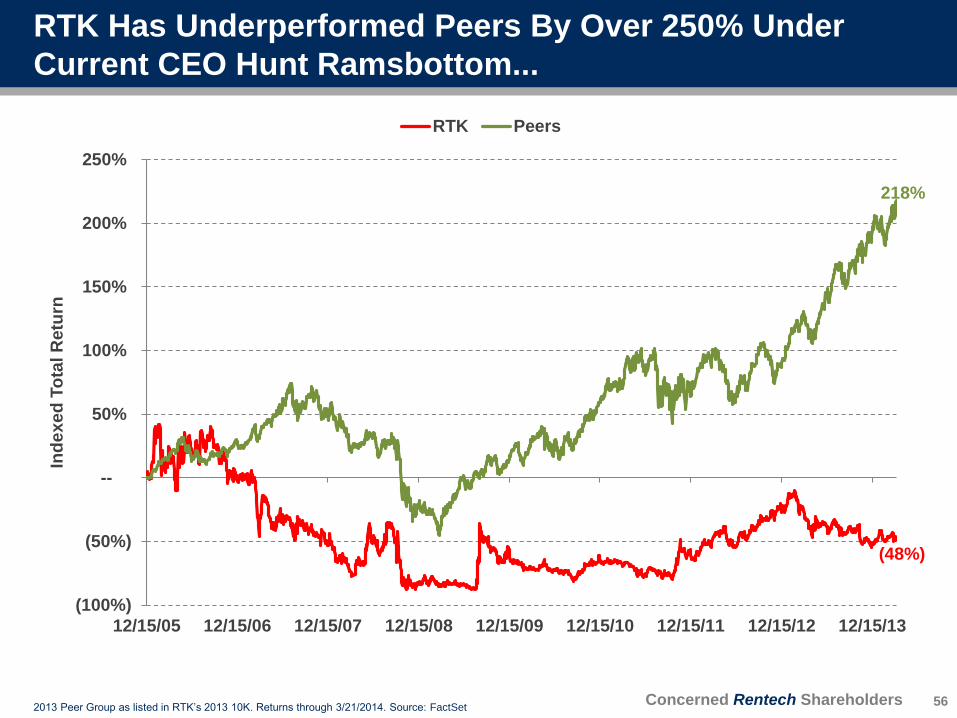
(48%)
218%
(100%)
(50%)
--
50%
100%
150%
200%
250%
12/15/05 12/15/06 12/15/07 12/15/08 12/15/09 12/15/10 12/15/11 12/15/12 12/15/13
Ind
ex
ed
To
tal R
etu
rn
RTK Peers
=
2013 Peer Group as listed in RTK’s 2013 10K. Returns through 3/21/2014. Source: FactSet
RTK Has Underperformed Peers By Over 250% Under
Current CEO Hunt Ramsbottom...
56

Concerned Rentech Shareholders
…While Management Has Been Handsomely
Compensated…
57 * 2011 includes fiscal 2011 plus quarter ended Dec. 2011. All other periods prior to 2011 are fiscal year ended September.
Total compensation at grant value paid to all listed RTK and RNF executives. Source: company SEC flings.
$10
$14
$18
$22
$29
$44
$54
$63
$ --
$10
$20
$30
$40
$50
$60
$70
2006 2007 2008 2009 2010 2011* 2012 2013
20
06
-20
13
Cu
mu
lati
ve
To
tal ($
M)
RTK Executive Compensation (2006 - 2013)
Concerned Rentech Shareholders
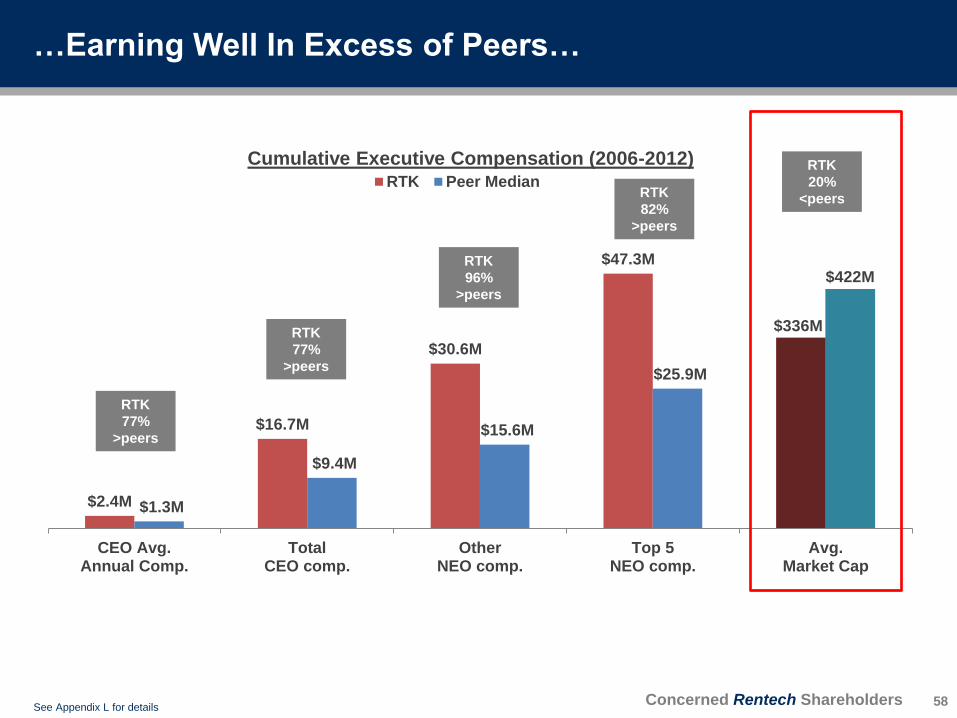
$2.4M
$16.7M
$30.6M
$47.3M
$1.3M
$9.4M
$15.6M
$25.9M
$336M
$422M
CEO Avg.Annual Comp.
TotalCEO comp.
OtherNEO comp.
Top 5NEO comp.
Avg.Market Cap
Cumulative Executive Compensation (2006-2012)RTK Peer Median
RTK
82%
>peers
RTK
77%
>peers
RTK
77%
>peers
RTK
96%
>peers
…Earning Well In Excess of Peers…
58
RTK
20%
<peers
See Appendix L for details

Concerned Rentech Shareholders
0.7%
5.0%
9.1%
14.1%
0.4%
2.7%
4.8%
7.7%
(25%)
87%
CEO Avg.Annual Comp.
TotalCEO comp.
OtherNEO comp.
Top 5NEO comp. Total Return
Executive Compensation % of Market Value (2006-2012)RTK Peer Median
RTK
82%
>peers
RTK
86%
>peers
RTK
86%
>peers
RTK
89%
>peers
…And Well In Excess of RTK’s Relative Size
59
RTK
112%
<peers
See Appendix L for details
We believe excessive executive compensation is a serious problem

Concerned Rentech Shareholders
$10 $14 $18 $22 $29
$44 $54
$63
($32)
($104)
($149)
($166)
($208)
($227)
($175)
($200)
($275)
($225)
($175)
($125)
($75)
($25)
$25
$75
2006 2007 2008 2009 2010 2011* 2012 2013
20
06
-20
13
Cu
mu
lati
ve
To
tal ($
M)
Executive Compensation Adj. Free Cash Flow*
Profits for Management
Losses for Shareholders
Management Has Benefited At The Expense of
Shareholders
60
*Adj. Free Cash Flow defined as Operating Cash Flow less Stock Based Compensation less Capital Expenditures
excluding Growth Capex.
Total compensation at grant value paid to all listed RTK and RNF executives. Source: company SEC flings.

Concerned Rentech Shareholders
12.0%
--
2.0%
4.0%
6.0%
8.0%
10.0%
12.0%
14.0%
20
12
NE
O C
om
p.
% o
f F
Y A
vg
. M
ark
et
Va
lue
Top 5 NEO Compensation % of FY 2012 Avg. Market Value
Median: 1.0%
Excessive Executive Compensation Highlights Pervasive
Corporate Cost Issues
61 See Appendix M for details.

Concerned Rentech Shareholders
THE PATH FORWARD
“Oversight drives accountability,
accountability drives performance,
performance drives the stock price”
62

Concerned Rentech Shareholders
93
127
151 165
174
216 223 223 226
???
???
--
50
100
150
200
250
300
350
2005 2006 2007 2008 2009 2010 2011 2012 2013 2014E 2015E
Avg
. D
ilu
ted
Sh
are
s (
mil
)
RTK Diluted Share Count
Recent comments from management indicate
additional dilution could be on the horizon
Under Current Leadership, Shareholders Have Been
Materially Diluted, Receiving Little In Return…
63 Source: company SEC filings

Concerned Rentech Shareholders
Change
12/31/2011 12/31/2012 12/31/2013 2011-2013
CASH
RTK ex-RNF $193 $86 $72 ($120)
RNF $45 $56 $34 ($11)
RTK Consolidated $237 $142 $106 ($131)
DEBT
RTK ex-RNF $49 $ -- $102 $53
RNF $ -- $193 $320 $320
RTK Consolidated $49 $193 $422 $373
NET CASH (DEBT)
RTK ex-RNF $144 $86 ($30) ($173)
RNF $45 ($137) ($286) ($331)
RTK Consolidated $189 ($52) ($316) ($504)
…While Financial Risk Has Also Materially Increased
64
Balance sheet “cushion” is all but gone after the
acquisition of Agrifos and addition of the wood pellet projects
Source: company SEC filings

Concerned Rentech Shareholders
This Board and management team have proven they are not credible stewards
of shareholder capital
Rentech is no longer an alternative energy venture – neither the Board nor
management have the background to govern an industrials/materials company
The Company’s wood strategy requires the allocation of significant additional
shareholder capital – shareholders must have true representatives in the
boardroom to ensure these decisions are made with their best interests in mind
Value enhancing alternatives must be explored independent of management
We believe change is needed given the incumbent Board’s apparent tolerance
of drastic stock underperformance…
The continued pattern of missteps and risk-taking raises questions
about this Board’s ability and commitment to act as our fiduciaries
A Reconstitution of the Board Is The Only Credible
Solution to Protecting Shareholders’ Interests
65
Total Return Performance
Ramsbottom
6 Mo 1 Yr 2 Yr 3 Yr 5 Yr Start as CEO
RTK (14%) (23%) (5%) 65% 225% (48%)
Peer Group Avg. 18% 42% 65% 92% 479% 218%
Relative Performance (32%) (64%) (71%) (27%) (254%) (266%)
Returns through 3/21/2014. Source: FactSet. Peer Group based on 2013 Peer Group as in RTK 2013 10K.

Concerned Rentech Shareholders
Operational Changes
Reduce corporate overhead costs
Develop a credible plan to fix Agrifos and limit inventory risk going forward
Independently evaluate the best risk-adjusted path to grow wood assets
Realize maximum value for shareholders from wood assets, including a
possible MLP or spin-off
Strategic Changes
Seek to elect CRS’ four highly qualified nominees to the Board
Align executive compensation with drivers of shareholder value
Establish a disciplined capital allocation program that will deliver the best
risk-adjusted returns, not growth at any cost
Explore all value enhancing alternatives that could benefit shareholders
independent of management, including sale of assets and/or tax plan
Our Plan
66

Concerned Rentech Shareholders
Currently there is sizable tax leakage between RTK and RNF
Distributions and value of RTK’s stake in RNF are taxed at corporate rates
A proposed restructuring plan (the “tax plan”) exists that would:
Redirect all fertilizer distributions directly to RTK shareholders
Sizably mitigate the corporate tax burden at RTK (C-corp)
If feasible, this tax plan could create significant value for RTK shareholders
RTK directors told us that even if the plan could be enacted, it would not create
material value – we do not see how this is possible
Sensitivity Tables Illustrate Potential Value Creation from Tax Plan
Valuation scenarios indicate increase in value of RTK’s RNF stake compared to if RTK’s RNF stake was taxed at
40%. % up based on RTK price as of 3/21/14. Per share valuation based on 244M diluted shares.
Potential Tax Restructuring Could Create Significant
Shareholder Value…
67
Value Created From Tax Plan (per share) % Value Created From Tax Plan
RNF Stock Price RNF Stock Price
$16 $20 $24 $28 $32 $16 $20 $24 $28 $32
-- $0.61 $0.76 $0.91 $1.07 $1.22 -- 34% 42% 50% 59% 67%
Tax Rate 10% $0.46 $0.57 $0.69 $0.80 $0.91 Tax Rate 10% 25% 31% 38% 44% 50%
to RTK 20% $0.30 $0.38 $0.46 $0.53 $0.61 to RTK 20% 17% 21% 25% 29% 34%
holders 30% $0.15 $0.19 $0.23 $0.27 $0.30 holders 30% 8% 10% 13% 15% 17%
40% $ -- $ -- $ -- $ -- $ -- 40% -- -- -- -- --

Concerned Rentech Shareholders
Under the proposed new corporate structure:
RTK shareholders would exchange common shares for new MLP units
Fertilizer distributions would flow through directly to current RTK shareholders
without (or with a reduced) corporate-level tax
The wood assets could form a new public company which would be spun out to
current RTK shareholders
We believe financing for the wood business could be readily available if future
projects are attractive, especially if converted to an MLP
We believe management is personally incentivized not to consider the tax
plan as it would mean a) loss of access to RNF distributions, and b)
potentially reduced compensation as size of the Company shrinks
In the past, advisors hired by management (not the Board) reviewed the tax
plan with the Company deciding it was not viable
We believe the Board, independent of management, should review the
proposal with the best interests of shareholders in mind
We do not know if this plan is feasible, but without
shareholder representatives on the Board, we may never know
…But the Opportunity Needs To Be Evaluated Objectively
and Independent of Management
68

Concerned Rentech Shareholders
Opportunity Current Leadership’s Approach Why Shareholder Representation is Needed
Reduce
corporate
costs
• Maintain bloated cost structure
• Excessive compensation
• Plans to grow into cost structure require
~9x increase in revenues
• Management appears to benefit at the expense of shareholders
• Current cost structure incentivizes management to pursue risky
growth strategies in order to justify the status quo
• Wasteful spending reduces cash available for value creation
Correct
capital
allocation
• Disastrous track record of funding risky
ventures and poor acquisitions
• Strategy to pursue inorganic growth
despite limited operational experience
• Management is incentivized to grow the size of the company, even
when value is not created for shareholders
• Company’s “growth plans” are used to justify management’s
compensation and corporate cost structure
Fix Agrifos • Hope for favorable market dynamics
• Offer explanations which lack credibility
• Current leadership did not understand Agrifos’ business
• Independent analysis needed to asses issues and develop a plan
Maximize
value of
wood assets
• Learn on the job and hope to execute
• Pursue additional pellet acquisitions and
development projects before ever
operating a single plant
• MLP wood business in the future
• Growth in wood business will require additional acquisitions/projects
– current leadership’s capital allocation history is exceptionally poor
• Issues with current projects highlight a penchant for risk taking
(already exploring additional deals without having ever shipped a
pellet, collateralizing RNF shares, proceeding without a JV partner)
• In our view, shareholder representation will in no way impair RTK’s
ability to create value with the wood assets – it will enhance capital
allocation discipline, execution focus, and risk mitigation
Explore plan
to reduce tax
leakage
• Evaluated by management’s advisors
• Directors concluded tax strategy would
not create value
• Decided to not pursue tax strategy
• Management is incentivized to NOT consider tax strategy plan
• Shareholder representation is, in our view, the only feasible way to
ensure the tax proposal is reviewed with shareholders in mind
Consider
strategic
alternatives
for RNF
• Shun interest in fertilizer assets from
credible strategic buyers
• Continue to use RNF to fund RTK
growth (AE first, now wood pellets)
• Current RTK CEO and CFO are
employees at both RTK and RNF
• We believe strategic acquirers have recently approached the
Company regarding RNF and were rebuffed by management
• Shareholder representation is needed to ensure path forward
maximizes value for shareholders, regardless of management impact
Multiple Ways To Create Value For Shareholders
69

Concerned Rentech Shareholders
Material Upside With Prudent Oversight
Value per Share Segment Our Plan
$1.33 - $1.82 Ownership of RNF
(After Tax)
Improve profitability at Pasadena
Prevent future acquisition blunders (like Agrifos)
More prudently manage debt balance
Evaluate potential sale to strategic buyer
$0.90 - $1.49 Wood Fibre
Business
Ensure focus remains on execution
Implement disciplined capital allocation framework to pursue
growth opportunities
Limit equity dilution of RTK shareholders
($0.23) – ($0.18) Corporate SG&A
Significantly reduce overhead costs
Align compensation with drivers of shareholder value
Executive expertise should match current business mix
Increases share price by ~$0.35 vs. current cost structure
$0.00 - $0.66 Tax Restructuring
Plan
Evaluate plan independent of management
Pursue optimal outcome for shareholders
$0.56 Other NOL’s, current cash balance, AE sale proceeds
$2.56 - $4.35 Total RTK Shareholder representation required to realize full value
70 See Appendix N for details
Concerned Rentech Shareholders
Our Nominees
“True Stewards of Shareholders’ Capital”
71

Concerned Rentech Shareholders
Mr. Brown, age 52, is the Chief Executive Officer and founding member of Brown Equity Partners, LLC
(“BEP”), which provides capital to management teams and companies needing equity. Prior to
founding BEP in January 2007, Mr. Brown served as a founding partner and primary deal originator of
the venture capital and private equity firm Forrest Binkley & Brown (“FBB”) from 1993 to January 2007.
Prior to founding FBB, Mr. Brown served as a Senior Vice President of Bank America Venture Capital
Group from 1990 to 1993 and as a Senior Vice President of Security Pacific Capital Corporation from
1987 to 1990. Mr. Brown also worked at the preferred stock desk of Morgan Stanley & Co. (NYSE:
MS) in 1986 and as a software engineer at Hughes Aircraft Company from 1983 to 1985. Since 2012,
Mr. Brown has served on the board of directors of Nordion Inc. (NYSE:NDZ) where he is a member of
each of the EHS/Governance and Finance/Audit Committees. From September 2009 until resigning in
October 2011, Mr. Brown served as a director of Steadfast Income REIT, Inc.
Mr. Brown received a Bachelor of Science in Mathematics, Summa Cum Laude, from Willamette
University and a Master of Business Administration from the Stanford University Graduate School of
Business.
In his 27 years of venture capital and private equity experience, Mr. Brown has served on the board of
directors of approximately 40 public and private companies, including as the chairman of 10 such
boards, and has served as the chair of audit, compensation, finance and other special board
committees of such boards. Mr. Brown’s extensive public and private company board experience and
investment and transaction experience will make him a valuable addition to the Board.
Our Nominees:
Jeffrey J. Brown
72
Concerned Rentech Shareholders
Mr. Eberwein, age 43, is the founder and Chief Executive Officer of Lone Star Value Management, an
investment firm. Prior to founding Lone Star Value Management in January 2013, Mr. Eberwein was a
private investor from December 2011 to December 2012. He was a portfolio manager at Soros Fund
Management, from January 2009 to December 2011, and Viking Global Investors, from March 2005 to
September 2008. Mr. Eberwein has been a director of Aetrium Incorporated (NASDAQ:ATRM) since
January 2013 and is currently the Chairman of the Board and a member of its Audit and
Compensation Committees. Mr. Eberwein is also the Chairman of the Board of each of Digirad
Corporation (NASDAQ:DRAD) (“Digirad”) and Crossroads Systems, Inc. (NASDAQ:CRDS)
(“Crossroad Systems”), and also is a member of the Compensation, Corporate Governance and
Strategic Advisory Committees of Digirad. He has also been a director of NTS, Inc. (NYSE:NTS)
(“NTS”) since December 20, 2012 and On Track Innovations Ltd. (NADAQ: OTIV) (“On Track
Innovations”) since December 30, 2012. Mr. Eberwein serves on the Corporate
Governance/Nominating, Compensation and Special Committees of NTS, the Audit and
Compensation Committees of On Track Innovations, and is the Chairman of the Audit Committee and
a member of the Compensation and Corporate Governance Committee of Crossroads Systems. Mr.
Eberwein served as a director of Goldfield Corporation from May 2012 to May 2013. Mr. Eberwein is
also the treasurer and serves on the Executive Committee of the Board of Hope for New York, a
501(c)(3) organization dedicated to serving the poor in New York City.
Mr. Eberwein earned an MBA from The Wharton School, University of Pennsylvania and a BBA with
high honors from The University of Texas at Austin.
Mr. Eberwein’s over twenty years of Wall Street experience and valuable public company and financial
expertise, gained from both his employment history and directorships, will enable him to provide
effective oversight of the Company as a member of the Board.
Our Nominees:
Jeffrey E. Eberwein
73
Concerned Rentech Shareholders
Mr. Holley, age 65, is currently the President and Chief Operating Officer of The CBM Group, LLC
(“CBM”). Mr. Holley formed CBM in February 2006 primarily as a consulting vehicle to engage with
private equity in company valuations in the fertilizer sector. Mr. Holley was most recently the President
and General Manager of Noranda Alumina LLC where he managed an alumina refinery in Louisiana
and a bauxite mining operation in Jamaica, from May 2008 to December 2009. Prior to that, Mr. Holley
was Senior Vice President and Chief Operating Officer of Mississippi Chemical Corporation (“MCC”)
where he was employed from November 1974 until January 2005. While at MCC, Mr. Holley served in
many management capacities across the corporation including engineering, energy acquisition,
procurement and production. While at MCC, Mr. Holley served as President of Nitrogen Production
from July 1997 until December 2003, excluding a two year period from November 1998 to November
2000 when he was seconded to MCC’s joint venture operations in Trinidad, West Indies as President
of FarmlandMissChem Ltd. In December 2003, Mr. Holley was promoted to Senior Vice President and
Chief Operating Officer of MCC to take full charge of company operating activities. MCC successfully
emerged from bankruptcy in December 2004 and was purchased by Terra Industries Inc. Mr. Holley is
a past member of the board and executive committee of The Fertilizer Institute.
Mr. Holley received his Bachelor of Science in Electrical Engineering from Mississippi State University.
Mr. Holley’s over 35 years of experience in the fertilizer, chemical and mining industries will make him
a valuable addition to the Board.
Our Nominees:
Larry Holley
74

Concerned Rentech Shareholders
Mr. Welling, age 43, is the Founder and Chief Investment Officer of Engaged Capital, a California
based activist investment firm and registered advisor with the SEC focused on investing in small and
mid-cap North American equities. Prior to founding Engaged Capital in February 2012, Mr. Welling was
Principal and Managing Director at Relational Investors LLC (“Relational”), a $6 billion activist equity
fund and registered investment adviser with the SEC, from June 2008 to October 2011 and served as
its consultant from October 2011 until April 2012. Mr. Welling managed Relational’s consumer,
healthcare and utility investments and was responsible for investment selection, strategic development
and catalyzing change at Relational’s portfolio companies. Prior to Relational, Mr. Welling was a
Managing Director at Credit Suisse Group AG (“Credit Suisse”) (NYSE:CS), a leading global financial
services company, where he was the Global Head of the Investment Banking Department’s Advisory
Businesses, which included The Buy-Side Insights (HOLT) Group, Financial Strategy Group and
Ratings Advisory Group. Mr. Welling served in such capacities at Credit Suisse from February 2002 to
May 2008. Previously, Mr. Welling served as Partner and Managing Director of HOLT Value Associates
L.P. (“HOLT”), a then leading provider of independent research and valuation services to asset
managers, from October 1999 until January 2002 when HOLT was acquired by Credit Suisse. Prior to
HOLT, he was the Managing Director of Valuad U.S., a financial software and training company, and
senior manager at A.T. Kearney, one of the world’s largest global management consulting firms. Mr.
Welling also teaches executive education courses at The Wharton School of Business and is a
frequent speaker at finance and investing conferences.
He graduated from The Wharton School of the University of Pennsylvania where he currently serves
as the Chairman of the school’s tennis program and as a member of the Wharton School’s Executive
Education Board.
Mr. Welling’s expertise in working with senior management teams and boards of directors to assist
them in understanding the drivers of valuation and the strategies they can employ to increase the
value of their companies, including his experience with Relational and his investment banking
experience with Credit Suisse in a senior executive capacity, will enable him to provide effective
oversight of the Company as a member of the Board.
Our Nominees:
Glenn W. Welling
75
Concerned Rentech Shareholders
APPENDIX
76
Concerned Rentech Shareholders
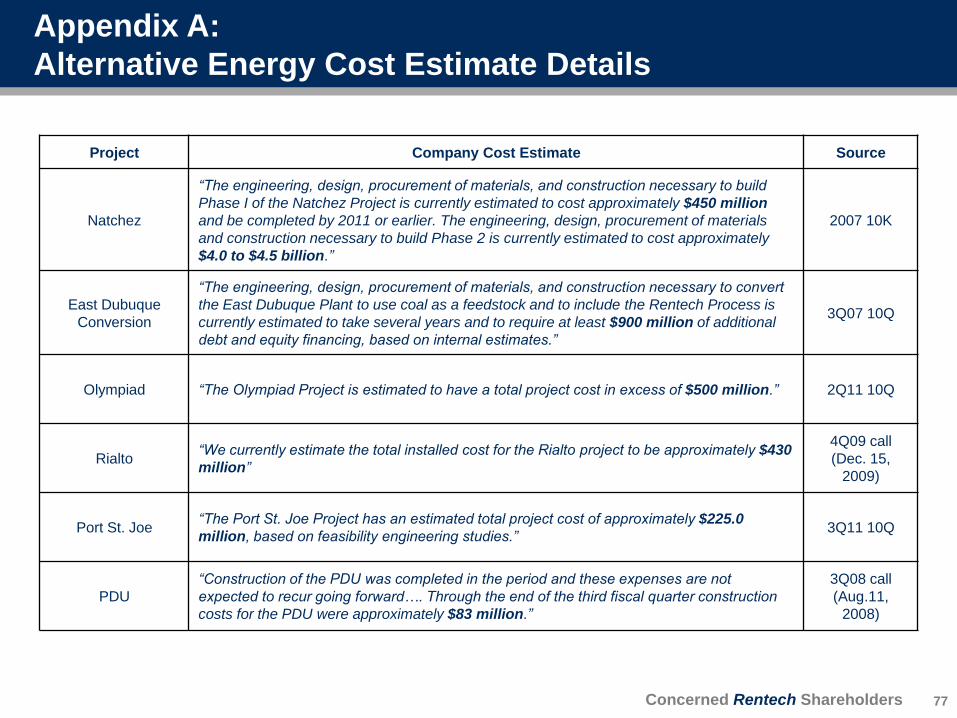
Project Company Cost Estimate Source
Natchez
“The engineering, design, procurement of materials, and construction necessary to build
Phase I of the Natchez Project is currently estimated to cost approximately $450 million
and be completed by 2011 or earlier. The engineering, design, procurement of materials
and construction necessary to build Phase 2 is currently estimated to cost approximately
$4.0 to $4.5 billion.”
2007 10K
East Dubuque
Conversion
“The engineering, design, procurement of materials, and construction necessary to convert
the East Dubuque Plant to use coal as a feedstock and to include the Rentech Process is
currently estimated to take several years and to require at least $900 million of additional
debt and equity financing, based on internal estimates.”
3Q07 10Q
Olympiad “The Olympiad Project is estimated to have a total project cost in excess of $500 million.” 2Q11 10Q
Rialto “We currently estimate the total installed cost for the Rialto project to be approximately $430
million”
4Q09 call
(Dec. 15,
2009)
Port St. Joe “The Port St. Joe Project has an estimated total project cost of approximately $225.0
million, based on feasibility engineering studies.” 3Q11 10Q
PDU
“Construction of the PDU was completed in the period and these expenses are not
expected to recur going forward…. Through the end of the third fiscal quarter construction
costs for the PDU were approximately $83 million.”
3Q08 call
(Aug.11,
2008)
Appendix A:
Alternative Energy Cost Estimate Details
77

Concerned Rentech Shareholders
Natural Gas cost in COGS based on gas cost % of COGS as disclosed in company filings
Ammonia & Sulfur cost in COGS based on ammonia and sulfur cost % of COGS as disclosed in company filings.
Raw Margin refers to actual gross margin of revenue less primary raw material cost (natural gas for East Dubuque,
ammonia and sulfur for Agrifos)
Change:
4Q12 1Q13 2Q13 3Q13 4Q13 4Q13 vs 4Q12
EAST DUBUQUE
Ammonia Price ($/t) $676 $739 $741 $530 $582 (14%)
UAN Price ($/t) $301 $301 $360 $269 $264 (12%)
Revenue $55.0 $34.5 $96.3 $50.6 $30.9
Natural Gas Cost $9.3 $6.6 $11.4 $12.3 $11.7
Raw Material Cost % of Sales 17% 19% 12% 24% 38%
Raw Margin % 83% 81% 88% 76% 62% (25%)
AGRIFOS
Ammonium Sulfate Price ($/t) $300 $320 $289 $238 $190 (37%)
Revenue $37.4 $25.0 $42.2 $42.7 $23.7
Ammonia & Sulfur Cost $25.0 $14.9 $27.1 $28.1 $17.8
Raw Material Cost % of Sales 67% 60% 64% 66% 75%
Raw Margin % 33% 40% 36% 34% 25% (25%)
Appendix B:
Agrifos Margin & Price Volatility
78
Concerned Rentech Shareholders
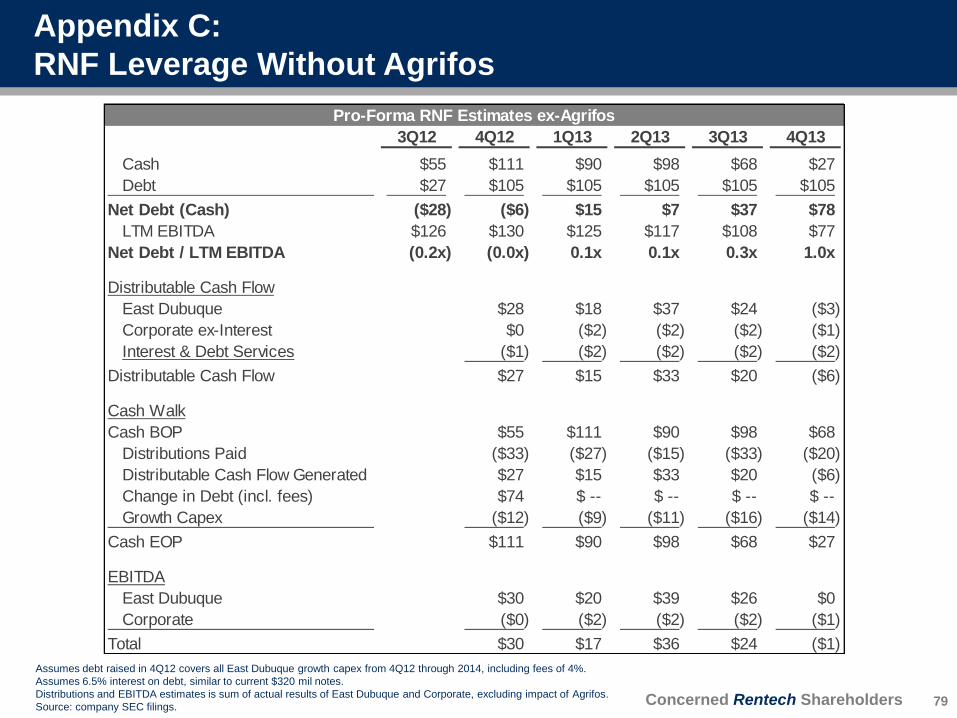
Appendix C:
RNF Leverage Without Agrifos
79
Pro-Forma RNF Estimates ex-Agrifos
3Q12 4Q12 1Q13 2Q13 3Q13 4Q13
Cash $55 $111 $90 $98 $68 $27
Debt $27 $105 $105 $105 $105 $105
Net Debt (Cash) ($28) ($6) $15 $7 $37 $78
LTM EBITDA $126 $130 $125 $117 $108 $77
Net Debt / LTM EBITDA (0.2x) (0.0x) 0.1x 0.1x 0.3x 1.0x
Distributable Cash Flow
East Dubuque $28 $18 $37 $24 ($3)
Corporate ex-Interest $0 ($2) ($2) ($2) ($1)
Interest & Debt Services ($1) ($2) ($2) ($2) ($2)
Distributable Cash Flow $27 $15 $33 $20 ($6)
Cash Walk
Cash BOP $55 $111 $90 $98 $68
Distributions Paid ($33) ($27) ($15) ($33) ($20)
Distributable Cash Flow Generated $27 $15 $33 $20 ($6)
Change in Debt (incl. fees) $74 $ -- $ -- $ -- $ --
Growth Capex ($12) ($9) ($11) ($16) ($14)
Cash EOP $111 $90 $98 $68 $27
EBITDA
East Dubuque $30 $20 $39 $26 $0
Corporate ($0) ($2) ($2) ($2) ($1)
Total $30 $17 $36 $24 ($1)
Assumes debt raised in 4Q12 covers all East Dubuque growth capex from 4Q12 through 2014, including fees of 4%.
Assumes 6.5% interest on debt, similar to current $320 mil notes.
Distributions and EBITDA estimates is sum of actual results of East Dubuque and Corporate, excluding impact of Agrifos.
Source: company SEC filings.

Concerned Rentech Shareholders
Appendix D:
RNF Leverage With Agrifos
80 Actual results, including Agrifos. Source: company SEC flings
Actual RNF Results
3Q12 4Q12 1Q13 2Q13 3Q13 4Q13
Cash $55 $56 $50 $113 $85 $34
Debt $27 $193 $207 $320 $320 $320
Net Debt (Cash) ($28) $137 $157 $207 $235 $286
EBITDA $33 $28 $21 $38 $16 ($9)
LTM EBITDA $126 $128 $127 $120 $104 $66
Net Debt / LTM EBITDA (0.2x) 1.1x 1.2x 1.7x 2.3x 4.3x
Distributable Cash Flow $29 $19 $33 $10 $2
Cash Reserve Used $5 $4 $2 $0 $19
Distributions ex Cash Reserves $25 $15 $31 $10 ($18)

Concerned Rentech Shareholders
Source Cost Estimate Commentary
2005 10K $21 million “Rentech expects the PDU to be operating by the end of calendar 2006, and to
cost approximately $21 million.”
2006 10K $40 million “We expect construction of the PDU to be completed by the third calendar
quarter of 2007 and to cost approximately $40 million.”
2007 10K $61 million
“We expect alternative fuels production at the PDU to begin in the spring of
2008. We currently estimate that construction of the PDU will cost approximately
$61 million”
3Q08 earnings
call (Aug.11,
2008)
$83 million
“Construction of the PDU was completed in the period and these expenses are
not expected to recur going forward…. Through the end of the third fiscal quarter
construction costs for the PDU were approximately $83 million.”
Appendix E:
PDU Estimated Conversion Cost History
81

Concerned Rentech Shareholders
Source Cost Estimate Commentary
1Q13 10Q $70 million
“We estimate that the total cost to acquire and convert the Wawa and Atikokan
Projects will be approximately $70.0 million, of which approximately $65.0
million is expected to be expended during 2013. We expect to fund the cost of
these projects from cash on hand, distributions from RNP, cash generated
by Fulghum, and anticipated joint venture investments from Graanul.”
2Q13 10Q $70 million
“We estimate that the total cost to acquire and convert the Wawa Project and
Atikokan Project will be approximately $70.0 million, of which approximately
$60.0 million is expected to be expended during 2013. We expect to fund the
cost of these projects from cash on hand, distributions from RNP, cash
generated by Fulghum, cash from the sale of our Natchez property if completed,
and anticipated joint venture investments from Graanul.”
3Q13 10Q $78 million
“the JV determined that the Wawa Project and the Atikokan Project would not be
transferred into the JV. Therefore, we will continue to own 100% of both projects.
We estimate that the total cost to acquire and convert the Wawa Project and
Atikokan Project are expected to exceed $78.0 million.”
2013 10K $90 million
“the Rentech/Graanul JV determined that the Wawa Project and the Atikokan
Project would not be purchased by the Rentech/Graanul JV. Therefore, we will
continue to own 100% of both projects. We estimate that the total cost to acquire
and convert the Wawa Project and Atikokan Project are expected to be
approximately $90.0 million with approximately $66.0 million to be spent during
2014.”
Appendix F:
Pellet Project Cost Estimate History
82
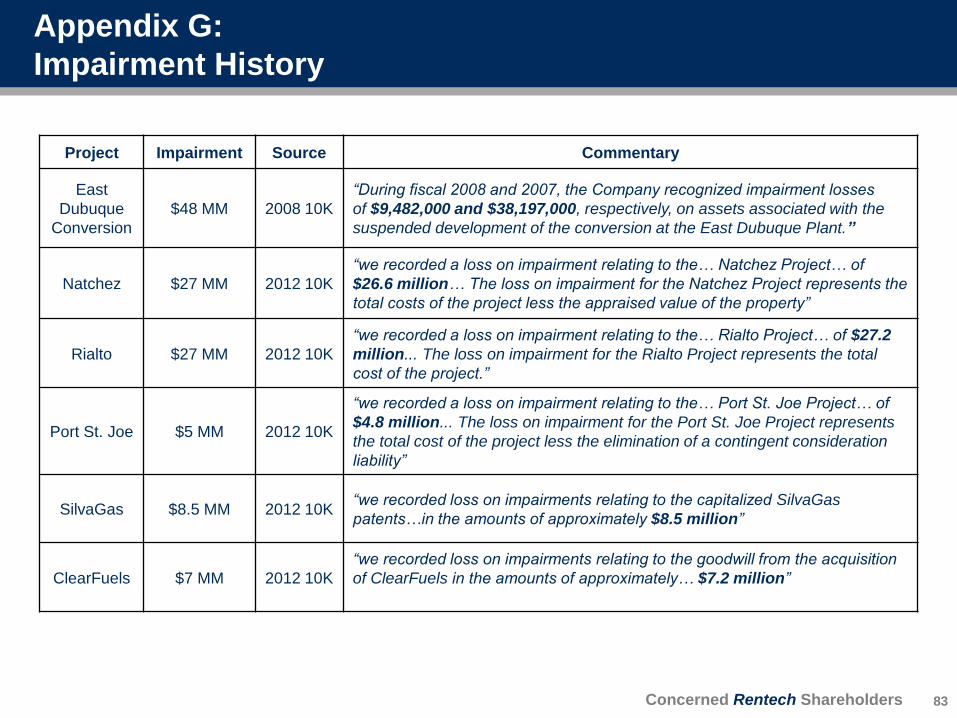
Concerned Rentech Shareholders
Project Impairment Source Commentary
East
Dubuque
Conversion
$48 MM 2008 10K
“During fiscal 2008 and 2007, the Company recognized impairment losses
of $9,482,000 and $38,197,000, respectively, on assets associated with the
suspended development of the conversion at the East Dubuque Plant.”
Natchez $27 MM 2012 10K
“we recorded a loss on impairment relating to the… Natchez Project… of
$26.6 million… The loss on impairment for the Natchez Project represents the
total costs of the project less the appraised value of the property”
Rialto $27 MM 2012 10K
“we recorded a loss on impairment relating to the… Rialto Project… of $27.2
million... The loss on impairment for the Rialto Project represents the total
cost of the project.”
Port St. Joe $5 MM 2012 10K
“we recorded a loss on impairment relating to the… Port St. Joe Project… of
$4.8 million... The loss on impairment for the Port St. Joe Project represents
the total cost of the project less the elimination of a contingent consideration
liability”
SilvaGas $8.5 MM 2012 10K “we recorded loss on impairments relating to the capitalized SilvaGas
patents…in the amounts of approximately $8.5 million”
ClearFuels $7 MM 2012 10K
“we recorded loss on impairments relating to the goodwill from the acquisition
of ClearFuels in the amounts of approximately… $7.2 million”
Appendix G:
Impairment History
83

Concerned Rentech Shareholders
COMPANY ESTIMATES Adjustments EC ASSUMPTIONS
2014E SG&A 2014E SG&A
Alternative Energy $5 Pro-forma for shutdown Alternative Energy $ --
Wood Pellets $7 ~5% of sales; ex $1M start-up costs Wood Pellets $1
Corporate $22 Includes $5M pellet biz. dev. expense Corporate $27
RTK ex-RNF & FF $34 RTK ex-RNF & FF $28
Fulghum Fibres $5 Fulghum Fibres $5
RTK ex-RNF $39 RTK ex-RNF $33
RNF $20 RNF $20
RTK Consolidated $59 RTK Consolidated $53
Appendix H:
SG&A Expense Details
84 Source: RTK presentation on 3/11/2014; CRS estimates.
RNF estimate based on FactSet consensus estimates.

Concerned Rentech Shareholders
COMPANY ESTIMATES
2014E RTK ex-RNF SG&A
Corporate Cash Expense $15.0
Stock Compensation $7.0
Total Corporate SG&A Expense $22.0
Wood Pellets $7.0
Fulghum Fibres $5.0
Alternative Energy $5.0
Total SG&A $39.0
Total Cash SG&A $32.0
Stock Compensation $7.0
Total SG&A $39.0
EC ASSUMPTIONS - PRO-FORMA
2014E RTK ex-RNF SG&A
Corporate Cash Expense $15.0
Pellet Business Development Cash Expense $5.0
Stock Compensation $7.0
Total Corporate SG&A Expense $27.0
Wood Pellets $1.0
Fulghum Fibres $5.0
Alternative Energy $ --
Total SG&A $33.0
Total Cash SG&A $26.0
Stock Compensation $7.0
Total SG&A $33.0
Biz. Dev.
considered
corporate expense
Less $1mil
start-up costs;
~5% of sales
Pro Forma for
AE shutdown
Appendix I:
Corporate Cost Details
85 Source: RTK presentation on 3/11/2014; CRS estimates
Concerned Rentech Shareholders
Peer group consists of companies which have a comparable reported
corporate segment and are members of either the 2010, 2012, or 2013 peer
groups listed in RTK’s 10-K’s or proxy statements or the Alternative Energy
Peer Group referenced in RTK’s 2013 10-K (Ardour Global Alternative
Energy Index-North America)
Financial information directly from company SEC filings
Corporate expense includes stock compensation, excludes depreciation
and amortization and other “one-time” adjustments per CRS
All peer financial figures based on 2013 fiscal year, other than ADES, REX,
and AVX, which have not yet filed fiscal 2013 financials. Data for ADES,
REX, and AVX based on trailing twelve months financials.
RTK ex-RNF numbers are pro-forma for 2014 as presented in RTK’s March
11, 2014 presentation and as adjusted by CRS. RTK numbers do not
include any impact of RNF as fertilizer related expenses are allocated to
RNF. See appendices H & I for calculation details.
Appendix J:
Methodology for Peer Corporate Expense Analysis
86

Concerned Rentech Shareholders
Peer group used is “2013 Peer Group” from Rentech’s 2013 10-K filing
Financial information directly from company SEC filings
All peer financial figures based on 2013 fiscal year, other than ADES, REX,
and HWKN, which have not yet filed fiscal 2013 financials. Data for ADES,
REX, and AVX based on trailing twelve months financials.
SG&A and Gross Margin adjusted to remove impact of depreciation and
amortization and other “one-time” adjustments per CRS. Unless otherwise
stated in company filings, assume that D&A is included in company reported
gross margins.
RTK ex-RNF numbers are pro-forma for 2014 as presented in RTK’s March
11, 2014 presentation and as adjusted by CRS. RTK numbers do not
include any impact of RNF as fertilizer related expenses are allocated to
RNF. See appendix H for calculation details.
Appendix K:
Methodology for SG&A % of Sales Analysis
87

Concerned Rentech Shareholders
All compensation figures directly from company SEC filings
Peer group used is “2013 Peer Group” from Rentech’s 2013 10-K filing
Executive compensation based on grant date fair value for options and stock awards
Compensation for other named executive officers (“NEO”) is sum of compensation paid to
top four NEOs other than the CEO. If less than four other NEOs are listed in the proxy,
estimates made based on relative compensation to other company executives in other
reported periods.
Executive compensation portrayed in charts is cumulative total compensation paid in seven
years from fiscal 2006 to fiscal 2012. If company was not public for entire period, then
assume executives received the same average annual compensation received in reported
years in periods prior to the company going public.
Market value used is average market value from seven years beginning at the end of fiscal
2005 through the end of fiscal 2012. If company was not public for entire period, use
average market value since going public through end of fiscal 2012. RTK start date is
12/15/2005, the date CEO Hunt Ramsbottom assumed current role. Market value data
sourced from FactSet.
Total return presented is for seven years beginning at the end of fiscal 2005 through the
end of fiscal 2012. If company was not public for entire period, assume start date is first
day company traded publicly. RTK start date is 12/15/2005, the date CEO Hunt
Ramsbottom assumed current role. Total return data sourced from FactSet.
88
Appendix L:
Methodology for Executive Compensation Analysis

Concerned Rentech Shareholders
All compensation figures directly from company SEC filings
Peer group used is “2013 Peer Group” from Rentech’s 2013 10-K filing
Executive compensation based on grant date fair value for options and stock awards
Compensation for other named executive officers (“NEO”) is sum of compensation paid to
top four NEOs other than the CEO. If less than four other NEOs are listed in the proxy,
estimates made based on relative compensation to other company executives.
Market value used is average market value throughout each company’s fiscal 2012. CRS
used 2012 for compensation data as 2013 data is not yet available for all companies.
Market value data sourced from FactSet.
RTK ex-RNF compensation is estimate for compensation paid to top 5 RTK executives for
non-fertilizer related services. RTK ex-RNF compensation for CEO Ramsbottom and CFO
Cohrs is difference between total RTK compensation received (from RTK 2012 proxy) and
compensation allocated to RNF (from RNF 2012 10K). We assume 50% and 34% of total
compensation received by Mr. Diesch and Mr. Morris, respectively, is allocated to RTK ex-
RNF.
Market value of RTK ex-RNF is market implied estimate based on the public market values
of RTK and RNF. Market value of RTK ex-RNF is the difference between RTK’s total
market value and the value of RTK’s ownership in RNF, which is calculated by multiplying
RTK’s 23.25 million owned shares by the market price of RNF less a 37.5% corporate tax
rate.
89
Appendix M:
RTK ex-RNF Executive Compensation Analysis

Concerned Rentech Shareholders
All potential equity valuations are CRS’s good faith estimates based on reasonable
assumptions detailed below and are conditional upon the successful execution of a strategic
plan along the lines proposed by CRS
Ownership of RNF: based on $2.00 - $2.60 normalized distribution, 8.5% - 9.0% yield, and
a 37.5% corporate tax rate on value of RTK’s RNF shares. Valuation range does not
contemplate a sale of RNF which could add additional upside.
Tax Restructuring Plan: assumes if tax plan is feasible effective corporate tax rate applied
to RNF shares can be reduced to 15%, down from base assumption of 37.5%
Wood Fibre Business: based on $34 - $37M of EBITDA (net of $3M incremental public
company cost) and 11.0x – 14.0x EV/EBITDA multiple. Includes current wood based debt
plus additional cost to complete pellet projects. Excludes any additional acquisitions or
development projects.
Corporate SG&A: based on $9 - $11M of corporate SG&A, including benefits of shared
services with RNF. Valuation increase vs. current cost structure assumes the same multiple
and $27.0M of corporate SG&A (see Appendix I)
Other: includes $136M of Net Operating Losses, $72M of current cash, $1M of already
declared distributions from RNF, and $15M of proceeds from sale of Alternative Energy
assets
Value per share based on 244 million fully diluted shares
90
Appendix N:
Valuation Walk Key Assumptions

Concerned Rentech Shareholders
91
Key Contacts
Investors: Media:
Okapi Partners LLC Bayfield Strategy, Inc.
Bruce Goldfarb, Chuck Garske, or Lisa Patel Riyaz Lalani
212-297-0720 416-907-9365