Embed Size (px)
Citation preview
Over the course of 2010–2011, in order to better understand the nature and effects of urban poverty on chil-dren in Ghana, UNICEF worked with the Institute of Statistical, Social and Economic Research to carry out a Multiple Indicator Cluster Survey (MICS) in Accra, the country’s capital city and largest urban area. UNICEF uses MICS, an international household survey initia-tive, to assist countries in collecting and analysing data to monitor the situation of children and women.
Poverty levels across Ghana have been falling over the past two decades, and the country is on track to halve its poverty rate by 2015 and meet Millennium Development Goal 1. According to the Ghana Living Standards Survey, the percentage of the population living in
poverty dropped from 51.7 per cent in 1991/92 to 39.5 per cent in 1998/99, and then again to 28.5 per cent in 2005/06. In Accra, however, while poverty preva-lence fell from 23 to 4 per cent over the first period, it then increased from 4 to 11 per cent between 1998/99 and 2005/06.
The MICS survey in Accra focused on five densely populated and underprivi-leged suburbs: James Town, La, New Town, Nima and Bubiashie. These were chosen for their low incomes, high unem-ployment, dilapidated infrastructure, poor sanitation, frequent outbreaks of commu-nicable diseases and vulnerability to natural disasters.
The sample consisted of 1,409 house-holds. A total of 2,354 individuals were interviewed: 1,294 women, 607 men and
453 children. The study found a sizeable proportion of single-person households (about 22 per cent).
The survey revealed that even disad-vantaged urban neighbourhoods are far from homogeneous, and that there are significant disparities between richer and poorer residents even within areas known to be ‘pockets of poverty’.
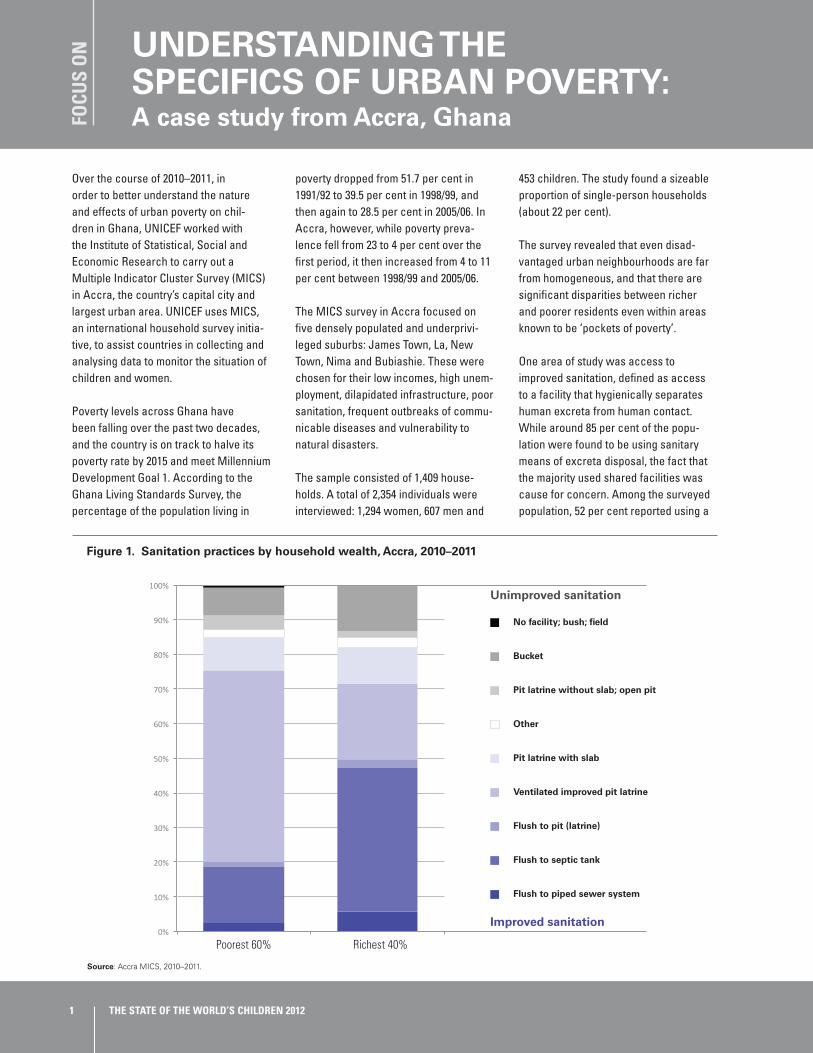
One area of study was access to improved sanitation, defined as access to a facility that hygienically separates human excreta from human contact. While around 85 per cent of the popu-lation were found to be using sanitary means of excreta disposal, the fact that the majority used shared facilities was cause for concern. Among the surveyed population, 52 per cent reported using a
FOCU
S O
N UNDERSTANDING THE
SPECIFICS OF URBAN POVERTY: A case study from Accra, Ghana
1 THE STATE OF THE WORLD’S CHILDREN 2012
0%
10%
20%
30%
40%
50%
60%
70%
80%
90%
100%
Figure 1. Sanitation practices by household wealth, Accra, 2010–2011
No facility; bush; field
Bucket
Pit latrine without slab; open pit
Other
Pit latrine with slab
Ventilated improved pit latrine
Flush to pit (latrine)
Flush to septic tank
Flush to piped sewer system
Poorest 60% Richest 40%
Unimproved sanitation
Improved sanitation
Source: Accra MICS, 2010–2011.

public facility, 12 per cent shared facili-ties with five or more other households, and 11 per cent used a facility shared by up to five households. Only 11 per cent of the population had access to a private improved sanitation facility.
Wealthier households were most likely to have flush toilets connected to a septic tank, while ventilated improved pit (VIP) latrines were the most common form of sanitation among poorer house-holds. Poorer households were also most likely to use public facilities.
Inadequate urban sanitation provision also affected the safe disposal of chil-dren’s excreta. Safe practice, defined as either disposal by the child using a toilet or children’s faeces being rinsed into a toilet or latrine, was practised
in only 34 per cent of cases. Almost 45 per cent of children’s excreta had been disposed of in garbage, and 19 per cent through drains or ditches. Wealthier households were more likely to engage in safe practices than poorer ones.
In another field of study that is rele-vant to child health, the MICS urban household survey found more equi-table and encouraging results. In the five neighbourhoods selected, 85.8 per cent of children aged 12–23 months had received all recommended vaccina-tions (BCG, polio, DPT, measles, yellow fever). No significant gender differ-ences were observed (boys, 85.3 per cent; girls, 86.2 per cent), and income-based differences were low (children in the poorer 60 per cent of households, 83.7 per cent; children in the richer 40
per cent of households, 89.0 per cent).
These examples attest to the impor-tance of obtaining accurate, disaggregated data specific to the urban situation in order to accurately assess and address areas that need urgent attention. Instruments such as MICS enable a better understand-ing of the patterns of disadvantage and the factors that adversely influ-ence outcomes for children – thus making it possible to target policies and programmes to the needs of specific urban populations.
Source: UNICEF Ghana Country Office.
2Children’s rights in urban settings
Ghana Statistical Service, Patterns and Trends of Poverty in Ghana, 1991–2006, Ghana Statistical Service, Accra, April 2007, p. 7; Ghana Statis-tical Service, Ghana Living Standards Survey: Report of the Fifth Round (GLSS 5), 2008; Institute of Statistical, Social and Economic Research, Accra Multiple Indicator Cluster Survey, Accra 2010–11: Final report, ISSER, Accra, September 2011, pp. xii, 45, 48.
Figure 2. Use of private, public and shared sanitation facilities, by household wealth, Accra, 2010–2011
72.7%
15.3%
8.4%
2.7% 1.0%
27.8%
25.9%21.3%
24.4%
0.7%
Public facility
Shared by 6+ households
Shared by 1–5 households
Private facility
No facility or not specified
Poorest 60% Richest 40%
Source: Accra MICS, 2010–2011.