Embed Size (px)
Citation preview

Cleveland State University Cleveland State University
EngagedScholarship@CSU EngagedScholarship@CSU
ETD Archive
2018
A Broadly Tunable Surface Plasmon-Coupled Wavelength Filter for A Broadly Tunable Surface Plasmon-Coupled Wavelength Filter for
Visible and Near Infrared Hyperspectral Imaging Visible and Near Infrared Hyperspectral Imaging
Ajaykumar Zalavadia
Follow this and additional works at: https://engagedscholarship.csuohio.edu/etdarchive
How does access to this work benefit you? Let us know! How does access to this work benefit you? Let us know!
Recommended Citation Recommended Citation Zalavadia, Ajaykumar, "A Broadly Tunable Surface Plasmon-Coupled Wavelength Filter for Visible and Near Infrared Hyperspectral Imaging" (2018). ETD Archive. 1066. https://engagedscholarship.csuohio.edu/etdarchive/1066
This Dissertation is brought to you for free and open access by EngagedScholarship@CSU. It has been accepted for inclusion in ETD Archive by an authorized administrator of EngagedScholarship@CSU. For more information, please contact [email protected].

A BROADLY TUNABLE SURFACE PLASMON-COUPLED
WAVELENGTH FILTER FOR VISIBLE AND NEAR
INFRARED HYPERSPECTRAL IMAGING
AJAYKUMAR ZALAVADIA
Bachelor of Pharmacy Rajiv Gandhi University of Health Sciences
2007
Master of Science in Analytical Chemistry Governors State University
2009
Submitted in partial fulfillment of the requirements for the degree DOCTOR OF PHILOSOPHY IN CLINICAL AND BIOANALYTICAL CHEMISTRY
at theCLEVELAND STATE UNIVERSITY
May 2018

We hereby approve this dissertation forAjaykumar H. Zalavadia,
Candidate for the Doctor of Philosophy in Clinical-Bioanalytical Chemistry degree for the Department of Chemistry and Cleveland State University's
College of Graduate Studies
______________________________________ Date: ______________Dr. John F. Turner II, Department of Chemistry
( Dissertation Committee Chairperson )
______________________________________ Date: ______________Dr. David W. Ball, Department of Chemistry
( Dissertation Committee Member )
______________________________________ Date: ______________Dr. Mekki Bayachou, Department of Chemistry
( Dissertation Committee Member )
______________________________________ Date: ______________Dr. Baochuan Guo, Department of Chemistry
( Dissertation Committee Member )
______________________________________ Date: ______________Dr. Petru S. Fodor, Department of Physics
( Dissertation Committee Member )
Date of Defense: March 8th, 2018

Dedicated to Bansari...

ACKNOWLEDGEMENT
I am eternally grateful to my advisor Dr. John F. Turner, II for his invaluable guidance
since 2010, neither a thank you, nor this acknowledgement is enough to gratify your contribution
in making the person I am today. I will try my very best to not let you down ever.
I would like to thank Dr. Petru S. Fodor, for giving me the opportunity to serve as a
graduate assistant for the scanning electron microscopy facility, through which I also have
received financial support during my dissertation research work.
I would like to express my gratitude to my committee members Dr. David Ball, Dr.
Mekki Bayachou, Dr. Baochuan Guo, and Dr. Taysir Nayfeh for their suggestions about my
research during my candidacy and annual reports. I would also like to thank the Department of
Chemistry for providing me the opportunity to be a teaching assistant to advance my teaching
skills, the College of Sciences for awarding me the Doctoral Dissertation Research Award for
2014 and the Cleveland State University's college of graduate studies for giving me the
opportunity to advance my career and pursue a doctorate degree.
Dear Mom, Dad and Bansari, I will be forever in debt for your unconditional love during
the good and the bad times of my life and never giving up on me, without your emotional and
financial support I would not have been able to pursue my dreams.
I am thankful to my friends and colleagues for all the productive, and non-productive but
fun; time spent together on campus or off campus. You know who you are without being named
individually.

A BROADLY TUNABLE SURFACE PLASMON-COUPLED
WAVELENGTH FILTER FOR VISIBLE AND NEAR
INFRARED HYPERSPECTRAL IMAGING
AJAYKUMAR ZALAVADIA
ABSTRACT
Hyperspectral imaging is a set of techniques that has contributed to the study of
advanced materials, pharmaceuticals, semiconductors, ceramics, polymers, biological
specimens, and geological samples. Its use for remote sensing has advanced our
understanding of agriculture, forestry, the Earth, environmental science, and the universe.
The development of ultra-compact handheld hyperspectral imagers has been impeded by
the scarcity of small widefield tunable wavelength filters. The widefield modality is
preferred for handheld imaging applications in which image registration can be
performed to counter scene shift caused by irregular user motions that would thwart
scanning approaches. In the work presented here an electronically tunable widefield
wavelength filter has been developed for hyperspectral imaging applications in the visible
and near-infrared region. Conventional electronically tunable widefield imaging filter
technologies include liquid crystal-based filters, acousto-optic tunable filters, and
v

electronically tuned etalons; each having its own set of advantages and disadvantages.
The construction of tunable filters is often complex and requires elaborate optical
assemblies and electronic control circuits. I introduce in the work presented here is a
novel widefield tunable filter, the surface plasmon coupled tunable filter (SPCTF), for
visible and near infrared imaging. The SPCTF is based on surface plasmon coupling and
has simple optical design that can be miniaturized without sacrificing performance. The
SPCTF provides diffraction limited spatial resolution with a moderately narrow nominal
passband (<10 nm) and a large spurious free spectral range (450 nm-1000 nm).
The SPCTF employs surface plasmon coupling of the π-polarized component of
incident light in metal films separated by a tunable dielectric layer. Acting on the π-
polarized component, the device is limited to transmitting 50 percent of unpolarized
incident light. This is higher than the throughput of comparable Lyot-based liquid crystal
tunable filters that employ a series of linear polarizers. In addition, the SPCTF is not
susceptible to the unwanted harmonic bands that lead to spurious diffraction in Bragg-
based devices. Hence its spurious free spectral range covers a broad region from the blue
through near infrared wavelengths. The compact design and rugged optical assembly
make it suitable for hand-held hyperspectral imagers. The underlying theory and SPCTF
design are presented along with a comparison of its performance to calculated estimates
of transmittance, spectral resolution, and spectral range. In addition, widefield
hyperspectral imaging using the SPCTF is demonstrated on model sample.
vi

TABLE OF CONTENTS
ABSTRACT........................................................................................................................ v
TABLE OF CONTENTS.................................................................................................. vii
LIST OF FIGURES ............................................................................................................ x
1. INTRODUCTION ........................................................................................................ 1
1.1 Hyperspectral Imaging......................................................................................... 4
1.1.1 Hyperspectral Imaging for Remote Sensing ............................................... 5
1.1.2 Hyperspectral Imaging for Microscopy and Macroscopy .......................... 8
1.1.3 Hyperspectral Imaging in the Biomedical Field ....................................... 12
1.2 Principle of Hyperspectral Imaging ................................................................... 14
1.3 Wavelength Selection ........................................................................................ 17
1.4 Widefield Tunable Wavelength Filters .............................................................. 19
1.5 Summary of the Work Presented ....................................................................... 22
2. THEORY OF THE SURFACE PLASMONS ............................................................ 26
2.1 Optical Excitation of Surface Plasmon Polaritons............................................. 28
2.2 Dispersion Relation of Surface Plasmon Polaritons .......................................... 32
2.3 Permittivity of Thin Metal Films ....................................................................... 34
2.4 Theoretical Calculation of Reflectance Loss by Photon-Polariton
Coupling............................................................................................................. 37
vii

3. DETERMINATION OF REFLECTANCE AS A FUNCTION OF INCIDENT
ANGLE AND WAVELENGTH ................................................................................ 42
3.1 Experimental and Methodology......................................................................... 43
3.1.1 Sputter Deposition of Ag on BK-7 Glass Prisms...................................... 43
3.1.2 Apparatus for the Reflectance Measurements as a Function of
Incident Angle and Wavelength................................................................ 45
3.2 Result and Discussion ...................................................................................... 48
3.2.1 Calculated Reflectance from the Glass-Metal Interface in the
Kretschmann-Raether Configuration ........................................................ 48
3.2.2 Measured Reflectance from the Glass-Metal Interface in the
Kretschmann-Raether Configuration ........................................................ 52
4. SURFACE PLASMON COUPLED TUNABLE FILTER......................................... 57
4.1 Experimental and Methodology......................................................................... 58
4.1.1 Design of the Surface Plasmon Coupled Tunable Filter........................... 58
4.1.2 Construction and Characterization of the SPCTF..................................... 61
4.1.3 SPCTF Hyperspectral Imaging Microscope ............................................. 63
4.1.3.1 Determination of Image Resolution................................................... 65
4.1.3.2 SPCTF Hyperspectral Imaging .......................................................... 65
4.1.4 Measuring SRSPPs and LRSPPs .............................................................. 65
4.2 Results and Discussion ...................................................................................... 66
4.2.1 SPCTF Transmittance and Bandpass........................................................ 66
4.2.2 SPCTF Microscope Image Resolution...................................................... 68
viii

4.2.3 SPCTF Hyperspectral Imaging of Pine Stem ..........................................71
4.2.4 Short-range and Long-range Surface Plasmon Polaritons in a
Coupled System .......................................................................................73
4.2.5 Selecting LRSPPs Coupling Mode with Monochromatic Light..............78
5. EFFECT OF DISPERSION ON SURFACE PLASMON COUPLING AND
SPCTF BANDPASS..................................................................................................82
5.1 Experimental and Methodology........................................................................83
5.1.1 Apparatus for the Measurement of the Reflectance of Angularly
Dispersed Light as a Function of Incident Angle and of Wavelength .....83
5.1.2 Characterization of the SPCTF Coupled to a Dispersive Element...........86
5.2 Result and Discussion ........................................................................................ 88
5.2.1 Reflectance of Dispersed Light from the Glass-Metal Interface .............. 88
5.2.2 SPCTF Acceptance Angle and Bandpass with Angularly Dispersed
Light.......................................................................................................... 96
6. CONCLUSION AND RECOMMENDATIONS FOR FUTURE WORK ................ 100
6.1 Conclusion ....................................................................................................... 100
6.2 Recommendations for the Future Work........................................................... 102
REFERENCES ............................................................................................................... 105
APPENDIX A................................................................................................................. 129
APPENDIX B ................................................................................................................. 136
ix

LIST OF FIGURES
Title Page
Figure 1. Illustration of Hyperspectral Data 15
Figure 2. Schematics of the Acousto-Optic Tunable Filter (AOTF) and the Liquid
Crystal Tunable Filter (LCTF)
21
Figure 3. Surface Plasmon Polaritons (SPPs) 27
Figure 4. Optical Excitation of SPPs 31
Figure 5. Dispersion Relation 33
Figure 6. Complex Permittivity (εr) of Ag and Au 35
Figure 7. Variable Assignments of the Kretschmann-Raether Configuration for
Use in the Fresnel Calculation of Reflectance
38
Figure 8. Plot of Calculated Reflectance as a Function of Incident Angle 41
Figure 9. Scanning Electron Micrograph of Ag Film 44
Figure 10. Schematic Diagram of the Optical Setup for Reflectance Measurements 46
Figure 11. Theoretical Reflectance from the Glass-Metal Interface of a Prism
Coated with Ag in the Kretschmann-Raether Configuration
49
Figure 12. Incident Angle and Wavelength Dependence of Surface Plasmon
Coupling
51
Figure 13. Preprocessing of the Reflected Intensity Measured from the Glass-Metal
Interface of a Silver-Coated Prism
53
x

Figure 14. The Measured Reflected Intensity from the Glass-Metal Interface of a
Silver-Coated Prism as Function of Wavelength and Incident Angle
55
Figure 15. The Surface Plasmon Coupled Tunable Filter (SPCTF) 59
Figure 16. Apparatus for Measuring SPCTF Transmittance 62
Figure 17. SPCTF Hyperspectral Imaging Microscopy 64
Figure 18. Wavelength Tuning of the SPCTF 67
Figure 19. Image of the 1951 USAF Resolution Target Acquired Using SPCTF
Imaging Microscope
70
Figure 20. SPCTF Spectral Imaging 72
Figure 21. Illustration of Poynting Vector Profile for Surface Plasmon Coupled
(Metal-Dielectric-Metal) System
75
Figure 22. Illustration of the Normalized Ex Component of the Electric Field as the
Time Average Envelop Along the Airgap
76
Figure 23. The Dependence of SRSPPs and LRSPPs on Airgap Distance in the
SPCTF
79
Figure 24. Converging of the SRSPPs and LRSPPs with Increasing Airgap for 650
nm Light
81
Figure 25. Schematic Diagram of the Optical Setup for Reflectance Measurements
Using Angularly Dispersed Light
84
Figure 26. Apparatus for Measuring the Bandpass and Angle of Acceptance of the
SPCTF Coupled to a Dispersive Element
87
Figure 27. Preprocessing Reflected Intensity Acquired as a Function of Collection
Angle for Angularly Dispersed Light
89
xi

Figure 28. Data with Peak Centers Marked for Extraction of the Envelop Function 90
of the Angularly Dispersed Reflected Light
Figure 29. Extracted Envelop Functions from the Data 91
Figure 30. Reflectance Data as a Function of Wavelength and Incident Angle for 93
Angularly Dispersed Illumination
Figure 31. Narrow Band Coupling of SPPs with Angularly Dispersed Illumination 95
Figure 32. The Bandpass of the SPCTF Coupled to a Dispersive Element 97
Figure 33. The Acceptance Angle of the SPCTF 98
Figure 34. An Electro Optically Tuned SPCTF 103
Figure 35. A Conceptual Design of a Monolithic Element 104
xii

CHAPTER 1
INTRODUCTION
Hyperspectral imaging (HSI), known also as chemical or spectroscopic imaging,
has emerged as a technique that integrates conventional imaging and spectroscopy to
attain both spatial and spectral information from the sample. By integrating wavelength
selection devices with imaging optics and sensitive detectors, HSI enables spectral
information from each assigned pixel location on a sample or target location to be
recorded. Hyperspectral data is rich with information content and has outstanding feature
identification potential, which makes it highly suitable for numerous applications.
Hyperspectral imagers have been developed for every optical region of the
electromagnetic spectrum to measure variations in the absorption, emission,
transmittance, reflectance, fluorescence and scattering of light by complex samples. To
1

accommodate this broad range of modalities, HSI instruments are custom-designed for
specific applications.
HSI can be performed in a few different modalities; point mapping, line scanning,
widefield spectral imaging, and spatial or wavelength multiplexing are common
approaches. Regardless of its implementation, HSI produces a set of spectra in which
each spectrum corresponds to an assigned location on or in the sample, such as the set of
pixel locations corresponding the field of view within some image plane. A necessary
capability of HSI instruments is wavelength tuning. For widefield HSI, electro-optic
devices like the acousto-optic tunable filter (AOTF), liquid crystal tunable filter (LCTF)
and Fabry-Perot tunable filter (FPTF) are frequently used to provide wavelength
selection.1-7 Besides the use of traditional optical filters, a few specialized solutions like
the resonance ionization imaging detector (RIID), hybrid holographic-liquid crystal
filters, and photonic crystals have been developed for the same purpose.8-12
The work presented here introduces a novel widefield tunable filter for visible and
near infrared region based on surface plasmon coupling. The surface plasmon coupled
tunable filter (SPCTF) is designed to leverage advances in consumer-based technologies
so that HSI can be miniaturized and incorporated into compact devices for handheld and
airborne applications. As part of this work the design and construction of the SPCTF is
presented along with a theoretical description of surface plasmon generation in thin metal
films. Experimental reflectance data as a function of wavelength and incident angle with
respect to the metal film, deposited on a glass prism in the Kretschmann-Raether
configuration, is presented along with theoretical estimates for comparison. Wavelength
tuning using a coupled surface plasmon interaction in a symmetric cavity created by
2

closely juxtaposing two prisms with their coated hypotenuses facing each other across as
airgap has been demonstrated. Using this configuration as the basis of the SPCTF design,
HSI using the SPCTF has been demonstrated for the first time and the transmittance and
bandpass values as a function of wavelength are provided. By exploiting the sensitivity of
surface plasmon generation to the angle of incident light, a narrow passband SPCTF is
presented. The bandpass and acceptance angle of the narrow passband device are given
along with a brief discussion of the relationship between short-range and long-range
surface plasmons in the SPCTF.
Significance: Hyperspectral imaging has emerged as a powerful tool for
noninvasive and nondestructive characterization of complex samples. The integration of
HSI with optical microscopy is often performed in the laboratory setting to map
compositional changes in heterogeneous samples. Of the many spectroscopic methods
that can be integrated with HSI, the most chemically specific ones are Raman scattering
and infrared (IR) absorption or reflectance. Collectively referred to as vibrational
spectroscopies, Raman and IR spectra reveal detailed information regarding the
vibrational/rotational band structure of molecules. In recent years, advances in
instrumentation have led to small, battery powered, handheld Raman spectrometers.
Unlike the IR modality, little or no sample preparation is needed for Raman analysis.
Hence these portable systems enable point-and-shoot sample identification in the field.
The development of portable widefield Raman imagers has been more challenging and
practical devices are not yet available. The main impediment to the introduction of
compact Raman imagers is the development of efficient narrowband tunable filters. The
3

development of the SPCTF described here is a first step towards the creation of compact
Raman imaging system based on surface plasmon coupling.
1.1 Hyperspectral Imaging
Hyperspectral imaging has originated from remote sensing and has been explored
for various applications.13 The HSI approach simultaneously delivers chemical and
spatial information from the sample by generating a spatial map of spectral variations by
combining imaging with spectroscopy, HSI not only allows important extrinsic
characteristics of the sample (i.e. size, geometry, appearance, color, etc.) to be revealed
through image feature extraction, it also enables the identification of chemical
constituents of the sample through spectral analysis.6, 14 The HSI offers many advantages
over conventional analytical methods. It is a noninvasive, noncontact and non-destructive
method for which no sample preparation is inherently required. It is therefore more
economic than traditional methods, due to the savings in labor, time, supplies and reagent
cost associated with intensive sample preparation. By acquiring spectral and spatial
information simultaneously, HSI enables a more complete description of constituent
concentration and distribution throughout heterogeneous samples than single channel
techniques.
The ability to identify the spatial distributions of chemical and physical
components in a sample makes HSI useful for biomedical15-19, pharmaceutical20-22,
agriculture23-26, remote sensing13, 27-30, archeology31-38, forensic39-44, food quality21, 26, 45-56,
astronomy57-66, defense67-77 and other industrial applications, many of which have yet to
be discovered.
4

1.1.1 Hyperspectral Imaging for Remote Sensing
Spectral imaging was originally substantiated within the remote sensing fields,
such as airborne surveillance and satellite imaging. It has been successfully applied to
application in mining and geology, agriculture, forestry, defense, environmental, and
climate change research. For example, the airborne visible infrared imaging spectrometer
(AVIRIS) is a premier instrument in the earth remote sensing and delivers 224
contiguous spectral bands in the wavelength range between 400 nm and 2500 nm.78, 79
The AVIRIS has enabled study of water vapor maps to be generated above lakes over
large time periods80, wild fire damage assessment81, 82, mineral mapping83-85, the mapping
of oil spills and residua spread on sea surfaces86-88, and the environmental impact of
active and abandoned mine lands84 have all benefitted from AVIRIS remote sensing.
Forestry: The HSI has enabled the identification of tree species89, the assessment
of canopy health90, 91, the determination of water content as well as relative abundances of
photosynthetic and non-photosynthetic vegetation for the forestry research.92, 93
Chemometric techniques were used on hyperspectral data acquired by AVIRIS over the
Harvard Forest to identify plant species based on nitrogen and lignin content in the
foliage.94, 95
Vegetation and Soil Resource Control: Airborne HSI has been employed in
various agricultural application. With the use of HSI, crop variables such as wet
biomass96, leaf area index97, plant height98, grain yield99, and chlorophyll content of
plants can be quantified.100 Mineralogical composition of soil, crop moisture assessment,
crop yield modeling, carbon flux assessment from vegetation, and discrimination of crop
residues from soils can also be estimated using HSI.101, 102
5

Environmental Analysis: Environmental studies have also benefited from the
use of HSI. For example, the identification of waste piles with the potential to leach
heavy metals into water streams and ground water was determined by AVIRIS data at
Leadville, CO. Ultimately, millions of dollars were saved in cleanup costs.84 Data from
another HSI platform, advanced spaceborne thermal emission and reflection radiometer
(ASTER) was used to create detailed maps of land surface temperature, reflectance and
elevation. Hyperspectral data from airborne (i.e. AVIRIS) and spaceborne (i.e. ASTER)
imagers helps environmental scientists achieve a more complete understanding of the
Earth's response to change, and to better predict variability and trends in climate,
weather, and natural hazards.
Climate: For over 30 years, NASA has flown instruments in space to aid our
understanding of climate. Satellites equipped with hyperspectral imagers provide
information about weather, carbon emission, air quality and many other factors that help
us understand the Earth's climate. The Geostationary Carbon Observatory (GeoCarb)
built by NASA's Jet Propulsion Laboratory (JPL) set to launch in 2020 will collect
concentration of carbon dioxide, methane, carbon monoxide and solar-induced
fluorescence.
Astronomy: The gorgeous images of stars and galaxies that are often published
by NASA are almost never simple three channel (red, green, and blue) images but are the
result of a spectral image data that has undergone extensive processing before being
recast in pseudo-color. Spaceborne telescopes equipped with the ability to capture
spectral images helps us understand the chemistry of distant stars and galaxies. The
Chandra, NASA's flagship mission for X-ray astronomy, observes X-rays from clouds of
6

gases in space. For the spectral images captured by the Hubble, spectral shapes are used
to previously reveal hidden astronomical objects. Peaks and dips at specific wavelengths
in a spectrum indicate the presence of elements like carbon, oxygen, hydrogen, and iron
among others.
Defense: Geospatial intelligence (GEOINT) provides information about human
activity by collecting data from various sources. Landsat, remote sensing and radar data
are often employed by GEOINT to provide terrain information to military troops
stationed overseas. Landsat provides the longest temporal record of multispectral data of
the Earth's surface on a global basis. Geospatial intelligence data is used for targeting,
guiding missiles, damage assessment, navigating in foreign terrain, and espionage.
Surveillance: Airborne surveillance is routinely used in applications related to
border protection, homeland security, command and control or even maritime
surveillance. High resolution infrared imaging used in airborne surveillance activities
provide valuable information regarding target shapes, temperatures and chemical nature.
The spectral information provided by the infrared HSI adds selectivity and efficiency to
the task of detecting and identifying ground targets based on their unique spectral
signature.103 Hyperspectral video cameras developed by Rebellion Photonics have also
been employed for the real-time surveillance of oilfields, refineries, drilling sites and
tanker filling sites to detect methane leaks as a means to lower methane emissions,
prevent loss and prevent accidental casualties.104
7

1.1.2 Hyperspectral Imaging for Microscopy and Macroscopy
Traditional RGB cameras like the ones used for photography and video
surveillance, bin the wavelength information into 3 broad spectral bands corresponding to
red, green and blue. Combining HSI with optical microscopy enables the determination
of the spatial and spectral characteristics of a specimen for each pixel in an image. As a
result, HSI has become an attractive and powerful method for detailed nondestructive
investigation of chemical distribution, in complex small heterogeneous samples. Various
application areas include, but are not limited to, semiconductors, polymers, minerals, art
conservation and archeology, forensics, pharmaceuticals and the study of cell and tissues.
Semiconductors: Spectral maps of absorption sites in integrated circuits (ICs)
with near infrared light reveal structures that have a different optical absorption than
neighboring sites. A nonuniform absorption in a semiconductor structure located near an
electrical overstress defect can be an important feature in failure analysis of ICs.105
Although non-optical, another important spectral imaging modality is X-rays mapping.
X-ray imaging capability is often integrated into scanning electron microscopes for
characterizing the elemental make-ups of samples like semiconductors and ICs.106-108
Specific X-ray wavelengths or energies are selected and measured, either by wavelength
dispersive X-ray spectroscopy (WDS) or energy dispersive X-ray spectroscopy (EDS).
EDS generates a spatially resolved distribution of electron energy emission data, where
each element on the periodic table has characteristic x-ray emission spectrum.
Polymers: Light-emitting diodes (LEDs) based on conjugated polymers have
potential use in applications such as flexible displays. Spectral imaging has been used for
electroluminescence (EL) characterization of a polymer blend-based LEDs to elucidate
8

the relationship between the morphologies of the blend polymers and EL emission
properties on a microscopic scale.109 Bio-degradable implant material poly-L-lactic acid
(PLLA), have also been studied with HSI. For example, Raman HSI is used by other
researchers in my lab to identify crystalline and amorphous domains in the polymer
scaffolds which affect their biodegradation properties.110
Minerals: Lithologic and mineralogic logging of drill cores are used by the
mining industries to help manage mining operations. Drill cores are often the first
evidence of deep mineral deposits. Most of the time mineral identification methods are
subjective and depend on the skills and experience of geologists and mineralogists which
vary from person to person. To standardize and objectify these observations, HSI can be a
very useful tool for mineral identification and mineral mapping process at mining sites.111
Many minerals display unique spectral features in the infrared and Raman modalities.
Archeology and Art Conservation: Multispectral imaging and HSI are in
increasing demand in the field of art conservation, art history and archaeology. Spectral
imaging has mostly been applied to paintings and manuscripts. Applications of HSI in art
conservation include the detection of damage and past interventions, In addition, HSI is
useful for monitoring the degradation of varnish on paintings, recovering erased or
overwritten scripts in old manuscripts, as well as for identifying pigments.35
Forensic and Crime Scene Investigations: The HSI enables investigators to
analyze the chemical composition of small samples and trace constituents, and to
simultaneously visualize their spatial distribution. In addition, HSI offers significant
potential for the detection, visualization, identification and age estimation of forensic
9

traces.43, 44 The rapid, non-destructive and non-contact features of HSI enhance its
suitability as an analytical tool for forensic science.
Food Quality and Safety Control: The HSI has been employed to provide a
user-friendly analytical tool for various applications in food quality and safety. For
example, it is used to monitor quality and shelf life of grains and nuts112, to estimate the
sweetness and amino acid content of fresh soybeans113, to evaluate the quality of
mushroom by estimating the hunter L value114 (commonly applied feature for mushroom
quality grading), to detect the size, color and presence of defects in citrus fruits, and to
correctly classify lemons and mandarins.115, 116 A suite of HSI methods is also used to
assess the quality and safety of meat, meat products and fish.117-122
Pharmaceuticals: In the drug industry, HSI enables mapping the distribution of
an active pharmaceutical ingredient (API) in an excipient, where not only the potency of
the API is of importance but also its content uniformity. Other parameters are also
monitored. For example, the particle sizes, their distribution, and sometimes the layer
thicknesses of the coating or other structural details may also be measured. Infrared
hyperspectral imaging can be used to identify the contaminants on the surface of a tablet
and can also provide information regarding dissolution problems.123 More recent efforts
have sought to replace IR methods at the bench with Raman scattering techniques which
simplifies sample preparation. In fact, Raman can be used to monitor pharmaceutical
tablets that are still wrapped in bubble packaging.124, 125
The process analytical technology (PAT) initiative emphasizes quality by design
rather than testing the final product, which results in cost savings, uniform quality, and
higher throughput manufacturing in pharmaceuticals.20 The rapid analysis afforded by
10

HSI, and its non-destructive and non-invasive nature makes it an attractive process
analytical tool for the pharmaceutical industry, for both process monitoring and quality
control in the many stages of drug production.
Hyperspectral Machine Vision: Hyperspectral machine vision systems enable
automated sorting by detecting very small differences in similarly colored materials that
cannot be distinguished with conventional imaging technologies. Machine vision systems
are widely used throughout all sectors of the manufacturing industry. Other types of
applications are also benefiting from the enhanced discernment capabilities of real-time
HSI. For example, the use of near-infrared HSI has been explored as a way to augment
the decision-making process during surgeries for cancer removal. A suit of techniques are
also being explored for use in unassisted robotic surgeries.126-131
11

1.1.3 Hyperspectral Imaging in the Biomedical Field
The HSI offers great potential for medical applications as a noninvasive
diagnostic tool and for surgical guidance. The HSI is able to deliver nearly real-time
images of biomarker information. The reflected, fluorescent, scattered and transmitted
light from tissue captured by HSI carries quantitative diagnostic information about tissue
pathology.132 Retinal imaging spectroscopy can provide functional maps using
chromophore spectra. Oxygen saturation maps show ischemic areas from diabetes and
venous occlusions.133 Oxygen saturation of hemoglobin also reveals two hallmarks of
cancer, angiogenesis and hypermetabolism, which are used to distinguish between
healthy and malignant tissue in cancer diagnoses.134 The HSI has been applied to the
diagnosis of hemorrhagic shock135, the assessment of peripheral artery disease136, early
detection of dental caries137, fast characterization of kidney stone types138, detection of
laryngeal disorders139, and so on.
Surgical Guidance: During a surgery, HSI can help surgeon to visualize the
tissue types, organs, and blood vessels, which are sometime easily obscured with the
presence of blood. HSI offers the potential to aid and extend the surgeon's vision at the
tissue, cellular and even molecular level, so that better judgements can be made. The HSI
has already been explored in surgeries, such as intestinal surgery140, abdominal
surgery141, and renal surgery.142, 143
Fluorescence: Significant advances in instrumentation and detector design, as
well as growing number of new fluorophores has led to a dramatic increase in multi-color
fluorescence microscopy which is a type of hyperspectral imaging. Recent advances in
fluorophores include synthetic quantum dots and genetically encoded fluorescent proteins
12

that span the entire visible spectral region.144 Hyperspectral imaging combined with
linear unmixing is a highly useful technique that can be used to untangle overlapping
florescence bands originating in cells and tissues labeled with multiple synthetic
fluorophores. In addition, HSI is a very powerful tool to reduce or eliminate signal bleed
and artifact in fluorescence microscopy when imaging multiply labeled specimens. By
imaging many wavelengths within a fluorescence band, rather than just one wavelength
near the band center, a higher signal-to-noise ratio is achieved for each fluorophore in the
specimen. Wavelength bands that are representative of the spectral differences between
the fluorophores are sometime useful for more rapidly identifying the target constituent in
a specimen.
Raman: Raman microscopy has been gaining recognition in the biomedical field
due to its ability to nondestructively measure the distribution of biochemical components
within complex biological samples. Raman spectroscopy in combination with optical
microscopy provides a label-free method to assess and image cellular processes, without
the use of extrinsic fluorescent dyes. The sub-micrometer resolution of confocal Raman
enables cellular organelles to be imaged at spatial resolution similar to conventional
microscopy. Raman spectral imaging has also been employed to study intracellular
delivery and degradation of polymeric nanoparticulate drug carrier systems.145 The
combined use of Raman and infrared imaging is being investigated as a complimentary
diagnostic method to conventional histopathology with the hope it will provide molecular
level understanding of cancers.146
13

1.2 Principle of Hyperspectral Imaging
Hyperspectral imaging is a technique that generates a spatial map of spectral
variation. The essential hardware, acquisition control software, and data processing
strategies can differ markedly among HSI instruments. Likewise, the type of information
desired from the sample governs which type of spectroscopy is utilized. Regardless of its
implementation, HSI produces a set of spectra in which each spectrum corresponds to an
assigned location on or in the sample as illustrated in Figure 1.
To visualize changes in the sample across its spatial extents, data processing is
performed on the hyperspectral data so that a pseudo-color image map or volume view of
the sample can be rendered. Color differences in the rendered result correspond to
meaningful variations in the spectral characteristics of the sample. Depending on the type
of data processing performed, the numerical scores upon which this color contrast is
based can be used to extract either qualitative or quantitative information, or both.
Acquisition of hyperspectral data can be achieved using various methods like
point mapping, line scanning, widefield (global) HSI, spatial multiplexing and spectral
multiplexing. Also, there has been significant interest in developing a non-scanning
approach such as snapshot hyperspectral imaging in which a full three-dimensional
hyperspectral data cube is recorded for each frame.133, 147, 148
14

Figure 1: Illustration of Hyperspectral Data. On the right is a three-dimensional
presentation of hyperspectral data cube where x and y are spatial dimensions of the
sample (image plane) and the third dimension is the spectral dimension. Each pixel in
the image plane can be plotted as a spectrum corresponding to that location on the
sample (illustrated on the left).
15

In widefield hyperspectral imaging a whole frame containing the portion of the
sample within the field of view is captured at a series of wavelengths. Wavelength
selection is generally achieved by electro-optic tunable filters. Spatial scanning methods
such as point mapping and line scanning has their own set of advantages and use
scenarios. Point mapping is ideal for small samples in a benchtop setup where spectrum
at each location on the sample is recorded. The sample stage or the acquisition assembly
is moved in a raster pattern using a translation mechanism. Geospatial hyperspectral data
is collected using line scanning where light in one dimension of the sample is dispersed
via grating onto an imaging chip and the acquisition assembly is scanned across the other
dimension of the sample via the motion of airborne spectral imagers.
Multiplexing can be performed via spatial multiplexing or spectral multiplexing.
In the spatial multiplexing method whole field of view is illuminated, and a series of
binary spatial mask are applied to the light coming from the sample. Spatial masking can
be accomplished using a device like digital micromirror device (DMD), which consists of
a two-dimensional array of many microscopic mirrors, these mirrors can be controlled
individually to on or off position. Spectrum is collected for each mask and the resulting
data is deconvoluted using Hadamard transform to reconstruct spectral and spatial
information. Spatial multiplexing offers better signal to noise ratio in low signal-to-noise
ratio applications.110, 149
16
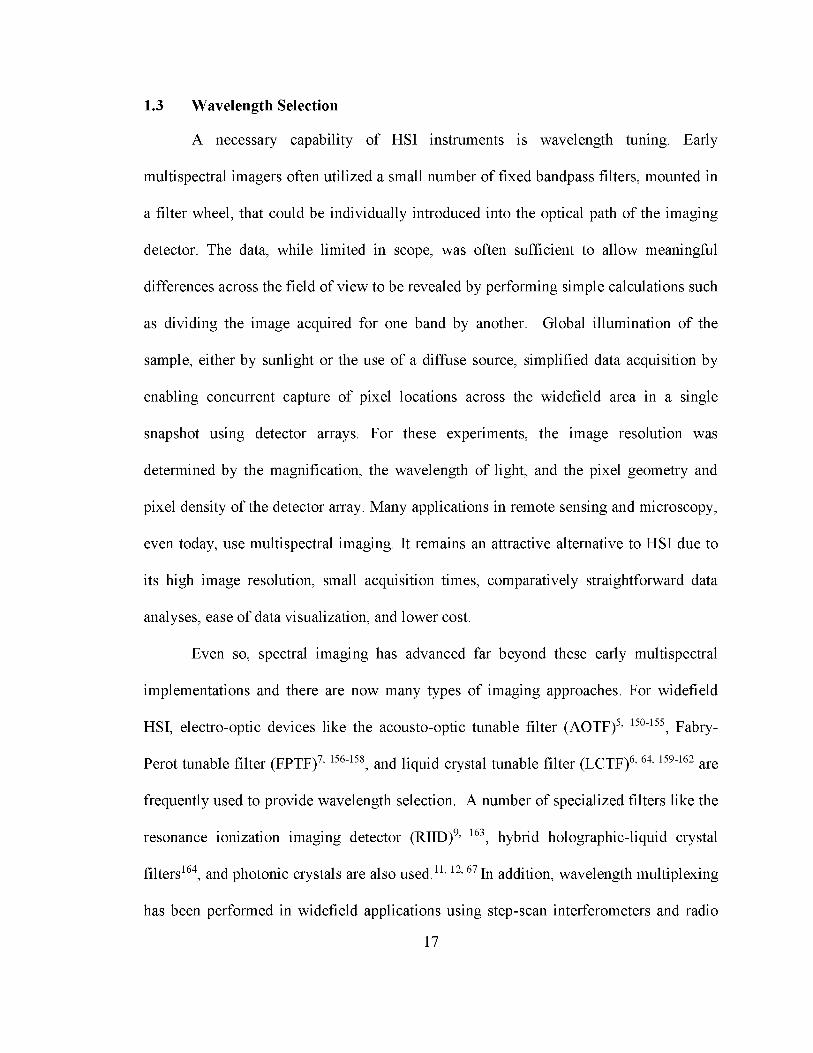
1.3 Wavelength Selection
A necessary capability of HSI instruments is wavelength tuning. Early
multispectral imagers often utilized a small number of fixed bandpass filters, mounted in
a filter wheel, that could be individually introduced into the optical path of the imaging
detector. The data, while limited in scope, was often sufficient to allow meaningful
differences across the field of view to be revealed by performing simple calculations such
as dividing the image acquired for one band by another. Global illumination of the
sample, either by sunlight or the use of a diffuse source, simplified data acquisition by
enabling concurrent capture of pixel locations across the widefield area in a single
snapshot using detector arrays. For these experiments, the image resolution was
determined by the magnification, the wavelength of light, and the pixel geometry and
pixel density of the detector array. Many applications in remote sensing and microscopy,
even today, use multispectral imaging. It remains an attractive alternative to HSI due to
its high image resolution, small acquisition times, comparatively straightforward data
analyses, ease of data visualization, and lower cost.
Even so, spectral imaging has advanced far beyond these early multispectral
implementations and there are now many types of imaging approaches. For widefield
HSI, electro-optic devices like the acousto-optic tunable filter (AOTF)5, 150-155, Fabry-
Perot tunable filter (FPTF)7, 156-158, and liquid crystal tunable filter (LCTF)6, 64, 159-162 are
frequently used to provide wavelength selection. A number of specialized filters like the
resonance ionization imaging detector (RIID)9, 163, hybrid holographic-liquid crystal
filters164, and photonic crystals are also used.11, 12, 67 In addition, wavelength multiplexing
has been performed in widefield applications using step-scan interferometers and radio
17

frequency (RF) multiplexed AOTFs.152, 165 Comparatively simple instruments that utilize
a series of angle tuned fixed filters are also available.166 Each of these approaches has
been utilized for the widefield modality because they provide sufficiently high spatial
resolution, are electronically tunable, and can be implemented in a way that imparts
suitably small spatial aberrations.
Apart from the widefield modality, point-mapping and line scanning approaches
that use optic fiber-coupled spectrographs equipped with sensitive multichannel detectors
are also common.167-170 An adaptation of line scanning, sometimes called pushbroom
imaging, is useful in remote sensing applications in which the detector is moving relative
to the target area. In scanning approaches, each frame of the array detector captures the
wavelength-dispersed spectral information and the spatial map is built-up over time. To
improve the signal-to-noise ratio in low-light applications, spatial multiplexing can be
performed by introducing imaging optics and a spatial light modulator (SLM), such as a
digital micromirror device (DMD), between the sample and the collection fiber. For
binary encoding sequences in which each pixel either contributes fully or not at all to a
measurement, Hadamard-based transformations are commonly used to recover the
spectrum at each pixel in the image.149, 171 The benefits of scanning and spatial
multiplexing approaches include high spectral resolution and large spectral range.
18

1.4 Widefield Tunable Wavelength Filters
Among the traditionally used wavelength filtering devices the AOTF, LCTF,
FPTF and angle tuned dielectric filters are commonly employed in various commercially
available widefield hyperspectral imagers.
AOTFs are solid-state birefringent crystals that provide an electronically tunable
passband in response to an applied acoustic field. A generalized schematic of the AOTF
is shown in Figure 2A, a piezo-electric transducer is bonded to one face of a tellurium
dioxide (TeO2) crystal. Here, a change in birefringence as a function of incident angle is
used to compensate for the momentum mismatch that occurs between the incident light
and the applied acoustic wave across a large input angle. The AOTF requires a variable
radio frequency (RF) driver, making the system bulky overall and hard to miniaturize.
Because the angle of diffracted light in the AOTF changes according to the scanning
wavelength, an image shift can result as a function of tuning wavelength. Image blur is
also a challenging problem in AOTFs and occurs as a tradeoff between scene shift and
image clarity. Improving one worsens the other.
LCTFs are tunable birefringent (Lyot) filters constructed from liquid crystal
variable phase plates sandwiched between linear polarizers. There are main two ways to
make a birefringent filter tunable. The first is to vary the physical thickness of the
birefringent material in the optical path. This effectively changes the retardation of one
polarized component relative to the other and can be accomplished using liquid crystal
waveplates. The second approach makes use of a quarter-wave plate followed by a
rotating half-wave plate in front of the exit polarizer. A device with an electronically
tunable variable retarder (liquid crystal variable phase retarder) can be used as an
19

alternative to the rotating half-wave plate (Figure 2B). Nominal bandpasses of <2 nm can
be achieved with LCTF but the overall peak transmission, out-of-band rejection and
temperature stability of the filter are often poor.
The free spectral range of the angle tuned Fabry-Perot (FP) filter is limited by the
occurrence of harmonic and overtone bands, the tuning of the passband is achieved by
tilting the thin-film interference filter. Spectral transmission of most thin-film filters
shifts toward shorter wavelengths when the angle of incidence increases from normal
incidence to higher angles. However, the filtered spectrum becomes highly distorted at
higher angles, and the shift can be significantly different for σ- polarized and π-polarized
light, leading to a significant loss in performance and strong polarization dependence
with limited free spectral range.
20

Figure 2. Schematics of the Acousto-Optic Tunable Filter (AOTF) and the Liquid
Crystal Tunable Filter (LCTF): A) The AOTF is made up of an anisotropic material
(TeO2), which is bonded to a piezoelectric acoustic transducer driven by a radio
frequency waveform synthesizer and an amplifier. B) The LCTF consists of a series of
cascaded Lyot filters, each consisting of a birefringent element and liquid crystal
waveplate sandwiched between polarizers. The number of Lyot stages depends on the
desired bandpass and narrow passbands require more Lyot stages.
21

1.5 Summary of the Work Presented
The work presented here introduces a novel widefield tunable filter for visible and
near infrared HSI based on surface plasmon coupling. The surface plasmon coupled
tunable filter (SPCTF) is designed to leverage advances in consumer-based technologies
so that HSI can be incorporated into compact handheld devices. As already discussed,
there are many types of HSI implementations. The complexities associated with these
approaches have slowed the use of HSI beyond basic materials research, bioresearch,
remote sensing, industrial applications, and military applications. Until recently, the high
cost of sensitive array detectors, light sources (lasers), high performance imaging optics,
and the need for specialized computer hardware for acquisition and data processing
impeded the spread of HSI to the consumer marketplace. In the last decade, the use of
large imaging arrays in consumer products like smart cell phones, aerial drones, self
driving vehicles, and powerful portable computers has become ubiquitous. The necessary
components for high resolution imaging, including data storage and on-board graphical
displays, are embedded into these devices along with wireless networking and file
transfer capabilities. In addition, bright optical sources like solid-state lasers and
broadband LEDs (light emitting diodes) are commonplace, affordable, and already exist
in many of these products. The last impediments to consumer-based HSI by non
specialists are turnkey software applications for automated data processing and the
availability of compact, inexpensive, high performance, and low power wavelength
selection devices.
The choice of which imaging strategy to use for compact, field-capable, HSI
devices accounts for the capabilities and limitations of the potential modalities. Rapid
22
data acquisition, high image resolution, narrow spectral resolution, broad spurious-free
spectral range, and high signal-to-noise level are desirable. Unfortunately, there exist
tradeoffs among the number of pixels imaged, the number of optical bands interrogated,
the desired signal-to-noise level, and the total acquisition time.172 Although a full
consideration is beyond the scope of this work, some generalizations are useful to
consider. For example, as the number of wavelengths increases, the widefield acquisition
time increases, but the time for the scanning methods remains unchanged. Conversely, as
the number of pixel elements increases, there is no change in the duration of the widefield
experiment, but longer acquisition times are needed for the scanning modalities. Data
sparsity, a term used to describe that portion of the data that yields no relevant
information, often leads to unnecessarily long acquisition times. For spatially complex
samples, which are commonly studied using HSI, sparsity in the wavelength dimension is
often greater than in the spatial dimensions, thereby making the widefield implementation
more attractive. It is also important to consider the optical characteristics of the sample.
For instance, longer exposure times are required to reach the desired signal-to-noise level
in light-sensitive applications in which optical attenuation is applied to avoid sample
damage. If a scanning modality is used in this circumstance, longer dwell times at each
pixel location are needed and the overall acquisition time increases. Conversely, little or
no attenuation of the light may be needed for the widefield approach if the same radiant
source is used because the light will be defocused, thereby resulting in less optical power
per pixel at the sample. Hence the disparity between the scanning and widefield
acquisition times diminishes when the total number of scanned steps approaches the
number of optical bands for these types of samples.
23

The SPCTF was designed to exploit existing and forthcoming technologies to
achieve useful HSI capability. The large detector arrays and embedded circuitry of
existing consumer products are most easily adapted for the widefield imaging modality in
which no mechanized or tightly-regimented scanning protocols are needed. Software
modification of existing platforms can readily provide image postprocessing to account
for image registration errors that might result from detector or sample motion during the
acquisition period. In fact, many consumer cameras already make use of image
registration algorithms but do so to provide image stabilization during video recording or
for reducing image blur in still pictures. Recent advances in computational imaging that
enable post-acquisition refocusing of the image173 will likely benefit widefield HSI
approaches by allowing the user to retroactively confine the depth of field to within the
sampled region so that off-sample regions in the image are ignored. Because the SPCTF
preserves the trajectory of light rays in the Fourier space that lie within its acceptance
angle, it can be easily integrated with computational imaging detectors.
As part of this work, a theoretical description of surface plasmon generation in
thin metal films, and design and construction of the SPCTF are presented. Experimental
reflectance data as a function of wavelength and incident angle with respect to the metal
film, deposited on a glass prism in the Kretschmann-Raether configuration, is presented
along with theoretical estimates for comparison. Also demonstrated is wavelength tuning
using a coupled surface plasmon interaction in a symmetric cavity created by closely
juxtaposing two prisms with their coated hypotenuses facing each other. Using this
configuration as the basis of the SPCTF design, HSI using the SPCTF is demonstrated for
the first time. The transmittance and bandpass values as a function of wavelength are also
24

reported. By exploiting the sensitivity of surface plasmon generation to the angle of
incident light, a narrow passband SPCTF is introduced as a proof of principle. The
bandpass and acceptance angle of the narrow passband device are given along with a
brief discussion of the relationship between short-range and long-range surface plasmons
in the SPCTF.
25

CHAPTER 2
THEORY OF THE SURFACE PLASMONS
Plasma oscillations are cooperative oscillations of free electrons such as those that
can be induced in metals. The quasi-particle representation of the collective oscillation
frequency is called a plasmon. Surface plasmons are said to exist when the oscillations
are mostly localized at the surface, usually at the interface of a thin metal film with a
dielectric. Other types of interfaces, such as those that form at dielectric-dielectric and
dielectric-semiconductor boundaries can also support surface plasmons. The plasma
waves are confined to the interface and exist as transverse magnetic (TM) waves that
travel along the interface. At planar interfaces, the combined effect of the electron motion
with the electromagnetic (EM) fields it creates in and around the metal (Figure 3) are
referred to as a surface plasmon polariton (SPP).174, 175
26
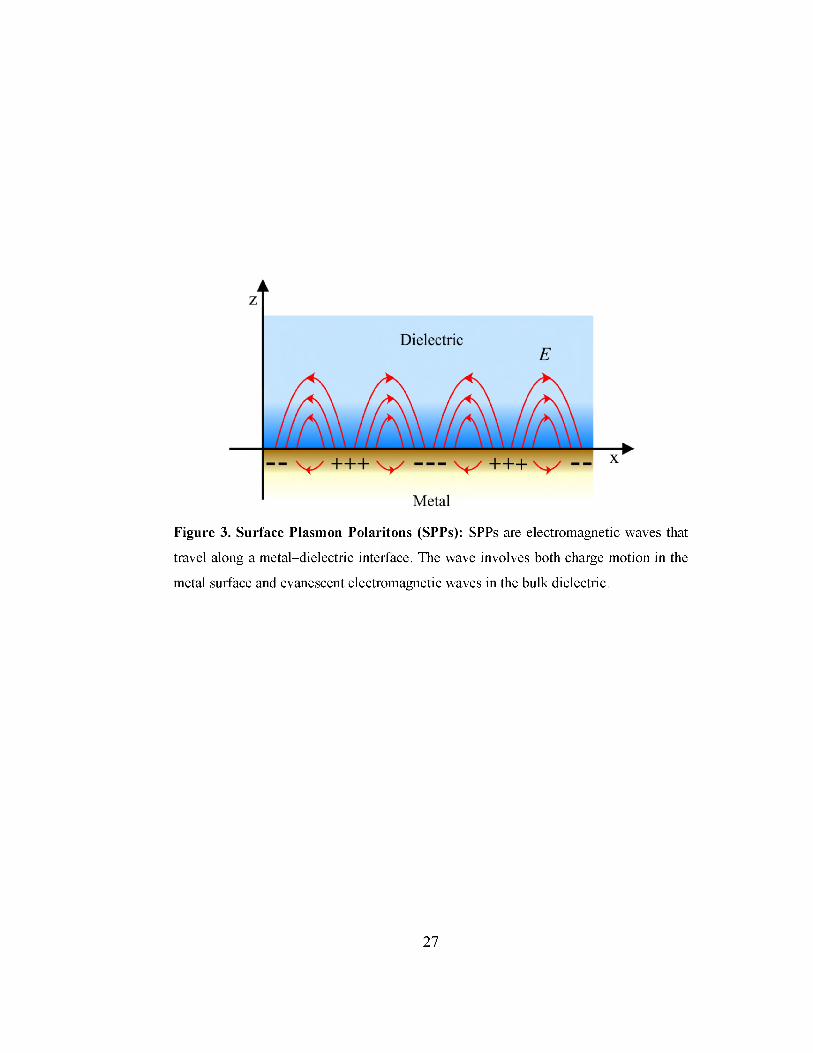
Figure 3. Surface Plasmon Polaritons (SPPs): SPPs are electromagnetic waves that
travel along a metal-dielectric interface. The wave involves both charge motion in the
metal surface and evanescent electromagnetic waves in the bulk dielectric.
27

While a full description of SPP generation is given by electromagnetic field
theory, a classical treatment is useful for describing those aspects that involve reflection,
transmission, and absorption of optical energy.176, 177
2.1 Optical Excitation of Surface Plasmon Polaritons
In optical refraction, which is described by Snell's Law and the Fresnel equations,
the refractive index, n = co/cm, is used to relate the velocity of light, co, in a vacuum to
the wave velocity in a refractive medium, cm.178 In non-optical substrates such as in
metals, the behavior of electromagnetic radiation is described by Maxwell's equations
(Appendix A) which depend on the electric permittivity, ε, and magnetic permeability, μ.
Because of dispersion, the refractive index, permittivity, and permeability are frequency
dependent. It is convenient to recast the permeability and permittivity values for a
substrate relative to their vacuum values so that εr(ω) = ε(ω)∕ε0 and μr(ω) =
μ(ω)∕ μ0 , where ω is the angular frequency and εr and μr are the relative permittivity
and relative permeability, respectively. Maxwell's equations are generalized expressions
that apply to optical refraction as well. The relationship between the n, εr, and μr is
given by n = √εrμr . Because most refractive substrates are non-magnetic at optical
frequencies where μr ≈ 1, the refractive index can be approximated by letting ≈ √εr .
In metals where damping occurs, the complex permittivity, εr = εr + iε'r , is used where
ε'r is the imaginary part of the permittivity. Hence, there exists a complex refractive
index, εr, with real, n, and imaginary, κ, parts such that εr = n2 = (n + iκ)2.
28

The interaction of metals with electromagnetic radiation is largely dictated by the
free electrons of the conduction band in metals. Light incident on a metal film interacts
with the free electrons in the film that move in a manner to compensate for the incident
field gradients. This motion accounts for the reflection of light by highly conductive
metals. The extent to which electrons compensate for the applied field oscillations can be
understood by considering the plasma frequency of the metal. When electrons are
displaced by a small amount from their ions, a Coulombic restoring force results. The
plasma frequency, ωp, of a metal is the natural frequency at which the electrons
collectively oscillate upon removal of the applied field. The magnitude of the Coulomb
force governs the value of ωp. At low field frequencies, the electrons can move in way
that prevents the electric field from entering the metal. When the applied frequency
exceeds ωp, the field oscillations are too fast for the electrons to follow. Consequently,
the metal can no longer reflect the light and the field propagates into the metal.
The momentum of optical photons at a given frequency is much smaller that the
momentum associated with electron oscillations in most metals at the same frequency.
This momentum mismatch makes it impossible to directly excite SPPs on a metal surface
using light traveling in air. By exploiting the geometric arrangement between the incident
ray and the metal surface in an optically refractive material, and by relying on damping in
the metal, plasmonic motion can be induced on a metal surface by the incident ray. Two
common geometric arrangements, the Kretschmann-Raether and Otto configurations,
enable coupling of SPPs to incident photons (Figure 4).174, 179, 180 In both cases π-
polarized light traveling in a right-angle prism is incident to the prism hypotenuse at an
angle above the critical angle. In the Kretschmann-Raether configuration, which is used29

here to construct the SPCTF, the hypotenuse surface is coated in a thin metal film (~48
nm Ag).
In the Otto geometry if a metallic substrate is placed in the vicinity of the prism so
that the evanescent fields of the reflected light impinge onto the metal, and the incident
angle is appropriate, SPPs can be excited along the metal surface. In Otto geometry the
metal thickness can be much larger than the decay length of the surface-plasma field in
the metal.
In the Kretschmann-Raether configuration, the metal film is deposited on top of a
glass prism. The film is illuminated through the dielectric prism at an angle of incidence
greater than the angle of total internal reflection. The wave vector of light is increased in
the optically dense medium. At a certain angle of incidence θ, the in-plane component of
the photon wave vector in the prism can coincide with the SPP wavevector on an air-
metal surface. The result is photon-plasmon coupling and the formation of surface
plasmon polaritons.
30

Figure 4. Optical Excitation of SPPs: A) Kretschmann-Raether configuration. B)
Otto configuration. The electromagnetic field associated with incident π-polarized light
is converted to electron density fluctuations (surface plasmons) at the metal-dielectric
interface corresponding to the boundary between ϵmetal and ϵair.
31

2.2 Dispersion Relation of Surface Plasmon Polaritons
For optical refraction in transparent materials, dispersion describes the change in
refractive index as a function of the applied optical frequency. In the more complex case
of a coupled interaction between photons and plasmons, dispersion can be thought of as
the relationship between the applied optical frequency and the angular wavenumber,
kx = 2π∕Λx. Here, Λx is the wavelength associated with the collective electron
oscillation at the metal-dielectric interface. The wavevector, kx, lies within the plane of
incidence along the metal-dielectric (air) interface. A plot of the dispersion curve as a
function of angular wavenumber kx along the metal film is shown in Figure 5.
In air, the angular frequency of light, ωair, exceeds the plasmon frequency except
where kx approaches zero. In refractive materials such as glass, the slope of the light line
changes by 1/n, enabling the light line to intersect the dispersion curve for electron
motion at a suitably large kx value. For the ω and kx values at the intersection, coupling
between photons and SPPs is possible for π-polarized light. Even though the incident
angle at the prism hypotenuse exceeds the critical angle, θc, the reflected intensity
approaches zero at the angle of surface plasmon resonance, θsp, which is dependent on the
wavelength of light (A), metal film thickness, and the dielectric properties of the metal
and glass. While the surface plasmon dip is broad as a function of wavelength, SPPs
occurs over a narrow range of incident angles and a sharp minimum is observed in the
reflectivity as a function of incident angle at the hypotenuse. As the film thickness
increases, the efficiency of SPP coupling diminished due to the additional damping
experienced by the electromagnetic fields during tunneling.
32

Figure 5. Dispersion Relation: In the Kretschmann-Raether configuration surface
plasmons are generated at ksp which corresponds to the point where the dispersion
curve in the metal (orange) intersects with the light line in glass, ωg. The light line in
air, ωair is shown for comparison.
33

2.3 Permittivity of Thin Metal Films
In metals, the permittivity has real and imaginary parts. The imaginary part is
related to damping and determines the frequency bandwidth over which SPP generation
is possible. In addition, damping limits the propagation distance of SPPs along the metal
surface and is responsible for short-range surface plasmon polariton (SRSPPs). For
efficient SPP generation, the real part of the permittivity should be negative and larger in
absolute magnitude than that of the dielectric. Au and Ag meet these requirements and
are relatively easy to deposit on glass as thin films. Because Au and Ag are dispersive,
and because the SPCTF is designed to operate over a large spectral range, it is necessary
to consider the change in permittivity as a function of wavelength.
A published table of permittivity values for Ag was used to estimate the real and
imaginary permittivity values between 400 nm and 900 nm as shown in Figure 6A and
6B.181 For gold a table of optical constants was used to obtain the refractive index values
(n) and extinction coefficients (k) as a function of the photon energy in electron volts
(eV).182 Conversion of the energy, E, from eV to wavelength in nm was performed using
1239.8 eV∙nm such that λ(nm) = 1239.8(eV∙nm) /E (eV). From n and k, the complex
permittivity is calculated as: εr = εr + ιε'r = (n + ik)2, where εr and ε'r are real and
imaginary parts of complex dielectric constant εr.
34

Figure 6: Complex Permittivity (εr) of Ag and Au. A) The real (εr) and B)
imaginary part (ε'r) of the relative permittivity as a function of wavelength for Ag. A
second order polynomial (blue) was used to fit the data. C) and D) real (εr) and
imaginary (ε'r) part of the complex permittivity of Au. A cubic spline (blue) was used
to fit the data for interpolation.
35

Expanding the right-hand side of the complex permittivity equation yields
εr = n2 — k2 and ε'r = 2nk. The real part of the complex permittivity is an indication
of dispersion in the material and the imaginary part is an indication of damping of the
field. The real and imaginary parts of the permittivity for Au are shown in Figure 6C and
6D.
Permittivity is a measure of how an electric field affects, and is affected by, a
medium. The permittivity of a medium describes how much electric field is generated per
unit charge applied to that medium and it relates to a material's ability to resist an electric
field. The complex permittivity curves for both Ag and Au show each having large
negative real part of the permittivity, the meaning of negative permittivity is related to the
non-resistance of the material to the electric field. The larger imaginary component of the
complex permittivity of Au compare to Ag indicates that more energy loss resulting from
damping of the electric field occurs in Au. For wavelengths shorter than ~550 nm,
photons promote electrons of lower-lying bands into the conduction band in Au, thereby
accounting for the large values for the ε'r.183 Hence Ag provides more efficient SPP
coupling in the low wavelength portion of the visible region than Au.
36

2.4 Theoretical Calculation of Reflectance Loss by Photon-Polariton Coupling
For a metal-coated prism in the Kretschmann-Raether configuration, the
reflectance of light at the glass-metal interface will be attenuated by the generation of
SPPs at the metal-air interface. Given the permittivities of the glass and metal film,
Fresnel's equations can be used to calculate the reflectance at specified angle of
incidence. A drop in the reflectance at angles greater than the critical angle are attributed
to the conversion of photon energy to surface plasmons. A summary of the equations that
result from the Fresnel approach are included here. The variable assignments are
described in Figure 7 for the Kretschmann-Raether configuration employed in the
construction of the SPCTF. The Fresnel expressions enable the calculation of the
reflectance for the glass-metal and metal-air interfaces which are needed for elucidating
the SPP conditions. The reflectance, R, is calculated from
where rij is the reflection coefficient at the interface between the ith and jth substrates. For
the glass-metal interface,
37

Figure 7: Variable Assignments of the Kretschmann-Raether Configuration for
Use in the Fresnel Calculation of Reflectance. Because the permittivity of air is
close to the vacuum permittivity, Eair ≈ E0 and εair ≈ ε0.
38

The magnitudes of the wavevector components along the z-axis are given by kzg in the
glass and kzm in the metal, where
and
The magnitude of k0 can be calculated from the vacuum wavelength, λ0, according to
k0 = 2π∕λ0 and kx, where
Because kx is situated along the glass-metal interface and electromagnetic fields are
continuous across the interface, kx is a boundary condition and has the same value for
the glass and metal. This process is repeated for the metal-air interface in which the
reflection coefficient is calculated from
where the permittivities, εa and εm, and z-axis components of the wavevectors in the
metal, kZm (Eq. 4), and air, kZa, are used. Although not shown in Figure 7, the
assignment of kZa is consistent with that for glass and metal, and its value can be
calculated from
39

For the multilayer glass-metal-air system, the complex amplitude of the π-
polarized reflected light can be determined from Maxwell's equations by applying the
condition of continuity to both interfaces. Upon simplification, the combined reflection
coefficient, rgma becomes
and is dependent on the thickness, d, of the metal film.176, 177 The total reflectance of the
glass-metal-air system can now be determined using the relation given in Eq. 1 so that
Figure 8 is the plot of calculated reflectance (Eq. 9) as a function of incident angle
onto the hypotenuse of a BK7 prism coated with a 48 nm Ag thin film. A minimum in the
plot of reflectance as a function of incident angle θ, represents the conversion of energy
away from the reflected beam. When θ ≥ θc, the energy loss is not accounted for in either
the reflected or transmitted beams. Instead, the energy excites SPPs at the metal-air
interface.
40
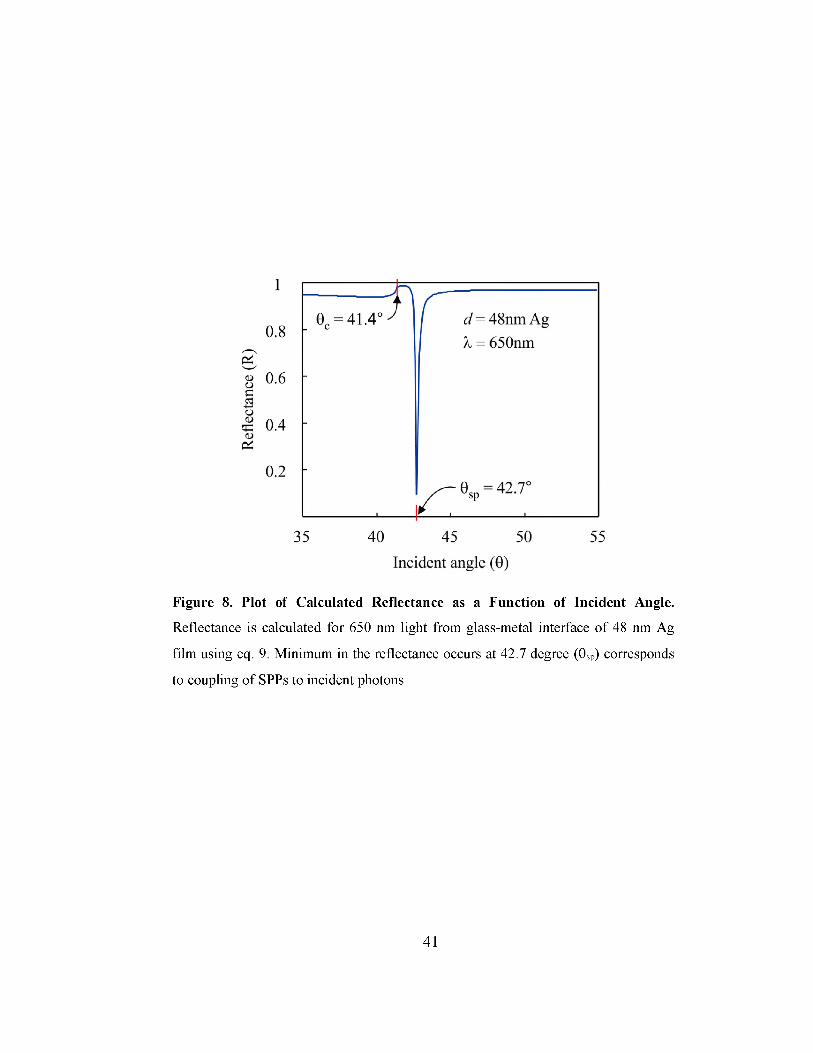
Figure 8. Plot of Calculated Reflectance as a Function of Incident Angle.
Reflectance is calculated for 650 nm light from glass-metal interface of 48 nm Ag
film using eq. 9. Minimum in the reflectance occurs at 42.7 degree (θsp) corresponds
to coupling of SPPs to incident photons.
41

CHAPTER 3
DETERMINATION OF REFLECTANCE AS A FUNCTION OF
INCIDENT ANGLE AND WAVELENGTH
Before proceeding with the construction and characterization of the SPCTF it was
important to study the surface plasmon coupling in Kretschmann-Raether configuration.
This chapter includes the process of preparing a prism with a thin Ag film followed by
characterization of the film, a description of a custom-built apparatus designed to
measure the reflectance for the Ag film in the Kretschmann-Raether configuration as a
function of incident angle and wavelength, the calculated reflectance for the thin film
coated on the hypotenuse of the prism, and results of the reflectance measurements as a
function of incident angle and wavelength for the spectral range between 550 nm and 850
nm.
42

3.1 Experimental and Methodology
3.1.1 Sputter Deposition of Ag on BK-7 Glass Prisms
Thin Ag films were deposited using a 5.1 cm diameter 13.56 MHz magnetron
sputter gun on the hypotenuses of BK-7 right angle prisms (Edmund Optics, 15 mm) to a
target thickness of 48 nm. A modified sample mount was used that enabled a pair of
prisms to be coated along with a polished piece of silicon wafer without having to reopen
the sputter chamber. The silicon substrates were used to experimentally validate film
thickness using scanning electron microscopy (FEI, Inspect-F50), Figure 9A-B.
Sputtering was carried out in Ar gas at ~8 mTorr pressure using an RF power of 60 W.
The background pressure measured with the Ar purge turned off and the pump throttle
valve set partially closed as it would be during deposition, was 2.2×10⁻⁵ torr. A pressure
of ~1×10⁻⁶ torr was achieved with the pump throttle valve open.184, 185 The sputter time
was determined from earlier calibration trials in which Ag was sputtered on polished
silicon substrates for a range of deposition times under the same experimental conditions
that were used for the prisms. In addition, a quartz microbalance was used to monitor
progress. Once coated, the prisms and silicon substrate were removed and immediately
placed in a sealed air tight vessel under Ar purge. Electron micrographs were acquired
along the interface of a cross section of the silicon substrate to measure the thicknesses
across. Number of Ag film thickness measurements were recorded, and normal
distribution was applied to those measurements to verify the final Ag film thickness. The
thickness distribution plot is shown in Figure 9C.
43

Figure 9: Scanning Electron Micrographs of Ag Film and Thickness
Distribution. Electron micrographs A) and B) were obtained at 10 kV for different
magnification, of the Ag film deposited on to silicon wafer under same condition and
duration as the prism. Several thickness measurements were made across the silicon
wafer. C) Normal distribution plot of the Ag film thickness measurements made on
the silicon substrate. Average thickness of the Ag film is 48.486 nm.
44

3.1.2 Apparatus for the Reflectance Measurements as a Function of Incident Angle and Wavelength
To determine the angle of incident illumination necessary for SPP formation, the
coated prism was placed on the central stage of a pair of rotational stages that shared a
common axis of rotation as shown in Figure 10. Independent rotation of each motorized
stage (Cognisys, ROTO_TAB_01) was provided by a USB connected controller
(Cognisys, STKS-C-3X) to achieve a step accuracy of 0.01o. A 150 W quartz tungsten
halogen (QTH) lamp (GELCO FDS/DZE 24V) coupled to a 3mm diameter liquid light
guide (Thorlabs, 2000 Series) was used to provided broadband illumination. Light exiting
the light guide was collimated using an f/2 lens and then wavelength filtered to the
desired range between 550 nm and 850 nm using a 550 nm long-pass filter followed by
an 850 nm short-pass filter (Edmund Optics). Further collimation was achieved using
series of 1 mm apertures placed before and after a linear polarizer (Thorlabs, GTH10MA)
that was oriented to provide π-polarized light at the prism hypotenuse. A slit placed
immediately before the prism was used to further reduce beam spread in the plane of
incidence. A reference fiber was used to monitor the light source intensity changes over
time. Light reflected from the prism hypotenuse was focused into a 200 μm collection
fiber (CeramOptec) using an f/2 lens (Edmund Optics). The lens and collection fiber were
mounted on a rail extending out from the center of the second rotational stage to enable
angular positioning.
45

Figure 10: Schematic Diagram of the Optical Setup for Reflectance
Measurements. Two independently controlled motorized rotational stages share the
same axis of rotation. The Ag coated prism is mounted on top of the inner rotational
stage and the collection optics are mounted on an extension rail attached to the outer
rotational stage.
46

The distal end of the collection fiber was coupled to an imaging spectrograph
(Chromex, 500IS/SM) equipped with a liquid nitrogen-cooled charge coupled device
(CCD) detector (Roper/Princeton Instruments, EEV 400X1340B) for spectral acquisition.
To ensure capture of the reflected light, a series of spectra were recorded for each 0.1o
increment of prism rotation by scanning the collection fiber by 0.05o increments across
the reflected beam. This approach also safeguarded against any mechanical play in the
rotational stage assembly.
Data collection was automated using a Windows application written in Visual
C++ that controlled the rotational stages as well as all aspects of CCD acquisition such as
exposure time, chip-temperature (-90° C), and file handling. Wavelength calibration was
performed using a spectrum acquired from a neon lamp (Newport, 6032). To enable
calculation of the SPCTF reflectance a blank illumination spectrum was required. To
accomplish this, the prism was removed and a spectrum of the illumination was recorded.
A background spectrum, recorded by blocking the illumination, was subtracted from all
spectra prior to taking the ratio of the reflected light spectra with respect to the
illumination spectrum. Comparison of this data to theoretical estimates is performed by
first adjusting the theoretical calculation to account for reflection losses at the entrance
and exit faces of the BK-7 prism. All data processing was performed using code written
in MATLAB (The MathWorks).
47

3.2 Result and Discussion
3.2.1 Calculated Reflectance from the Glass-Metal Interface in the Kretschmann-Raether Configuration
A theoretical description of the reflectance calculation from the glass-metal
interface in the Kretschmann-Raether configuration is described in the section 2.4.
Results from these calculations were obtained by original code written in MATLAB
(Appendix B) and are shown in Figure 11. Figure 11A shows the calculated reflectance
for 550 nm, 580 nm, 610 nm, 650 nm, 685 nm, 731 nm, and 794 nm light for incident
angle between 38° and 48° onto prism hypotenuse (glass-metal interface). Since BK7 is a
dispersive material, it is important to account for its dispersion because of each
wavelength could potentially take a different path through the BK7 material. The light
entering the prism will also undergo Fresnel reflection off of the entrance face of the
prism and the same applies when the reflected light off of the hypotenuse leaves the
prism exit face. The losses due to Fresnel reflections at the prism faces are calculated and
subtracted from the theoretical reflectance of the glass metal interface to present the
reflectance curve for each individual wavelength in a manner that is suitable for
comparison with empirical data. The complex permittivity of a thin metal film is also a
function of wavelength, as described in the section 2.3. Hence it is important to perform
the reflectance calculation by factoring in dispersion with the complex permittivity of Ag.
These theoretical calculations are performed for the wavelength range between 550 nm
and 850 nm to match with the experimental conditions described in section 3.2.1. The
theoretical reflectance surface is shown as a function of illumination wavelength and
incident angle in Figure 11B.
48

Figure 11. Theoretical Reflectance from the Glass-Metal Interface of a Prism
Coated with Ag in the Kretschmann-Raether Configuration. A) Plot of
reflectance vs incident angle calculated for various wavelengths. A sharp drop in the
reflectance corresponds to the formation of SPPs at angles greater than the critical
angle. B) The reflectance surface calculated for incident wavelengths between 550
nm and 850 nm and at incident angles between 38° and 48°.
49

There is an increase in the reflectance as the incident angle approaches the critical
angle of ~42°. For larger incident angles in uncoated prisms, the reflectance is ~1. For a
coated (Kretschmann-Raether) prism, there is a sharp dip in the reflectance between 43°
and 44° that corresponds to SPP generation at the metal-air interface. As shown more
clearly in Figure 11A, there is a wavelength dependence on the angle of maximal surface
plasmon generation. The oscillatory appearance at the base of the plasmon dip in Figure
11B is an artifact arising from the finite increments for wavelength and incident angle
that were used in the script to calculate the reflectance surface.
When the reflectance surface is viewed from top (Figure 12A) the angular
dependence of SPP formation is apparent. Reflectance vs wavelength curves, extracted
for various incident angles as shown in Figure 12B, shows that a broad range of
wavelengths are able to couple at each discrete incident angle. Hence the coupling of
SPPs is more strongly dependent on incident angle than the illumination wavelength.
50

Figure 12: Incident Angle and Wavelength Dependence of Surface Plasmon
Coupling. A) The calculated reflectance surface viewed as an image (top down
view). The wavelength dependence of the incident angle necessary for plasmon
formation is apparent. B) A series of reflectance curves extracted from the surface as
a function of wavelength for various incident angles. For each incident angle a broad
band of wavelengths are able to couple to SPPs.
51
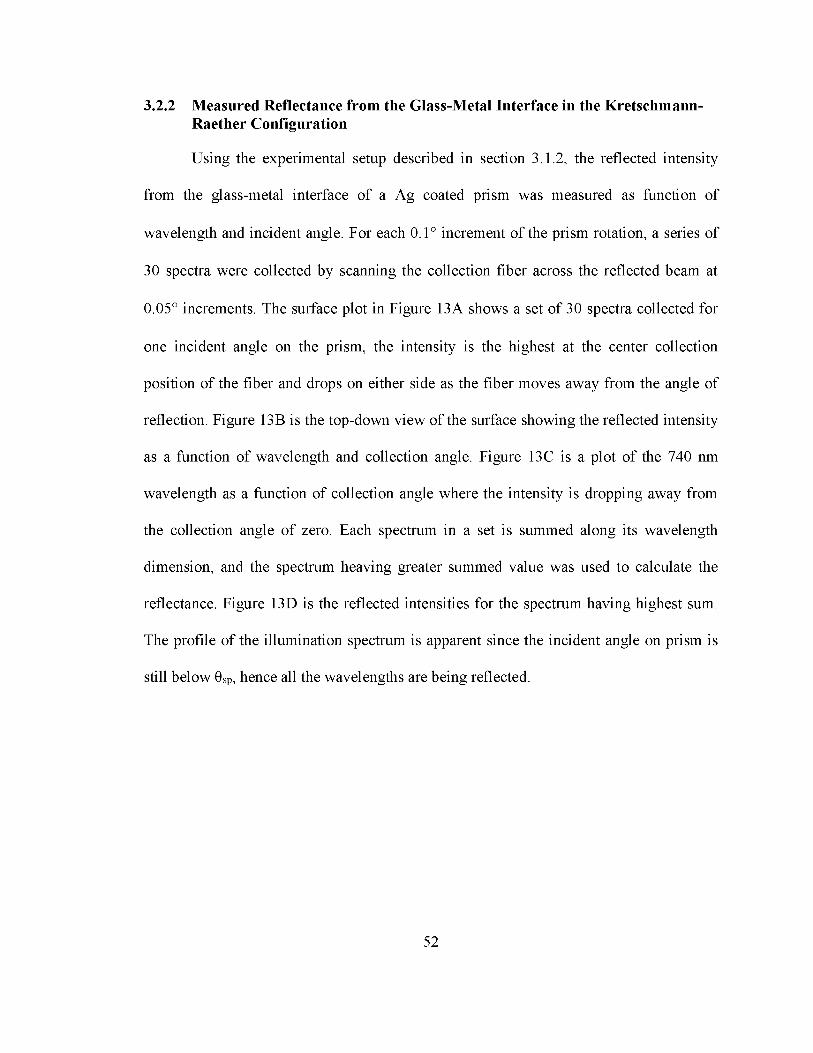
3.2.2 Measured Reflectance from the Glass-Metal Interface in the Kretschmann- Raether Configuration
Using the experimental setup described in section 3.1.2, the reflected intensity
from the glass-metal interface of a Ag coated prism was measured as function of
wavelength and incident angle. For each 0.1° increment of the prism rotation, a series of
30 spectra were collected by scanning the collection fiber across the reflected beam at
0.05° increments. The surface plot in Figure 13A shows a set of 30 spectra collected for
one incident angle on the prism, the intensity is the highest at the center collection
position of the fiber and drops on either side as the fiber moves away from the angle of
reflection. Figure 13B is the top-down view of the surface showing the reflected intensity
as a function of wavelength and collection angle. Figure 13C is a plot of the 740 nm
wavelength as a function of collection angle where the intensity is dropping away from
the collection angle of zero. Each spectrum in a set is summed along its wavelength
dimension, and the spectrum heaving greater summed value was used to calculate the
reflectance. Figure 13D is the reflected intensities for the spectrum having highest sum.
The profile of the illumination spectrum is apparent since the incident angle on prism is
still below θsp, hence all the wavelengths are being reflected.
52

Figure 13: Preprocessing of the Reflected Intensity Measured from the Glass- Metal Interface of a Silver-Coated Prism. A) A set of 30 spectra collected for one
incident angle by scanning the collection optic across the reflected beam is shown. B)
The top-down view of the data showing the reflected intensity as a function of
wavelength and collection angle to the angle of reflection is shown. C) The reflectance
observed for 740 nm as a function of collection angle is plotted. The intensity is higher
at the angle of reflectance and drops off on either side as the collection optic moves
away from the reflected beam. D) Each spectrum in the set of 30 was summed along its
wavelength dimension, spectrum with the highest is plotted, and used for the calculation
of the reflectance. This process is repeated for all 200 sets collected for the whole range
of incident angles onto the glass-metal interface.
53

A spectrum of the illumination source was collected after removing the prism.
The background spectrum was recorded by blocking the incident beam and was
subtracted from the reflected spectra and the illumination spectrum. The reflectance
spectra were calculated as the ratio of the background corrected reflected light spectra
with respect to the background corrected spectrum of the source. A plot of the reflectance
as a function of incident angle and wavelength is shown in Figure 14.
The data results are shown in Figure 14 and are in qualitative agreement with the
theoretical estimates (Figure 11 and 12) to within experimental error carried by the
position uncertainty in the motions of the dual stages. For example, there is an increase in
the reflected light as the incident angle approaches the expected critical angle of 42° and
the angular position of the surface plasmon dip, in the vicinity of 43°, exhibits the
expected wavelength dependency. Because the silver was not protected from oxidation
during data acquisition, significant attenuation of the SPP is expected. Due to the large
amount of data necessary to generate the reflectance surface, a short exposure time (1 s)
was used to reduce the total acquisition time. While sufficient, the moderate signal-to-
noise level is a consequence of the tradeoff between signal intensity and acquisition time.
Traces from the reflectance surface for several angles of incidence and wavelength are
shown in Figures 14C and 14D respectively. The surface plasmon dip is broad in the
wavelength dimension and its full width half maximum nominally spans ~70 nm.
Conversely, the formation of SPPs is very sensitive to the angle of incidence, spanning
less than 2° over the wavelength range from 550 nm to 850 nm as shown in Figure 12D.
This angular sensitivity can be exploited to reduce the optical bandpass of the SPCTF as
shown in chapter 5.54

Figure 14: The Measured Reflected Intensity from the Glass-Metal Interface of a
Silver-Coated Prism as function of Wavelength and Incident Angle. The
reflectance surface and image, shown in A) and B) agree qualitatively with the
theoretical estimates shown in Figure 11 and 12. Traces of the reflectance surface as a
function of wavelength and incident angle are shown in C) and D). Although SPPs
can couple over a large wavelength range, they are very dependent on the angle of
illumination.
55

Optical characterization of metal-coated prism in the Kretschmann-Raether
configuration is relatively straightforward as both the reflected and transmitted beams are
readily accessible. Energy losses beyond those associated with non-ideal behavior of the
substrates can be accounted for, to the extent that theory allows, by the formation of
SPPs. While imperfect, there is substantial agreement between theory and empirical
findings. The more challenging issues are related to understanding the SPP character, the
behavior of electron groups as well as individual charges, and the way that surface non
uniformities in the metal and support substrate affect SPP formation and propagation.
56

CHAPTER 4
SURFACE PLASMON COUPLED TUNABLE FILTER
This chapter describes the coupled surface plasmon resonator along with the
design of the surface plasmon coupled tunable filter (SPCTF). The SPCTF can be loosely
thought of as a merging of the Kretschmann-Raether and Otto configurations. The
SPCTF is constructed from two prisms, each constructed in Kretschmann-Raether
configuration. The prisms are aligned to one another with their Ag-coated hypotenuses
facing each other, yet separated by a thin dielectric (airgap). The electromagnetic fields at
the metal-air interfaces arising from electron motion as well as any evanescent
contribution from the incident and coupled light fields are acted upon by the conditions of
the resonant cavity as a whole. Hence, the extent of coupling of SPPs across the airgap is
strongly dependent on the cavity geometry and dielectric properties of each layer. In
addition, the phase relationship between plasmon oscillations in each metal influences the57

SPP coupling efficiency. The SPCTF exploits these properties to achieve wavelength
tuning of the coupled light by varying the dielectric thickness (airgap thickness). For
uncollimated monochromatic light, a range of incident angles is presented to the SPCTF
and more than one coupling mode can be populated simultaneously, depending on the
airgap distance.
An ideal tunable wavelength filter for hyperspectral imaging should demonstrate
sufficient throughput, a suitable bandpass for the application, a large spurious-free
spectral range, and diffraction limited spatial resolution. In this chapter, the SPCTF
performance is characterized, wavelength tuning is explored as function of airgap
thickness in the range between 550 nm and 850 nm, transmittance and its bandpass is
measured as a function of tuning wavelength. The spatial resolution of the filter is
measured, and hyperspectral imaging is demonstrated using a model sample.
4.1 Experimental and Methodology
4.1.1 Design of the Surface Plasmon Coupled Tunable Filter
The SPCTF described here is constructed from two prisms as described in Figure
15 that are closely juxtaposed with their metal-coated hypotenuses facing each other. In
this arrangement, light incident on the first glass-metal interface can excite SPP at the
metal-air interface. Due to the proximity of the second (identical) metal-coated prism,
dipole-dipole coupling can drive SPP formation at the air-metal interface of the second
metal-coated prism. Because both metal-coated prisms are identical, photon-plasmon
coupling at the metal-air interface of the first prism can be expected to lead to plasmon-
photon coupling at the air-metal interface of the second prism.
58

Figure 15: The Surface Plasmon Coupled Tunable Filter (SPCTF). Two metal
coated prisms separated by a small tunable air-gap are used to provide wavelength
tuning. Increasing the airgap from d1 to d2 causes the transmitted light to shift to a
longer wavelength. The surface plasmon dip in the reflected light also shifts towards a
longer wavelength.
59

As illustrated in the enlargement of Figure 7, the wavevector projection along the
interface, kx, is shared by both the incident and transmitted radiation such that kx =
ηgk0 sin θ = 2π∕Λx, where ηg is the refractive index of the BK7, ko is the wavevector in
vacuum, θ is the incident angle and Λx is the wavelength related to SPPs. For coupling to
occur, both frequency and momentum must be matched between the photon and plasmon.
This occurs at an incident angle θsp, in the direction along kx.
The incident angle required to reach the transmission maximum in the SPCTF is
not the same as the incident angle at which SPP coupling is maximum for the case of the
single Kretschmann-Raether prism, neither are these angles separated by a constant
amount. In the single interface case, a minimum in the reflectance occurs when the
component of the incident wavevector parallel to the interface, after undergoing
modifications by the metal film, matches the real part of the surface SPP wavevector. The
maximum in the surface charge density occurs when the normal electric field component
peaks. The coupled dielectric system of the SPCTF behaves in the similar fashion, but
must be considered as a whole.186
60

4.1.2 Construction and Characterization of the SPCTF
The SPCTF was constructed by affixing both prism to aluminum rods using 330
epoxy (Hughes Associates). The rods were inserted into the channels of a custom
aluminum mounting that had openings to expose the optical surfaces of the SPCTF. One
prism was held stationary while that other could be moved by turning a finely threaded
screw, thereby adjusting the air gap between the prisms. Insertion of the prisms into the
mounting was performed prior to curing of the epoxy so that the prisms could be brought
into contact with each other as the epoxy set to establish a sufficiently parallel alignment
between their hypotenuses. Once construction of the SPCTF mounting was complete, the
assembly was positioned in place on the rotating stages, described in section 3.1.2 and the
fiber collection optics were repositioned as shown in Figure 16. A series of spectra were
collected for a range of SPCTF gap distances along with a spectrum of the illumination
that was acquired by removing the SPCTF. A background spectrum, obtained by
blocking the illumination path, was subtracted from all spectra prior to taking the ratio of
the transmitted light spectra with respect to the illumination spectrum.
61

Figure 16: Apparatus for Measuring SPCTF Transmittance. Transmitted light
through the SPCTF was measured for a series of airgap distances by carefully turning
the micrometer screw. The transmittance and bandpass were calculated as a function of
airgap distance and tuning wavelength.
62

4.1.3 SPCTF Hyperspectral Imaging Microscope
The schematic diagram in the Figure 17 is an illustration of the optical setup used
to perform proof-of-principle SPCTF hyperspectral imaging for the first time.
Illumination was performed in transmission mode using a broadband QTH light source
coupled to a refractive microscope (Olympus, BX-60). The transmitted light from the
sample was collected using an infinity corrected 10× objective (Olympus, 0.30 NA). To
selected only the π-polarized component of the light a Glan-Thompson polarizer
(Thorlabs, GTH10MA) was placed before the SPCTF. Wavelength filtering was achieved
by adjusting the airgap of the SPCTF, a mirror placed after the SPCTF directed the light
to a spectrometer via a fiber optic, to verify the tuning wavelength. The mirror is
removed when imaging, image acquisition was performed using a liquid nitrogen-cooled
CCD (Roper Scientific EEV1024x1024B) coupled to image reformation optics.
63
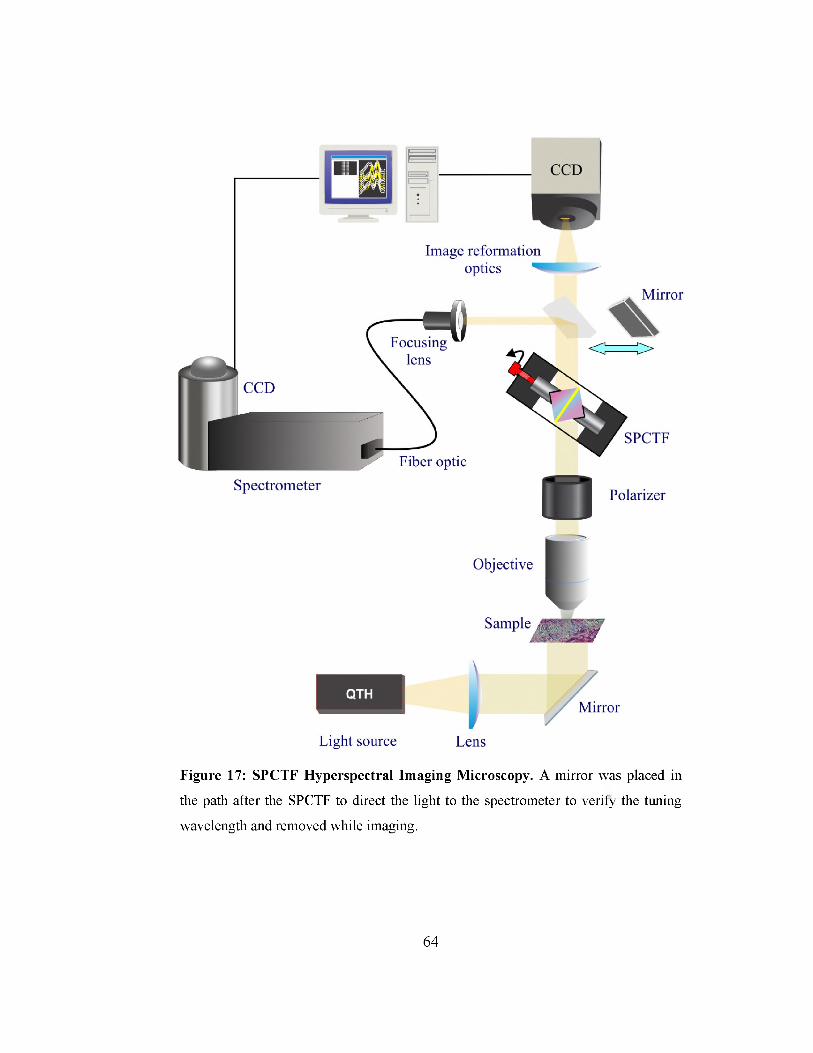
Figure 17: SPCTF Hyperspectral Imaging Microscopy. A mirror was placed in
the path after the SPCTF to direct the light to the spectrometer to verify the tuning
wavelength and removed while imaging.
64
4.1.3.1 Determination of Image Resolution
To measure the image resolution of the SPCTF microscope, a USAF 1951
resolution target was imaged in reflectance mode using a 10x objective. Illumination was
provided by the QTH lamp of the microscope.
4.1.3.2 SPCTF Hyperspectral Imaging
Hyperspectral imaging is performed on a commercially prepared sample, a
stained pine stem cross section (Carolina Biology Supply Co.) mounted in glass. Images
of the sample were collected at 25 nm increments from 450 nm to 700 nm at the full pixel
resolution of the CCD (1024x1024). The exposure time for each image was 1 s.
Wavelength tuning was achieved by adjusting the airgap as described in section 4.1.2.
Once collected, post-processing of the data to reveal image color-contrast based on
spectral shape was performed in MATLAB using the spectral identity mapping
algorithm.187, 188
4.1.4 Measuring SRSPPs and LRSPPs
Measurement of the short-range surface plasmon polaritons (SRSPPs) and long-
range surface plasmon polaritons (LRSPPs) was performed using 650 nm light from a
diode laser in place of the QTH source in the optical set-up described section 4.1.2.
Spectra of the light transmitted by the SPCTF were collected over a ±6° range of incident
angles. The process was repeated for the range of airgaps in which SRSPPs and LRSPPs
could both be observed as well as for appreciably thick airgaps in which only the LRSPPs
were observable.
65

4.2 Results and Discussion
4.2.1 SPCTF Transmittance and Bandpass
For a single metal-air interface, different wavelengths couple at different incident
angles. Wavelength tuning in the SPCTF, however, is accomplished for a fixed incident
angle by changing the air gap distance between the two metal-air interfaces that comprise
its resonant cavity. A series of SPCTF transmittance spectra are shown in Figure 18A for
a progression of airgap distances that increase for increasing passband wavelength. While
the nominal airgaps are between 1 μm and 2 μm, the tuning was performed manually and
precise estimates of the gap distances were not achievable using this experimental setup.
The measured bandwidths are likely larger than would be predicted for ideal substrates
due to surface roughness in the glass and metal. In addition, no feedback mechanism was
in place to either monitor or actively control the degree of parallelism of the metal-air
interface during tuning. Hence the observed SPCTF transmittance (25%-35%) and
bandpass values (~70 nm, nominally) would likely improve by employing smaller and
flatter substrates, and by replacing the mechanically-adjusted air gap with precision
electro-optic tuning.
66

Figure 18: Wavelength Tuning of the SPCTF. A) Transmittance spectra are shown
for a series of air gap distances. With increasing airgap distances, the passband shifts
to longer wavelengths. B) The transmittance of the SPCTF and C) the SPCTF
bandwidths (FWHM) are shown as a function of passband wavelength.
67

4.2.2 SPCTF Microscope Image Resolution
The light from an infinitesimally small source, a point-source, spreads out as it
propagates according to its point spread function, which is dependent on the optical
properties of the materials through which it propagates. Because light has wave character,
its diffraction and scattering limits the achievable spatial resolution of an imaging system.
The diffraction of light is wavelength dependent, so the resolution limit observed in the
far field is also function of wavelength. Hence, the image of a point source appears as an
Airy (blurry) disk with a diameter much larger than the source itself. Because the Airy
disks of two neighboring point sources overlap, the image may not show two distinct
sources of light. The minimal distance between the point sources that enables them to
appear as sufficiently separated in the image is the resolution limit of the imaging system.
The degree to which two overlapping Airy disks must be separated is a matter of some
subjectivity. Fortunately, three well-recognized resolution criteria have been widely
adopted; the Rayleigh, Abbe, and Sparrow criteria have been formulated into
mathematical estimates of the resolution limit. These closely related concepts mainly
differ in the degree of Airy disk separation required to assert that the point sources are
resolvable. The Rayleigh, Abbe, and Sparrow formulations are given by
68

where r is the distance between the two objects (point sources), λ is the wavelength of
light, and n is the index of refraction of the medium between the sample and collection
optic (objective lens). It should be noted that each denominator, n sinθ, is just the
numerical aperture (NA) of the collection optic. From the numerators, it is clear that the
Rayleigh criteria requires the most separation between the point sources while the
Sparrow criteria requires the least.
An image of the USAF 1951 resolution target acquired through the SPCTF tuned
at 700 nm passband is shown in Figure 19. The smallest element of the target has 228
line-pairs/mm. Hence each line pair, consisting of one bright and one dark line, is ~4.4
μm across. For 700 nm light in air, using a 0.30NA objective, the resolution limits are
rRayieigh≈ 1.4 μm, rAbbe≈1.2 μm, and rsparrow≈ 1.1 μm. Based on the line profile of
intensity values across element #6 of group #7 (Figure 19), the SPCTF microscope can
resolve features smaller than 4.4 μm. This is evident because the degree of separation
between adjacent bright lines, each appearing 4.4 μm apart, is greater than that required
for any of these resolution criteria. The image performance in this case is limited by the
pixel coarseness of the CCD detector. By fitting Gaussian profiles to the bright lines of
the resolution target and adjusting their overlap to that of the Rayleigh criteria, an
estimate of the effective image resolution that takes into account both the diffraction limit
and the CCD pixel geometry is obtainable. The effective Rayleigh resolution is ~ 3.5 μm.
Hence, while the optical performance of the SPCTF may be diffraction limited, the
microscope as a whole approaches the diffraction limit.
69

Figure 19: Image of the 1951 USAF Resolution Target Acquired Using SPCTF
Imaging Microscope. The line spacing for the element 6 in group 7 is 228 line-
pair/mm. An intensity plot across the lines pairs of the element #6 is shown on the
right along with the effective Rayleigh criteria for resolution illustrated.
70
4.2.3 SPCTF Hyperspectral Imaging of Pine Stem
To explore the potential of the SPCTF for use in widefield hyperspectral imaging,
a series of images of a model sample were collected through the SPCTF as a function of
its tuning wavelength. A stained pine stem cross-section was chosen as a model sample
for its inherent color-contrast in the operating range of the SPCTF and its well-defined
morphology.
The collected images, shown in Figure 20A, exhibit subtle wavelength-dependent
changes in the intensity values between image frames. A bright filed image of the sample
was also acquired (Figure 20B) by removing the SPCTF from the path. The hyperspectral
data were processed using spectral identity mapping (SIM) analysis to reveal wavelength-
dependent differences across the field of view.187 A spectral identity map (SIM) was
produced (Figure 20C) from the data in which shape variations in the spectra at each
pixel location are exploited to generate a single pseudo color image. Pixels that exhibit
different colors in the SIM image result correspond to differently shaped spectra in the
image dataset. Because SIM is scale invariant, these color differences represent
qualitative differences in composition. This data represents the first use of the SPCTF for
spectral imaging.
71

Figure 20: SPCTF Spectral Imaging. A) A set of widefield spectral images
collected through the SPCTF as a function of passband wavelength are shown for
wavelength between 450 nm and 700 nm at 25 nm increment. B) A bright field image
of the sample is shown and was acquired by removing the SPCTF. C) A spectral
identity map (SIM) of the image data shows qualitative changes in sample
composition.
72

4.2.4 Short-range and Long-range Surface Plasmon Polaritons in a CoupledSystem
Due to free electron scattering in the metal and surface roughness along the
interfaces, SPPs localized to different regions on the metal films can experience different
amounts of attenuation.189-191 The attenuation range can span 100-fold or more, leading to
a spread of SPP propagation distances. Therefore, only some of SPPs will meet the
resonance conditions of the SPCTF cavity where their electric field components normal
to the interface are either in phase or out of phase. Those SPPs which experience little
attenuation exhibit greater propagation lengths and are known as long-range SPPs
(LRSPPs). The short-range SPPs (SRSPPs) can be highly attenuated, thereby producing
more localized effects across shorter distances.
As the thickness of the airgap in the SPCTF varies the maxima in the transmitted
signal move with respect to the minima in the reflected signal for both, the LRSPPs and
the SRSPPs. The shift in the transmitted maxima or reflected minima of the SPCTF are
not independent of each other. But, there exist conditions of the airgaps at which this shift
is the least. For understanding the resonance conditions of the LRSPPs and the SRSPPs it
is important to look at the Poynting vector field (5) and the electric field component in
the direction parallel to the interfaces (Ex) as a function of position within the dielectric
cavity of the SPCTF. The Poynting vector is the energy transfer per unit area per unit
time of an electromagnetic field. Poynting vector has both the direction and magnitude
and it represents directional energy flux, and it is given as S→=E→×H→ , where E→ is the
electric field vector and H is the magnetic field's auxiliary field vector. The electric field
73

E is a vector quantity, and it gives vector field in three-dimension. The electric field E
has components, Ex, Ey, and Ez that defines the electric field in x- , y- and z-direction.
From the calculation by Welford and Sambles186, presented here is an illustration
of the Poynting vector (Figure 21) and the Ex component of the field (Figure 22) in the
dielectric gap for the LRSPPs and the SRSPPs. The horizontal axis in the presentation of
Poynting vector and the Ex component of the field is z-direction, while the vertical axis
represents the x-direction.
Poynting vector illustration of SRSPPs (Figure21B) suggests that it has more
energy in the metal than the dielectric gap where it approaches zero, compare to LRSPPs
(Figure 20A). Due to damping in the metal, energy loss in the SRSPPs coupling mode is
greater than that of LRSPPs, hence the transmission maxima are smaller for SRSPPs than
that of LRSPPs.
Illustration of the Ex component of the electric field for the LRSPPs (Figure 22A)
showing node in the airgap because of the electron oscillations in phase with each other
at both the metal-air interfaces resulting in greater coupling of energy across the gap,
resulting in higher transmittance compare to SRSPPs (Figure 22B).
74
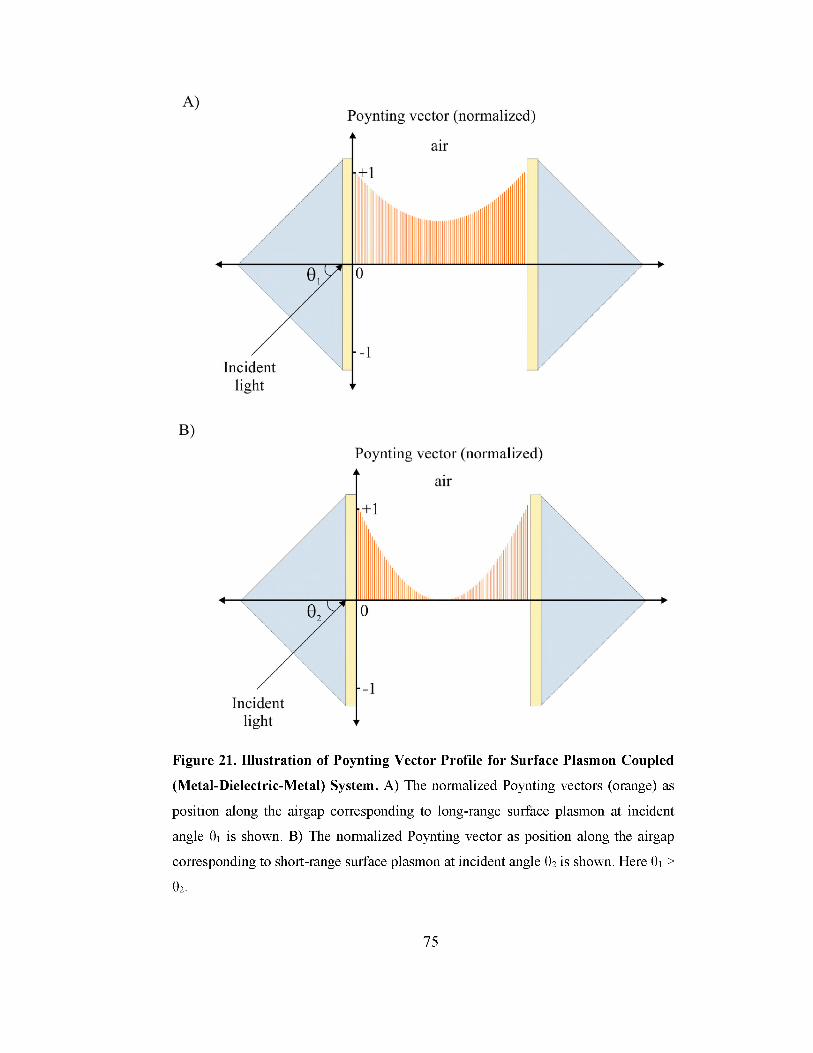
Figure 21. Illustration of Poynting Vector Profile for Surface Plasmon Coupled
(Metal-Dielectric-Metal) System. A) The normalized Poynting vectors (orange) as
position along the airgap corresponding to long-range surface plasmon at incident
angle θ1 is shown. B) The normalized Poynting vector as position along the airgap
corresponding to short-range surface plasmon at incident angle θ2 is shown. Here θ1 >
θ2.
75

Figure 22: Illustration of the Normalized Ex Component of the Electric Field as
the Time Average Envelop Along the Airgap. A) Electric field profile (red) for
long-range surface plasmon at θ1 is shown B) Electric field profile (red) for short-
range surface plasmon at θ2 is shown. Here θ1 > θ2 and prism size not to scale.
76

For a large range of airgap thickness the LRSPPs may be excited and the
corresponding wave vector increases progressively as the airgap is reduced. For a fairly
small (<270 nm) airgap only the LRSPPs exist. At a greater airgap SRSPPs may be
excited at low angles of incident. Increasing the airgap further (~586 nm) causes the
LRSPP and the SRSPP resonance to move closer to the θsp for a single interface in the
Kretschmann-Raether configuration. Progressively increasing the airgap thickness causes
the LRSPPs and the SRSPPs to converge. For a small change in the airgap thickness, the
SRSPP wave vector changes by more than the LRSPP wave vector, hence the resonance
angle moves more for the SRSPPs.186 If the prism hypotenuses are not parallel or wedged
instead, the SRSPPs will be the most affected, resulting in the more severe broadening of
the SPCTF transmittance.
77

4.2.5 Selecting LRSPPs Coupling Mode with Monochromatic Light
The distances over which SPPs propagate are dependent on the amount of
attenuation. Free electron scattering in the metal and surface roughness at the interfaces
are important causes of SPP attenuation that can adversely affect the performance of
plasmonic devices. While low attenuation leads to the sought-after LRSPPs, plasmonic
devices often have imperfections that lead to the formation of both SRSPPs and LRSPPs.
Because the SPCTF cavity is tunable, the LRSPPs can be preferentially selected over the
SRSPPs by choosing the largest gap distance capable of generating SPPs at the desired
wavelength. If the hypotenuses of the two prisms were not parallel if instead, they are
wedged, wavelength broadening of the plasmon coupling occurs.
Using monochromatic light, the transmitted light corresponding to the LRSPP and
the SRSPP modes can be observed. Figure 23 shows the SPCTF passband intensity for
650 nm laser light when the SPCTF is rotated over a ±6° range of incident angles. The
transmittance as a function of wavelength and incident angle is represented as top-down
view of the surface plot where red corresponds to higher transmittance value and blue
color correspond to lower (near zero). The data was collected using the apparatus shown
in Figure 16 with slight modification to accommodate range of incident angles. For a
smaller airgap, two transmitted components that correspond to the SRSPPs and the
LRSPPs can be seen. Increasing the airgap by small increments (Figure 23) leads to a
converging of the SRSPPs and LRSPPs.
78

Figure 23: The Dependence of SRSPPs and LRSPPs on Airgap Distance in the
SPCTF. A) Laser at 650 nm couples over a range of incident angles in the SPCTF.
Two overlapping bands are observable and represent resonant coupling of both
SRSPPs and LRSPPs. B) and C) as the airgap increases the LRSPPs and SRSPPs are
converging D) At a greater airgap, only LRSPPs are able to couple with the incident
light.
79

In Figure 24, the transmission band for 650nm is extracted from the data
presented in Figure 23 and two separate bands are observable, a less intense band for
SRSPPs at ~4.2° and a more intense, yet narrower, LRSPPs band at 0°. By increasing the
airgap at very small increments, the SRSPP band converges towards the LRSPP band.
Because SRSPPs are more localized, the influence of their fields more rapidly diminishes
with distance than the LRSPPs. Increasing the SPCTF gap distance even further lessens
the resonance ability of SRSPP in the cavity and provides a way to distinguish the
LRSPPs from the SRSPPs.
80
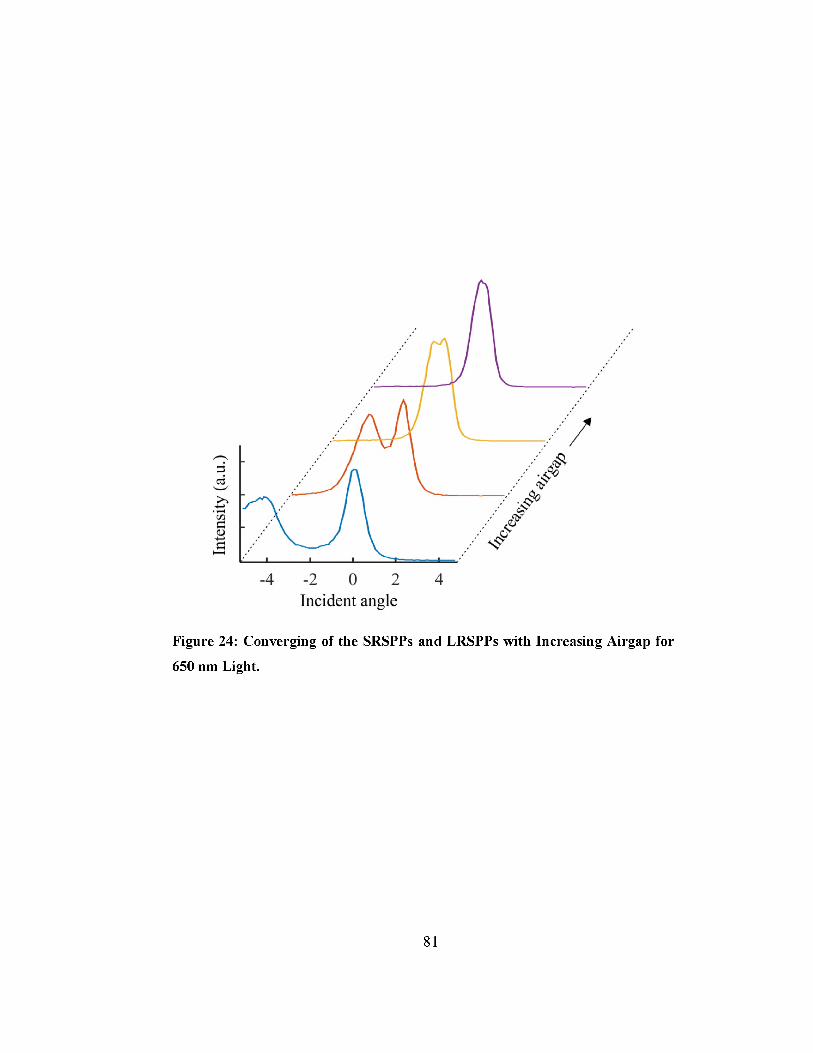
Figure 24: Converging of the SRSPPs and LRSPPs with Increasing Airgap for
650 nm Light.
81

CHAPTER 5
EFFECT OF DISPERSION ON SURFACE PLASMON COUPLING
AND SPCTF BANDPASS
The calculated and measured reflectance for the metal-dielectric interface in the
Kretschmann-Raether configuration are presented in chapter 3. The findings in chapter 3
demonstrated the angular sensitivity of the surface plasmon coupling. In this chapter the
reflectance at the metal-dielectric interface for the Kretschmann-Raether configuration is
measured using angularly dispersed incident light as function of incident angle and
wavelength. Also presented is the bandpass of the SPCTF with angularly dispersed light.
By exploiting the angular sensitivity of the surface plasmon coupling, the effective
bandpass of the SPCTF is reduced.
82

5.1 Experimental and Methodology
5.1.1 Apparatus for the Measurement of the Reflectance of Angularly DispersedLight as a Function of Incident Angle and of Wavelength
Because the formation of SPPs is very sensitive to the angle of incident light, the
use of angularly dispersed light can significantly reduce the spectral bandwidth of light
that can couple to SPPs. There are a number of applications that would benefit from the
use of thin transmissive dispersers in combination with plasmonic devices to provide
narrow passband tuning. To test the efficacy of this approach, the reflectance of angularly
dispersed light from the prism hypotenuse is measured using a modified version of the
apparatus described in Figure 10. In the first of two modifications, a transmission grating
(Thorlabs, GT25-06V) was placed in the optical path immediately before the prism. The
angular change in the optic path caused by the diffraction grating necessitated the second
modification, a repositioning of the dual stage and fiber collection optics as shown in
Figure 25.
83

Figure 25: Schematic Diagram of the Optical Setup for Reflectance
Measurements Using Angularly Dispersed Light. The apparatus described in
section 3.1.2 is modified by placing a 600 grooves/mm transmission grating before the
prism to achieve angular spread in the incident light. A right-angle prism with 48nm
thick Ag coating on its hypotenuse is placed in the path of the strongest diffraction
order of the grating. Since the reflected light is angularly dispersed, it is necessary to
measure the reflected light at all angles in the dispersed beam. This was accomplished
by recording the spectrum for incremental position of the rotating stage that was
affixed to the collection optics.
84

The data collection procedure previously described in section 3.1.2, was modified
so that now for each position of the prism (each incident angle) with respect to the
incoming light from the grating, spectra at 70 neighboring positions were collected. A
total of 14000 spectra, each covering the wavelength range between 500 nm and 850 nm,
were recorded of the reflected angularly dispersed light over a 20o range of incident
angles Because the light is collected over a range of reflected angles for each orientation
of the prism, and because each reflected angle corresponds to a different wavelength,
most of which are not generating SPPs, it is not necessary to take a separate spectrum of
the illumination in order to calculate the transmittance.
Because the incident angles in the dispersed beam are above the critical angle, the
set of maxima extracted from each spectrum acquired for one prism orientation, after
subtracting the background spectrum, is an envelop function that matches the
illumination spectrum except in the vicinity of the surface plasmon-coupled wavelengths.
The neighboring sets of envelop functions, acquired for other prism orientations that
exhibit a wavelength shift in the SPP coupling, can be used to establish an intensity
surface as a function of wavelength and prism orientation angle. Surface contours that
neighbor the plasmon intensity dip in the surface can be used to make accurate estimates
of the illumination intensity in the plasmon dip regions. This self-referenced approach
avoids many of the experimental errors and alignment challenges related to removing the
prism so that a properly scaled illumination spectrum can be acquired.
85

5.1.2 Characterization of the SPCTF Coupled to a Dispersive Element.
The bandpass and acceptance angle of the SPCTF was determined for angularly
dispersed light using the apparatus shown in Figure 26. A reflective grating (Thorlabs,
600 grooves/mm) was placed in the optical path to provide angular dispersion. Although
not shown, the grating was mounted on a rotational mount (Thorlabs, PR01) to enable
wavelength tuning along the optical path of the SPCTF. Spectra of the transmitted light
were acquired over a range of SPCTF angles for each of several gap distances using a
rotational stage (Cognisys, ROTO_TAB_01). The collection fiber remained fixed in
position.
86

Figure 26: Apparatus for Measuring the Bandpass and Angle of Acceptance of the SPCTF Coupled to a Dispersive Element.
87

5.2 Result and Discussion
5.2.1 Reflectance of Dispersed Light from the Glass-Metal Interface
The apparatus used for collecting the angularly dispersed light is described in
section 5.1.1 and Figure 25. As described previously, neighboring sets of spectra were
collected for a range of incident angles on the prism hypotenuse. Here it is important to
note that each wavelength will have a different angle of incident onto the prism
hypotenuse, because the light is angularly dispersed by the grating. Hence angle used to
generate the plots of reflectance for angularly dispersed light relies on the incident angle
of the center wavelength of the range of interest with respect to the prism hypotenuse.
For each position of the prism, a set of 70 spectra were collected in the vicinity of
the angle of reflectance by scanning the collection fiber, this was done to collect as much
of the angularly dispersed light as possible. The process was repeated over the range of
incident angles. The background corrected intensities of one set of spectra obtained for
one incident angle is shown in Figure 27. In Figure 27A, the intensity plotted as a
function of collection angle and wavelength. The collection angle is reported with respect
to the center angle, an estimate of the reflected angle based on the incident angle. In
Figure 27B, the intensities as a function of wavelength are shown to accentuate the
overall envelop shape of the entire set of spectra. At the incident angles where the surface
plasmons couple, there will be a corresponding dip in the reflectance spectra of that set,
but the dip would be spread across multiple acquisition angles as shown in Figure 28 and
29.
88

Figure 27: Preprocessing Reflected Intensity Acquired as a Function of Collection Angle for Angularly Dispersed Light. Background corrected set of 70
neighboring spectra for one position of the prism is shown in A) where the spectra are
plotted in 3-dimensional space and in the B) same data plotted in 2-dimesion to
accentuate the overall envelop profile of the reflected light.
89

Figure 28: Data with Peak Centers Marked for Extraction of the Envelop
Function of the Angularly Dispersed Reflected Light. Shown in the figure is a set
of 70 spectra for one incident angle onto the prism hypotenuse. The process was
repeated for total of 200 sets corresponding to range of incident angles.
90

Figure 29: Extracted Envelop Functions from the Data. Only four sets are shown
here.
91

For the calculation of the reflectance, it is important to extract the envelop
function from each set of 70 spectra. An algorithm, written for MATLAB, was created to
accomplish this task. The algorithm operated on each set of 70 spectra that were acquired
for a given illumination angle on the prism. For each individual spectrum, the peak
position was identified using a correlation calculation with respect to a predetermined
peak shape. The plot of peak intensity vs. wavelength was extracted and fit using a cubic
spline. The envelop function of the set of 70 spectra is given by the spline result. Because
the peaks in the region of a surface plasmon dip, do not have the characteristic peak
shape, the algorithm exploited the periodicity of the peaks in the wavelength dimension
to estimate the peak center wavelength for the peaks in the region of the dip. The
intensities at these positions were used to calculate the envelop function at these
wavelengths (Figure 28).
The plots in Figure 29 show the extracted envelop functions for sets of spectra
acquired at different incident angles onto the prism hypotenuse. For the calculation of
reflectance, the envelop data were then processed for calculating the initial light intensity
via self-referencing. In the self-referencing method, the intensities at the region away
from the dip is used to estimate the illumination envelop. The measured reflectance is
plotted as surface in Figure 30. The redder regions exhibit higher reflectance values than
bluer regions.
92

Figure 30: Reflectance Data as a Function of Wavelength and Incident Angle for
Angularly Dispersed Illumination. The incident angle onto prism face were
measured for center wavelength (~700 nm) and from that incident angle on to
hypotenuse were calculated.
93

The top-down view of the surface from Figure 30 is shown in Figure 31A. A
comparison of the image in Figure 31A to the one shown in Figure 14B reveals that the
use of a dispersive element in the optical path of the prism reduces the wavelength
bandwidth over which photon-polariton coupling can occur. The measured bandwidth
using dispersed light is plotted in Figure 31D. This data demonstrates that angular
dispersion in conjunction with plasmonic excitation can be used to create a narrowband
optical filter. A description of the potential impact of this illumination approach is given
in section 5.2.2 for the SPCTF.
94
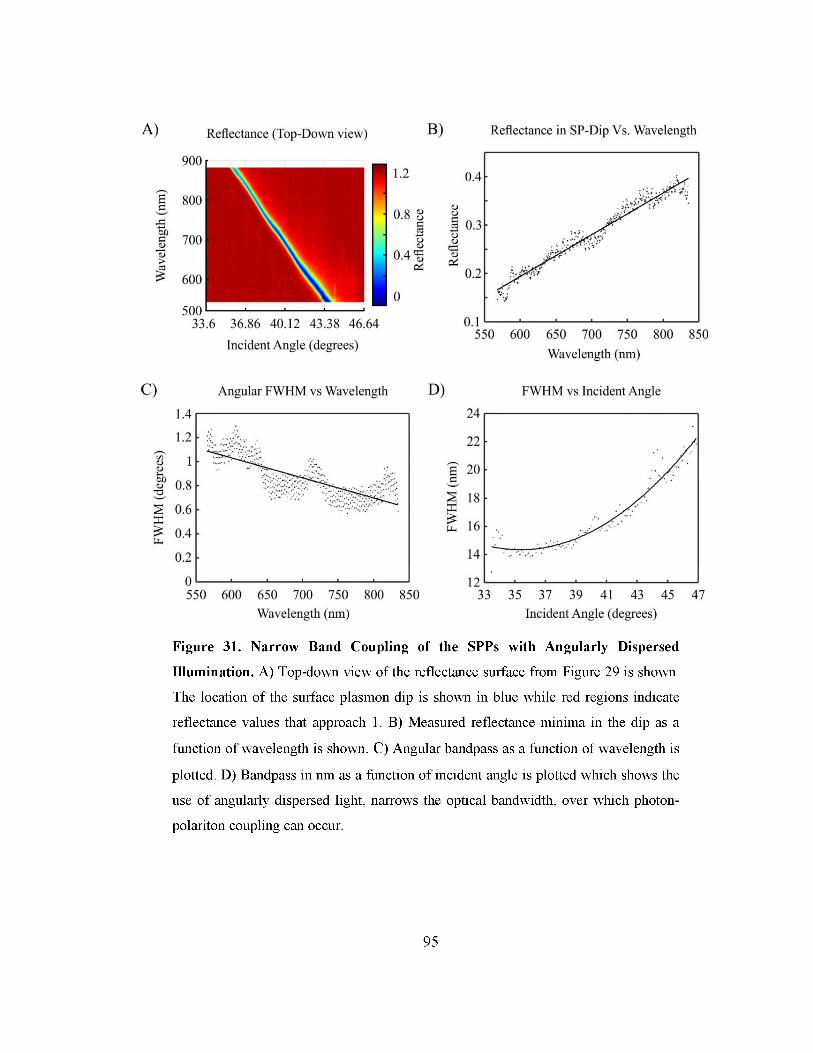
Figure 31. Narrow Band Coupling of the SPPs with Angularly Dispersed
Illumination. A) Top-down view of the reflectance surface from Figure 29 is shown.
The location of the surface plasmon dip is shown in blue while red regions indicate
reflectance values that approach 1. B) Measured reflectance minima in the dip as a
function of wavelength is shown. C) Angular bandpass as a function of wavelength is
plotted. D) Bandpass in nm as a function of incident angle is plotted which shows the
use of angularly dispersed light, narrows the optical bandwidth, over which photon-
polariton coupling can occur.
95
5.2.2 SPCTF Acceptance Angle and Bandpass with Angularly Dispersed Light.
To assess its potential as a tunable widefield image filter, the SPCTF passband
was studied as a function of wavelength and illumination angle using broadband
angularly dispersed light (Figure 32). The SPCTF was tuned to three different
wavelengths that correspond to laser light at 532 nm, 650 nm and 785 nm. The airgap
was set to a suitably wide position so as to ensure one coupling mode, LRSPP coupling,
as described in section 4.2.5. Bandpass of the SPCTF using dispersed white light was
measured while tuned at 532 nm, 650 nm and 785 nm light. The nominal bandpass
(FWHM) was measured to be 7.23 nm within the range of operations (550 nm to 850 nm)
and the bandpass plots are shown in Figure 32 with their respective FWHM. Bandpass
was reduced by factor of about 10, compared to the bandpass with collimated light,
described in section 4.2.1.
The use of the SPCTF as a widefield filter for imaging applications requires a
sufficiently large acceptance angle to permit image reformation. Plots for the acceptance
angle measured for 532 nm, 650 nm and 785 nm are shown in Figure 33. The acceptance
angle describes the steradian field of view over which the SPCTF functions. While
apertures can be used to select those components of the Fourier space that are better
collimated, doing so greatly diminishes the light intensity and reduces the signal-to-noise
level. The Numerical Aperture (NA) is a measure of how much light can be collected by
an optical component such as an optical filter, optical fiber or a microscope objective. By
measuring the acceptance angle of the SPCTF we can calculate its NA. The. NA is given
by NA = n sinθ, where θ is half of the acceptance angle and n is the refractive index.
96
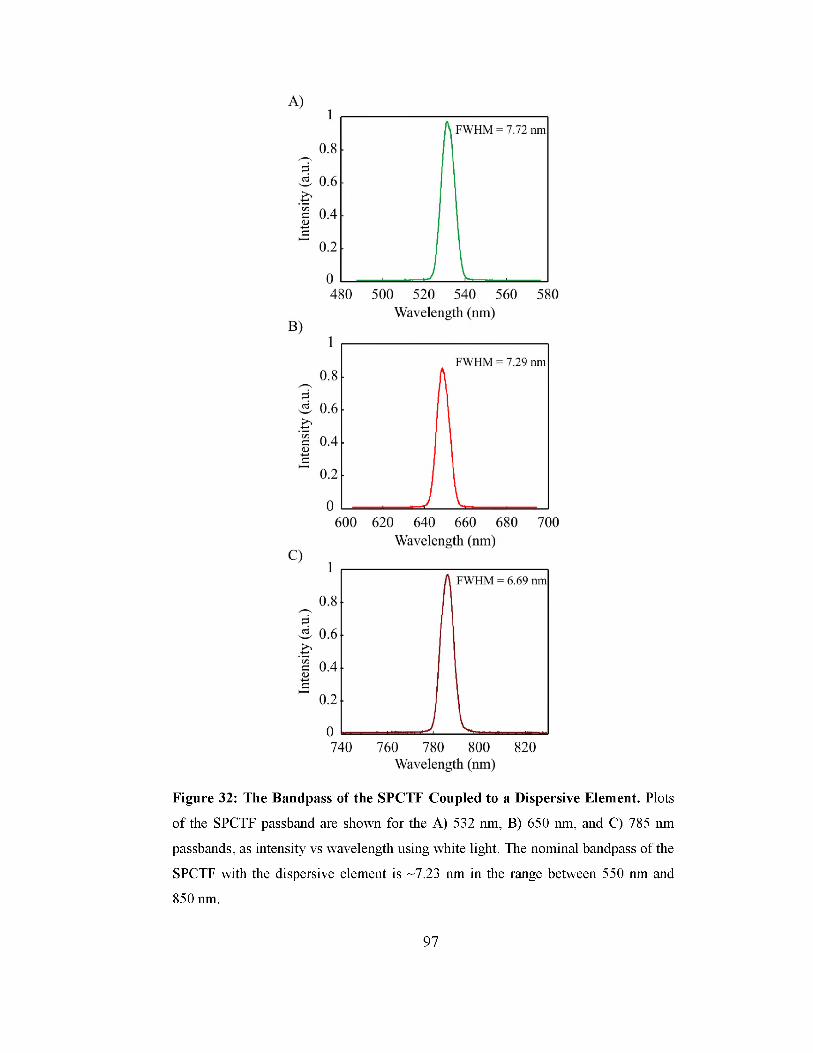
Figure 32: The Bandpass of the SPCTF Coupled to a Dispersive Element. Plots
of the SPCTF passband are shown for the A) 532 nm, B) 650 nm, and C) 785 nm
passbands, as intensity vs wavelength using white light. The nominal bandpass of the
SPCTF with the dispersive element is ~7.23 nm in the range between 550 nm and
850 nm.
97
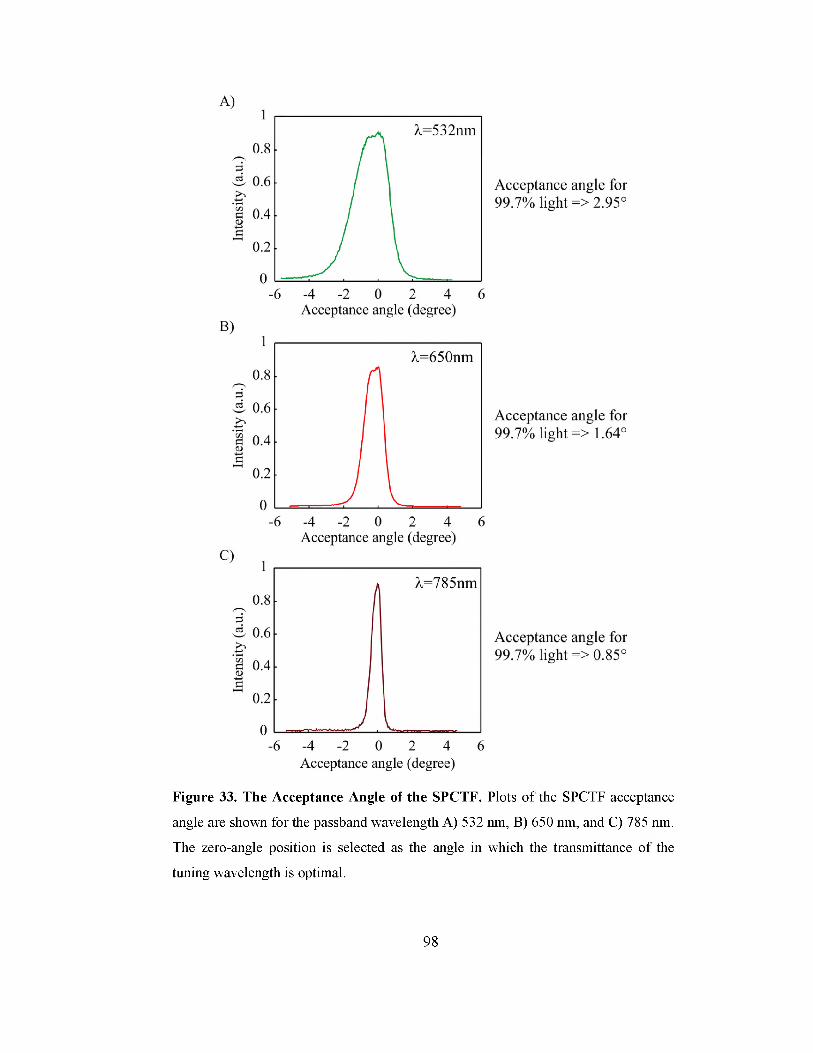
Figure 33. The Acceptance Angle of the SPCTF. Plots of the SPCTF acceptance
angle are shown for the passband wavelength A) 532 nm, B) 650 nm, and C) 785 nm.
The zero-angle position is selected as the angle in which the transmittance of the
tuning wavelength is optimal.
98

The use of the SPCTF in widefield imaging applications requires the use of lenses
before and after the SPCTF, which places the SPCTF in the Fourier space. The nominal
Fourier space NA observed for SPCTF in the presence of angularly dispersed light was
0.04o,0.02o, and 0.01° for tuning wavelength 532 nm, 650 nm and 785 nm respectively.
While the use of a grating in the optical path before a widefield tunable filter seems
questionable and counterintuitive, the SPCTF is designed to be miniaturized into a
monolithic element so that it can be directly integrated with detector arrays as described
in section 6.2 and Figure 35.
99

CHAPTER 6
CONCLUSION AND RECOMMENDATIONS FOR FUTURE WORK
6.1 Conclusion
A new type of tunable wavelength filter, based on surface plasmon coupling in a
resonant cavity, has been introduced. The SPCTF filter is constructed from two
Kretschmann-Raether metal-coated prisms. Empirical reflectance data from the glass-
metal interface of the individual prism-element showed qualitative agreement with
theoretical estimates. While very sensitive to the illumination angle (<2o), surface
plasmon generation occurs over a broad range of wavelengths and produced a nominal
bandpass of ~70 nm for a metal film thickness of 48 nm at wavelengths between 550 nm
and 850 nm. To exploit the angular sensitivity as a way of reducing the SPCTF
bandwidth, the prism-element reflectance was measured using angularly dispersed light.
100

Nominal bandwidths below 10 nm were achieved within the spectral region between 550
nm and 850 nm. Without any narrowing of the passband, the two-prism SPCTF also
produced a bandpass of ~70 nm over the spectral range from 550 nm to 850 nm and
exhibited a nominal percent transmittance of ~32%. Diffraction limited spatial resolution
of the SPCTF has been demonstrates using 1951 USAF resolution target. In addition,
Proof-of-concept spectral imaging was demonstrated using the SPCTF and the spectral
identity map of the spectral image data confirmed wavelength dependent variability
related to the qualitative compositional differences in the model sample. The use of
dispersive element coupled to the SPCTF resulted in a 10-fold narrowing of the bandpass
to ~7 nm (FWHM). The acceptance angle under these conditions was ~1.5o.
101

6.2 Recommendations for the Future Work
If the airgap in the SPCTF is replaced with low-index electro-optic material as
shown in Figure 34, its refractive index can be controlled under the influence of an
applied electric field. By changing the refractive index of the dielectric, the transmitted
SPCTF wavelength can be altered. Hence a fixed angle input beam can be made to excite
a specific SPP mode by varying the applied voltage.
Integrating the SPCTF with a highly dispersive tunable etalon (Figure 35A)
enable compact, narrowband filtering of an optical signal. In addition, each pixel of an
array detector could be integrated with its own hybrid SPCTF element (Figure 35B).
Hence the SPCTF can be used to exploit the wavelength filtering superiority of
(transmissive) dispersive gratings without having to rely on intensive computational
methods for wavelength deconvolution in the image scene. In this case, the SPCTF
effectively suppresses unwanted wavelength from the dispersed output of the etalon from
being detected.
102

Figure 34: An Electro Optically Tuned SPCTF. Applying the electric field across the
electro-optic material enables tuning of the SPCTF under electric control.
103

Figure 35: A Conceptual Design of a Monolithic Element. A) SPCTF when combined with
interference filter can be miniaturized in to an integrated monolithic element. B) Monolithic
SPCTF embedded on to each pixel of the imaging detector chip, it can be a 2-dimensional or a
3-dimensional array of pixels such as in the CCD or CMOS detector.
104

REFERENCES
1. Abuleil, M.; Abdulhalim, I., Narrowband multispectral liquid crystal tunable
filter. Optics Letters 2016, 41 (9), 1957-1960.
2. Zheng, J.; Wang, K.; Gao, H.; Lu, F.; Sun, L.; Zhuang, S. In Multi-wavelength
sensitive holographic polymer dispersed liquid crystal grating applied within
image splitter for autostereoscopic display, SPIE Optical Engineering+
Applications, International Society for Optics and Photonics: 2016; pp 995818
995818-9.
3. Patel, J. S.; Saifi, M. A.; Berreman, D. W.; Lin, C.; Andreadakis, N.; Lee, S. D.,
Electrically tunable optical filter for infrared wavelength using liquid crystals in a
Fabry-Perot etalon. Appllied Physics Letters 1990, 57 (17), 1718-1720.
4. Schaeberle, M. D.; Morris, H. R.; II, J. F. T.; Treado, P. J., Peer reviewed: Raman
chemical imaging spectroscopy. Analytical Chemistry 1999, 71 (5), 175A-181A.
5. Morris, H. R.; Turner, J. F.; Munro, B.; Ryntz, R. A.; Treado, P. J., Chemical
imaging of thermoplastic olefin (TPO) surface architecture. Langmuir 1999, 15
(8), 2961-2972.
6. Turner II, J. F.; Treado, P. J. In LCTF Raman chemical imaging in the near
infrared, AeroSense'97, 1997; pp 280-283.
7. Marinelli, W. J.; Gittins, C. M.; Gelb, A. H.; Green, B. D., Tunable Fabry-Perot
etalon-based long-wavelength infrared imaging spectroradiometer. Applied Optics
1999, 38 (12), 2594-2604.
8. Pappas, D.; Matveev, O. I.; Smith, B. W.; Shepard, M. R.; Podshivalov, A. A.;
Winefordner, J. D., Sealed-cell mercury resonance ionization imaging detector.
Applied Optics 2000, 39 (27), 4911-4917.
105
9. Temirov, J.; Chigarev, N.; Matveev, O.; Omenetto, N.; Smith, B.; Winefordner,
J., A resonance ionization imaging detector based on cesium atomic vapor.
Spectrochimica Acta Part B: Atomic Spectroscopy 2004, 59 (5), 677-687.
10. Daly, J. T.; Bodkin, A.; Schneller, W. J.; Kerr, R. B.; Noto, J.; Haren, R.;
Eismann, M. T.; Karch, B. K. In Tunable narrow-band filter for LWIR
hyperspectral imaging, Proceedings of SPIE, 2000; pp 104-115.
11. Hufziger, K. T.; Bykov, S. V.; Asher, S. A., Raman Hyperspectral Imaging
Spectrometer Utilizing Crystalline Colloidal Array Photonic Crystal Diffraction.
Applied Spectroscopy 2014, 68 (11), 1219-1223.
12. Hufziger, K. T.; Bykov, S. V.; Asher, S. A., Ultraviolet Raman Wide-Field
Hyperspectral Imaging Spectrometer for Standoff Trace Explosive Detection.
Applied Spectroscopy 2017, 71 (2), 173-185.
13. Goetz, A. F. H., Three decades of hyperspectral remote sensing of the Earth: A
personal view. Remote Sensing of Environment 2009, 113, S5-S16.
14. Ergin, L. N.; Bobba, V. N. R.; Turner, J. F. In Unassisted reduction and
segmentation of large hyperspectral image datasets, Optics and Photonics for
Information Processing XI, International Society for Optics and Photonics: 2017;
p 103950M.
15. Calin, M. A.; Parasca, S. V.; Savastru, D.; Manea, D., Hyperspectral imaging in
the medical field: present and future. Applied Spectroscopy Reviews 2014, 49 (6),
435-447.
16. Kester, R. T.; Gao, L.; Bedard, N.; Tkaczyk, T. S. In Real-time hyperspectral
endoscope for early cancer diagnostics, Advanced Biomedical and Clinical
Diagnostic Systems Viii, International Society for Optics and Photonics: 2010; p
75550A.
106

17. Sahu, A.; McGoverin, C.; Pleshko, N.; Sorenmo, K.; Won, C.-H. In
Hyperspectral imaging system to discern malignant and benign canine mammary
tumors, Smart Biomedical and Physiological Sensor Technology X, International
Society for Optics and Photonics: 2013; p 87190W.
18. Li, Q.; He, X.; Wang, Y.; Liu, H.; Xu, D.; Guo, F., Review of spectral imaging
technology in biomedical engineering: achievements and challenges. Journal of
Biomedical Optics 2013, 18 (10), 100901.
19. Dhawan, A. P.; D'Alessandro, B.; Fu, X., Optical imaging modalities for
biomedical applications. IEEE Reviews in Biomedical Engineering 2010, 3, 69
92.
20. Gowen, A.; O'donnell, C.; Cullen, P. J.; Bell, S., Recent applications of chemical
imaging to pharmaceutical process monitoring and quality control. European
Journal of Pharmaceutics and Biopharmaceutics 2008, 69 (1), 10-22.
21. Gowen, A.; O'Donnell, C.; Cullen, P.; Downey, G.; Frias, J., Hyperspectral
imaging-an emerging process analytical tool for food quality and safety control.
Trends in Food Science & Technology 2007, 18 (12), 590-598.
22. Gendrin, C.; Roggo, Y.; Collet, C., Pharmaceutical applications of vibrational
chemical imaging and chemometrics: a review. Journal of Pharmaceutical and
Biomedical Analysis 2008, 48 (3), 533-553.
23. Lelong, C. C.; Pinet, P. C.; Poilvé, H., Hyperspectral imaging and stress mapping
in agriculture: a case study on wheat in Beauce (France). Remote Sensing of
Environment 1998, 66 (2), 179-191.
24. Thenkabail, P. S.; Smith, R. B.; De Pauw, E., Hyperspectral vegetation indices
and their relationships with agricultural crop characteristics. Remote Sensing of
Environment 2000, 71 (2), 158-182.
107

25. Inoue, Y.; Penuelas, J., An AOTF-based hyperspectral imaging system for field
use in ecophysiological and agricultural applications. International Journal of
Remote Sensing 2001, 22 (18), 3883-3888.
26. Dale, L. M.; Thewis, A.; Boudry, C.; Rotar, I.; Dardenne, P.; Baeten, V.; Pierna,
J. A. F., Hyperspectral imaging applications in agriculture and agro-food product
quality and safety control: a review. Applied Spectroscopy Reviews 2013, 48 (2),
142-159.
27. Xie, Y.; Sha, Z.; Yu, M., Remote sensing imagery in vegetation mapping: a
review. Journal of Plant Ecology 2008, 1 (1), 9-23.
28. Eismann, M. T. In Hyperspectral remote sensing, SPIE Bellingham: 2012.
29. Treitz, P. M.; Howarth, P. J., Hyperspectral remote sensing for estimating
biophysical parameters of forest ecosystems. Progress in Physical Geography
1999, 23 (3), 359-390.
30. Heiden, U.; Segl, K.; Roessner, S.; Kaufmann, H., Determination of robust
spectral features for identification of urban surface materials in hyperspectral
remote sensing data. Remote Sensing of Environment 2007, 111 (4), 537-552.
31. Cucci, C.; Delaney, J. K.; Picollo, M., Reflectance hyperspectral imaging for
investigation of works of art: old master paintings and illuminated manuscripts.
Accounts of Chemical Research 2016, 49 (10), 2070-2079.
32. Kubik, M., Hyperspectral imaging: a new technique for the non-invasive study of
artworks. In Physical Techniques in the Study of Art, Archaeology and Cultural
Heritage, Elsevier: 2007; Vol. 2, pp 199-259.
33. Padoan, R.; Steemers, T. A.; Klein, M.; Aalderink, B.; De Bruin, G., Quantitative
hyperspectral imaging of historical documents: technique and applications. Art
Proceedings 2008, 25-30.
108

34. Cavalli, R. M.; Colosi, F.; Palombo, A.; Pignatti, S.; Poscolieri, M., Remote
hyperspectral imagery as a support to archaeological prospection. Journal of
Cultural Heritage 2007, 8 (3), 272-283.
35. Liang, H., Advances in multispectral and hyperspectral imaging for archaeology
and art conservation. Applied Physics A 2012, 106 (2), 309-323.
36. Lau, D.; Villis, C.; Furman, S.; Livett, M., Multispectral and hyperspectral image
analysis of elemental and micro-Raman maps of cross-sections from a 16th
century painting. Analytica Chimica Acta 2008, 610 (1), 15-24.
37. Liang, H.; Lange, R.; Howard, H.; Spooner, J. In Non-invasive investigations of a
wall painting using optical coherence tomography and hyperspectral imaging,
O3A: Optics for Arts, Architecture, and Archaeology III, International Society for
Optics and Photonics: 2011; p 80840F.
38. Cucci, C.; Casini, A.; Picollo, M.; Stefani, L. In Extending hyperspectral imaging
from Vis to NIR spectral regions: a novel scanner for the in-depth analysis of
polychrome surfaces, Optics for Arts, Architecture, and Archaeology IV,
International Society for Optics and Photonics: 2013; p 879009.
39. Reed, G.; Savage, K.; Edwards, D.; Daeid, N. N., Hyperspectral imaging of gel
pen inks: An emerging tool in document analysis. Science and Justice 2014, 54
(1), 71-80.
40. Flynn, K.; O'Leary, R.; Lennard, C.; Roux, C.; Reedy, B. J., Forensic applications
of infrared chemical imaging: multi-layered paint chips. Journal of Forensic
Science 2005, 50 (4), JFS2004502-10.
41. de la Ossa, M. Á. F.; Amigo, J. M.; García-Ruiz, C., Detection of residues from
explosive manipulation by near infrared hyperspectral imaging: A promising
forensic tool. Forensic Science International 2014, 242, 228-235.
109

42. Silva, C. S.; Pimentel, M. F.; Honorato, R. S.; Pasquini, C.; Prats-Montalbán, J.
M.; Ferrer, A., Near infrared hyperspectral imaging for forensic analysis of
document forgery. Analyst 2014, 139 (20), 5176-5184.
43. Edelman, G.; Gaston, E.; Van Leeuwen, T.; Cullen, P.; Aalders, M.,
Hyperspectral imaging for non-contact analysis of forensic traces. Forensic
Science International 2012, 223 (1-3), 28-39.
44. Edelman, G.; van Leeuwen, T. G.; Aalders, M. C., Hyperspectral imaging for the
age estimation of blood stains at the crime scene. Forensic Science International
2012, 223 (1-3), 72-77.
45. Feng, Y.-Z.; Sun, D.-W., Application of hyperspectral imaging in food safety
inspection and control: a review. Critical Reviews in Food Science and Nutrition
2012, 52 (11), 1039-1058.
46. ElMasry, G.; Wang, N.; ElSayed, A.; Ngadi, M., Hyperspectral imaging for
nondestructive determination of some quality attributes for strawberry. Journal of
Food Engineering 2007, 81 (1), 98-107.
47. ElMasry, G.; Sun, D.-W.; Allen, P., Near-infrared hyperspectral imaging for
predicting colour, pH and tenderness of fresh beef. Journal of Food Engineering
2012, 110 (1), 127-140.
48. Qin, J.; Chao, K.; Kim, M., Raman chemical imaging system for food safety and
quality inspection. Transactions of the ASABE 2010, 53 (6), 1873-1882.
49. Qin, J.; Chao, K.; Kim, M. S.; Lu, R.; Burks, T. F., Hyperspectral and
multispectral imaging for evaluating food safety and quality. Journal of Food
Engineering 2013, 118 (2), 157-171.
50. Qiao, J.; Ngadi, M. O.; Wang, N.; Gariépy, C.; Prasher, S. O., Pork quality and
marbling level assessment using a hyperspectral imaging system. Journal of Food
Engineering 2007, 83 (1), 10-16.110

51. Kim, M. S.; Chen, Y.; Mehl, P., Hyperspectral reflectance and fluorescence
imaging system for food quality and safety. Transactions of the ASAE 2001, 44
(3), 721.
52. Mehl, P. M.; Chen, Y.-R.; Kim, M. S.; Chan, D. E., Development of hyperspectral
imaging technique for the detection of apple surface defects and contaminations.
Journal of Food Engineering 2004, 61 (1), 67-81.
53. Rajkumar, P.; Wang, N.; EImasry, G.; Raghavan, G.; Gariepy, Y., Studies on
banana fruit quality and maturity stages using hyperspectral imaging. Journal of
Food Engineering 2012, 108 (1), 194-200.
54. Wang, W.; Paliwal, J., Near-infrared spectroscopy and imaging in food quality
and safety. Sensing and Instrumentation for Food Quality and Safety 2007, 1 (4),
193-207.
55. Wu, D.; Sun, D.-W., Advanced applications of hyperspectral imaging technology
for food quality and safety analysis and assessment: A review—Part I:
Fundamentals. Innovative Food Science & Emerging Technologies 2013, 19, 1
14.
56. Wu, D.; Sun, D.-W., Advanced applications of hyperspectral imaging technology
for food quality and safety analysis and assessment: A review—Part II:
Applications. Innovative Food Science & Emerging Technologies 2013, 19, 15
28.
57. Strycker, P. D.; Chanover, N.; Voelz, D.; SimonMiller, A., Hyperspectral Imaging
of Jupiter and Saturn. Planetary Atmospheres 2007, 1, 120-121.
58. Strycker, P. D.; Chanover, N.; Voelz, D.; SimonMiller, A., Jovian Ammonia
Cloud Identification and Color Analyses from Hyperspectral Imaging. 2007.
111

59. Yushkov, K.; Anikin, S.; Chizhikov, S.; Esipov, V.; Kolesnikov, A.; Makarov, O.
Y.; Molchanov, V. Y.; Potanin, S.; Tatarnikov, A., Recent advances in acousto
optic instrumentation for astronomy. Acta Phys. Pol. A 2015, 127, 81-83.
60. Li, C.; Ingersoll, A.; Janssen, M.; Levin, S.; Bolton, S.; Adumitroaie, V.; Allison,
M.; Arballo, J.; Bellotti, A.; Brown, S., The distribution of ammonia on Jupiter
from a preliminary inversion of Juno Microwave Radiometer data. Geophysical
Research Letters 2017.
61. Montmessin, F.; Gondet, B.; Bibring, J. P.; Langevin, Y.; Drossart, P.; Forget, F.;
Fouchet, T., Hyperspectral imaging of convective CO2 ice clouds in the
equatorial mesosphere of Mars. Journal of Geophysical Research: Planets 2007, 112 (E11).
62. Bell, J.; Wolff, M.; Noll, K.; Lubenow, A.; Noe-Dobrea, E.; Hubbard, M.; Morris,
R.; Videen, G.; Shkuratov, Y. In Hubble space telescope imaging and
spectroscopy of Mars during the extremely close approach of 2003, AGU Fall
Meeting Abstracts, 2003.
63. Scholl, J. F.; Hege, E. K.; Hart, M.; O'Connell, D.; Dereniak, E. L. In Flash
hyperspectral imaging of non-stellar astronomical objects, Mathematics of
Data/Image Pattern Recognition, Compression, and Encryption with Applications
XI, International Society for Optics and Photonics: 2008; p 70750H.
64. Slawson, R. W.; Ninkov, Z.; Horch, E. P., Hyperspectral Imaging: Wide-Area
Spectrophotometry Using a Liquid-Crystal Tunable Filter. Publications of the
Astronomical Society of the Pacific 1999, 111 (759), 621.
65. Rafert, B.; Sellar, R. G.; Holbert, E.; Blatt, J. H.; Tyler, D. W.; Durham, S. E.;
Newby, H. D. In Hyperspectral imaging Fourier transform spectrometers for
astronomical and remote sensing observations, Instrumentation in Astronomy
VIII, International Society for Optics and Photonics: 1994; pp 338-350.
112

66. Hege, E. K.; O'Connell, D.; Johnson, W.; Basty, S.; Dereniak, E. L. In
Hyperspectral imaging for astronomy and space surviellance, Imaging
Spectrometry IX, International Society for Optics and Photonics: 2004; pp 380
392.
67. Gares, K. L.; Hufziger, K. T.; Bykov, S. V.; Asher, S. A., Review of explosive
detection methodologies and the emergence of standoff deep UV resonance
Raman. Journal of Raman Spectroscopy 2016, 47 (1), 124-141.
68. Chamberland, M.; Farley, V.; Giroux, J.; Villemaire, A.; Legault, J.-F.;
Schwantes, K. R. In Development and testing of a hyperspectral imaging
instrument for standoff chemical detection, Chemical and Biological Standoff
Detection II, International Society for Optics and Photonics: 2004; pp 135-144.
69. Wentworth, R. M.; Neiss, J.; Nelson, M. P.; Treado, P. J. In Standoff Raman
hyperspectral imaging detection of explosives, Antennas and Propagation Society
International Symposium, 2007 IEEE, IEEE: 2007; pp 4925-4928.
70. Blake, T. A.; Kelly, J. F.; Gallagher, N. B.; Gassman, P. L.; Johnson, T. J.,
Passive standoff detection of RDX residues on metal surfaces via infrared
hyperspectral imaging. Analytical and Bioanalytical Chemistry 2009, 395 (2),
337-348.
71. Bernacki, B. E.; Phillips, M. C. In Standoff hyperspectral imaging of explosives
residues using broadly tunable external cavity quantum cascade laser
illumination, Chemical, Biological, Radiological, Nuclear, and Explosives
(CBRNE) Sensing XI, International Society for Optics and Photonics: 2010; p
76650I.
72. Weatherbee, O.; Janaskie, J.; Hyvarinen, T. In Advanced hyperspectral imaging
solutions for near real-time target detection, Electro-Optical Remote Sensing,
Photonic Technologies, and Applications VI, International Society for Optics and
Photonics: 2012; p 854223.113

73. Rousset-Rouviere, L.; Coudrain, C.; Fabre, S.; Poutier, L.; L0ke, T.; Fridman, A.;
Blaaberg, S.; Baarstad, I.; Skauli, T.; Mocoeur, I. In SYSIPHE system: a state of
the art airborne hyperspectral imaging system: initial results from the first
airborne campaign, Electro-Optical and Infrared Systems: Technology and
Applications XI, International Society for Optics and Photonics: 2014; p 92490V.
74. Renhorn, I.; Axelsson, M.; Benoist, K.; Bourghys, D.; Boucher, Y.; Briottet, X.;
De Ceglie, S.; Dekker, R.; Dimmeler, A.; Dost, R. In Detection in urban scenario
using combined airborne imaging sensors, Infrared Technology and Applications
XXXVIII, International Society for Optics and Photonics: 2012; p 83530I.
75. Dupont, A., Intelligence for the twenty-first century. Intelligence and National
Security 2003, 18 (4), 15-39.
76. Briottet, X.; Boucher, Y.; Dimmeler, A.; Malaplate, A.; Cini, A.; Diani, M.;
Bekman, H.; Schwering, P.; Skauli, T.; Kasen, I. In Military applications of
hyperspectral imagery, Targets and Backgrounds XII: Characterization and
Representation, International Society for Optics and Photonics: 2006; p 62390B.
77. Puckrin, E.; Turcotte, C. S.; Gagnon, M.-A.; Bastedo, J.; Farley, V.;
Chamberland, M. In Airborne infrared hyperspectral imager for intelligence,
surveillance, and reconnaissance applications, Airborne Intelligence,
Surveillance, Reconnaissance (ISR) Systems and Applications IX, International
Society for Optics and Photonics: 2012; p 836004.
78. Thompson, D. R.; Boardman, J. W.; Eastwood, M. L.; Green, R. O., A large
airborne survey of Earth's visible-infrared spectral dimensionality. Optics Express
2017, 25 (8), 9186-9195.
79. Green, R. O.; Eastwood, M. L.; Sarture, C. M.; Chrien, T. G.; Aronsson, M.;
Chippendale, B. J.; Faust, J. A.; Pavri, B. E.; Chovit, C. J.; Solis, M., Imaging
spectroscopy and the airborne visible/infrared imaging spectrometer (AVIRIS).
Remote Sensing of Environment 1998, 65 (3), 227-248.114

80. Fuentes, D. A.; Gamon, J. A.; Cheng, Y.; Claudio, H. C.; Qiu, H.-l.; Mao, Z.;
Sims, D. A.; Rahman, A. F.; Oechel, W.; Luo, H., Mapping carbon and water
vapor fluxes in a chaparral ecosystem using vegetation indices derived from
AVIRIS. Remote Sensing of Environment 2006, 103 (3), 312-323.
81. Riaño, D.; Chuvieco, E.; Ustin, S.; Zomer, R.; Dennison, P.; Roberts, D.; Salas, J.,
Assessment of vegetation regeneration after fire through multitemporal analysis
of AVIRIS images in the Santa Monica Mountains. Remote Sensing of
Environment 2002, 79 (1), 60-71.
82. Dar Roberts, M. G.; Regelbrugge, J.; Pedreros, D.; Ustin, S. In Mapping the
distribution of wildfire fuels using AVIRIS in the Santa Monica Mountains,
Summaries of the Seventh JPL Airborne Earth Science Workshop. Washington,
DC: NASA, 1998; pp 345-352.
83. King, T. V.; Clark, R. N.; Ager, C.; Swayze, G. A., Remote mineral mapping
using AVIRIS data at Summitville, Colorado and the adjacent San Juan
Mountains. 1995.
84. Kruse, F. Mineral mapping for environmental hazards assessment using AVIRIS
data, Leadville, Colorado, USA; Environmental Research Institute of Michigan
(ERIM), Ann Arbor, MI (United States): 1996.
85. Swayze, G.; Clark, R. N.; Kruse, F.; Sutley, S.; Gallagher, A., Ground-truthing
AVIRIS mineral mapping at Cuprite, Nevada. 1992.
86. Fingas, M.; Brown, C., Review of oil spill remote sensing. Marine Pollution
Bulletin 2014, 83 (1), 9-23.
87. Leifer, I.; Lehr, W. J.; Simecek-Beatty, D.; Bradley, E.; Clark, R.; Dennison, P.;
Hu, Y.; Matheson, S.; Jones, C. E.; Holt, B., State of the art satellite and airborne
marine oil spill remote sensing: Application to the BP Deepwater Horizon oil
spill. Remote Sensing of Environment 2012, 124, 185-209.
115

88. McNutt, M. K.; Camilli, R.; Crone, T. J.; Guthrie, G. D.; Hsieh, P. A.; Ryerson,
T. B.; Savas, O.; Shaffer, F., Review of flow rate estimates of the Deepwater
Horizon oil spill. Proceedings of the National Academy of Sciences 2012, 109
(50), 20260-20267.
89. Xiao, Q.; Ustin, S.; McPherson, E., Using AVIRIS data and multiple-masking
techniques to map urban forest tree species. International Journal of Remote
Sensing 2004, 25 (24), 5637-5654.
90. Smith, M.-L.; Martin, M. E.; Plourde, L.; Ollinger, S. V., Analysis of
hyperspectral data for estimation of temperate forest canopy nitrogen
concentration: comparison between an airborne (AVIRIS) and a spaceborne
(Hyperion) sensor. IEEE Transactions on Geoscience and Remote Sensing 2003, 41 (6), 1332-1337.
91. Townsend, P. A.; Foster, J. R.; Chastain, R. A.; Currie, W. S., Application of
imaging spectroscopy to mapping canopy nitrogen in the forests of the central
Appalachian Mountains using Hyperion and AVIRIS. IEEE Transactions on
Geoscience and Remote Sensing 2003, 41 (6), 1347-1354.
92. Beeri, O.; Phillips, R.; Hendrickson, J.; Frank, A. B.; Kronberg, S., Estimating
forage quantity and quality using aerial hyperspectral imagery for northern mixed-
grass prairie. Remote Sensing of Environment 2007, 110 (2), 216-225.
93. Asner, G. P.; Borghi, C. E.; Ojeda, R. A., Desertification in central Argentina:
changes in ecosystem carbon and nitrogen from imaging spectroscopy. Ecological
Applications 2003, 13 (3), 629-648.
94. Martin, M. E.; Aber, J. D., High spectral resolution remote sensing of forest
canopy lignin, nitrogen, and ecosystem processes. Ecological Applications 1997,
7 (2), 431-443.
116

95. Martin, M.; Newman, S.; Aber, J.; Congalton, R., Determining forest species
composition using high spectral resolution remote sensing data. Remote Sensing
of Environment 1998, 65 (3), 249-254.
96. Clark, M. L.; Roberts, D. A.; Ewel, J. J.; Clark, D. B., Estimation of tropical rain
forest aboveground biomass with small-footprint lidar and hyperspectral sensors.
Remote Sensing of Environment 2011, 115 (11), 2931-2942.
97. Broge, N. H.; Leblanc, E., Comparing prediction power and stability of
broadband and hyperspectral vegetation indices for estimation of green leaf area
index and canopy chlorophyll density. Remote Sensing of Environment 2001, 76
(2), 156-172.
98. Xavier, A. C.; Rudorff, B. F. T.; Moreira, M. A.; Alvarenga, B. S.; Freitas, J. G.
d.; Salomon, M. V., Hyperspectral field reflectance measurements to estimate
wheat grain yield and plant height. Scientia Agricola 2006, 63 (2), 130-138.
99. Shanahan, J. F.; Schepers, J. S.; Francis, D. D.; Varvel, G. E.; Wilhelm, W. W.;
Tringe, J. M.; Schlemmer, M. R.; Major, D. J., Use of remote-sensing imagery to
estimate corn grain yield. Agronomy Journal 2001, 93 (3), 583-589.
100. Haboudane, D.; Tremblay, N.; Miller, J. R.; Vigneault, P., Remote estimation of
crop chlorophyll content using spectral indices derived from hyperspectral data.
IEEE Transactions on Geoscience and Remote Sensing 2008, 46 (2), 423-437.
101. Galvao, L. S.; Formaggio, A. R.; Couto, E. G.; Roberts, D. A., Relationships
between the mineralogical and chemical composition of tropical soils and
topography from hyperspectral remote sensing data. ISPRS Journal of
Photogrammetry and Remote Sensing 2008, 63 (2), 259-271.
102. Goel, P. K.; Prasher, S. O.; Landry, J. A.; Patel, R. M.; Viau, A. A.; Miller, J. R.,
Estimation of crop biophysical parameters through airborne and field
hyperspectral remote sensing. Transactions of the ASAE 2003, 46 (4), 1235.
117

103. Yuen, P. W.; Richardson, M., An introduction to hyperspectral imaging and its
application for security, surveillance and target acquisition. The Imaging Science
Journal 2010, 58 (5), 241-253.
104. Hagen, N.; Kester, R. T.; Morlier, C. G.; Panek, J. A.; Drayton, P.; Fashimpaur,
D.; Stone, P.; Adams, E. In Video-rate spectral imaging of gas leaks in the
longwave infrared, Chemical, Biological, Radiological, Nuclear, and Explosives
(CBRNE) Sensing XIV, International Society for Optics and Photonics: 2013; p
871005.
105. Samson, E.; Blanca, C.; Saloma, C., Near-IR Spectral Imaging of Semiconductor
Absorption Sites in Integrated Circuits. Science Diliman 2007, 16 (2),101-105.
106. Porat, R.; Dotan, K.; Hemar, S.; Levin, L.; Li, K.; Sung, G.; Lin, C.-T.; Lin, S.-
K.; Wang, H.-I. In SEM-based methodology for root cause analysis of wafer edge
and bevel defects, Advanced Semiconductor Manufacturing Conference, 2008.
ASMC 2008. IEEE/SEMI, IEEE: 2008; pp 11-14.
107. Hattori, T., Detection and identification of particles on silicon surfaces. Particles
on Surfaces, Detection, Adhesion, and Removal, Edited by KL Mittal, Marcel
Dekker, Inc., New York 1995, 201.
108. Laskin, A.; Cowin, J. P., Automated single-particle SEM/EDX analysis of
submicrometer particles down to 0.1 μm. Analytical Chemistry 2001, 73 (5),
1023-1029.
109. Takada, N.; Kamata, T., Spectral imaging for electroluminescence
characterization of a polymer-blend light-emitting diode. Japanese Journal of
Applied Physics 2005, 44 (12R), 8670.
110. Bobba, V. N. K. R. High Fidelity Raman Chemical Imaging of Materials.
Cleveland State University, 2016.
118

111. Kruse, F., Identification and mapping of minerals in drill core using hyperspectral
image analysis of infrared reflectance spectra. International Journal of Remote
Sensing 1996, 17 (9), 1623-1632.
112. Moghaddam, T. M.; Razavi, S. M.; Taghizadeh, M., Applications of hyperspectral
imaging in grains and nuts quality and safety assessment: a review. Journal of
Food Measurement and Characterization 2013, 7 (3), 129-140.
113. Monteiro, S. T.; Minekawa, Y.; Kosugi, Y.; Akazawa, T.; Oda, K., Prediction of
sweetness and amino acid content in soybean crops from hyperspectral imagery.
ISPRS Journal of Photogrammetry and Remote Sensing 2007, 62 (1), 2-12.
114. Gowen, A. A.; Taghizadeh, M.; O'Donnell, C. P., Identification of mushrooms
subjected to freeze damage using hyperspectral imaging. Journal of Food
Engineering 2009, 93 (1), 7-12.
115. Iqbal, S. M.; Gopal, A. In Automated quality inspection of citrus fruits-a review.,
Proceedings of the 2014 ICAM International Conference on Advanced and Agile
Manufacturing. Held at Oakland University, Rochester, MI, 2014; pp 1-17.
116. Pu, Y.-Y.; Feng, Y.-Z.; Sun, D.-W., Recent progress of hyperspectral imaging on
quality and safety inspection of fruits and vegetables: a review. Comprehensive
Reviews in Food Science and Food Safety 2015, 14 (2), 176-188.
117. Kamruzzaman, M.; ElMasry, G.; Sun, D.-W.; Allen, P., Application of NIR
hyperspectral imaging for discrimination of lamb muscles. Journal of Food
Engineering 2011, 104 (3), 332-340.
118. Kamruzzaman, M.; ElMasry, G.; Sun, D.-W.; Allen, P., Non-destructive
prediction and visualization of chemical composition in lamb meat using NIR
hyperspectral imaging and multivariate regression. Innovative Food Science &
Emerging Technologies 2012, 16, 218-226.
119

119. Kamruzzaman, M.; ElMasry, G.; Sun, D.-W.; Allen, P., Non-destructive
assessment of instrumental and sensory tenderness of lamb meat using NIR
hyperspectral imaging. Food Chemistry 2013, 141 (1), 389-396.
120. Menesatti, P.; Costa, C.; Aguzzi, J., Quality evaluation of fish by hyperspectral
imaging. In Hyperspectral Imaging for Food Quality Analysis and Control,
Elsevier: 2010; pp 273-294.
121. Cheng, J.-H.; Sun, D.-W., Rapid and non-invasive detection of fish microbial
spoilage by visible and near infrared hyperspectral imaging and multivariate
analysis. LWT-Food Science and Technology 2015, 62 (2), 1060-1068.
122. Zhu, F.; Zhang, D.; He, Y.; Liu, F.; Sun, D.-W., Application of visible and near
infrared hyperspectral imaging to differentiate between fresh and frozen-thawed
fish fillets. Food and Bioprocess Technology 2013, 6 (10), 2931-2937.
123. Roggo, Y.; Edmond, A.; Chalus, P.; Ulmschneider, M., Infrared hyperspectral
imaging for qualitative analysis of pharmaceutical solid forms. Analytica Chimica
Acta 2005, 535 (1-2), 79-87.
124. Hamilton, S. J.; Lodder, R. A. In Hyperspectral imaging technology for
pharmaceutical analysis, Biomedical Nanotechnology Architectures and
Applications, International Society for Optics and Photonics: 2002; pp 136-148.
125. Malik, I.; Poonacha, M.; Moses, J.; Lodder, R. A., Multispectral imaging of
tablets in blister packaging. AAPS PharmSciTech 2001, 2 (2), 38-44.
126. Gioux, S.; Choi, H. S.; Frangioni, J. V., Image-guided surgery using invisible
near-infrared light: fundamentals of clinical translation. Molecular Imaging 2010, 9 (5), 7290.2010. 00034.
127. Gotoh, K.; Yamada, T.; Ishikawa, O.; Takahashi, H.; Eguchi, H.; Yano, M.;
Ohigashi, H.; Tomita, Y.; Miyamoto, Y.; Imaoka, S., A novel image-guided
120

surgery of hepatocellular carcinoma by indocyanine green fluorescence imaging
navigation. Journal of Surgical Oncology 2009, 100 (1), 75-79.
128. Schaafsma, B. E.; Mieog, J. S. D.; Hutteman, M.; Van der Vorst, J. R.; Kuppen,
P. J.; Lowik, C. W.; Frangioni, J. V.; Van de Velde, C. J.; Vahrmeijer, A. L., The
clinical use of indocyanine green as a near-infrared fluorescent contrast agent for
image-guided oncologic surgery. Journal of Surgical Oncology 2011, 104 (3),
323-332.
129. Keereweer, S.; Van Driel, P. B.; Snoeks, T. J.; Kerrebijn, J. D.; de Jong, R. J. B.;
Vahrmeijer, A. L.; Sterenborg, H. J.; Lowik, C. W., Optical image-guided cancer
surgery: challenges and limitations. Clinical Cancer Research 2013, 19 (14),
3745-3754.
130. Boppart, S. A.; Luo, W.; Marks, D. L.; Singletary, K. W., Optical coherence
tomography: feasibility for basic research and image-guided surgery of breast
cancer. Breast Cancer Research and Treatment 2004, 84 (2), 85-97.
131. Vahrmeijer, A. L.; Hutteman, M.; Van Der Vorst, J. R.; Van De Velde, C. J.;
Frangioni, J. V., Image-guided cancer surgery using near-infrared fluorescence.
Nature Reviews Clinical Oncology 2013, 10 (9), 507.
132. Lu, G.; Fei, B., Medical hyperspectral imaging: a review. Journal of Biomedical
Optics 2014, 19 (1), 010901-010901.
133. Johnson, W. R.; Wilson, D. W.; Fink, W.; Humayun, M. S.; Bearman, G. H.,
Snapshot hyperspectral imaging in ophthalmology. Journal of Biomedical Optics
2007, 12 (1), 014036.
134. Srinivasan, S.; Pogue, B. W.; Jiang, S.; Dehghani, H.; Kogel, C.; Soho, S.;
Gibson, J. J.; Tosteson, T. D.; Poplack, S. P.; Paulsen, K. D., Interpreting
hemoglobin and water concentration, oxygen saturation, and scattering measured
121

in vivo by near-infrared breast tomography. Proceedings of the National Academy
of Sciences 2003, 100 (21), 12349-12354.
135. Cancio, L. C.; Batchinsky, A. I.; Mansfield, J. R.; Panasyuk, S.; Hetz, K.; Martini,
D.; Jordan, B. S.; Tracey, B.; Freeman, J. E., Hyperspectral imaging: a new
approach to the diagnosis of hemorrhagic shock. Journal of Trauma and Acute
Care Surgery 2006, 60 (5), 1087-1095.
136. Chin, J. A.; Wang, E. C.; Kibbe, M. R., Evaluation of hyperspectral technology
for assessing the presence and severity of peripheral artery disease. Journal of
Vascular Surgery 2011, 54 (6), 1679-1688.
137. Usenik, P.; Bürmen, M.; Fidler, A.; Pernus, F.; Likar, B. In Evaluation of cross-
polarized near infrared hyperspectral imaging for early detection of dental
caries, Lasers in Dentistry XVIII, International Society for Optics and Photonics:
2012; p 82080G.
138. Blanco, F.; López-Mesas, M.; Valiente, M.; Serranti, S.; Bonifazi, G.; Havel, J.,
Hyperspectral imaging based method for fast characterization of kidney stone
types. Journal of Biomedical Optics 2012, 17 (7), 076027.
139. Martin, R.; Thies, B.; Gerstner, A. O., Hyperspectral hybrid method classification
for detecting altered mucosa of the human larynx. International Journal of Health
Geographics 2012, 11 (1), 21.
140. Akbari, H.; Kosugi, Y.; Kojima, K.; Tanaka, N. In Hyperspectral imaging and
diagnosis of intestinal ischemia, Engineering in Medicine and Biology Society,
2008. EMBS 2008. 30th Annual International Conference of the IEEE, IEEE:
2008; pp 1238-1241.
141. Akbari, H.; Kosugi, Y.; Kojima, K.; Tanaka, N. In Blood vessel detection and
artery-vein differentiation using hyperspectral imaging, Engineering in Medicine
122

and Biology Society, 2009. EMBC 2009. Annual International Conference of the
IEEE, IEEE: 2009; pp 1461-1464.
142. Best, S. L.; Thapa, A.; Holzer, M. S.; Jackson, N.; Mir, S. A.; Donnally, C. J.;
Wehner, E.; Raj, G. V.; Livingston, E.; Cadeddu, J. A. In Assessment of renal
oxygenation during partial nephrectomy using DLP hyperspectral imaging,
Emerging Digital Micromirror Device Based Systems and Applications III,
International Society for Optics and Photonics: 2011; p 793202.
143. Holzer, M. S.; Best, S. L.; Jackson, N.; Thapa, A.; Raj, G. V.; Cadeddu, J. A.;
Zuzak, K. J., Assessment of renal oxygenation during partial nephrectomy using
hyperspectral imaging. The Journal of Urology 2011, 186 (2), 400-404.
144. Niehorster, T.; Loschberger, A.; Gregor, I.; Kramer, B.; Rahn, H.-J.; Patting, M.;
Koberling, F.; Enderlein, J.; Sauer, M., Multi-target spectrally resolved
fluorescence lifetime imaging microscopy. Nature Methods 2016, 13 (3), 257.
145. Chernenko, T.; Matthaus, C.; Milane, L.; Quintero, L.; Amiji, M.; Diem, M.,
Label-free Raman spectral imaging of intracellular delivery and degradation of
polymeric nanoparticle systems. ACS Nano 2009, 3 (11), 3552-3559.
146. Nallala, J.; Piot, O.; Diebold, M.-D.; Gobinet, C.; Bouché, O.; Manfait, M.;
Sockalingum, G. D., Infrared and Raman imaging for characterizing complex
biological materials: a comparative morpho-spectroscopic study of colon tissue.
Applied Spectroscopy 2014, 68 (1), 57-68.
147. Gao, L.; Kester, R. T.; Hagen, N.; Tkaczyk, T. S., Snapshot image mapping
spectrometer (IMS) with high sampling density for hyperspectral microscopy.
Optics Express 2010, 18 (14), 14330-14344.
148. Golub, M. A.; Nathan, M.; Averbuch, A.; Lavi, E.; Zheludev, V. A.; Schclar, A.,
Spectral multiplexing method for digital snapshot spectral imaging. Applied
Optics 2009, 48 (8), 1520-1526.
123

149. Morampudi, R. Development of A High Resolution Wavelength Filter and A
Spatially Multiplexed Raman Imaging System. Cleveland State University, 2014.
150. Schaeberle, M. D.; John F. Turner, I. I.; Treado, P. J. In Multiplexed acousto-optic
tunable filter (AOTF) spectral imaging microscopy, IS$\&$T/SPIE 1994
International Symposium on Electronic Imaging: Science and Technology,
International Society for Optics and Photonics: 1994; pp 11-20.
151. Schaeberle, M. D.; Morris, H. R.; John F. Turner, I. I.; Treado, P. J., Peer
reviewed: Raman chemical imaging spectroscopy. Analytical Chemistry 1999, 71
(5), 175A-181A.
152. Turner, J. F.; Treado, P. J., Near-infrared acousto-optic tunable filter Hadamard
transform spectroscopy. Applied Spectroscopy 1996, 50 (2), 277-284.
153. Wachman, E. S.; Niu, W.-h.; Farkas, D. L., Imaging acousto-optic tunable filter
with 0.35-micrometer spatial resolution. Applied Optics. 1996, 35 (25), 5220
5226.
154. Wachman, E. S.; Niu, W.; Farkas, D. L., AOTF microscope for imaging with
increased speed and spectral versatility. Biophys.J. 1997, 73 (3), 1215-1222.
155. Gupta, N.; Dahmani, R.; Choy, S. J., Acousto-optic tunable filter-based visible-to-
near-infrared spectroploarimetric imager. Optical Engineering 2002, 41 (5), 1033
1039.
156. Indebetouw, G., Tunable spatial filtering with a Fabry-Perot etalon. Applied
Optics 1980, 19 (5), 761-764.
157. Neumann, N.; Ebermann, M.; Kurth, S.; Hiller, K., Tunable infrared detector with
integrated micromachined Fabry-Perot filter. Journal of Micro/Nanolithography,
MEMS, and MOEMS 2008, 7 (2), 021004.
124

158. Atherton, P.; Reay, N. K.; Ring, J.; Hicks, T., Tunable fabry-perot filters. Optical
Engineering 1981, 20 (6), 206806.
159. Miller, P. J.; Hoyt, C. C. In Multispectral imaging with a liquid crystal tunable
filter, Optics in Agriculture, Forestry, and Biological Processing, International
Society for Optics and Photonics: 1995; pp 354-366.
160. Morris, H. R.; Hoyt, C. C.; Miller, P.; Treado, P. J., Liquid crystal tunable filter
Raman chemical imaging. Applied Spectroscopy 1996, 50 (6), 805-811.
161. Gebhart, S. C.; Thompson, R. C.; Mahadevan-Jansen, A., Liquid-crystal tunable
filter spectral imaging for brain tumor demarcation. Applied Optics 2007, 46 (10),
1896-1910.
162. Hardeberg, J. Y.; Schmitt, F. J.; Brettel, H., Multispectral color image capture
using a liquid crystal tunable filter. Optical Engineering 2002, 41 (10), 2532
2549.
163. Winefordner, J. D.; Matveev, O. I.; Smith, B. W., High resolution resonance
ionization imaging detector and method. Google Patents: 1999.
164. Wilkinson, T. D.; Butt, H.; Montelongo, Y., Holographic Liquid Crystals for
Nanophotonics. In Nanoscience with Liquid Crystals, Springer: 2014; pp 1-34.
165. Schaeberle, M. D.; Turner II, J. F.; Treado, P. J. In Multiplexed acousto-optic
tunable filter (AOTF) spectral imaging microscopy, IS&T SPIE 1994
International Symposium on Electronic Imaging: Science and Technology, 1994;
pp 11-20.
166. Storey, A. P.; Ray, S. J.; Hoffmann, V.; Voronov, M.; Engelhard, C.; Buscher,
W.; Hieftje, G. M., Wavelength Scanning with a Tilting Interference Filter for
Glow-Discharge Elemental Imaging. Applied Spectroscopy 2017, 71 (6), 1280
1288.
125

167. Hashimoto, M.; Kawata, S., Multichannel Fourier-transform infrared
spectrometer. Applied Optics 1992, 31 (28), 6096-6101.
168. Lewis, E. N.; Treado, P. J.; Reeder, R. C.; Story, G. M.; Dowrey, A. E.; Marcott,
C.; Levin, I. W., Fourier transform spectroscopic imaging using an infrared focal-
plane array detector. Analytical Chemistry 1995, 67 (19), 3377-3381.
169. Marx, B.; Czerwinski, L.; Light, R.; Somekh, M.; Gilch, P., Multichannel
detectors for femtosecond stimulated Raman microscopy-ideal and real ones.
Journal of Raman Spectroscopy 2014, 45 (7), 521-527.
170. Fell, A. F.; Clark, B. J.; Scott, H. P., Novel applications of multichannel
spectroscopy in pharmaceutical analysis. Journal of Pharmaceutical and
Biomedical Analysis 1983, 1 (4), 557-572.
171. Deverse, R. A., Multiplexed hyperspectral imaging and spectrometry using spatial
light modulators. 1999.
172. Schlücker, S.; Schaeberle, M. D.; Huffman, S. W.; Levin, I. W., Raman
microspectroscopy: a comparison of point, line, and wide-field imaging
methodologies. Analytical Chemistry 2003, 75 (16), 4312-4318.
173. Sun, B.; Edgar, M. P.; Bowman, R.; Vittert, L. E.; Welsh, S.; Bowman, A.;
Padgett, M. J., 3D computational imaging with single-pixel detectors. Science
(New York, N.Y.) 2013, 340 (6134), 844-847.
174. Otto, A., Excitation of nonradiative surface plasma waves in silver by the method
of frustrated total reflection. Zeitschrift für Physik 1968, 216 (4), 398-410.
175. Raether, H., Surface plasmons on smooth surfaces. Springer: 1988.
176. Kretschmann, E., Determination of optical constants of metals by excitation of
surface plasmons. Zeitschrift Fur Physik 1971, 241 (4), 313.
126

177. Kretschmann, E., Die bestimmung optischer konstanten von metallen durch
anregung von oberflachenplasmaschwingungen. Zeitschrift für Physik 1971, 241
(4), 313-324.
178. Ingle Jr, J. D.; Crouch, S. R., Spectrochemical analysis. 1988.
179. Kretschmann, E.; Raether, H., Notizen: radiative decay of non radiative surface
plasmons excited by light. Zeitschrift für Naturforschung A 1968, 23 (12), 2135
2136.
180. Barchiesi, D.; Otto, A., Excitations of surface plasmon polaritons by attenuated
total reflection, revisited. Riv.Nuovo Cimento 2013, 36, 173-209.
181. Nash, D. J.; Sambles, J. R., Surface plasmon-polariton study of the optical
dielectric function of silver. Journal of Modern Optics 1996, 43 (1), 81-91.
182. Weber, M. J., Handbook of optical materials. CRC press: 2002; Vol. 19.
183. Novotny, L.; Hecht, B., Principles of Nano-Optics. Cambridge university press:
2012.
184. Dever, J. A.; Rutledge, S. K.; Hambourger, P. D.; Bruckner, E.; Ferrante, R.; Pal,
A. M.; Mayer, K.; Pietromica, A. J. In Indium Tin Oxide-Magnesium Fluoride
Co-Deposited Films for Spacecraft Applications, American Vacuum Society:
1998.
185. Ersoy, M.; Hambourger, P. D., Ti-B-N and Ti-B-O Scratch Resistant Weakly
Conductive Transparent Coatings for Aerospace Applications. SVC 51st Annual
Technical Conference Proceedings 2008, 475-475-477.
186. Welford, K. R.; Sambles, J. R., Coupled surface plasmons in a symmetric system.
Journal of Modern Optics 1988, 35 (9), 1467-1483.
127

187. Turner, J. F., 2nd; Zhang, J.; O'Connor, A., A spectral identity mapper for
chemical image analysis. Appllied Spectroscopy. 2004, 58 (11), 1308-1317.
188. Turner, I.; John, F. In Spectral identity mapping for enhanced chemical image
analysis, Proceedings. of SPIE Vol, 2005; p 25.
189. Berini, P., Long-range surface plasmon polaritons. Advances in Optics and
Photonics 2009, 1 (3), 484-588.
190. Sarid, D., Long-range surface-plasma waves on very thin metal films. Physical
Review Letters 1981, 47 (26), 1927.
191. Sarid, D.; Deck, R. T.; Craig, A. E.; Hickernell, R. K.; Jameson, R. S.; Fasano, J.
J., Optical field enhancement by long-range surface-plasma waves. Applied
Optics 1982, 21 (22), 3993-3995.
128

APPENDIX A
In order to model the transmittance as a function of wavelength in the SPCTF, it is
necessary to employ Maxwell's equations of electromagnetism. In particular, the
divergence and curl of the electric field which are given by
and
The SPCTF geometry is similar to the Kretschmann-Raether geometry employed for
surface plasmon resonance spectroscopy (SPR) and is illustrated in Figure. 4. Only the
π-polarized component generates a strong plasmon coupling at Brewster's angles above
the critical angle. Consequently, a polarizer must be placed in the optical path prior to
the SPCTF. It is important to note that the successful conversion between a photon and a
surface plasmon requires a negative permittivity, the absolute value of which is larger
than that of the dielectric. Metals such as gold and silver meet this requirement and have
large negative permittivities. The permittivity of metals have both real and imaginary
parts; the imaginary part is the result of damping. Described below is a fully theoretical
description of surface plasmon condition in a semi-infinite system, explained by
Maxwell's equation and classical electromagnetic theory. For notations, refer to Figure 7.
129

Given:
Vector representation,
From Maxwell's equation, The divergence of , V ∙ E→ = 0 , or
and
substituting Eq. 1-4:
Solving for Ezg :
For the metal EZm can be derived same way:
At this point the relationship between the x and z components of the electric field in the
glass and the metal have been established, where kx is a boundary condition.130

So, solving Eq. 10 for kx :
and solving Eq. 11 for kx :
Therefore,
At the interface Exg = Exm, So:
From the Faraday's law of electromagnetic induction, the curl of E, V × E→ is:
or
where,i, j and k are unit vectors along x, y and z axis respectively.
Hence,
And
Solving for

and
and
From Eq. 10; EZg = -Exg (kx/kz) and
where μg is the permeability of glass;
in a vacuum
and
hence,
From Eq. 25 and 29
Similarly, for the metal:
132

At the boundary between the glass and metal, Hg = Hm or:
or
From Exg = Exm :
But it is known that kg2 = kx2 + kzg2 , where kg2 = εgk02. (35)
likewise, km2 = kx2 + kZm2 ,where km2 = εmk02. (36)
So, Eq. 34 becomes:
2Solving for kx ,
and
133

Yet, such that:
From and solving for ω = ω (kx), the dispersion relation becomes:
At very high frequencies ωτ ≫ 1, where τ is the electron scatter time, the bound
electrons are too slow to respond so εreal ~ 1 and σ = iσo/ώτ , where σo is the Drude
conductivity at ω = 0.
The inertia of mobile electrons makes the conductivity purely imaginary at high
frequencies than ω = 0, but not above plasma frequency ωp. Thus,
where, is the plasma frequency. Here, n is the electron density and m
is the electron mass.
From Eq. 41 and Eq. 42
where here Λx is wavelength of the plasmons.
134

If the E in the z direction (in metal) is
The value of the characteristic length (skin depth) z , at which the field is reduced by a
factor,
At So now find the z value such that
The skin depth (z) becomes
Solving for z ,
substituting km2 = kx2 + kzm2 in Eq. 36 and Eq. 39:
or
where, or (skin depth) and
Hence,
135

APPENDIX B
Attached here is the code written in MATLAB to calculate the reflectance for glass-
metal-air interface in the Kretschmann-Raether configuration using Eq 9 which is as
described in section 2.4. The sp_reflectance function was employed to model the
reflectance as a function of wavelength and incident angle in section 3.2.1.
136
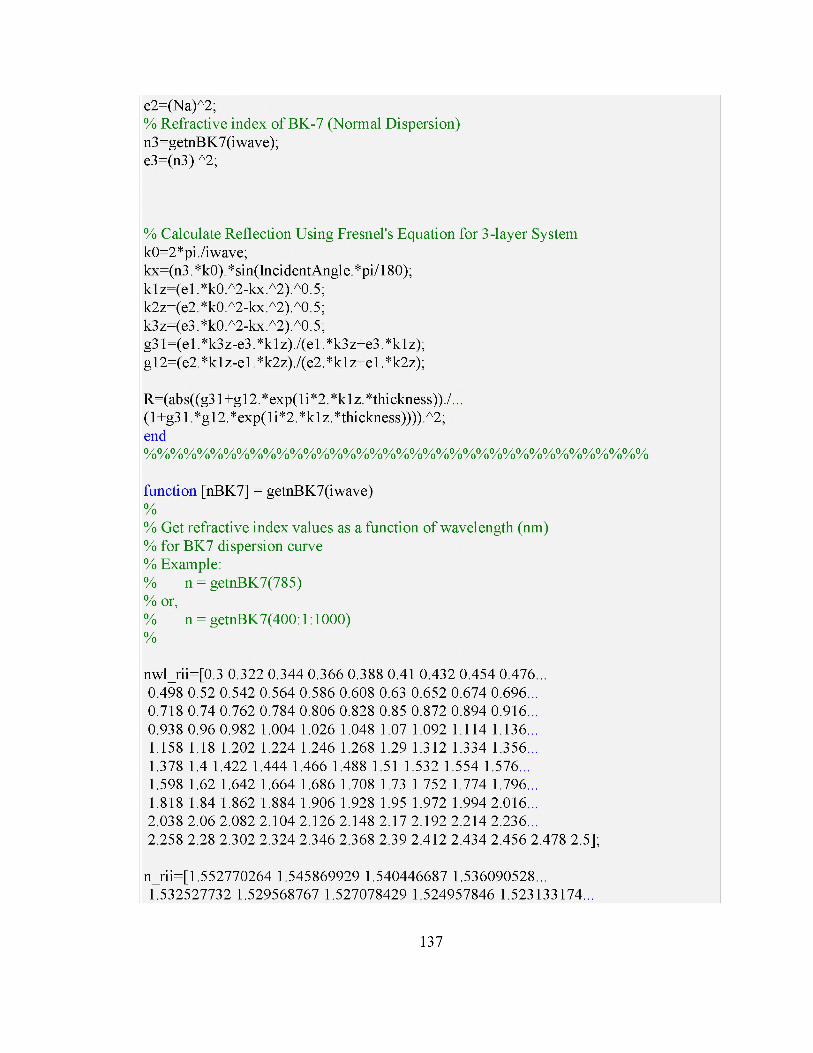
137

138

139


![Graphene-plasmon polaritons: From fundamental … · REVIEW ARTICLE cally tunable [24, 32–34]. These extraordinary features of graphene plasmons have stimulated intense lines of](https://img.dokumen.tips/doc/110x75/5b66c8217f8b9aa02f8d9815/graphene-plasmon-polaritons-from-fundamental-review-article-cally-tunable-24.jpg)