Embed Size (px)
Citation preview
A Bottom-Up Theory ofPublic Opinion about Foreign Policy
Supplementary AppendixMarch 7, 2017
Contents
1 Examples of stimulus materials 2Table 1: Type of Appeal: Experiments 1-2 . . . . . . . . . . . . . . . . . . . . . . . . 3Figure 1: Group endorse cue . . . . . . . . . . . . . . . . . . . . . . . . . . . . . . . 3Figure 2: Group oppose cue . . . . . . . . . . . . . . . . . . . . . . . . . . . . . . . . 4Table 2: Elite partisan cue treatments for Experiment 3 . . . . . . . . . . . . . . . . 4Figure 3: China scenario with cold cognition treatment . . . . . . . . . . . . . . . . . 5Figure 4: Terrorism scenario with hot cognition treatment . . . . . . . . . . . . . . . 6Table 3: Elite cue treatments for Experiments 4-5 . . . . . . . . . . . . . . . . . . . 7
2 Supplementary analyses and robustness checks 82.1 Study 1 (SSI): Experiments # 1-2 . . . . . . . . . . . . . . . . . . . . . . . . . . . . 8
Table 4: Randomization check . . . . . . . . . . . . . . . . . . . . . . . . . . . . . . . 8Table 5: Summary statistics and sample characteristics . . . . . . . . . . . . . . . . . 9Figure 5: Substantive effects of treatments and main dispositional variables . . . . . 10Table 6: Do elite endorsements matter in the absence of group treatments? . . . . . 11Table 7: Results for only those who passed the manipulation check . . . . . . . . . . 12Table 8: No evidence of elite cue x partisanship x group cue interactions . . . . . . . 13Figure 6: No evidence of elite cue x partisanship x group cue interactions . . . . . . 142.1.1 The effects of social cues on certainty and associated beliefs . . . . . . . . . . 15Table 9: Effects on perceptions of certainty, success, and threat . . . . . . . . . . . . 16
2.2 Study 2 (Amazon MTurk): Experiment #3 . . . . . . . . . . . . . . . . . . . . . . . 17Table 10: Randomization check . . . . . . . . . . . . . . . . . . . . . . . . . . . . . . 17Table 11: Summary statistics and sample characteristics . . . . . . . . . . . . . . . . 18Table 12: Results . . . . . . . . . . . . . . . . . . . . . . . . . . . . . . . . . . . . . . 19Figure 7: Effect of elite consensus magnified by social cues . . . . . . . . . . . . . . . 20Table 13: Results for only those who passed the manipulation check . . . . . . . . . 21
2.3 Study 3 (Amazon MTurk): Experiments #4-5 . . . . . . . . . . . . . . . . . . . . . . 22Table 14: Randomization check: China . . . . . . . . . . . . . . . . . . . . . . . . . . 22Table 15: Randomization check: ICSID . . . . . . . . . . . . . . . . . . . . . . . . . 232.3.1 Comparison of group cue treatments . . . . . . . . . . . . . . . . . . . . . . . 23Table 16: Rank-sum tests comparing the two types of group cues . . . . . . . . . . . 25Figure 8: Density distributions of group cues . . . . . . . . . . . . . . . . . . . . . . 26Table 17: Summary statistics and sample characteristics . . . . . . . . . . . . . . . . 27Table 18: Study 3 Results (disaggregated by social cue) . . . . . . . . . . . . . . . . 28Table 19: Study 3 Results . . . . . . . . . . . . . . . . . . . . . . . . . . . . . . . . . 29Table 20: Study 3 Results among those who passed the manipulation check . . . . . 302.3.2 Explaining variation in the efficacy of elite cues . . . . . . . . . . . . . . . . . 31Figure 9: Experiments 4-5 display a higher level of polarization, but not a lower level
of baseline support . . . . . . . . . . . . . . . . . . . . . . . . . . . . . . . . . 322.3.3 Subgroup analysis by trust and vote choice . . . . . . . . . . . . . . . . . . . 33Table 21: Elite cues are three times stronger for Clinton supporters than Trump
supporters . . . . . . . . . . . . . . . . . . . . . . . . . . . . . . . . . . . . . 342.4 Salience of foreign policy during survey periods . . . . . . . . . . . . . . . . . . . . . 35
1
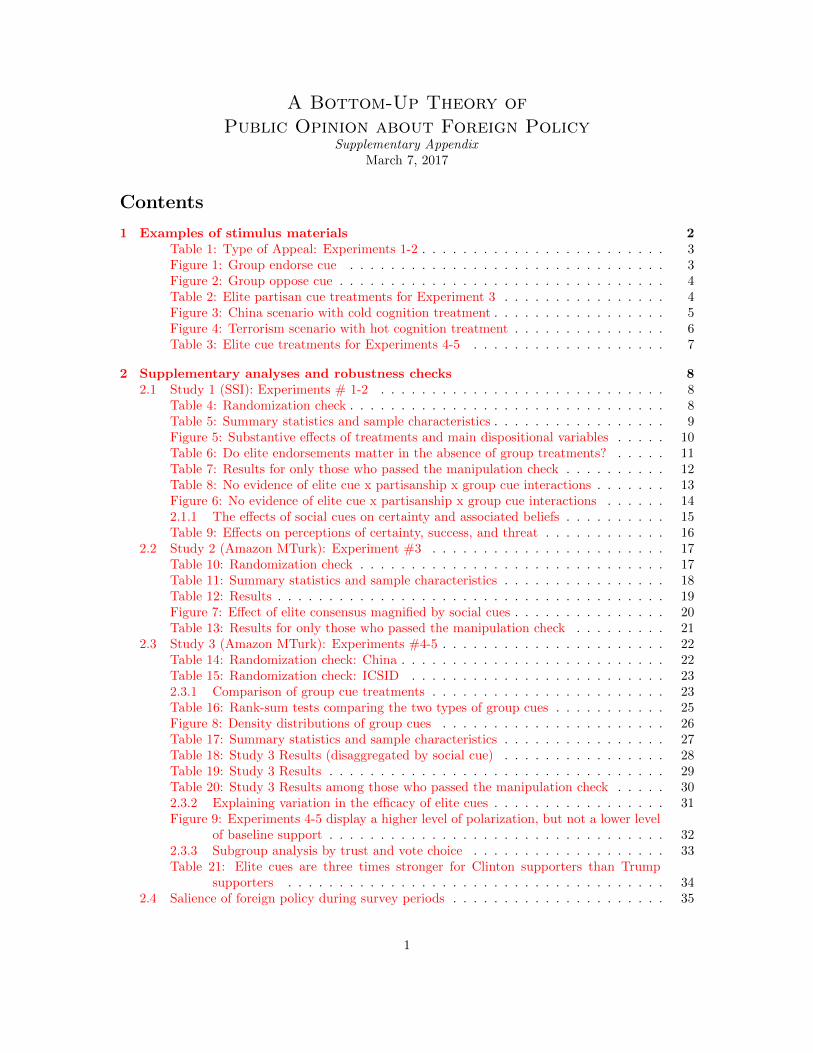
1 Examples of stimulus materials
Type of Appeal
Previous research has found that emotions and emotional appeals can influence political behavior —
including perception of threat (Lerner et al., 2003), ingroup cohesion (Zeitzoff, 2014), rally ‘round the
flag effects (Aday, 2010; Lambert et al., 2010), and voter persuasion (Brader, 2005). Furthermore,
Kahneman (2011) argues that cognition occurs in two modes — an impulsive, “hot” cognition,
and a slower, effortful (“cold”) type of thinking. Since we were interested in how different partisan
endorsements and group cues influence foreign policy opinion, in Experiments 1-2 we also investigate
the possibility that that different appeals — a colder, cognitive message (Cold Cognition Treatment),
and a hotter, affect-laden one (Hot Cognition Treatment) — may change how subjects process the
various endorsements.
In each of the two experiments, subjects were randomly shown a map (Cold Cognition Treat-
ment), or a picture that was found to be threatening (Hot Cognition Treatment).1 The argument
put forth by the Democrat or Republican elite policymaker in our experiment also varied depending
on the treatment. Table 1 shows how these appeals varied by appeal type (Cold Cognition or Hot
Cognition) and scenario (China or Terrorism).
1A pre-test on 100 American adults recruited using Amazon Mechanical Turk was used to select threatening andmore neutral stimuli. Pre-test results confirmed the images used in the Hot Cognition treatment significantly increasedfearful and threatening perceptions compared to the Cold Cognition treatment. This is similar to the manipulationused in Gadarian (2014). For a helpful guide to developing emotional manipulations in political science experiments,see Albertson and Gadarian (2016).
2
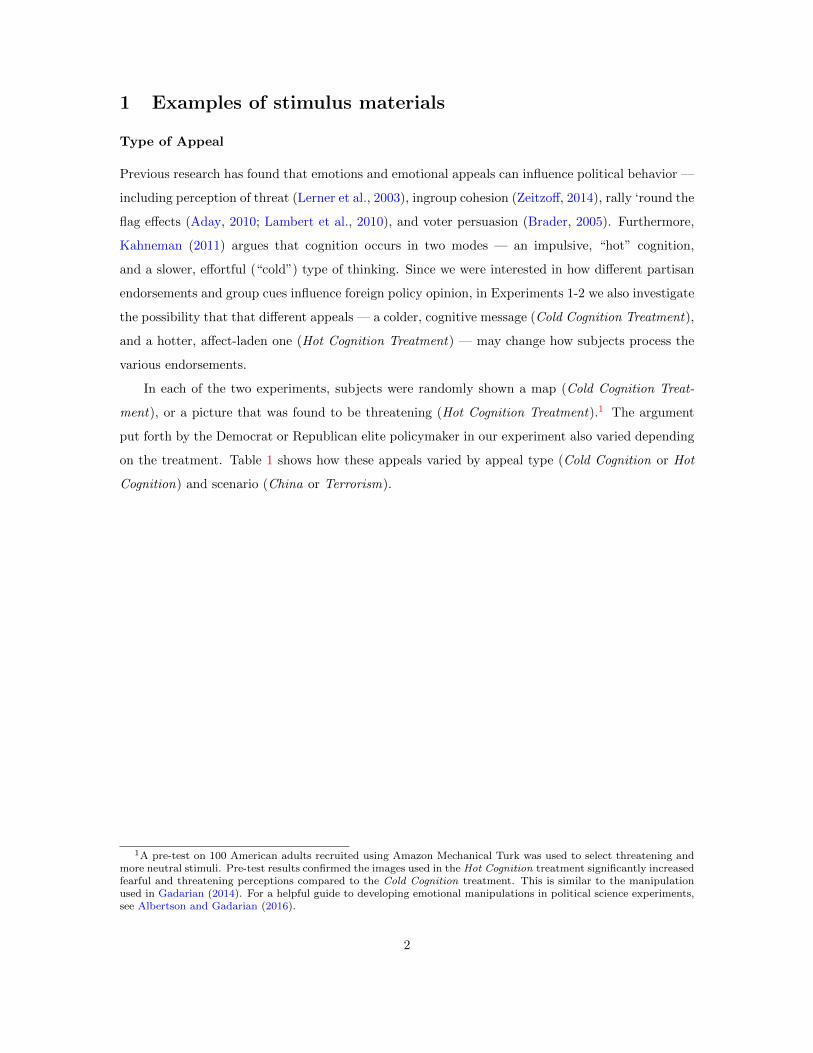
Table 1: Type of Appeal: Experiments 1-2
Scenario Emotional LogicalChina “It’s not rocket sci-
ence. China is tryingto bully the US, andbullies only respond toforce. My gut tells mewe need to shift mil-itary resources to theregion to send a signaland protect our inter-ests.”
“China is using its mil-itary to expand it’s in-fluence. Cool, coldlogic dictates that weneed to shift militaryresources to the regionto send a signal andprotect our interests.”
Terrorism “It’s not rocket sci-ence. Terrorists aretrying to kill Ameri-cans, my gut tells mewe should use our mili-tary to get them overthere before they at-tack us.”
“Terrorists are usingthese countries as abase of operations.Cool, cold logic dic-tates that we shoulduse our military toneutralize the terroristthreat over there.”
Figure 1: Group Endorse Cue
The graph below shows the responses of people who have previously taken the survey. Those whoanswered the earlier questions on the survey like you strongly supported sending US special forces
into foreign countries to go after terrorists.
3

Figure 2: Group Oppose Cue
The graph below shows the responses of people who have previously taken the survey. Those whoanswered the earlier questions on the survey like you strongly opposed sending US special forces
into foreign countries to go after terrorists.
Table 2: Elite partisan cue treatments for Experiment 3
Cue WordingControl [blank ]Dem. Support, Repub. Oppose Republicans and Democrats in
Congress are divided on the is-sue. Republicans strongly sup-port shifting US military re-sources to the region, whileDemocrats oppose such a move,and call for diplomatic efforts in-stead.
Repub. Support, Dem. Oppose Democrats and Republicans inCongress are divided on the is-sue. Democrats strongly supportshifting US military resources tothe region, while Republicans op-pose such a move, and call fordiplomatic efforts instead.
Both Support Both Republicans andDemocrats in Congress areunited on the issue, and stronglysupport shifting US militaryresources to the region.
4

Figure 3: China Scenario with Cold Cognition Treatment
5

Figure 4: Terrorism Scenario with Hot Cognition Treatment
6

Table 3: Elite cue treatments for Experiments 4-5
Cue ICSID Scenario Wording China Scenario WordingControl Those who support ICSID argue
that it protects investments andguarantees a transparent legalprocess for resolving disputes.Others have argued that ICSIDtilts the playing field further infavor of big multinational corpo-rations, and that disputes withforeign investors should be han-dled by the existing American le-gal system.
Some have argued that the USshould increase its naval pres-ence to deter China from furtherprovocative acts in the SouthChina Sea. Others have arguedthat such a move is a risky choicethat may escalate tensions evenfurther, and have instead calledfor diplomacy.
Elite Divided Democrats and Republicans inCongress are divided on the is-sue. Republicans strongly sup-port using ICSID for investor-state disputes, while Democratsare opposed, calling for disputeswith foreign investors to be han-dled by the existing American le-gal system.
Democrats and Republicans inCongress are divided on theissue. Republicans stronglysupport increasing US navalpresence in the region, whileDemocrats oppose such a move,and call for diplomatic efforts in-stead.
Elite Consensus Those who support ICSID arguethat it protects investments andguarantees a transparent legalprocess for resolving disputes.Others have argued that ICSIDtilts the playing field further infavor of big multinational corpo-rations, and that disputes withforeign investors should be han-dled by the existing American le-gal system. Democrats and Re-publicans in Congress are united.Both Democrats and Republi-cans strongly support using IC-SID for investor-state disputes.
Some have argued that the USshould increase its naval pres-ence to deter China from furtherprovocative acts in the SouthChina Sea. Others have ar-gued that such a move is a riskychoice that may escalate tensionseven further, and have insteadcalled for diplomacy. Democratsand Republicans in Congress areunited. Both Democrats andRepublicans strongly support in-creasing US naval presence in theregion.
7

2 Supplementary analyses and robustness checks
2.1 Study 1 (SSI): Experiments # 1-2
Table 4: Randomization Check on Treatments (Logit)
Dependent Variable: Assignment to Treatment
Emotional Appeal Democrat Endorse Group Endorse Group Oppose
(1) (2) (3) (4)
Male −0.150 −0.093 0.047 0.004(0.128) (0.128) (0.136) (0.135)
White −0.090 0.092 −0.185 −0.025(0.176) (0.176) (0.184) (0.185)
Age 0.002 0.002 −0.007 0.001(0.004) (0.004) (0.004) (0.004)
Education −0.019 −0.031 0.013 0.016(0.035) (0.035) (0.037) (0.037)
Income 0.037 −0.019 0.041 −0.001(0.032) (0.032) (0.034) (0.034)
Party ID 0.021 −0.011 0.043 −0.033(0.032) (0.032) (0.034) (0.034)
Militant Assertiveness 0.165 0.176 −0.479 0.574(0.336) (0.337) (0.359) (0.356)
Internationalism 0.244 0.344 −0.038 0.280(0.367) (0.367) (0.391) (0.388)
N 1,031 1,031 1,031 1,031AIC 1,443.144 1,443.422 1,317.756 1,339.891
Results from study 1. ∗p < .1; ∗∗p < .05; ∗∗∗p < .01.
8

Tab
le5:
Su
mm
ary
Sta
tist
ics
an
dS
am
ple
Ch
ara
cter
isti
cs
NN
AM
inM
ax
Med
ian
Mea
nS
td.
Dev
.D
escr
ipti
on
Mal
e10
350
01
0.0
00
0.4
80
0.5
00
Wh
ite
1035
00
11.0
00
0.8
29
0.3
77
Wh
ite,
not
His
panic
.
Age
1035
018
89
52.0
00
50.0
28
15.9
44
Ed
uca
tion
1035
01
96.0
00
6.0
22
1.9
53
Fro
mn
oh
igh
sch
ool
togra
du
ate
deg
ree.
Mea
n(6
)is
Ass
oci
ate
’sd
egre
e.
Inco
me
1032
31
10
3.0
00
3.7
19
2.1
18
Hou
seh
old
inco
me.
Fro
mle
ssth
an
20,0
00
US
Dto
more
than
200,0
00
US
D.
Mea
nis
bet
wee
n35,0
00
US
Dan
d75,0
00
US
D.
Par
tyID
1034
11
74.0
00
3.9
09
2.1
96
7-p
oin
tsc
ale
;1
(Str
on
gD
emo-
crat)
to7
(Str
on
gR
epu
bli
can
).
Mil
itan
tA
sser
tiven
ess
1035
00
10.5
00
0.5
09
0.2
05
Mil
itant
Ass
erti
ven
ess
scale
(Her
rman
n,
Tet
lock
,an
dV
isse
r,1999;
Ker
tzer
an
dM
cGra
w,
2012);
norm
ali
zed
to0-1
.
Inte
rnat
ion
alis
m10
350
01
0.5
63
0.5
44
0.1
79
Inte
rnati
on
ali
smsc
ale
(Her
-rm
an
n,
Tet
lock
,an
dV
isse
r,1999;
Ker
tzer
an
dM
cGra
w,
2012);
norm
ali
zed
to0-1
.
Arm
edF
orce
Ch
ina
Sce
nar
io10
350
01
0.4
78
0.4
66
0.2
71
Su
pp
ort
for
sen
din
gm
ilit
ary
re-
sou
rces
toA
sia.
Conti
nu
ou
s0-1
0n
orm
ali
zed
to0-1
.0
(Str
on
gly
Op
pose
)to
1(S
tron
gly
Su
pp
ort
).
Arm
edF
orce
Ter
rori
smS
cen
ario
1021
14
01
0.5
00
0.4
88
0.2
87
Su
pp
ort
for
sen
din
gU
SS
pec
ial
Forc
esto
fight
terr
ori
sm.
Con
-ti
nu
ou
s0-1
0sc
ale
norm
ali
zed
to0-1
.0
(Str
on
gly
Op
pose
)to
1(S
tron
gly
Su
pp
ort
).
Res
ult
sfr
omst
ud
y1.
9

Fig
ure
5:S
ub
stanti
veeff
ects
of
trea
tmen
tsan
dm
ain
dis
posi
tion
al
vari
ab
les
a) C
hina
Effe
ct s
ize
-0.2
0.0
0.2
0.4
0.6
Em
otio
nal A
ppea
l
Dem
ocra
t End
orse
Gro
up E
ndor
se
Gro
up O
ppos
e
Par
ty ID
Mili
tant
Ass
ertiv
enes
s
Inte
rnat
iona
lism
Bas
ic m
odel
No
grou
p tre
atm
ent
Pas
sed
man
ipul
atio
n ch
eck
b) T
erro
rism
Effe
ct s
ize
-0.2
0.0
0.2
0.4
0.6
Bas
ic m
odel
No
grou
p tre
atm
ent
Pas
sed
man
ipul
atio
n ch
eck
Th
isfi
gu
rep
lots
the
sub
stanti
ve
effec
tsfr
om
the
basi
ctr
eatm
ent
effec
tm
od
els
(see
mod
els
1an
d2
inT
ab
le1
inth
em
ain
text)
inb
lack
,a
seri
esof
mod
els
esti
mate
dso
lely
on
the
subse
tof
part
icip
ants
wh
od
idn
ot
rece
ive
agro
up
cue
(see
mod
els
3an
d4
inT
ab
le6)
ind
ark
gre
y,an
da
set
of
mod
els
esti
mate
dso
lely
on
those
part
icip
ants
wh
op
ass
edth
eel
ite
cue
man
ipu
lati
on
chec
k(s
eem
od
els
1an
d2
inT
ab
le3
inA
pp
end
ix§2
.1)
inlight
gre
y.A
llth
ree
dis
posi
tion
al
vari
ab
les
are
resc
ale
dfr
om
0-1
,so
that
the
effec
tes
tim
ate
rep
rese
nts
the
effec
tof
goin
gfr
om
the
min
imu
mto
the
maxim
um
level
of
each
vari
ab
le(e
.g.
from
stro
ng
Dem
ocr
at
tost
ron
gR
epu
blica
n,
etc.
).T
he
resu
lts
rem
ain
con
sist
ent
thro
ugh
ou
t:gro
up
cues
sign
ifica
ntl
yaff
ect
part
icip
ants
’vie
ws,
wh
ile
the
elit
ep
art
isan
cue
has
no
effec
t,an
dth
eeff
ect
of
part
isan
ship
isw
eaker
than
that
of
gen
eral
fore
ign
policy
ori
enta
tion
s.
10
Tab
le6:
Do
Eli
teE
nd
ors
emen
tsM
att
erin
the
Abse
nce
of
Gro
up
Tre
atm
ents
?(O
LS
)
Dep
end
ent
Vari
ab
le:
Su
pp
ort
for
Arm
edF
orc
e
Ch
ina
Ter
rori
smC
hin
aT
erro
rism
Ch
ina
Ter
rori
smC
hin
aT
erro
rism
(1)
(2)
(3)
(4)
(5)
(6)
(7)
(8)
Em
otio
nal
Ap
pea
l0.
027
−0.0
15
0.0
25
−0.0
04
0.0
28
−0.0
17
0.0
25
−0.0
05
(0.0
29)
(0.0
33)
(0.0
27)
(0.0
30)
(0.0
29)
(0.0
33)
(0.0
27)
(0.0
30)
Dem
ocr
atE
nd
orse
−0.
051∗
−0.0
21
−0.0
39
−0.0
29
−0.0
48
0.0
37
−0.0
62
0.0
60
(0.0
29)
(0.0
33)
(0.0
27)
(0.0
29)
(0.0
60)
(0.0
69)
(0.0
56)
(0.0
61)
Par
tyID
0.0
07
0.0
03
0.0
23∗
∗0.0
33∗
∗∗0.0
05
0.0
15
(0.0
07)
(0.0
08)
(0.0
09)
(0.0
11)
(0.0
09)
(0.0
10)
Par
tyID×
Dem
.E
nd
orse
−0.0
0003
−0.0
15
0.0
06
−0.0
22
(0.0
13)
(0.0
15)
(0.0
13)
(0.0
14)
Mil
itan
tA
sser
tive
nes
s0.4
96∗∗
∗0.6
21∗∗
∗0.4
97∗∗
∗0.6
28∗∗
∗
(0.0
67)
(0.0
74)
(0.0
67)
(0.0
74)
Inte
rnat
ion
alis
m0.1
37∗
0.1
94∗∗
0.1
38∗
0.1
97∗∗
(0.0
72)
(0.0
80)
(0.0
72)
(0.0
79)
Con
trol
sX
XX
XN
338
334
336
332
338
334
336
332
Ad
just
edR
20.
009
−0.0
06
0.2
01
0.2
35
0.0
39
0.0
21
0.1
99
0.2
39
∗ p<
.1;∗∗
p<
.05;
∗∗∗ p
<.0
1T
his
regre
ssio
non
lylo
oks
at
the
sub
set
of
resp
on
den
tsw
ho
did
not
rece
ive
eith
erth
eGroupEndorse
orGroupOppo
seco
nd
itio
n.
All
regre
ssio
ns
are
OL
San
dco
ntr
ol
for
the
ran
dom
lyass
ign
edord
erof
the
scen
ari
os
(Ch
ina
Sce
nari
oor
Ter
rori
smS
cen
ari
ofi
rst)
.C
ontr
ols
incl
ud
eMale,Age,Education,In
come,
an
dW
hite.
11

Table 7: Results for only those participants who passed manipulation check
China Terrorism China Terrorism
(1) (2) (3) (4)
Emotional Appeal 0.006 0.009 0.008 0.009(0.017) (0.018) (0.017) (0.018)
Democrat Endorse 0.018 −0.035∗∗ 0.108∗∗∗ 0.046(0.017) (0.018) (0.035) (0.036)
Group Endorse 0.048∗∗ 0.059∗∗∗ 0.049∗∗ 0.059∗∗∗
(0.021) (0.021) (0.021) (0.021)Group Oppose −0.086∗∗∗ −0.047∗∗ −0.086∗∗∗ −0.048∗∗
(0.021) (0.022) (0.021) (0.022)Party ID 0.005 0.013∗∗∗ 0.015∗∗∗ 0.023∗∗∗
(0.004) (0.005) (0.006) (0.006)Party ID X Democrat Endorse −0.023∗∗∗ −0.021∗∗∗
(0.008) (0.008)Militant Assertiveness 0.566∗∗∗ 0.551∗∗∗ 0.555∗∗∗ 0.553∗∗∗
(0.047) (0.048) (0.047) (0.047)Internationalism 0.160∗∗∗ 0.217∗∗∗ 0.155∗∗∗ 0.218∗∗∗
(0.050) (0.051) (0.049) (0.050)Controls X X X XN 779 813 779 813Adjusted R2 0.252 0.257 0.259 0.262
Results from study 1. ∗p < .1; ∗∗p < .05; ∗∗∗p < .01
12
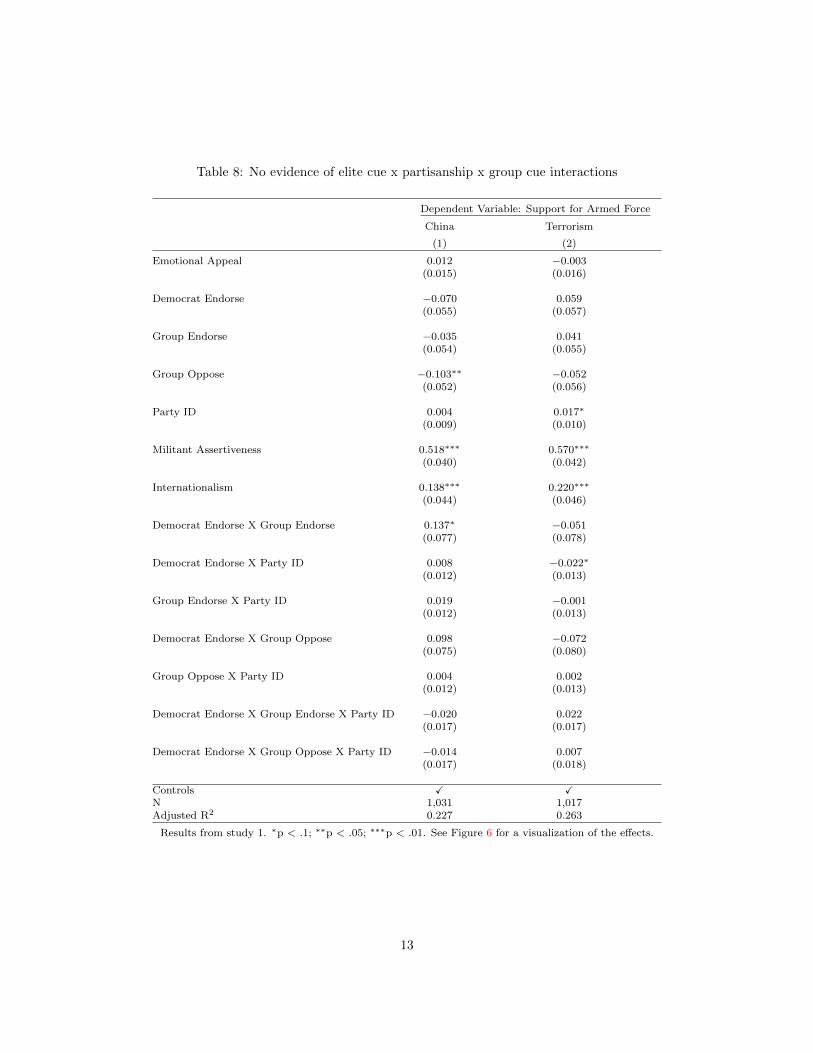
Table 8: No evidence of elite cue x partisanship x group cue interactions
Dependent Variable: Support for Armed Force
China Terrorism
(1) (2)
Emotional Appeal 0.012 −0.003(0.015) (0.016)
Democrat Endorse −0.070 0.059(0.055) (0.057)
Group Endorse −0.035 0.041(0.054) (0.055)
Group Oppose −0.103∗∗ −0.052(0.052) (0.056)
Party ID 0.004 0.017∗
(0.009) (0.010)
Militant Assertiveness 0.518∗∗∗ 0.570∗∗∗
(0.040) (0.042)
Internationalism 0.138∗∗∗ 0.220∗∗∗
(0.044) (0.046)
Democrat Endorse X Group Endorse 0.137∗ −0.051(0.077) (0.078)
Democrat Endorse X Party ID 0.008 −0.022∗
(0.012) (0.013)
Group Endorse X Party ID 0.019 −0.001(0.012) (0.013)
Democrat Endorse X Group Oppose 0.098 −0.072(0.075) (0.080)
Group Oppose X Party ID 0.004 0.002(0.012) (0.013)
Democrat Endorse X Group Endorse X Party ID −0.020 0.022(0.017) (0.017)
Democrat Endorse X Group Oppose X Party ID −0.014 0.007(0.017) (0.018)
Controls X XN 1,031 1,017Adjusted R2 0.227 0.263
Results from study 1. ∗p < .1; ∗∗p < .05; ∗∗∗p < .01. See Figure 6 for a visualization of the effects.
13
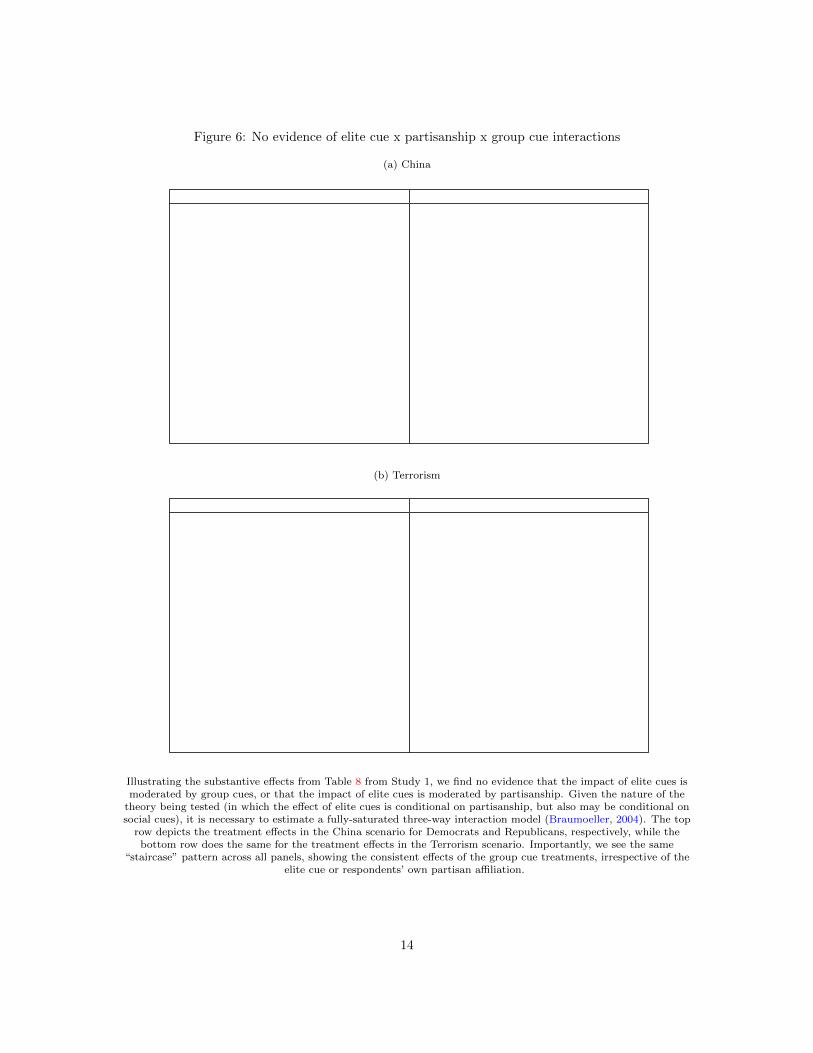
Figure 6: No evidence of elite cue x partisanship x group cue interactions
(a) China
Dem
Rep
OpposeContro
l Endorse0.2
0.3
0.4
0.5
0.6
0.7
0.8
Elite CueGroup Cues
Sup
port
Democrats
Dem
Rep
OpposeContro
l Endorse0.2
0.3
0.4
0.5
0.6
0.7
0.8
Elite CueGroup Cues
Sup
port
Republicans
(b) Terrorism
Dem
Rep
OpposeContro
l Endorse0.2
0.3
0.4
0.5
0.6
0.7
0.8
Elite CueGroup Cues
Sup
port
Democrats
Dem
Rep
OpposeContro
l Endorse0.2
0.3
0.4
0.5
0.6
0.7
0.8
Elite CueGroup Cues
Sup
port
Republicans
Illustrating the substantive effects from Table 8 from Study 1, we find no evidence that the impact of elite cues ismoderated by group cues, or that the impact of elite cues is moderated by partisanship. Given the nature of the
theory being tested (in which the effect of elite cues is conditional on partisanship, but also may be conditional onsocial cues), it is necessary to estimate a fully-saturated three-way interaction model (Braumoeller, 2004). The top
row depicts the treatment effects in the China scenario for Democrats and Republicans, respectively, while thebottom row does the same for the treatment effects in the Terrorism scenario. Importantly, we see the same
“staircase” pattern across all panels, showing the consistent effects of the group cue treatments, irrespective of theelite cue or respondents’ own partisan affiliation.
14

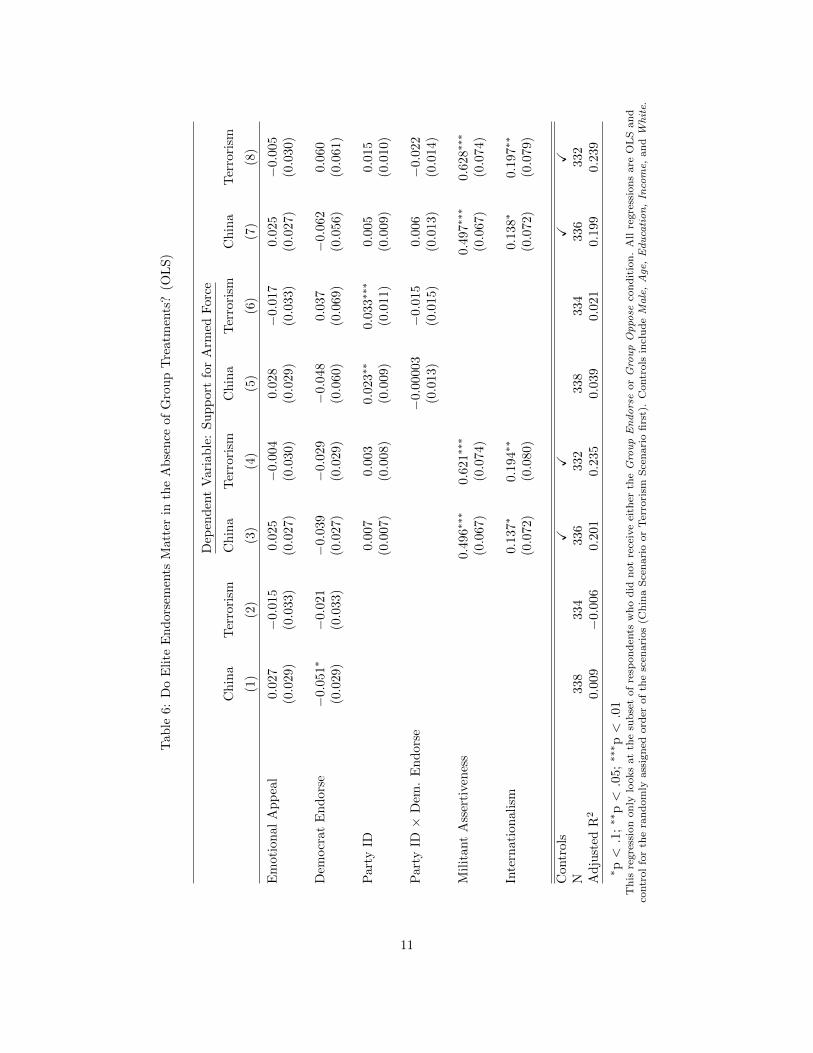
2.1.1 The effects of social cues on certainty and associated beliefs
Although our main interest is in testing how these different types of cues mobilize support for the
use of force, we also included a number of additional questions to ascertain how certain participants
were about their position on using force, how successful they thought the use of force would be at
achieving its goal, and how much of a threat they perceived from from the scenarios described. These
measures, the results for which are displayed in Table 9, are of interest in as much as they allow us
to observe not just how much they supported a given mission, but the potential mechanisms through
which the treatments shape judgments, and the broader architecture of participants’ beliefs. In the
previous set of analyses, we saw that the emotional appeal lacked significant effects on mobilizing
support; here we find that participants in the hot cognition (Emotional Appeal) treatment were more
likely to perceive a threat from China, and also more likely to perceive the pivot to Asia as being
successful. Interestingly, we find that group endorsements have a stronger effect in terms of increasing
certainty, perceived likelihood of success, and threat perception than group opposition does – the
Group Endorse treatment significantly increases participants’ certainty about their decision in the
China scenario, increases perceptions of the likelihood of success in both the China scenario and the
Terrorism scenario, and increases threat perception in the China scenario. This asymmetry between
group endorsements and group opposition is of theoretical interest, and merits future study.
As before, participant-level characteristics exert the largest impact. Consistent with the psy-
chological literature on the relationship between conservatism, uncertainty avoidance, and threat
management (Jost et al., 2007), we see that across both scenarios Republicans express more cer-
tainty about their responses than Democrats do, and also perceive higher levels of threat. Once
again, though, the substantively largest contributions to the model come from participants’ prior
foreign policy orientations: participants high in military assertiveness — who tend to believe in
the efficacy of the use of force – are far more likely to believe the missions will be successes than
their dovish counterparts; internationalists are similarly optimistic compared to isolationists. Al-
though we see similarly sensible results for militant assertiveness with respect to threat perceptions
— hawks are more likely to perceive a threat in both the China and Terrorism scenarios — we see
that internationalists are actually less rather than more likely to perceive a threat posed by a rising
China, reflecting the presence of multiple “faces” of internationalism: a military internationalism
eager to deploy force abroad, and a cooperative internationalism that sees opportunities for gains
from trade and mutual cooperation (Wittkopf, 1990; Holsti, 2004).
15
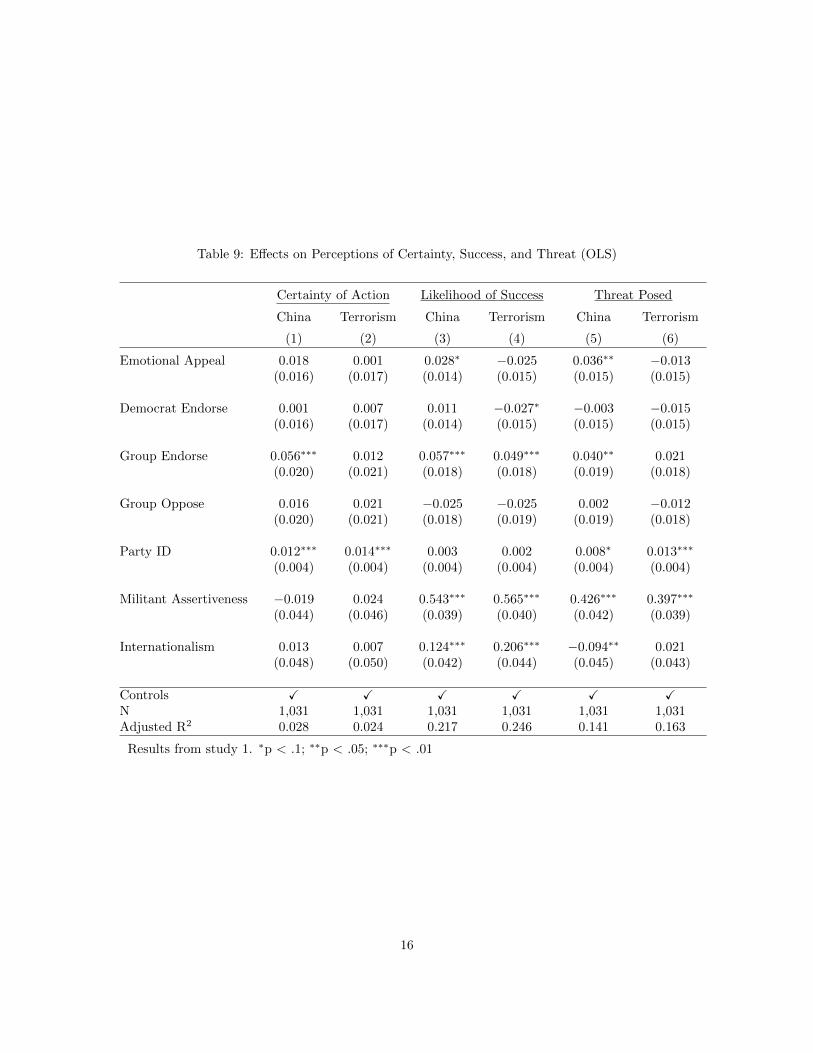
Table 9: Effects on Perceptions of Certainty, Success, and Threat (OLS)
Certainty of Action Likelihood of Success Threat Posed
China Terrorism China Terrorism China Terrorism
(1) (2) (3) (4) (5) (6)
Emotional Appeal 0.018 0.001 0.028∗ −0.025 0.036∗∗ −0.013(0.016) (0.017) (0.014) (0.015) (0.015) (0.015)
Democrat Endorse 0.001 0.007 0.011 −0.027∗ −0.003 −0.015(0.016) (0.017) (0.014) (0.015) (0.015) (0.015)
Group Endorse 0.056∗∗∗ 0.012 0.057∗∗∗ 0.049∗∗∗ 0.040∗∗ 0.021(0.020) (0.021) (0.018) (0.018) (0.019) (0.018)
Group Oppose 0.016 0.021 −0.025 −0.025 0.002 −0.012(0.020) (0.021) (0.018) (0.019) (0.019) (0.018)
Party ID 0.012∗∗∗ 0.014∗∗∗ 0.003 0.002 0.008∗ 0.013∗∗∗
(0.004) (0.004) (0.004) (0.004) (0.004) (0.004)
Militant Assertiveness −0.019 0.024 0.543∗∗∗ 0.565∗∗∗ 0.426∗∗∗ 0.397∗∗∗
(0.044) (0.046) (0.039) (0.040) (0.042) (0.039)
Internationalism 0.013 0.007 0.124∗∗∗ 0.206∗∗∗ −0.094∗∗ 0.021(0.048) (0.050) (0.042) (0.044) (0.045) (0.043)
Controls X X X X X XN 1,031 1,031 1,031 1,031 1,031 1,031Adjusted R2 0.028 0.024 0.217 0.246 0.141 0.163
Results from study 1. ∗p < .1; ∗∗p < .05; ∗∗∗p < .01
16

2.2 Study 2 (Amazon MTurk): Experiment #3
Table 10: Randomization Check on Treatments (Logit)
Dem Support Rep Support Elite Consensus Group Endorse Group Oppose
(1) (2) (3) (4) (5)
Militant Assertiveness −0.240 0.179 −0.039 0.371 −0.498∗
(0.302) (0.305) (0.299) (0.282) (0.279)Internationalism 0.324 0.384 0.009 0.141 −0.242
(0.348) (0.351) (0.342) (0.323) (0.316)Party ID −0.142 0.221 0.151 −0.054 0.086
(0.256) (0.257) (0.251) (0.237) (0.235)Male 0.059 0.223∗ −0.117 0.081 0.078
(0.125) (0.128) (0.123) (0.117) (0.115)Age 0.002 −0.004 −0.004 0.006 0.002
(0.006) (0.006) (0.006) (0.005) (0.005)Education −0.086∗ 0.047 0.017 0.032 0.008
(0.048) (0.049) (0.048) (0.045) (0.044)Constant −0.881∗∗ −1.718∗∗∗ −0.979∗∗∗ −1.374∗∗∗ −0.538
(0.366) (0.377) (0.364) (0.345) (0.337)N 1,445 1,445 1,445 1,445 1,445AIC 1,639.908 1,603.739 1,662.870 1,808.000 1,849.340
Results from study 2. ∗p < .1; ∗∗p < .05; ∗∗∗p < .01
17

Tab
le11
:S
um
mary
Sta
tist
ics
an
dS
am
ple
Ch
ara
cter
isti
csfo
rS
tud
y2
NN
AM
inM
ax
Med
ian
Mea
nS
td.
Dev
.D
escr
ipti
on
Mal
e14
441
01
1.0
00.5
76
0.4
94
Age
1445
018
75
57.0
034.1
13
11.0
20
Ed
uca
tion
1445
01
85.0
00
4.2
25
1.2
75
Fro
mn
oh
igh
sch
ool
(1)
togra
d-
uate
deg
ree
(8).
Mea
n(4
)is
As-
soci
ate
’sd
egre
e.
Par
tyID
1445
11
70.3
33
0.3
94
0.2
58
7-p
oin
tsc
ale
;n
orm
ali
zed
to0
(Str
on
gD
emocr
at)
to1
(Str
on
gR
epu
bli
can
).
Mil
itan
tA
sser
tiven
ess
1445
00
10.3
75
0.4
06
0.2
13
Mil
itant
Ass
erti
ven
ess
scale
(Her
rman
n,
Tet
lock
,an
dV
isse
r,1999;
Ker
tzer
an
dM
cGra
w,
2012);
norm
ali
zed
to0-1
.
Inte
rnat
ion
alis
m14
450
01
0.6
25
0.5
91
0.1
84
Inte
rnati
on
ali
smsc
ale
(Her
-rm
an
n,
Tet
lock
,an
dV
isse
r,1999;
Ker
tzer
an
dM
cGra
w,
2012);
norm
ali
zed
to0-1
.
Arm
edF
orce
Ch
ina
Sce
nar
io14
450
01
0.3
78
0.3
94
0.2
74
Su
pp
ort
for
sen
din
gm
ilit
ary
re-
sou
rces
toA
sia.
Conti
nu
ou
s0-1
0n
orm
ali
zed
to0-1
.0
(Str
on
gly
Op
pose
)to
1(S
tron
gly
Su
pp
ort
).
18
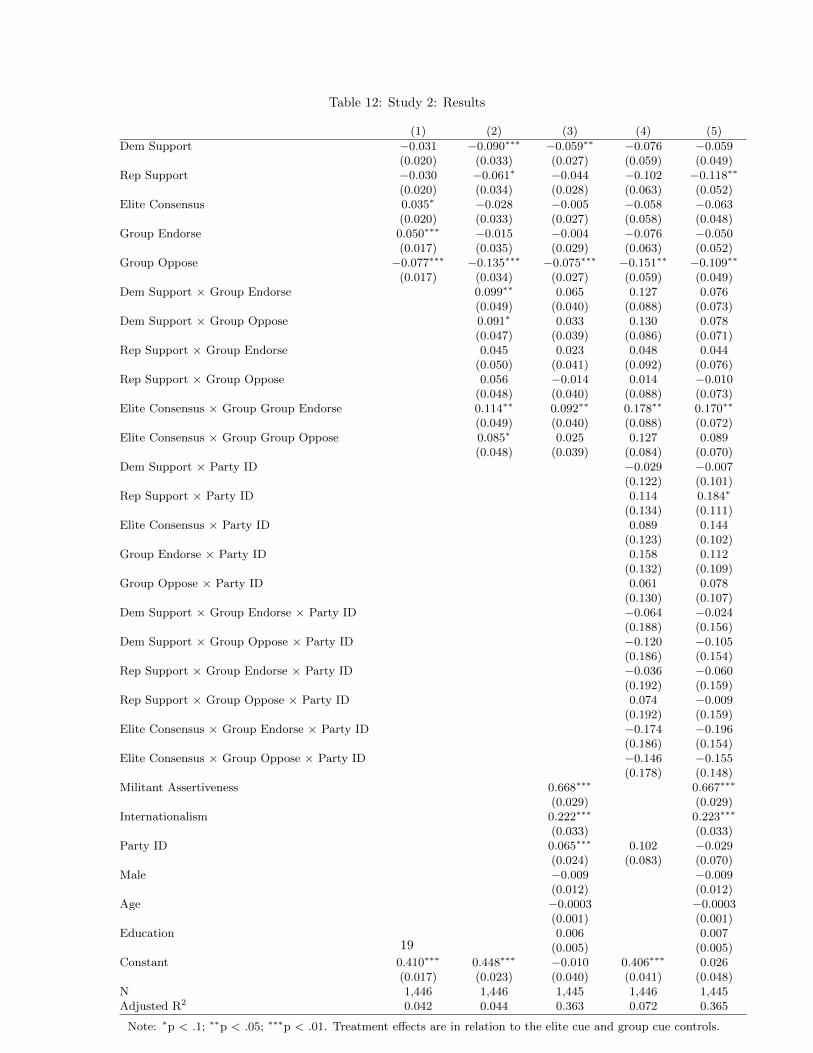
Table 12: Study 2: Results
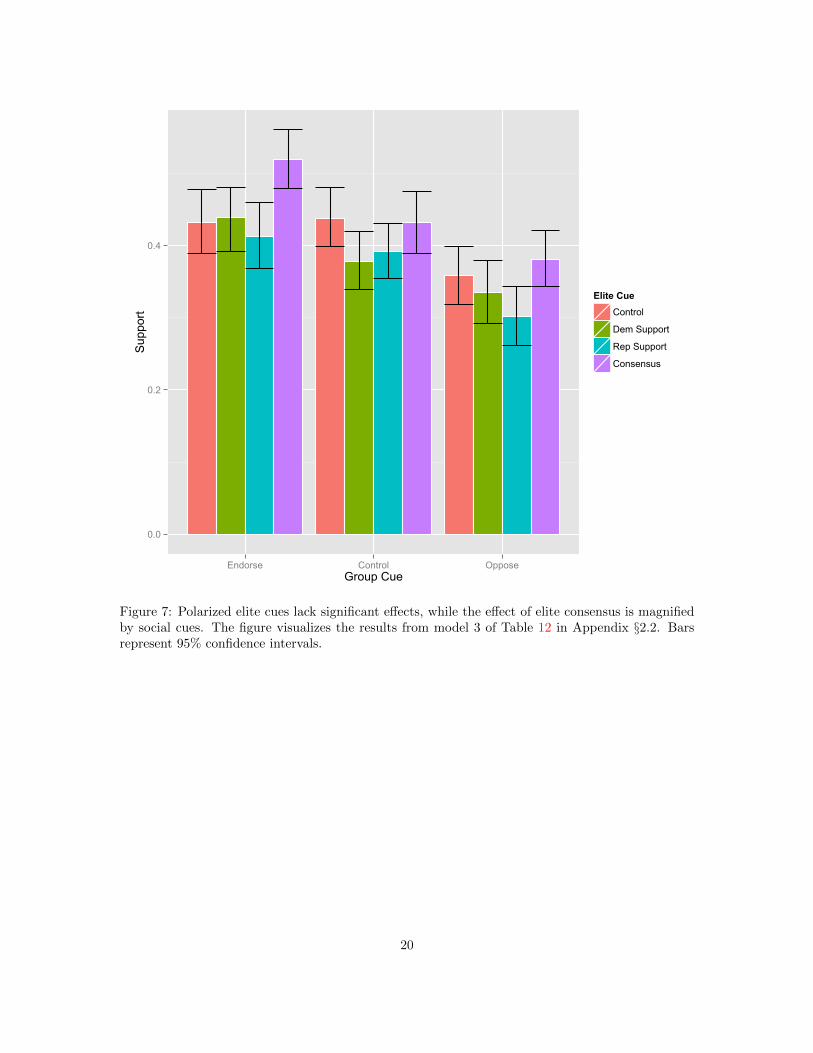
(1) (2) (3) (4) (5)
Dem Support −0.031 −0.090∗∗∗ −0.059∗∗ −0.076 −0.059(0.020) (0.033) (0.027) (0.059) (0.049)
Rep Support −0.030 −0.061∗ −0.044 −0.102 −0.118∗∗
(0.020) (0.034) (0.028) (0.063) (0.052)Elite Consensus 0.035∗ −0.028 −0.005 −0.058 −0.063
(0.020) (0.033) (0.027) (0.058) (0.048)Group Endorse 0.050∗∗∗ −0.015 −0.004 −0.076 −0.050
(0.017) (0.035) (0.029) (0.063) (0.052)Group Oppose −0.077∗∗∗ −0.135∗∗∗ −0.075∗∗∗ −0.151∗∗ −0.109∗∗
(0.017) (0.034) (0.027) (0.059) (0.049)Dem Support × Group Endorse 0.099∗∗ 0.065 0.127 0.076
(0.049) (0.040) (0.088) (0.073)Dem Support × Group Oppose 0.091∗ 0.033 0.130 0.078
(0.047) (0.039) (0.086) (0.071)Rep Support × Group Endorse 0.045 0.023 0.048 0.044
(0.050) (0.041) (0.092) (0.076)Rep Support × Group Oppose 0.056 −0.014 0.014 −0.010
(0.048) (0.040) (0.088) (0.073)Elite Consensus × Group Group Endorse 0.114∗∗ 0.092∗∗ 0.178∗∗ 0.170∗∗
(0.049) (0.040) (0.088) (0.072)Elite Consensus × Group Group Oppose 0.085∗ 0.025 0.127 0.089
(0.048) (0.039) (0.084) (0.070)Dem Support × Party ID −0.029 −0.007
(0.122) (0.101)Rep Support × Party ID 0.114 0.184∗
(0.134) (0.111)Elite Consensus × Party ID 0.089 0.144
(0.123) (0.102)Group Endorse × Party ID 0.158 0.112
(0.132) (0.109)Group Oppose × Party ID 0.061 0.078
(0.130) (0.107)Dem Support × Group Endorse × Party ID −0.064 −0.024
(0.188) (0.156)Dem Support × Group Oppose × Party ID −0.120 −0.105
(0.186) (0.154)Rep Support × Group Endorse × Party ID −0.036 −0.060
(0.192) (0.159)Rep Support × Group Oppose × Party ID 0.074 −0.009
(0.192) (0.159)Elite Consensus × Group Endorse × Party ID −0.174 −0.196
(0.186) (0.154)Elite Consensus × Group Oppose × Party ID −0.146 −0.155
(0.178) (0.148)Militant Assertiveness 0.668∗∗∗ 0.667∗∗∗
(0.029) (0.029)Internationalism 0.222∗∗∗ 0.223∗∗∗
(0.033) (0.033)Party ID 0.065∗∗∗ 0.102 −0.029
(0.024) (0.083) (0.070)Male −0.009 −0.009
(0.012) (0.012)Age −0.0003 −0.0003
(0.001) (0.001)Education 0.006 0.007
(0.005) (0.005)Constant 0.410∗∗∗ 0.448∗∗∗ −0.010 0.406∗∗∗ 0.026
(0.017) (0.023) (0.040) (0.041) (0.048)N 1,446 1,446 1,445 1,446 1,445Adjusted R2 0.042 0.044 0.363 0.072 0.365
Note: ∗p < .1; ∗∗p < .05; ∗∗∗p < .01. Treatment effects are in relation to the elite cue and group cue controls.
19
0.0
0.2
0.4
Endorse Control OpposeGroup Cue
Sup
port
Elite CueControl
Dem Support
Rep Support
Consensus
Figure 7: Polarized elite cues lack significant effects, while the effect of elite consensus is magnifiedby social cues. The figure visualizes the results from model 3 of Table 12 in Appendix §2.2. Barsrepresent 95% confidence intervals.
20

Table 13: Results for only those participants who passed the manipulation check
(1) (2) (3) (4) (5)
Dem Support −0.032 −0.093∗∗∗ −0.055∗ −0.103 −0.056(0.021) (0.035) (0.029) (0.063) (0.053)
Rep Support −0.038∗ −0.088∗∗ −0.057∗ −0.181∗∗∗ −0.163∗∗∗
(0.021) (0.036) (0.030) (0.067) (0.056)Elite Consensus 0.039∗ −0.030 −0.005 −0.062 −0.056
(0.021) (0.035) (0.029) (0.061) (0.051)Group Endorse 0.051∗∗∗ −0.015 −0.005 −0.076 −0.051
(0.019) (0.035) (0.029) (0.063) (0.052)Group Oppose −0.068∗∗∗ −0.135∗∗∗ −0.076∗∗∗ −0.151∗∗ −0.109∗∗
(0.018) (0.033) (0.027) (0.059) (0.049)Dem Support × Group Endorse 0.107∗∗ 0.063 0.135 0.066
(0.052) (0.043) (0.093) (0.077)Dem Support × Group Oppose 0.089∗ 0.023 0.153∗ 0.085
(0.050) (0.041) (0.090) (0.075)Rep Support × Group Endorse 0.073 0.039 0.109 0.085
(0.052) (0.043) (0.095) (0.079)Rep Support × Group Oppose 0.084∗ 0.0002 0.071 0.030
(0.051) (0.042) (0.092) (0.077)Elite Consensus × Group Endorse 0.103∗∗ 0.093∗∗ 0.174∗ 0.179∗∗
(0.051) (0.042) (0.093) (0.077)Elite Consensus × Group Oppose 0.115∗∗ 0.046 0.193∗∗ 0.122∗
(0.051) (0.042) (0.088) (0.074)Dem Support × Party ID 0.021 0.003
(0.128) (0.107)Rep Support × Party ID 0.245∗ 0.265∗∗
(0.142) (0.119)Elite Consensus × Party ID 0.098 0.126
(0.132) (0.110)Group Endorse× Party ID 0.158 0.114
(0.130) (0.109)Group Oppose× Party ID 0.061 0.077
(0.128) (0.107)Dem Support × Group Endorse× Party ID −0.056 −0.009
(0.194) (0.162)Dem Support × Group Oppose× Party ID −0.176 −0.155
(0.192) (0.160)Rep Support × Group Endorse× Party ID −0.130 −0.126
(0.198) (0.165)Rep Support × Group Oppose× Party ID −0.003 −0.076
(0.199) (0.166)Elite Consensus × Group Endorse× Party ID −0.198 −0.217
(0.200) (0.166)Elite Consensus × Group Oppose× Party ID −0.236 −0.181
(0.188) (0.157)Militant Assertiveness 0.657∗∗∗ 0.654∗∗∗
(0.032) (0.031)Internationalism 0.240∗∗∗ 0.238∗∗∗
(0.035) (0.035)Party ID 0.069∗∗∗ 0.102 −0.025
(0.026) (0.083) (0.070)Male −0.004 −0.005
(0.013) (0.013)Age −0.0004 −0.0004
(0.001) (0.001)Education 0.005 0.006
(0.005) (0.005)Constant 0.407∗∗∗ 0.448∗∗∗ −0.010 0.406∗∗∗ 0.027
(0.017) (0.023) (0.041) (0.041) (0.049)N 1,250 1,250 1,249 1,250 1,249Adjusted R2 0.041 0.042 0.359 0.081 0.364
Results from study 2. Note: ∗p < .1; ∗∗p < .05; ∗∗∗p < .01. Treatment effects in relation to the elite & group cue controls.
21

2.3 Study 3 (Amazon MTurk): Experiments #4-5
Table 14: Randomization check: China
Elite Divided Elite Consensus Group Endorse Group Oppose
(1) (2) (3) (4)
Military assertiveness −0.080 −0.300 0.172 0.059(0.247) (0.248) (0.238) (0.237)
Internationalism 0.550∗∗ −0.077 0.353 −0.283(0.269) (0.267) (0.258) (0.256)
Party ID 0.135 0.092 0.058 −0.202(0.204) (0.205) (0.197) (0.196)
Male −0.045 0.022 0.028 0.035(0.096) (0.097) (0.093) (0.092)
Age −0.005 0.007 −0.003 −0.003(0.004) (0.004) (0.004) (0.004)
Education 0.017 −0.081∗∗ −0.055 0.050(0.035) (0.036) (0.034) (0.034)
Constant −0.910∗∗∗ −0.503∗ −0.413 −0.270(0.277) (0.274) (0.265) (0.264)
N 1,994 1,994 1,994 1,994AIC 2,548.103 2,534.239 2,686.388 2,702.630
∗p < .1; ∗∗p < .05; ∗∗∗p < .01
22

Table 15: Randomization check: ICSID
Elite Divided Elite Consensus Group Endorse Group Oppose
(1) (2) (3) (4)
Military assertiveness −0.103 0.164 0.059 0.172(0.247) (0.247) (0.237) (0.238)
Internationalism 0.122 −0.071 −0.283 0.353(0.266) (0.267) (0.256) (0.258)
Party ID 0.345∗ −0.380∗ −0.202 0.058(0.204) (0.205) (0.196) (0.197)
Male 0.071 −0.070 0.035 0.028(0.096) (0.096) (0.092) (0.093)
Age 0.007 0.002 −0.003 −0.003(0.004) (0.004) (0.004) (0.004)
Education −0.017 −0.007 0.050 −0.055(0.035) (0.035) (0.034) (0.034)
Constant −1.071∗∗∗ −0.565∗∗ −0.270 −0.413(0.275) (0.274) (0.264) (0.265)
N 1,994 1,994 1,994 1,994AIC 2,543.611 2,550.857 2,702.630 2,686.388
∗p < .1; ∗∗p < .05; ∗∗∗p < .01
2.3.1 Comparison of group cue treatments
Studies 1 and 2 build on Mann and Sinclair (2013) by using a social cue treatment that presents
respondents with the responses from other survey respondents who answered the previous survey
respondents like them. By using the “like you” language, we avoid the problem of selecting a pre-
defined reference group for participants, thereby letting participants define the relevant comparison
point for themselves rather than assuming they identify with other members of groups defined by
particular descriptive characteristics (as would be the case in treatments that emphasized what other
respondents of the same gender, or who resided in the same town, thought).
However, it also raises four sets of questions. First, it raises questions about the mundane
realism of the treatment: although participants are often presented with polling data summarizing
the views of others, they are rarely so micro-directed as to only reflect the responses of others
“like them”. When news articles present polling results, for example, the survey results presented
rarely varies depending on the individual reader! Second, it raises questions about the construct
validity: although many social networks tend towards homophily (e.g. McPherson, Smith-Lovin,
and Cook, 2001; Freelon, Lynch, and Aday, 2015), this tendency is far from universal (Huckfeldt,
Mendez, and Osborn, 2004; Gentzkow and Shapiro, 2011). Third, it raises questions about the
23

mechanisms driving the treatment effects. The interpretation advanced in the main text is that the
group cues are social cues, operating by presenting information about the beliefs of other societal
actors. A more individualistic interpretation, however, might be that the results are being driven by
the words “like you”, which may produce pressures for attitudinal consistency, in which respondents
who have already expressed a certain set of political attitudes express viewpoints similar to those
of other individuals who also happen to share these attitudes. Fourth, it raises questions about the
comparability between the social cue and the elite cues, since the elite cues are not presented in the
form of responses of “elites like you.”
Thus, for experiments 4-5 in Study 3, we employ two types of group cues. As before, we include
both a group endorse cue, and a group oppose cue, in which participants are presented with a set of
survey marginals, along with a group control, in which no social cues are presented. Here, however,
we include two types of each group cue: a pair of treatments were the survey marginals are the views
of respondents who answered the previous set of survey responses like them, and a more generic social
cue where the survey marginals are simply presented as the views of other survey respondents. By
comparing these two sets of treatments, we can determine whether the results are being driven by
the “like you” wording.
We carry out this analysis in four steps. First, in Table 18 we run an OLS model with both
the original social cure (group endorse “like you” and group oppose “like you” and the generic
group endorse, and the generic group oppose (omitting the “like you phrasing”). From a visual
inspection, and a formal test of the equality coefficients (F -test), we find no statistical difference
in the coefficients between the original (“like you”) social cues and the generic social cues. This
suggests that the effects of our social cues are not driven by the wording “like you.” Second, we
estimate a series of Davidson-MacKinnon J tests to compare a model that includes a separate set
of indicator variables for each of the four social cues (group endorse “like you”, group oppose “like
you”, the generic group endorse, and the generic group oppose), and a model that pools the type of
social cue together (a pooled group endorse, and a pooled group oppose); it systematically fails to
find evidence that one model is better than the other.2
Third, we conduct a simple visual test, plotting the density distributions of our dependent
variable of interest for each experiment, conditioning on elite and group cues. If the results are
being driven by the “like you” language, we should see systematically different findings between
2For China, in an additive specification: t = −0.772, p < 0.44 for the full model, and t = 0.625, p < 0.532 for thepooled model; in an interactive specification: t = 1.094, p < 0.27 for the full model, and t = 1.506, p < 0.13 for thepooled model. For ICSID, in an additive specification: t = 1.031, p < 0.30 for the full model, t = 0.622, p < 0.53 forthe pooled model; in an interactive specification: t = −2.754, p < 0.006 for the full model, t = 2.873, p < 0.004 forthe pooled model. Thus, for three of the four tests, we fail to find evidence that the model fits significantly differ; forthe last test, we find they differ, but that neither one outperforms the other. The results from the rank-sum tests,and a visual inspection of Figure 8 confirm this pattern.
24
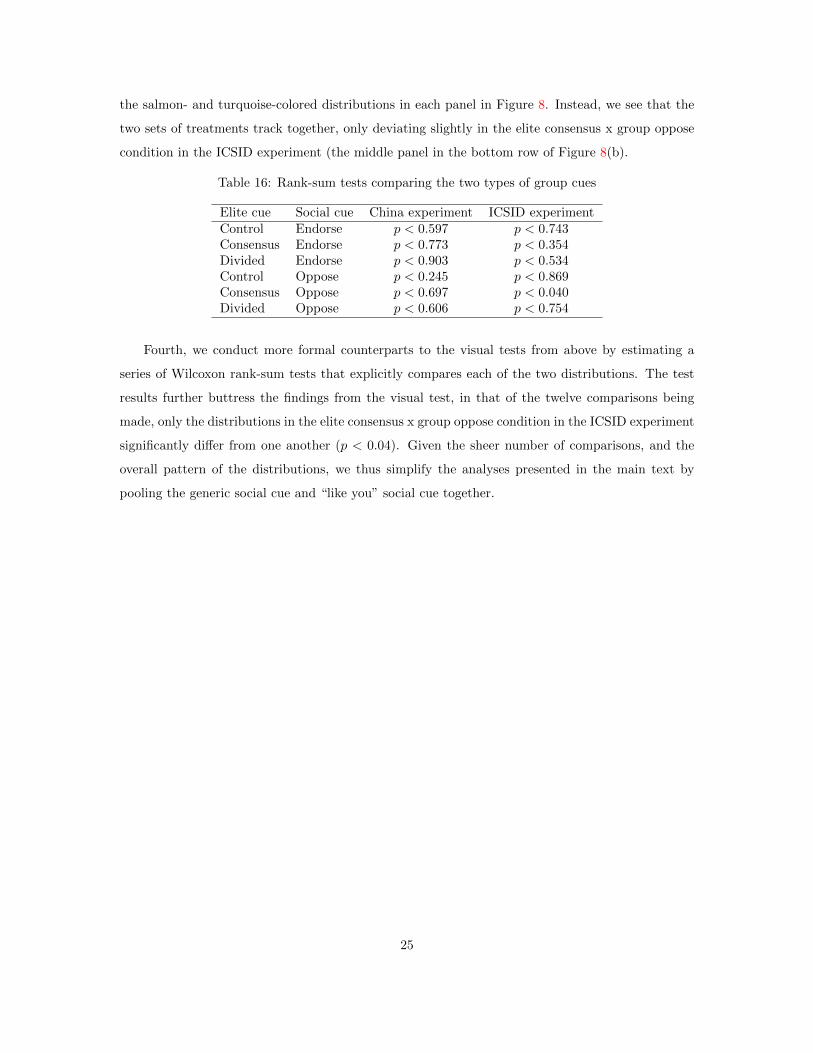
the salmon- and turquoise-colored distributions in each panel in Figure 8. Instead, we see that the
two sets of treatments track together, only deviating slightly in the elite consensus x group oppose
condition in the ICSID experiment (the middle panel in the bottom row of Figure 8(b).
Table 16: Rank-sum tests comparing the two types of group cues
Elite cue Social cue China experiment ICSID experimentControl Endorse p < 0.597 p < 0.743Consensus Endorse p < 0.773 p < 0.354Divided Endorse p < 0.903 p < 0.534Control Oppose p < 0.245 p < 0.869Consensus Oppose p < 0.697 p < 0.040Divided Oppose p < 0.606 p < 0.754
Fourth, we conduct more formal counterparts to the visual tests from above by estimating a
series of Wilcoxon rank-sum tests that explicitly compares each of the two distributions. The test
results further buttress the findings from the visual test, in that of the twelve comparisons being
made, only the distributions in the elite consensus x group oppose condition in the ICSID experiment
significantly differ from one another (p < 0.04). Given the sheer number of comparisons, and the
overall pattern of the distributions, we thus simplify the analyses presented in the main text by
pooling the generic social cue and “like you” social cue together.
25

Figure 8: Density distributions of group cues
(a) China experiment
Elite Control Elite Consensus Elite Divided
Group E
ndorseG
roup Oppose
0 25 50 75 100 0 25 50 75 100 0 25 50 75 100Support
Den
sity Type of group cue
Like You
Generic
(b) ICSID experiment
Elite Control Elite Consensus Elite Divided
Group E
ndorseG
roup Oppose
0 25 50 75 100 0 25 50 75 100 0 25 50 75 100Support
Den
sity Type of group cue
Like You
Generic
The overlapping density plots confirm the results of the J tests and rank sum tests described above, showing thatthe two types of group cues have similar effects to one another, such that we pool them in the main analysis in the
text. The findings thus suggest that the group cue treatment effects are not being driven by the “like you” languageused in Studies 1 and 2.
26

Tab
le17
:S
um
mary
Sta
tist
ics
an
dS
am
ple
Ch
ara
cter
isti
csfo
rS
tud
y3
NN
AM
inM
ax
Med
ian
Mea
nS
td.
Dev
.D
escr
ipti
on
Mal
e19
943
01
1.0
00
0.5
03
0.5
00
Age
1997
018
90
33.0
00
35.8
78
11.4
43
Ed
uca
tion
1997
01
85.0
00
4.2
30
1.3
66
Fro
mn
oh
igh
sch
ool
(1)
togra
d-
uate
deg
ree
(8).
Mea
n(4
)is
As-
soci
ate
’sd
egre
e.
Par
tyID
1997
00
10.3
33
0.4
13
0.2
74
7-p
oin
tsc
ale
norm
ali
zed
toli
eb
etw
een
0an
d1;
0(S
tron
gD
emocr
at)
to1
(Str
ong
Rep
ub
-li
can
).
Mil
itan
tA
sser
tiven
ess
1997
00
10.3
75
0.4
05
0.2
14
Mil
itant
Ass
erti
ven
ess
scale
(Her
rman
n,
Tet
lock
,an
dV
isse
r,1999;
Ker
tzer
an
dM
cGra
w,
2012);
norm
ali
zed
to0-1
.
Inte
rnat
ion
alis
m19
970
01
0.6
25
0.5
91
0.1
94
Inte
rnati
on
ali
smsc
ale
(Her
-rm
an
n,
Tet
lock
,an
dV
isse
r,1999;
Ker
tzer
an
dM
cGra
w,
2012);
norm
ali
zed
to0-1
.
Arm
edF
orce
Ch
ina
Sce
nar
io19
970
01
0.4
67
0.4
62
0.2
92
Su
pp
ort
for
sen
din
gm
ilit
ary
re-
sou
rces
toA
sia.
Conti
nu
ou
s0-1
0n
orm
ali
zed
to0-1
.0
(Str
on
gly
Op
pose
)to
1(S
tron
gly
Su
pp
ort
).S
up
por
tfo
rIC
SID
1445
00
10.5
22
0.5
08
0.2
62
Su
pp
ort
for
all
owin
gU
Sci
tize
ns
be
sub
ject
toIC
SID
.C
onti
nu
-ou
s0-1
0n
orm
ali
zed
to0-1
.0
(Str
on
gly
Op
pose
)to
1(S
tron
gly
Su
pp
ort
).
27

Table 18: Study 3 Results (disaggregated by social cue)
China ICSID
(1) (2) (3) (4) (5) (6)
Elite Divided −0.031 −0.026∗∗ −0.026 −0.044∗∗∗ −0.043∗∗∗ −0.042∗∗∗
(0.016) (0.013) (0.013) (0.014) (0.014) (0.014)Elite Consensus 0.063∗∗∗ 0.072∗∗∗ 0.071∗∗∗ 0.047∗∗∗ 0.046∗∗∗ 0.046∗∗∗
(0.016) (0.013) (0.013) (0.014) (0.014) (0.014)Group Endorse (“Like You”) 0.011 0.004 0.003 0.045∗∗ 0.045∗∗ 0.045∗∗
(0.020) (0.017) (0.017) (0.018) (0.018) (0.018)Group Endorse 0.022 0.011 0.013 0.042∗∗ 0.040∗∗ 0.040∗∗
(0.020) (0.017) (0.017) (0.018) (0.018) (0.018)Group Oppose (“Like You”) −0.094∗∗∗ −0.094∗∗∗ −0.095∗∗∗ −0.064∗∗∗ −0.069∗∗∗ −0.068∗∗∗
(0.020) (0.017) (0.017) (0.018) (0.018) (0.018)Group Oppose −0.088∗∗∗ −0.093∗∗∗ −0.093∗∗∗ −0.075∗∗∗ −0.077∗∗∗ −0.077∗∗∗
(0.020) (0.017) (0.017) (0.018) (0.018) (0.018)Militant Assertiveness 0.655∗∗∗ 0.651∗∗∗ 0.0004 0.004
(0.028) (0.028) (0.029) (0.029)Internationalism 0.142∗∗∗ 0.141∗∗∗ 0.286∗∗∗ 0.289∗∗∗
(0.030) (0.031) (0.031) (0.031)Party ID 0.065∗∗∗ 0.060∗∗ −0.016 −0.015
(0.023) (0.023) (0.024) (0.024)Controls X X
F -test of equality between coefficients on Social Cue Treatment Versions (1) (“Like You”) vs. (2) (Generic)Group Endorse Treatments 0.585 0.688 0.567 0.838 0.795 0.789Group Oppose Treatment 0.761 0.964 0.932 0.557 0.659 0.578N 1,997 1,997 1,994 1,997 1,997 1,994R2 0.049 0.308 0.310 0.060 0.107 0.108Adjusted R2 0.045 0.305 0.305 0.057 0.103 0.102
∗∗p < .05; ∗∗∗p < .01All regressions are OLS and control for the randomly assigned order of the scenarios (China Scenario or ICSID
Scenario first). Controls include Male, Age, and Education.
28
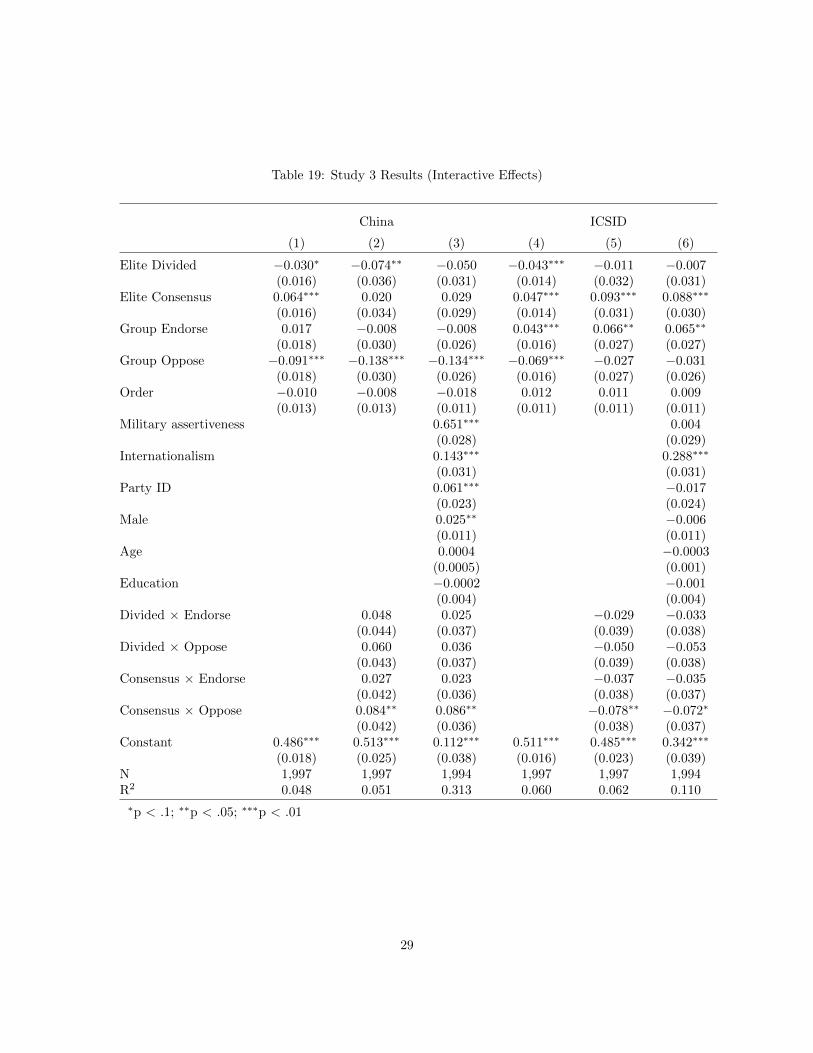
Table 19: Study 3 Results (Interactive Effects)
China ICSID
(1) (2) (3) (4) (5) (6)
Elite Divided −0.030∗ −0.074∗∗ −0.050 −0.043∗∗∗ −0.011 −0.007(0.016) (0.036) (0.031) (0.014) (0.032) (0.031)
Elite Consensus 0.064∗∗∗ 0.020 0.029 0.047∗∗∗ 0.093∗∗∗ 0.088∗∗∗
(0.016) (0.034) (0.029) (0.014) (0.031) (0.030)Group Endorse 0.017 −0.008 −0.008 0.043∗∗∗ 0.066∗∗ 0.065∗∗
(0.018) (0.030) (0.026) (0.016) (0.027) (0.027)Group Oppose −0.091∗∗∗ −0.138∗∗∗ −0.134∗∗∗ −0.069∗∗∗ −0.027 −0.031
(0.018) (0.030) (0.026) (0.016) (0.027) (0.026)Order −0.010 −0.008 −0.018 0.012 0.011 0.009
(0.013) (0.013) (0.011) (0.011) (0.011) (0.011)Military assertiveness 0.651∗∗∗ 0.004
(0.028) (0.029)Internationalism 0.143∗∗∗ 0.288∗∗∗
(0.031) (0.031)Party ID 0.061∗∗∗ −0.017
(0.023) (0.024)Male 0.025∗∗ −0.006
(0.011) (0.011)Age 0.0004 −0.0003
(0.0005) (0.001)Education −0.0002 −0.001
(0.004) (0.004)Divided × Endorse 0.048 0.025 −0.029 −0.033
(0.044) (0.037) (0.039) (0.038)Divided × Oppose 0.060 0.036 −0.050 −0.053
(0.043) (0.037) (0.039) (0.038)Consensus × Endorse 0.027 0.023 −0.037 −0.035
(0.042) (0.036) (0.038) (0.037)Consensus × Oppose 0.084∗∗ 0.086∗∗ −0.078∗∗ −0.072∗
(0.042) (0.036) (0.038) (0.037)Constant 0.486∗∗∗ 0.513∗∗∗ 0.112∗∗∗ 0.511∗∗∗ 0.485∗∗∗ 0.342∗∗∗
(0.018) (0.025) (0.038) (0.016) (0.023) (0.039)N 1,997 1,997 1,994 1,997 1,997 1,994R2 0.048 0.051 0.313 0.060 0.062 0.110
∗p < .1; ∗∗p < .05; ∗∗∗p < .01
29

Table 20: Study 3 Results among those who passed the manipulation check
China ICSID
(1) (2) (3) (4) (5) (6)
Elite Divided −0.041∗∗ −0.084∗∗ −0.048 −0.048∗∗∗ −0.016 −0.018(0.016) (0.037) (0.031) (0.015) (0.035) (0.034)
Elite Consensus 0.071∗∗∗ 0.033 0.044 0.063∗∗∗ 0.113∗∗∗ 0.111∗∗∗
(0.016) (0.035) (0.030) (0.015) (0.032) (0.031)Group Endorse 0.015 −0.007 −0.008 0.043∗∗∗ 0.066∗∗ 0.066∗∗
(0.018) (0.030) (0.025) (0.017) (0.027) (0.027)Group Oppose −0.098∗∗∗ −0.138∗∗∗ −0.134∗∗∗ −0.069∗∗∗ −0.027 −0.031
(0.018) (0.030) (0.025) (0.017) (0.027) (0.026)Order −0.013 −0.012 −0.017 0.010 0.008 0.005
(0.013) (0.013) (0.011) (0.012) (0.012) (0.012)Military Assertiveness 0.683∗∗∗ −0.016
(0.030) (0.031)Internationalism 0.133∗∗∗ 0.307∗∗∗
(0.032) (0.033)Party ID 0.051∗∗ −0.002
(0.024) (0.026)Male 0.024∗∗ −0.014
(0.011) (0.012)Age 0.0003 −0.0003
(0.001) (0.001)Education 0.001 0.001
(0.004) (0.004)Divided × Endorse 0.045 0.013 −0.031 −0.033
(0.045) (0.038) (0.042) (0.041)Divided × Oppose 0.061 0.033 −0.049 −0.048
(0.045) (0.038) (0.041) (0.040)Consensus × Endorse 0.028 0.023 −0.041 −0.040
(0.044) (0.037) (0.039) (0.038)Consensus × Oppose 0.067 0.072∗ −0.086∗∗ −0.086∗∗
(0.044) (0.037) (0.040) (0.039)Constant 0.491∗∗∗ 0.515∗∗∗ 0.107∗∗∗ 0.512∗∗∗ 0.486∗∗∗ 0.330∗∗∗
(0.019) (0.025) (0.038) (0.017) (0.023) (0.041)N 1,837 1,837 1,835 1,758 1,758 1,755R2 0.057 0.058 0.332 0.069 0.071 0.123
∗p < .1; ∗∗p < .05; ∗∗∗p < .01
30
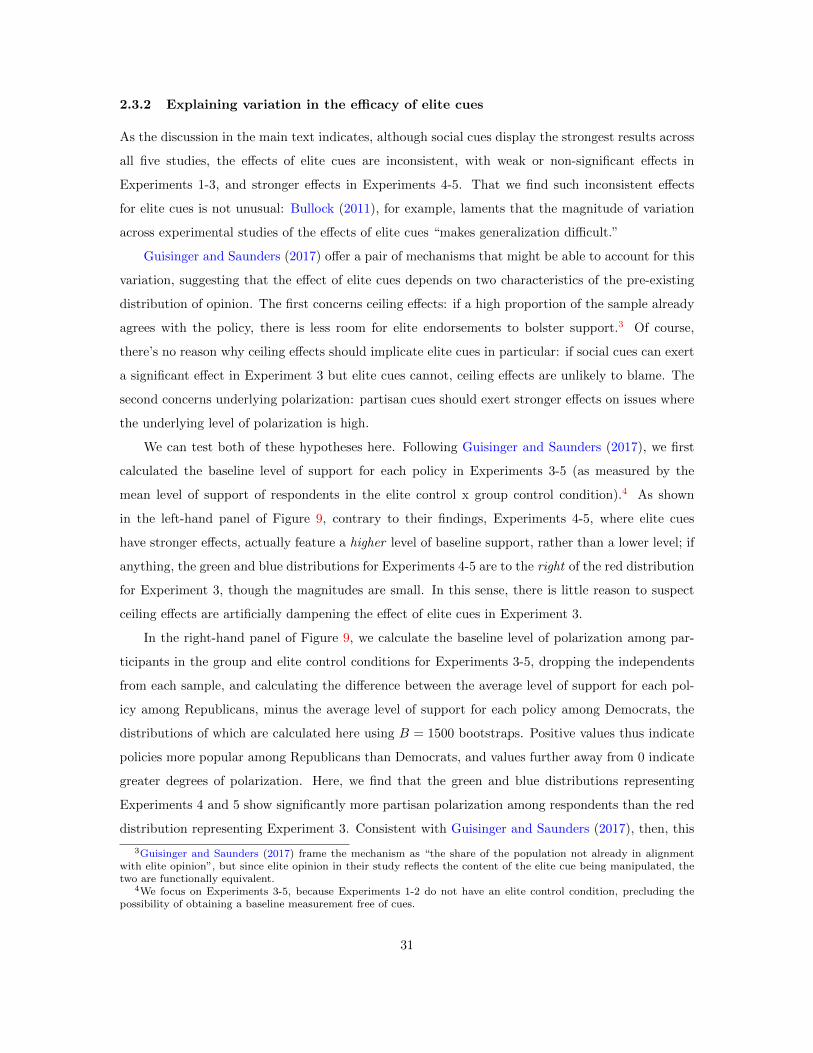
2.3.2 Explaining variation in the efficacy of elite cues
As the discussion in the main text indicates, although social cues display the strongest results across
all five studies, the effects of elite cues are inconsistent, with weak or non-significant effects in
Experiments 1-3, and stronger effects in Experiments 4-5. That we find such inconsistent effects
for elite cues is not unusual: Bullock (2011), for example, laments that the magnitude of variation
across experimental studies of the effects of elite cues “makes generalization difficult.”
Guisinger and Saunders (2017) offer a pair of mechanisms that might be able to account for this
variation, suggesting that the effect of elite cues depends on two characteristics of the pre-existing
distribution of opinion. The first concerns ceiling effects: if a high proportion of the sample already
agrees with the policy, there is less room for elite endorsements to bolster support.3 Of course,
there’s no reason why ceiling effects should implicate elite cues in particular: if social cues can exert
a significant effect in Experiment 3 but elite cues cannot, ceiling effects are unlikely to blame. The
second concerns underlying polarization: partisan cues should exert stronger effects on issues where
the underlying level of polarization is high.
We can test both of these hypotheses here. Following Guisinger and Saunders (2017), we first
calculated the baseline level of support for each policy in Experiments 3-5 (as measured by the
mean level of support of respondents in the elite control x group control condition).4 As shown
in the left-hand panel of Figure 9, contrary to their findings, Experiments 4-5, where elite cues
have stronger effects, actually feature a higher level of baseline support, rather than a lower level; if
anything, the green and blue distributions for Experiments 4-5 are to the right of the red distribution
for Experiment 3, though the magnitudes are small. In this sense, there is little reason to suspect
ceiling effects are artificially dampening the effect of elite cues in Experiment 3.
In the right-hand panel of Figure 9, we calculate the baseline level of polarization among par-
ticipants in the group and elite control conditions for Experiments 3-5, dropping the independents
from each sample, and calculating the difference between the average level of support for each pol-
icy among Republicans, minus the average level of support for each policy among Democrats, the
distributions of which are calculated here using B = 1500 bootstraps. Positive values thus indicate
policies more popular among Republicans than Democrats, and values further away from 0 indicate
greater degrees of polarization. Here, we find that the green and blue distributions representing
Experiments 4 and 5 show significantly more partisan polarization among respondents than the red
distribution representing Experiment 3. Consistent with Guisinger and Saunders (2017), then, this
3Guisinger and Saunders (2017) frame the mechanism as “the share of the population not already in alignmentwith elite opinion”, but since elite opinion in their study reflects the content of the elite cue being manipulated, thetwo are functionally equivalent.
4We focus on Experiments 3-5, because Experiments 1-2 do not have an elite control condition, precluding thepossibility of obtaining a baseline measurement free of cues.
31
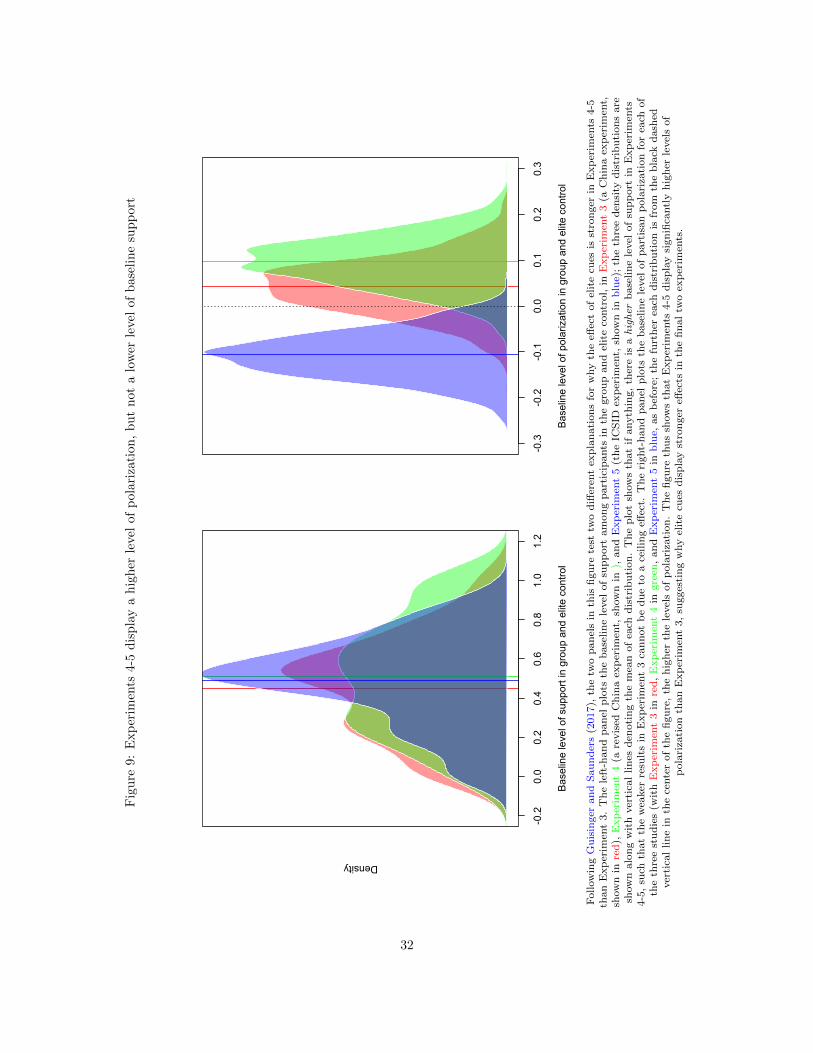
Fig
ure
9:E
xp
erim
ents
4-5
dis
pla
ya
hig
her
level
of
pola
riza
tion
,b
ut
not
alo
wer
leve
lof
base
lin
esu
pp
ort
Bas
elin
e le
vel o
f sup
port
in g
roup
and
elit
e co
ntro
l
Density
-0.2
0.0
0.2
0.4
0.6
0.8
1.0
1.2
Bas
elin
e le
vel o
f pol
ariz
atio
n in
gro
up a
nd e
lite
cont
rol
-0.3
-0.2
-0.1
0.0
0.1
0.2
0.3
Follow
ing
Gu
isin
ger
an
dS
au
nd
ers
(2017),
the
two
pan
els
inth
isfi
gu
rete
sttw
od
iffer
ent
exp
lan
ati
on
sfo
rw
hy
the
effec
tof
elit
ecu
esis
stro
nger
inE
xp
erim
ents
4-5
than
Exp
erim
ent
3.
Th
ele
ft-h
an
dp
an
elp
lots
the
base
lin
ele
vel
of
sup
port
am
on
gp
art
icip
ants
inth
egro
up
an
del
ite
contr
ol,
inE
xp
erim
ent
3(a
Ch
ina
exp
erim
ent,
show
nin
red
),E
xp
erim
ent
4(a
revis
edC
hin
aex
per
imen
t,sh
ow
nin
),an
dE
xp
erim
ent
5(t
he
ICS
IDex
per
imen
t,sh
ow
nin
blu
e);
the
thre
ed
ensi
tyd
istr
ibu
tion
sare
show
nalo
ng
wit
hver
tica
lli
nes
den
oti
ng
the
mea
nof
each
dis
trib
uti
on
.T
he
plo
tsh
ow
sth
at
ifanyth
ing,
ther
eis
ahigher
base
lin
ele
vel
of
sup
port
inE
xp
erim
ents
4-5
,su
chth
at
the
wea
ker
resu
lts
inE
xp
erim
ent
3ca
nn
ot
be
du
eto
ace
ilin
geff
ect.
Th
eri
ght-
han
dp
an
elp
lots
the
base
lin
ele
vel
of
part
isan
pola
riza
tion
for
each
of
the
thre
est
ud
ies
(wit
hE
xp
erim
ent
3in
red
,E
xp
erim
ent
4in
gre
en,
an
dE
xp
erim
ent
5in
blu
e,as
bef
ore
;th
efu
rth
erea
chd
istr
ibu
tion
isfr
om
the
bla
ckd
ash
edver
tica
llin
ein
the
cente
rof
the
figu
re,
the
hig
her
the
level
sof
pola
riza
tion
.T
he
figu
reth
us
show
sth
at
Exp
erim
ents
4-5
dis
pla
ysi
gn
ifica
ntl
yh
igh
erle
vel
sof
pola
riza
tion
than
Exp
erim
ent
3,
sugges
tin
gw
hy
elit
ecu
esd
isp
lay
stro
nger
effec
tsin
the
fin
al
two
exp
erim
ents
.
32

higher degree of polarization suggests one reason why elite cues display stronger effects in these two
experiments, which were fielded at the end of September during a highly polarizing Presidential
election. Indeed, at the end of the survey, one of our participants remarked how unusual it was for
Democrats and Republicans to be united on any given issue, rendering the elite consensus treatment
more costly than it would have been had the study been fielded further away from election day.
2.3.3 Subgroup analysis by trust and vote choice
Finally, Experiments 4-5 also allow us to offer further evidence in favor of our theoretical mechanisms.
One of our central critiques of top-down models of public opinion in foreign policy are that cues are
the most persuasive when they come from cuegivers you trust, and in an era when more Americans
are turning away from party politics (Krupnikov and Klar, 2016), trust in government is abysmally
low (Keele, 2007), and the most notable political events of the past year consist of populist anger
against the political establishment (whether manifested by Brexit, Donald Trump steamrolling his
way to the Republican nomination over the ardent objections of GOP elites, and so on), it seems
plausible that people might take cues from actors other than partisan political elites.
To seek additional evidence exploring our theoretical mechanisms, in Experiments 4-5 we in-
cluded a standard measure of trust in government borrowed from the American National Election
Survey (a sample item: “How much of the time do you think you can trust the government in Wash-
ington do do what is right—just about always, most of the time, or only some of the time?”). Given
that we were fielding our study a month out from a rather hotly contested Presidential election whose
contours have been shaped by anti-establishment sentiment, we also included a standard measure of
vote choice borrowed from a Bloomberg Politics poll (“If the general election were held today, and
the candidates were Hillary Clinton for the Democrats, Donald Trump for the Republicans, Gary
Johnson for the Libertarian Party, or Jill Stein for the Green Party, for whom would you vote?”). If
our theoretical story is correct, we should expect (i) respondents with less trust in government to be
less swayed by the elite cues in our experiment, and (ii) Donald Trump supporters to be less swayed
by the elite cues in our experiment, given the anger many of them tend to report about established
politicians on both sides in Washington.
Table 21 presents the results from a set of linear regression models estimating the effects of our
elite and social cue treatments for both the China and ICSID experiments, while also controlling
for the order in which the experiments were fielded to account for any potential order effects. The
first four columns in the table subset the sample by median-splitting the respondents into those
who express a low level of trust in government, compared to those who report a high level of trust
in government. The last four columns in the table subset the sample into those who reported
33
Table 21: Elite cues are three times stronger for Clinton supporters than Trump supporters
China ICSID China ICSIDLow trust High trust Low trust High trust Clinton Trump Clinton Trump
(1) (2) (3) (4) (5) (6) (7) (8)
Elite division −0.024 −0.047∗ −0.037∗∗ −0.068∗∗ −0.071∗∗∗ 0.041 −0.090∗∗∗ 0.057∗∗
(0.019) (0.027) (0.016) (0.026) (0.020) (0.031) (0.018) (0.029)Elite consensus 0.056∗∗∗ 0.112∗∗∗ 0.060∗∗∗ 0.003 0.088∗∗∗ 0.044 0.061∗∗∗ 0.056∗
(0.018) (0.029) (0.016) (0.027) (0.020) (0.031) (0.018) (0.029)Group endorse 0.004 0.058∗ 0.036∗∗ 0.074∗∗∗ 0.015 0.059∗ 0.050∗∗ 0.014
(0.021) (0.030) (0.018) (0.029) (0.023) (0.034) (0.020) (0.032)Group oppose −0.096∗∗∗ −0.065∗∗ −0.085∗∗∗ −0.019 −0.089∗∗∗ −0.062∗ −0.052∗∗∗ −0.114∗∗∗
(0.021) (0.031) (0.018) (0.028) (0.023) (0.034) (0.020) (0.032)Order −0.014 0.0001 0.016 −0.011 −0.011 −0.007 0.001 0.006
(0.015) (0.023) (0.013) (0.022) (0.017) (0.025) (0.015) (0.023)Constant 0.478∗∗∗ 0.502∗∗∗ 0.493∗∗∗ 0.572∗∗∗ 0.464∗∗∗ 0.568∗∗∗ 0.549∗∗∗ 0.463∗∗∗
(0.022) (0.031) (0.019) (0.030) (0.024) (0.035) (0.021) (0.033)N 1,512 481 1,512 481 1,003 543 1,003 543Adjusted R2 0.036 0.097 0.066 0.043 0.087 0.028 0.099 0.048
Max elite cue +8.0% +15.9% +9.7% +7.1% +15.8% +4.4% +15.1% +5.6%∗p < .1; ∗∗p < .05; ∗∗∗p < .01
an intention to vote for Hillary Clinton, and those who reported an intention to vote for Donald
Trump.5 For the China experiment, respondents with high levels of trust in government appear
to be more sensitive to elite cues than individuals with low trust in government; comparing the
elite consensus condition to the control, individuals who are high in trust in government display a
treatment effect roughly two times larger than individuals who are low in trust in government, a
statistically significant difference (p < 0.037). For the ICSID experiment, the differences in treatment
effects displayed between individuals with low and high trust are not statistically significant. When
we subset the results by vote choice, we find even more striking results. Here, a direct comparison
of the coefficients is somewhat more complex, because the treatment effects have different meanings
based on the subsample (e.g. for Trump supporters, the elite division treatment involves their
party being in favor and the outparty being opposed, while for Clinton supporters, the elite division
treatment involves their party being opposed and the outparty being in favor). Thus, we instead
calculate the maximum effect of elite cues within each subsample, by estimating the largest contrast
for each (thus, for Clinton supporters, the max elite cue effect is between elite division and elite
consensus; for Trump supporters, the max elite cue effect is between the elite control condition and
the elite consensus condition). Here, we find that elite cues display a maximum effect 3.6 times
bigger in the China experiment for Clinton supporters than for Trump supporters, and 2.7 times
bigger in the ICSID experiment for Clinton supporters than for Trump supporters.6 These results
5Johnson and Stein supporters are dropped from the analysis due to their small cell sizes.6Although it is plausible we would see larger cues for Trump supporters if we had a condition where elite Republicans
were explicitly opposed to the policy, given the magnitude of the other effect sizes, it is unlikely such a treatmentwould sufficiently narrow the gap; in the China experiment, for example, in order for elite cues to exert as large an
34
thus offer additional evidence in favor of the theoretical account we present here.
2.4 Salience of foreign policy during survey periods
A possible concern about our study is perhaps voters are not necessarily ignorant of foreign affairs,
but simply that these issues are less central to most citizens’ daily lives. To measure how salient
foreign policy issues were during the period of our survey we turn to the polling aggregator web-
site PollingReport.7 Going back to July of 2015-November 2016, terrorism or national security
consistently ranked among the most important issues facing Americans, behind only the economy.8
• CNN/ORC poll from July 22- 25, 2015 ranked terrorism 3rd (12%) and foreign policy 5th
(10%)
• Quinnipiac University. July 23-28, 2015 ranked terrorism 3rd (12%) and foreign policy 4th
(9%)
• ABC News/Washington Post Poll. November 16-19, 2015 ranked terrorism 2nd (29%)
• CBS News Poll. April 8-12, 2016 ranked terrorism/Islamic extremism/ISIS 2nd (9%)
• NBC News/Wall Street Journal Poll May 15-19, 2016 ranked 2nd (21%)
• ABC News/Washington Post Poll. Sept. 5-8, 2016 terrorism/national security ranked 2nd
(19%)
• CBS News/New York Times Poll. Sept. 9-13, 2016 national security, terrorism ranked 2nd
(29%)
• CBS News/New York Times Poll. Oct. 28-Nov. 1, 2016 national security, terrorism ranked
2nd (28%)
Furthermore, a Gallup poll from January 21-25 2016, showed that both Democrats (82%) and
Republicans (92%) ranked terrorism and national security as “extremely” or “very important.”9
In this sense, although foreign policy issues may not be the sole concern of the mass public, it
nonetheless looms larger than some of the more pessimistic takes of public opinion in foreign policy
would allege.
effect for Trump supporters as they do for Clinton supporters, the the effect of the Republican oppose/Democratssupport treatment compared to the elite control would have to be at least −11.4%; in comparison, the effect of elitedivision compared to the elite control is +4.1%, and the effect of elite consensus compared to the elite control is+4.4%.
7See http://www.pollingreport.com/prioriti.htm.8These contain every poll where national security or terrorism were mentioned.9See http://www.gallup.com/poll/188918/democrats-republicans-agree-four-top-issues-campaign.aspx
35
References
Aday, Sean. 2010. “Leading the charge: Media, elites, and the use of emotion in stimulating rallyeffects in wartime.” Journal of Communication 60 (3): 440–465.
Albertson, Bethany, and Shana Kushner Gadarian. 2016. “Did that Scare You? Tips on CreatingEmotion in Experimental Subjects.” Political Analysis Forthcoming.
Brader, Ted. 2005. “Striking a responsive chord: How political ads motivate and persuade voters byappealing to emotions.” American Journal of Political Science 49 (2): 388–405.
Braumoeller, Bear F. 2004. “Hypothesis testing and multiplicative interaction terms.” Internationalorganization 58 (04): 807–820.
Bullock, John G. 2011. “Elite Influence on Public Opinion in an Informed Electorate.” AmericanPolitical Science Review 105 (3): 496-515.
Freelon, Deen, Marc Lynch, and Sean Aday. 2015. “Online Fragmentation in Wartime: A Longitu-dinal Analysis of Tweets about Syria, 2011-2013.” Annals of the American Academy of Politicaland Social Science 659 (1): 166-179.
Gadarian, Shana Kushner. 2014. “Scary pictures: How terrorism imagery affects voter evaluations.”Political Communication 31 (2): 282–302.
Gentzkow, Matthew, and Jesse M. Shapiro. 2011. “Ideological Segregation Online and Offline.”Quarterly Journal of Economics 126 (4): 1799-1839.
Guisinger, Alexandra, and Elizabeth N. Saunders. 2017. “Mapping the Boundaries of Elite Cues:How Elites Shape Mass Opinion Across International Issues.” International Studies QuarterlyForthcoming.
Herrmann, Richard K., Philip E. Tetlock, and Penny S. Visser. 1999. “Mass Public Decisions toGo to War: A Cognitive-Interactionist Framework.” American Political Science Review 93 (3):553-573.
Holsti, Ole R. 2004. Public Opinion and American Foreign Policy. Revised edition ed. Ann Arbor,MI: University of Michigan Press.
Huckfeldt, Robert, Jeanette Morehouse Mendez, and Tracy Osborn. 2004. “Disagreement, Am-bivalence, and Engagement: The Political Consequences of Heterogeneous Networks.” PoliticalPsychology 25 (1): 65-95.
Jost, John T., Jaime L. Napier, Hulda Thorisdottir, Samuel D. Gosling, Tibor P. Palfai, and BrianOstafin. 2007. “Are Needs to Manage Uncertainty and Threat Associated With Political Conser-vatism or Ideological Extremity?” Personality and Social Psychology Bulletin 33 (7): 989-1007.
Kahneman, Daniel. 2011. Thinking, Fast and Slow. Macmillan.Keele, Luke. 2007. “Social Capital and the Dynamics of Trust in Government.” American Journal
of Political Science 51 (2): 241-254.Kertzer, Joshua D., and Kathleen M. McGraw. 2012. “Folk Realism: Testing the Microfoundations
of Realism in Ordinary Citizens.” International Studies Quarterly 56 (2): 245-258.Krupnikov, Yanna, and Samara Klar. 2016. Independent Politics: How American Disdain for PartiesLeads to Political Inaction. New York, NY: Cambridge University Press.
Lambert, Alan J., Laura D. Scherer, John Paul Schott, Kristina R. Olson, Rick K. Andrews,Thomas C. O’Brien, and Alison R. Zisser. 2010. “Rally Effects, Threat, and Attitude Change.”Journal of Personality and Social Psychology 98 (6): 886-903. 10.1037/a0019086.
Lerner, Jennifer S, Roxana M Gonzalez, Deborah A Small, and Baruch Fischhoff. 2003. “Effectsof Fear and Anger on Perceived Risks of Terrorism A National Field Experiment.” PsychologicalScience 14 (2): 144–150.
Mann, Christopher B., and Betsy Sinclair. 2013. “Voters Like You: Social Group Cuesin Behavior and Opinion.” Working paper. http://politics.as.nyu.edu/docs/IO/29116/
SocialGroupings_MannSinclair_03.23.13.pdf.McPherson, Miller, Lynn Smith-Lovin, and James M Cook. 2001. “Birds of a Feather: Homophily
in Social Networks.” Annual Review of Sociology 27: 415-444.
36

Wittkopf, Eugene R. 1990. Faces of internationalism: Public Opinion and American foreign policy.Duke University Press.
Zeitzoff, Thomas. 2014. “Anger, Exposure to Violence, and Intragroup Conflict: A “Lab in theField” Experiment in Southern Israel.” Political Psychology 35 (3): 309–335.
37