Embed Size (px)
Citation preview

Submitted 12 January 2016Accepted 26 April 2016Published 17 May 2016
Corresponding authorShunyi Li, [email protected]
Academic editorWalter van Gulik
Additional Information andDeclarations can be found onpage 13
DOI 10.7717/peerj.2045
Copyright2016 Zhu et al.
Distributed underCreative Commons CC-BY 4.0
OPEN ACCESS
A biofilter for treating toluene vapors:performance evaluation and microbialcounts behaviorYazhong Zhu, Shunyi Li, Yimeng Luo, Hongye Ma and Yan WangSchool of Chemical Engineering and Energy, Zhengzhou University, Zhengzhou, China
ABSTRACTA lab-scale biofilter packed with mixed packing materials was used for degradation oftoluene. Different empty bed residence times, 148.3, 74.2 and 49.4 s, were tested forinlet concentration ranging from 0.2 to 1.2 g/m3. The maximum elimination capacityof 36.0 g/(m3 h) occurred at an inlet loading rate of 45.9 g/(m3 h). The contributionof the lower layer was higher than other layers and always had the highest eliminationcapacity. The carbon dioxide production rate and distribution of micro-organismsfollowed toluene elimination capacities. The results of this study indicated that mixedpacking materials could be considered as a potential biofilter carrier, with low pressuredrop (less than 84.9 Pa/m), for treating air streams containing VOCs.
Subjects Bioengineering, Environmental Sciences, MicrobiologyKeywords Air treatment, Biofilter, Toluene, Inlet loading rate, Empty bed residence time
INTRODUCTIONLarge quantities of volatile organic compounds (VOCs) are emitted into the atmospherefromdifferent resources, such as chemical, petrochemical, pharmaceutical, food processing,pulp and paper mills, color printing, painting works, vehicle exhaust, waste incineratorsand composting facilities (Chen, Fang & Shu, 2005; Slominska, Krol & Namiesnik, 2013;Yassaa et al., 2006). Toluene is one of the common air pollutants in different industries.It is mutagenic and carcinogenic, and exposure to toluene might cause damage to theliver, kidney and the central nervous system (Gallastegui et al., 2011; Rene, Murthy &Swaminathan, 2005). According to the report of operating facilities in 2009, the rate oftoluene emission into the atmosphere was 12.2 kt/yr in the USA, and 3.9 kt/yr in Canada(Gallastegui et al., 2011).
Biofilters are widely used for odor and air pollution treatment, particularly for VOCswith high flow rates and pollutants concentration less than 1,000 ppm (Delhoménie et al.,2003a; Delhomenie et al., 2003b; El-Naas, Acio & El Telib, 2014; Maestre et al., 2007; Rahul,Mathur & Balomajumder, 2013a; Rahul, Mathur & Balomajumder, 2013b; Rene, Murthy &Swaminathan, 2009; Singh et al., 2010). Compared to conventional technology, bioflitersare cost competitive, with no secondary pollutants produced (Elmrini et al., 2004). Manyreferences show that toluene could be used as a biofilter’s substrate (Aly Hassan & Sorial,2009; Cho et al., 2009; Xi, Hu & Qian, 2006).
How to cite this article Zhu et al. (2016), A biofilter for treating toluene vapors: performance evaluation and microbial counts behavior.PeerJ 4:e2045; DOI 10.7717/peerj.2045

Table 1 Physical properties of the mixed packing materials.
Parameter Units Mixed packing materials
Equivalent diameter mm 10–12Bulk density kg/m3 471.0± 0.8Specific surface area m2/g 3.91± 0.20Void space volume % 38–41Water holding capacity % 52
Packing materials are where physical, chemical and biological reactions occur; thus, theproperties are concerned, such as high surface area and porosity for biofilm growth, suitablepH, acceptable buffering capacity (Mudliar et al., 2010; Zare et al., 2012) and benign water-holding capacity (Anet et al., 2013). Peat, soil, compost, barks and wood chips are thecommonly used organic medias (Lebrero et al., 2014). Lifespans of such organic mediasare short, and may cause clogging in the long run (Dorado et al., 2010). Other mediasuch as perlite, vermiculite, glass beads, polyurethane foam, polystyrene and lava rock,may have indigenous micro-organisms and need extra nutrients (Mudliar et al., 2010).
Singh, Rai & Upadhyay (2010) evaluated the performance of a biofilter treating toluenepacked with polyurethane foam. The removal efficiency ranged from 68.2 to 99.9% andelimination capacity ranged from 10.85 to 90.48 g/(m3 h). The removal efficiency rangedfrom 40 to 95% and elimination capacity ranged from 3.5 to 128 g/(m3 h) was observedby (Rene, Murthy & Swaminathan, 2005). However, few researchers focused on how thebehaviors of different layers contributed to the overall performance, and if the relationbetween the microbial counts and the inlet loading rate were clear.
The main objective of this research was to determine the removal efficiency and elimina-tion capacity of different layers as a function of inlet loading rate and empty bed residencetime in a lab scale biofilter. The production of carbon dioxide and the microbial countsof three layers were also evaluated, and the variation of the pressure drops was observed.
MATERIALS AND METHODInoculum and packing materialThe inert material employed in the biofilter was invented by this lab (China inventionpatent, ZL201210446960.1), and was mixed by compost, cement, perlite, CaCO3, plantfiber, etc. Sodium silicate was used as adhesive. The physical properties were summarizedin Table 1. Fresh activated sludge was used as the inoculum source for the biofiter,which was obtained from a municipal wastewater treatment plant in Zhengzhou, China.Microorganisms in the activated sludge were acclimated to toluene in order to acceleratethe adaptation period. For acclimation, one liter of the activated sludge was enclosed in anaerated tank and diluted with 3 L of nutrient solution (Amin et al., 2014). The compositionof nutrient solution per liter of distilledwater was: K2HPO4-0.11 g, KH2PO4-0.04 g, NH4Cl-0.54 g, MgSO4-0.067 g, CaCl2-0.036 g, FeCl3-0.25 mg, MnSO4-0.03 mg, ZnSO4-0.04 mg,(NH4)6Mo7O24 ·4H2O-0.03 mg.
Zhu et al. (2016), PeerJ, DOI 10.7717/peerj.2045 2/17

Air
Air
Flow meter
Humidification bottle
Toluene Mixing chamber
Outlet Port 1
Inlet Port
Spray header
Nutrients Tank
Peristaltic pump
Flow meter
Outlet Port 2
Outlet Port 3
Figure 1 Schematic diagram of the biofilter system.
Biofilter setup and operation conditionsThe biofilter was constructed from plexiglas cylinders with an internal diameter of 105mm,and a total bed height of 90 mm, which was divided into three same sections. The total bedvolume was approximately 8.24 L. Figure 1 shows the schematic diagram of the biofiltersystem. Toluene (99.5% ARGrade; Kemel, Shanghai, China) was stripped with compressedair. The biofilter was operated in an up-flowmode at room temperature. The concentrationof pollutants was fixed by means of flowmeters (all from Yuyao Kingtai instrument Co.,Zheijing, China).
The operating conditions of the biofilter are summarized in Table 2. During the study,different inlet loading rates (ILR), 5.0 ± 1.0, 15.2 ± 1.8, 25.6 ± 2.9, 34.4 ± 2.0, 44.5 ± 1.5and 61.1 ± 5.0 g/(m3 h), were set up at an empty bed residence time (EBRT) of 74.2 s.Experiments at EBRTs of 148.3 s and 49.4 s were also carried out, at ILRs of 24.4 ± 2.9and 25.3 ± 2.6 g/(m3 h), respectively. At each stage, inlet concentration of toluene waskept constant, and the biofilter was operated until pseudo steady-state when removalefficiency was constant. Microbial cell counts and carbon dioxide concentrations measuredsimultaneously. In order to insure satisfactory conditions of moisture and nutrients formicroorganism activities, the nutrient solution was sprayed at a flow rate of 20 ml/minfor 30 min every day, on the top of the packing media through the nutrient distributionsystem using a peristaltic pump.
Zhu et al. (2016), PeerJ, DOI 10.7717/peerj.2045 3/17

Table 2 Operating conditions of the biofilter.
Phase ofoperation
Gas flowrate (m3/h)
Inlet concentration(g/m3)
EBRT (s) ILR (g/(m3 h)) Operationtimes (days)
0.10± 0.02 5.0± 1.0 70.31± 0.04 15.2± 1.8 70.53± 0.06 25.6± 2.9 70.71± 0.04 34.4± 2.0 70.92± 0.03 44.5± 1.5 8
Phase I 0.2
1.26± 0.10
74.2
61.1± 5.0 100.1 0.53± 0.08 148.3 24.4± 2.9 7
Phase II0.4 0.36± 0.05 49.4 25.3± 2.6 10
Analytical methodsToluene concentration in the gas phase wasmeasured using a gas chromatograph (GC1120;Sunny Hengping, China) equipped with a flame ionization detector (FID) and a FFAPchromatographic column (30 m × 0.25 mm × 0.25 µm; Nanjingjianuo, China). Thenitrogen was used as a carrier gas at a flow rate of 0.4 ml/min. The oven, injector and FIDdetector was maintained at 65, 150 and 250◦, respectively.
The pressure drop and temperature were measured by means of testo 510 and testo405-V1 (Testo AG, Germany), respectively. The Moisture Content of packing materialswas determined by the weight loss method after drying 12 h at 105 ◦C.
Carbon dioxide concentration in the gas phase was determined by the capacity titrationmethod. CO2 was first absorbed into Ba(OH)2 solution (1.4 g/L), with an atmospheresampler (QC-2B; Beijing Municipal Institute of Labor Protection, China). A 25 mL ofthe solution was titrated by CH3COOH solution (0.6 g/L), and phenolphthalein was usedas indicator.
Microbial cell counts were measured by taken 1 g of moist media materials from threedifferent locations at each layer of the biofilter. Each sample was mixed with 9 ml sterileextraction buffer (0.9% NaCl). The samples were subsequently shaken vigorously for30 min, and serially diluted with sterilized water. Finally, 1 mL solution was plated in anutrient agar for isolation of bacteria (Rene, Murthy & Swaminathan, 2009; Saravanan &Rajamohan, 2009). The composition of nutrient agar per liter was as follows: peptone-5 g,yeast extract-2.5 g, glucose-1.0 g and agar-15 g. The colonies were incubated for 3 days at30 ◦C before counted.
Performance evaluationThe parameters of the biofilter performance are illustrated in Table 3. The results areexpressed in terms of inlet loading rate, elimination capacity and removal efficiency. Datafrom daily measurements were used to obtain average values of the biofilter.
RESULTS AND DISCUSSIONInfluence of toluene inlet concentrationEC and RE of toluene as a function of ILR, during the Phase I, are illustrated in Fig. 2.ILR was gradually increased from 5.0 to 61.1 g/(m3 h). RE was almost constantly with the
Zhu et al. (2016), PeerJ, DOI 10.7717/peerj.2045 4/17

Table 3 Definition of biofilter performance parameters.
Parameter Definition Units
Empty bed residence time EBRT= VQ s
Inlet loading rate ILR= Q×CinV g/(m3 h)
Elimination capacity EC= Q×(Cin−Cout)V g/(m3 h)
Removal efficiency RE= Cin−CoutCin×100 %
Carbon dioxide production rate PCO2 =Q×(Cout,CO2−Cin,CO2 )
V g/(m3 h)
Notes.Where Q is the total air flow rate (m3/h); V is the empty bed volume (m3); Cin and Cout are the inlet and outlet concentrationof toluene, respectively. Cin,CO2 and Cout,CO2 are the inlet and out concentration of carbon dioxide.
Table 4 Comparison of biofilter performance.
References Pollutants Packing media EBRT (s) ECmax
(g/(m3 h))RE ofECmax (%)
Micro-organisms
Zamir, Halladj & Nasernejad (2011) Toluene Compost and lava 264 1.9 92 FungiToluene 40.3 69.6
Gallastegui et al. (2011)p-xylene
Small stones 18026.5 40.0
Bacteria
Singh, Rai & Upadhyay (2006) Toluene Agro waste 154 174.6 59.8 Activated sludgeThis work Toluene Mixed media 74.2 36.0 78.4 Activated sludge
increased of ILR up to 34.4 g/(m3 h); then it decreased. The corresponding EC was linearlyincreased with ILR from 5.0 to 34.4 g/(m3 h). Maximum EC was 36.0 g/(m3 h) occurredat an ILR of 45.9 g/(m3 h). After that the EC decreased, and RE was only 50.6% under anILR of 61.1 g/(m3 h). Two distinct zones were observed in the RE versus ILR graph. Theresults obtained above were in agreement with Singh et al. (2010), Elmrini et al. (2004) andKiared et al. (1997). Comparison of biofilter performance is given in Table 4.
Zamir and colleagues investigated a compost biofilter treating toluene vapor; maximumRE and EC was 92% and 1.9g/(m3 h), respectively. The ECmax was far less than thisstudy; this might be explained by the biofilter they used was dominated by the white-rotfungus. Gallstegui and colleagues evaluated biofiltration of toluene and p-xylene; ECmax
of 40.3 g/(m3 h) was observed. The reasons for their better performance could be that thelonger operation of EBRT and the existence of p-xylene may stimulate the degradation oftoluene. Singh and colleagues got a higher ECmax of 174.6 g/(m3 h); however, the RE wasmuch lower.
Influence of gas flow rateThe gas flow rate is an important parameter in biofilter operation. Three levels of gas flowrate, i.e., 0.1, 0.2 and 0.4 m3/h, were performed. RE and EC as a function of EBRT areshown in Fig. 3. ILR of 148.3, 74.2 and 49.4s were set at the same levels, which were 24.4,25.6 and 25.3g/(m3 h), respectively. Depending on Fig. 3, when EBRT decreased from148.3 to 74.2 s, biofilter maintained high RE. However, when EBRT decreased to 49.4 s,RE decreased to 71.0%; this might be because reduction in the contaminant retention timecould not provide sufficient time for toluene to transfer into biofilm. The results were
Zhu et al. (2016), PeerJ, DOI 10.7717/peerj.2045 5/17

Figure 2 Influence of inlet loading rate on the elimination capacity (A) and removal efficiency (B) ofthe biofilter at an EBRT of 74.2 s.
coordinated with the findings of some literature; biofilter performance decreased withdecreasing EBRTs (Abumaizar, Kocher & Smith, 1998; Rene et al., 2012).
Evaluation of CO2Toluene was finally biodegraded to CO2 and H2O, and utilized to format biomass formicrobial growth (Andreoni & Gianfreda, 2007); thus, monitoring CO2 concentrationprovided valuable information for the degree of VOCs mineralization. The stoichiometricreaction of toluene oxidation can be written as follows:
C7H8+9O2→ 7CO2+4H2O. (1)
Zhu et al. (2016), PeerJ, DOI 10.7717/peerj.2045 6/17

Figure 3 Influence of EBRT on removal efficiency and elimination capacity.
PCO2 during Phase I as a function of EC for toluene is shown in Fig. 4. The PCO2 wasconcluded to linearly increase along with the EC at Phase I. A linear regression, calculatedaccording to the least square method, provided the following equations for toluenedegradation:
PCO2 = 1.45EC−1.23. (2)
The mass-ratio of PCO2 to EC of toluene was 1.45, less than the theoretical calculation.The theoretical mass-ratio should be 3.35, when the toluene was totally oxidation to H2OandCO2.Gallastegui et al. (2013) reported the biodegradation of ethylbenzene and toluene.According to their study, linear fits to experimental data was made, and mass-ratios ofethylbenzene and toluene were 1.36 and 2.84, respectively. Cheng and colleagues (2016)reported biodegradation of toluene in fungal biofilter (F-BF), bacterial biofilters (B-BF)and fungal & bacterial biofilters (F & B-BF). The mass-ratio of F-BF, F & B-BF, and B-BFwas 1.23, 2.52, and 2.85, respectively.
The cause of discrepancy might be that the biodegradation of toluene took somesteps to convert into biomass or product CO2, and some intermediates may not degradeimmediately. In addition, some of the CO2 could accumulate in the liquid in other forms,such as CO2−
3 , HCO−3 and H2CO3 (Wu et al., 2006).
Evaluation of different layersThe biofilter was subdivided into three identical layers; gas samples were collected fromeach port of the biofilter. In order to have an insight into the contribution of different layerto its overall performance, the RE and EC of the three layers as a function of ILR is shownin Fig. 5.
Zhu et al. (2016), PeerJ, DOI 10.7717/peerj.2045 7/17

Figure 4 Carbon dioxide production rate as a function of EC for toluene.
Results illustrated that contributions changed depending on ILRs. As ILR increased,the RE of the lower layer decreased from 85.1 to 21.5%; while the middle layer improvedfrom 7.5 to 29.4 (at an ILR of 25.6 g/(m3 h)) then decreased to 16.2%; and the upperlayer improved from 2.7 to 29.0 (at an ILR of 34.4 g/(m3 h)) then decreased to 12.9%. Atlow ILR, RE was mostly contributed by the lower layer. The majority of the toluene wereeliminated in the lower layer; only a small portion of toluene was offered to the middleand upper layers. When at a higher ILR, the toluene cannot be completely degraded by thelower layer, and the rest flowed into other two layers. However, the EC of the lower layerwas still higher than other layers. The cause of the EC in the lower layer was always thehighest, may be due to the higher microbial population and nutrients.
Similar results were noted in other researches (Elmrini et al., 2004; Vergara-Fernandezet al., 2007). Rene et al. (2015) studied the performance of a biofilter treating benzene andtoluene, in an up-flow mode (same with the study). However, the results showed that theelimination of toluene was mostly occurred at the topside of the biofiter, which was notconfirmed by the results in this study. This may be due to the biofiter used in that studywas first to treat benzene, whereas the biofilter in this study used was only to treat toluene.
The carbon dioxide production rate at the three layers as a function of EBTT is shownin Fig. 6. From Fig. 6, it was clear that the highest EBRT the highest carbon dioxideconcentration, since the micro-organism at this moment could obtain large amounts ofcontaminants. The carbon dioxide generated by the lower layer preceded the other twolayers at the three EBRTs, and this was in accordance with the lower layer had largerelimination capacity of the results got above.
Zhu et al. (2016), PeerJ, DOI 10.7717/peerj.2045 8/17

Figure 5 Comparison of removal efficiency (A) and elimination capacity (B) among the three layers atvarious inlet loading rate.
Microbial counts behaviorAccording to the results of the microbial cell counts, there were mainly three kind ofmicro-organism, one kind of fungi and two kinds of bacteria. The fungus was white andfilamentous, and the microbial count versus time is shown in Fig. 7. The microbial countof the two bacteria—one bacterium was pale yellow named bacterium-A, the other onewas pinky named bacterium-B—versus time is shown in Fig. 8.
At the beginning of the operation, the microbial count of fungi at the three layers wasat the same level, which was less than 103 CFU/g. Then, it gradually increased to about3.5×105 CFU/g at the lower layer, 3×10⁴ CFU/g at middle layer, 6×10³ CFU/g at the
Zhu et al. (2016), PeerJ, DOI 10.7717/peerj.2045 9/17
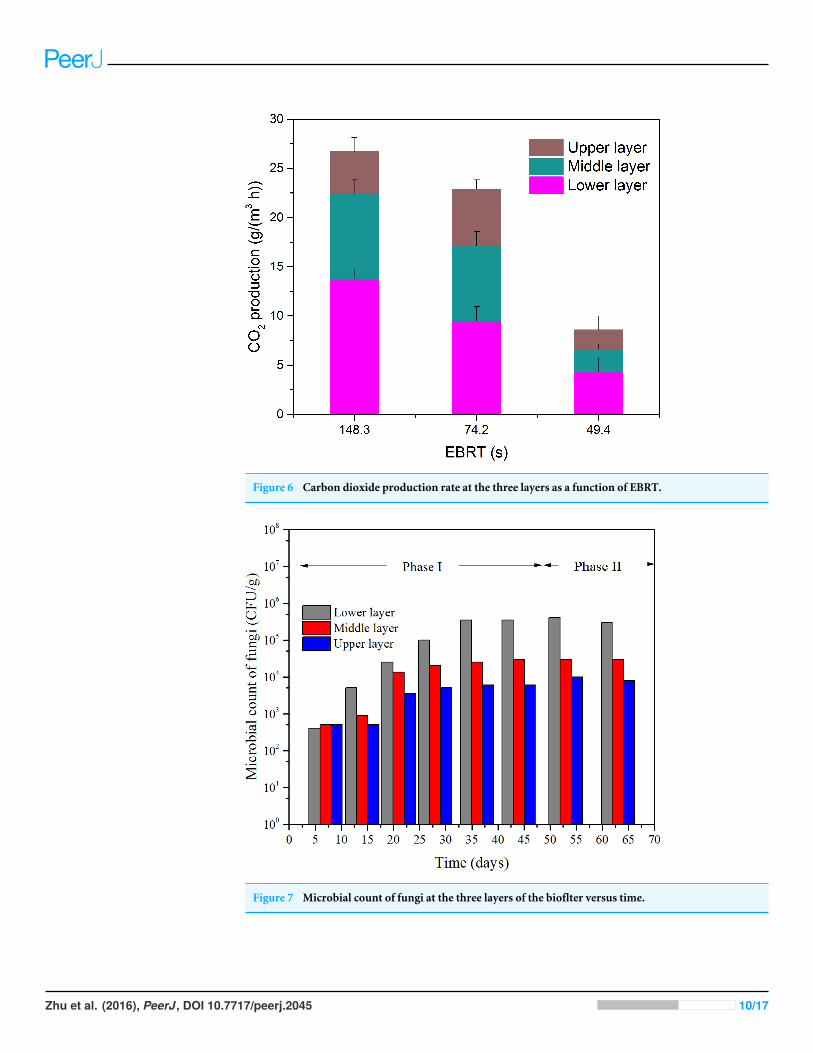
Figure 6 Carbon dioxide production rate at the three layers as a function of EBRT.
Figure 7 Microbial count of fungi at the three layers of the bioflter versus time.
Zhu et al. (2016), PeerJ, DOI 10.7717/peerj.2045 10/17

Figure 8 Microbial counts of bacterium-A (A) and bacterium-B (B) at the three layers versus time.
upper layer, respectively, at the 36th day which the ILR was 44.5g/(m3 h). The count ofbacterium-A had the similar trend with fungi; however, the differences were the initialcounts at the three layers were a little more than 104 CFU/g and the maximum numberoccurred in the 28th day at an ILR of 34.4 g/(m3 h).
However, when compared to bacterium-B, it showed some differences. Initially, countof bacterium-B was close to bacterium-A, 4.5×10³ CFU/g in the lower layer, 3×10³ CFU/gin the middle layer, 6×10² CFU/g in the upper layer, respectively. The count increasedwith the increase of the ILR, then maintained stability, which was similar with fungi andbacterium-A. However, for most of the time the microbial count of the upper layer was
Zhu et al. (2016), PeerJ, DOI 10.7717/peerj.2045 11/17

Figure 9 Pressure drop versus time at various phase.
higher than that of the other two layers, and a maximum value of 8×10² CFU/g wasachieved at an ILR of 44.5 g/(m3 h).
Both the microbial counts of the fungi and the bacteria were depended on ILR, whichdemonstrated that the micro-organisms were fed on the contaminants. The trend of themicro-organisms at different layers under various ILRs was consistent with the trend ofRE and EC. According to Gallastegui et al. (2013), the microbial population and reactioncapacity remained low at the lower layer, this was consistent with bacterium-B, however,but was not consistent with the trends of the fungi and bacterium-A. In their study, theconcentration of the contaminant could achieve to 8.72 g/m3, because that the lower layerhad the highest microbial population. The reason bacterium-B was higher at the upperlayer may be that it was more sensitive to the concentration of the contaminant. The resultsof Saravanan & Rajamohan (2009) showed that the removals were more efficient in thelower layer which was consistent with the results got here.
Behavior of the pressure dropPressure drop of the biofilter depends on many factors. The gas flow rate directly decidedthe velocity of the gas; the bigger the gas flow rate, the higher the pressure drop. Secondwas the media properties which include media size, porosity, depth and moisture content(Singh, Agnihotri & Upadhyay, 2006), Besides, the biomass accumulation in the biofiltermay lead to changes in media bed characteristics, which may cause channel diminished,thus increased pressure drop (Morgan-Sagastume, Sleep & Allen, 2001). The pressure dropversus time is shown in Fig. 9.
Zhu et al. (2016), PeerJ, DOI 10.7717/peerj.2045 12/17
The initial pressure drop during phase I was about 20 Pa/m, then increased slowly withthe operation time, and finally achieved a steady state about 43 Pa/m. During phase II,the pressure drop decreased to nearly 30 Pa/m with the doubled EBRT, then increased to81 Pa/m at an EBRT of 49.4 s; the sudden increase of pressure drop was due to reduction ofEBRT. During phase I, the gas flow rate was maintained constant; thus, the increase of thepressure drops was mainly due to biomass accumulation. In addition, the bed compactionand deterioration was observed negligible, which indicated the mixed packing material hada good mechanical strength. The maximum value of the pressure drops was 84.9 Pa/m,which was significantly advanced to some organic materials for wood chips with a pressuredrop of 2,600 Pa/m (Morgan-Sagastume, Sleep & Allen, 2001), and matured compost witha pressure drop of 264.8 Pa/m (Delhoménie et al., 2003a; Delhomenie et al., 2003b).
CONCLUSIONIn this paper, toluene was treated with an up-flow lab scale biofilter filled with inertpacking materials. The ECmax was observed at an inlet loading rate of 45.9 g/(m3 h), andtwo distinct zones were also observed. During the whole operation, the highest EC appearedat the lower layer. The CO2 production rate and the distribution of microbial populationsin the biofilter were well correlated with the toluene removal efficiencies and eliminationcapacities, indicating the biodegradation of toluene in the biofilter. The low pressure dropdemonstrated that the packing materials were proper for biofiltration.
ADDITIONAL INFORMATION AND DECLARATIONS
FundingFinancial support was provided by the National Natural Science Foundation of China(NO.U1304216), the Research Fund of Yong Scholars for the Doctoral Program ofHigher Education of China (Grant No. 20124101120015), and the Foundation of He’nanEducational Committee (Grant No. 13A610689). The funders had no role in study design,data collection and analysis, decision to publish, or preparation of the manuscript.
Grant DisclosuresThe following grant information was disclosed by the authors:National Natural Science Foundation of China: U1304216.Research Fund of Yong Scholars for the Doctoral Program of Higher Education of China:20124101120015.Foundation of He’nan Educational Committee: 13A610689.
Competing InterestsThe authors make use of (and report on the performance of) a patent which was inventedby our lab at the School of Chemical Engineering and Energy, Zhengzhou University,China.
Zhu et al. (2016), PeerJ, DOI 10.7717/peerj.2045 13/17
Author Contributions• Yazhong Zhu conceived and designed the experiments, performed the experiments,analyzed the data, contributed reagents/materials/analysis tools, wrote the paper,prepared figures and/or tables, reviewed drafts of the paper.• Shunyi Li conceived and designed the experiments, reviewed drafts of the paper.• Yimeng Luo and Hongye Ma reviewed drafts of the paper.• Yan Wang contributed reagents/materials/analysis tools.
Patent DisclosuresThe following patent dependencies were disclosed by the authors:
Patent: Functional microbe filling material embedded with slow-release compositeand its preparation method; Owners: Shunyi LI, Rencheng Zhu, Yan Wang, Yali Zhang;ZL201210446960.1.
Data AvailabilityThe following information was supplied regarding data availability:
The raw data has been supplied as Data S1.
Supplemental InformationSupplemental information for this article can be found online at http://dx.doi.org/10.7717/peerj.2045#supplemental-information.
REFERENCESAbumaizar RJ, KocherW, Smith EH. 1998. Biofiltration of BTEX contaminated air
streams using compost-activated carbon filter media. Journal of Hazardous Materials60:111–126 DOI 10.1016/S0304-3894(97)00046-0.
Aly Hassan A, Sorial G. 2009. Biological treatment of benzene in a controlled trickle bedair biofilter. Chemosphere 75:1315–1321 DOI 10.1016/j.chemosphere.2009.03.008.
AminMM, Rahimi A, Bina B, Heidari M, Moghadam FM. 2014. Performance evaluationof a scoria-compost biofilter treating xylene vapors. Journal of Environmental HealthScience and Engineering 12:1 DOI 10.1186/s40201-014-0140-4.
Andreoni V, Gianfreda L. 2007. Bioremediation and monitoring of aromatic-pollutedhabitats. Applied Microbiology and Biotechnology 76:287–308DOI 10.1007/s00253-007-1018-5.
Anet B, Couriol C, Lendormi T, Amrane A, Le Cloirec P, Cogny G, Fillières R.2013. Characterization and selection of packing materials for biofiltrationof rendering odourous emissions.Water, Air, & Soil Pollution 224:1–13DOI 10.1007/s11270-013-1622-1.
Chen CL, Fang HY, Shu CM. 2005. Source location and characterization of volatileorganic compound emissions at a petrochemical plant in Kaohsiung, Taiwan. Journalof the Air & Waste Management Association 55:1487–1497DOI 10.1080/10473289.2005.10464741.
Zhu et al. (2016), PeerJ, DOI 10.7717/peerj.2045 14/17

Cheng Z, Lu L, Kennes C, Yu J, Chen J. 2016. Treatment of gaseous toluene inthree biofilters inoculated with fungi/bacteria: microbial analysis, performanceand starvation response. Journal of Hazardous Materials 303:83–93DOI 10.1016/j.jhazmat.2015.10.017.
Cho E, Galera MM, Lorenzana A, ChungW-J. 2009. Ethylbenzene, o-Xylene, andBTEX Removal by Sphingomonas sp. D3K1 in Rock Wool-Compost Biofilters.Environmental Engineering Science 26:45–52 DOI 10.1089/ees.2007.0144.
Delhoménie M-C, Bibeau L, Gendron J, Brzezinski R, Heitz M. 2003a. A study of clog-ging in a biofilter treating toluene vapors. Chemical Engineering Journal 94:211–222DOI 10.1016/S1385-8947(03)00052-4.
Delhomenie MC, Bibeau L, Gendron J, Brzezinski R, Heitz M. 2003b. Degradationof toluene, xylene, and trimethyl benzene vapors by biofiltration: a comparison.Journal of the Air & Waste Management Association 53:217–226DOI 10.1080/10473289.2003.10466137.
Dorado AD, Lafuente FJ, Gabriel D, Gamisans X. 2010. A comparative study based onphysical characteristics of suitable packing materials in biofiltration. EnvironmentalTechnology 31:193–204 DOI 10.1080/09593330903426687.
El-Naas MH, Acio JA, El Telib AE. 2014. Aerobic biodegradation of BTEX: progressesand prospects. Journal of Environmental Chemical Engineering 2:1104–1122DOI 10.1016/j.jece.2014.04.009.
Elmrini H, Bredin N, Shareefdeen Z, Heitz M. 2004. Biofiltration of xylene emissions:bioreactor response to variations in the pollutant inlet concentration and gas flowrate. Chemical Engineering Journal 100:149–158 DOI 10.1016/j.cej.2004.01.030.
Gallastegui G, Avalos Ramirez A, Elias A, Jones JP, Heitz M. 2011. Performance andmacrokinetic analysis of biofiltration of toluene and p-xylene mixtures in a conven-tional biofilter packed with inert material. Bioresource Technology 102:7657–7665DOI 10.1016/j.biortech.2011.05.054.
Gallastegui G, Barona A, Rojo N, Gurtubay L, Elías A. 2013. Comparative responseof two organic biofilters treating ethylbenzene and toluene after prolonged exposure.Process Safety and Environmental Protection 91:112–122DOI 10.1016/j.psep.2011.11.006.
Kiared K,Wu G, Beerli M, Rothenbühler M, Heitz M. 1997. Application of biofil-tration to the control of VOC emissions. Environmental Technology 18:55–63DOI 10.1080/09593331808616512.
Lebrero R, Estrada JM, Munoz R, Quijano G. 2014. Deterioration of organic packingmaterials commonly used in air biofiltration: effect of VOC-packing interactions.Journal of Environmental Management 137:93–100DOI 10.1016/j.jenvman.2013.11.052.
Maestre JP, Gamisans X, Gabriel D, Lafuente J. 2007. Fungal biofilters for toluenebiofiltration: evaluation of the performance with four packing materials underdifferent operating conditions. Chemosphere 67:684–692DOI 10.1016/j.chemosphere.2006.11.004.
Zhu et al. (2016), PeerJ, DOI 10.7717/peerj.2045 15/17

Morgan-Sagastume F, Sleep BE, Allen DG. 2001. Effects of biomass growth on gaspressure drop in biofilters. Journal of Environmental Engineering-Asce 127:388–396DOI 10.1061/(ASCE)0733-9372(2001)127:5(388).
Mudliar S, Giri B, Padoley K, Satpute D, Dixit R, Bhatt P, Pandey R, Juwarkar A,Vaidya A. 2010. Bioreactors for treatment of VOCs and odours—a review. Journalof Environmental Management 91:1039–1054 DOI 10.1016/j.jenvman.2010.01.006.
Rahul, Mathur AK, Balomajumder C. 2013a. Biological treatment and modelingaspect of BTEX abatement process in a biofilter. Bioresource Technology 142:9–17DOI 10.1016/j.biortech.2013.05.005.
Rahul, Mathur AK, Balomajumder C. 2013b. Performance evaluation and model anal-ysis of BTEX contaminated air in corn-cob biofilter system. Bioresource Technology133:166–174 DOI 10.1016/j.biortech.2013.01.087.
Rene ER, Kar S, Krishnan J, Pakshirajan K, LopezME, Murthy DV, SwaminathanT. 2015. Start-up, performance and optimization of a compost biofilter treatinggas-phase mixture of benzene and toluene. Bioresource Technology 190:529–535DOI 10.1016/j.biortech.2015.03.049.
Rene ER, Mohammad BT, Veiga MC, Kennes C. 2012. Biodegradation of BTEX ina fungal biofilter: influence of operational parameters, effect of shock-loads andsubstrate stratification. Bioresource Technology 116:204–213DOI 10.1016/j.biortech.2011.12.006.
Rene ER, Murthy D, Swaminathan T. 2005. Performance evaluation of a compostbiofilter treating toluene vapours. Process Biochemistry 40:2771–2779DOI 10.1016/j.procbio.2004.12.010.
Rene ER, Murthy DVS, Swaminathan T. 2009. Steady- and transient-state effectsduring the biological oxidation of gas-phase benzene in a continuously operatedbiofilter. Clean Technologies and Environmental Policy 12:525–535DOI 10.1007/s10098-009-0257-9.
Saravanan V, Rajamohan N. 2009. Treatment of xylene polluted air using press mud-based biofilter. Journal of Hazardous Materials 162:981–988DOI 10.1016/j.jhazmat.2008.05.158.
Singh RS, Agnihotri SS, Upadhyay SN. 2006. Removal of toluene vapour usingagro-waste as biofilter media. Bioresource Technology 97:2296–2301DOI 10.1016/j.biortech.2005.10.036.
Singh RS, Rai BN, Upadhyay SN. 2006. Performance evaluation of an agro wastebased biofilter treating toluene vapours. Environmental Technology 27:349–357DOI 10.1080/09593332708618649.
Singh RS, Rai BN, Upadhyay SN. 2010. Removal of toluene vapour from air streamusing a biofilter packed with polyurethane foam. Process Safety and EnvironmentalProtection 88:366–371 DOI 10.1016/j.psep.2010.06.001.
Singh K, Singh RS, Rai BN, Upadhyay SN. 2010. Biofiltration of toluene usingwood charcoal as the biofilter media. Bioresource Technology 101:3947–3951DOI 10.1016/j.biortech.2010.01.025.
Zhu et al. (2016), PeerJ, DOI 10.7717/peerj.2045 16/17

SlominskaM, Krol S, Namiesnik J. 2013. Removal of BTEX compounds from wastegases; destruction and recovery techniques. Critical Reviews in Environmental Scienceand Technology 43:1417–1445 DOI 10.1080/10643389.2011.647760.
Vergara-Fernandez A, Lara Molina L, Pulido NA, Aroca G. 2007. Effects of gas flow rate,inlet concentration and temperature on the biofiltration of toluene vapors. Journal ofEnvironmental Management 84:115–122 DOI 10.1016/j.jenvman.2006.04.009.
WuD, Quan X, Zhao Y, Chen S. 2006. Removal of p-xylene from an air stream in ahybrid biofilter. Journal of Hazardous Materials 136:288–295DOI 10.1016/j.jhazmat.2005.12.017.
Xi J, Hu H-Y, Qian Y. 2006. Effect of operating conditions on long-term performanceof a biofilter treating gaseous toluene: biomass accumulation and stable-run timeestimation. Biochemical Engineering Journal 31:165–172DOI 10.1016/j.bej.2006.07.002.
Yassaa N, Brancaleoni E, Frattoni M, Ciccioli P. 2006. Isomeric analysis of BTEXsin the atmosphere using beta-cyclodextrin capillary chromatography coupledwith thermal desorption and mass spectrometry. Chemosphere 63:502–508DOI 10.1016/j.chemosphere.2005.08.010.
Zamir SM, Halladj R, Nasernejad B. 2011. Removal of toluene vapors using a fungalbiofilter under intermittent loading. Process Safety and Environmental Protection89:8–14 DOI 10.1016/j.psep.2010.10.001.
Zare H, Najafpour G, RahimnejadM, Tardast A, Gilani S. 2012. Biofiltration of ethylacetate by Pseudomonas putida immobilized on walnut shell. Bioresource Technology123:419–423 DOI 10.1016/j.biortech.2012.07.036.
Zhu et al. (2016), PeerJ, DOI 10.7717/peerj.2045 17/17


![CONTACT INFORMATIONmmabrok.com/pdfs/My_CV.pdf · 2020. 11. 13. · [8]Samet Gler, Mohammed A. Algarni, Mohammad Z. Shaqura, Hassan Jaleel, M. A. Mabrok, iming Jiang, Yimeng Lu, and](https://img.dokumen.tips/doc/110x75/6109c4a385857d5ed54fc8e3/contact-2020-11-13-8samet-gler-mohammed-a-algarni-mohammad-z-shaqura.jpg)