Embed Size (px)
Citation preview

This is a postprint version of: Morillo, F. & Efrain-Garcia, P. (2015). A bibliometric analysis of Technology Centres. Scientometrics, 104(3), 685-713.
The final publication is available at Springer via http://dx.doi.org/10.1007/s11192-015-1631-5
1
A bibliometric analysis of Technology Centres
Fernanda Morillo (1, 2) & Preiddy Efrain-Garcia (1)
(1) Centre for Human and Social Sciences (CCHS), Spanish National Research Council (CSIC),
Albasanz 26-28, 28037 Madrid, Spain.
(2) Corresponding author.
E-mail addresses: [email protected] & [email protected]
Abstract
Technology Centres (TCs) are non-profit organisations created to contribute to the
improvement of the productive sector, providing RTD support, especially for small and
medium-sized enterprises (SMEs). Given TCs' main function, most authors present an
industrial perspective of their performance. However, the bibliometric techniques can offer
not only an overview of these centres, but also additional information about their features:
the evolution of their publications, the degree of national and international collaboration,
the Spanish institutional sectors and the main disciplines involved, the regional differences
and their connections. In this article, Spanish TCs' documents downloaded from the Web of
Science (2008-2012) are analysed, along with other indicators that can characterise these
centres. The results show that national collaboration is important for TCs and even more
when those links are local. This is in line with that stated by other authors, considering that
geographical proximity is essential for knowledge transfer. Regarding the Spanish
institutional sectors, the strongest relations are established with universities. For their part,
firms have low participation in publications, although they show an upward trend over the
years. Nevertheless, TCs' documents are mainly issued on industrial related topics, in
agreement with their primary mission as promoters of firms' innovation. Finally, as expected,
differences between regions' performance are seen, explained in part by disparities between
regional systems. Notwithstanding, top producers establish connections with regions
without TCs, mainly collaborating in documents related to engineering, medicine and
environmental topics.

This is a postprint version of: Morillo, F. & Efrain-Garcia, P. (2015). A bibliometric analysis of Technology Centres. Scientometrics, 104(3), 685-713.
The final publication is available at Springer via http://dx.doi.org/10.1007/s11192-015-1631-5
2
Keywords
Spanish Technology Centres; Scientific publications; Collaboration; Regional differences;
Performance evaluation; Statistical Analyses
Introduction
Technology Centres (TCs) are non-profit organisations created to contribute to the overall
benefit of society and to the improvement of enterprises' competitiveness1. They give an
effective RTD support, specifically aimed at the productive sector, chiefly SMEs, but also
collaborating with public authorities in the performance of technological innovation related
activities2. TCs were originally based on the association of companies in a particular sector,
although in some cases they were linked to a university from the beginning, or connected to
the public sector (especially the regional one) (Giner and Santa María 2000; Barge-Gil and
Modrego 2011). In a business environment where there is a high proportion of SMEs, TCs
reach a broad group of firms and are the only ones who can offer the services and technical
resources required to improve their innovative capacity. These organisations can build
bridges between private needs and the creation of scientific knowledge of public bodies.
TCs, being intermediary institutions with extensive contacts, provide specific knowledge of
great value to companies (Barge-Gil and Modrego-Rico 2008).
Although their mission is closely associated to the business environment, they were often
funded by a public-private joint scheme and regional governments had an important role in
driving their development. However, there are large regional differences among TCs. For
Valencia, each centre works mostly in one sector, oriented towards established industry,
with a high proportion of SMEs and various locations, because proximity is crucial to ensure
delivery service. On the contrary, in the Basque Country, TCs work in several sectors.
Alongside the Basque Country, Valencia was the first to consider TCs as a key element for
technology transfer and innovation in the regional business fabric. Public promotion is basic
and explains the TCs' results in some regions, although they had to adapt and change their
plans. In fact, in the case of the Basque Country, the regional budget constraints meant that
1
http://www.idi.mineco.gob.es/portal/site/MICINN/menuitem.7eeac5cd345b4f34f09dfd1001432ea0/?vgnextoid=967227bba0d90210VgnVCM1000001034e20aRCRD. Accessed 28 May 2015. 2 http://www.fedit.com/Paginas/CT_Presentacion.aspx. Accessed 28 May 2015.

This is a postprint version of: Morillo, F. & Efrain-Garcia, P. (2015). A bibliometric analysis of Technology Centres. Scientometrics, 104(3), 685-713.
The final publication is available at Springer via http://dx.doi.org/10.1007/s11192-015-1631-5
3
TCs adopted new strategies for their survival, as in the case of Tecnalia. TCs play a key role in
innovation policies, but it should be borne in mind that financial incentives and rules are
needed to complement them (Giner and Santa María 2000; Mas-Verdú 2007).
At the level of the country, within the last Spanish RTD Plan, a specific sub-programme of
institutional strengthening is envisaged to encourage the participation of TCs. It helps them
to improve their chances of obtaining Community funding under Horizon 2020. This is
particularly important, in view of the limited success of innovative research transfer towards
the market. In the international context, TCs are sometimes referred to as Research and
Technology Organisations. The European Association of Research and Technology
Organisations (EARTO) gathers some of these centres, from different countries3 and there
are various studies that analyse the characteristics or performance of several of these
organisations outside Spain (see, for example, Giner and Santa María 2000; Mas-Verdú 2007;
Schramm et al. 2011; Ahlqvist et al., 2012).
In Spain, most authors offer an industrial vision of the TCs' performance, because their main
function is to contribute to improving the competitiveness of enterprises through RTD. Some
studies measure TCs' results and their fulfilment of the purpose for which they were created.
For instance, Baviera-Puig et al. (2012) analyse the distribution of firms connected to a TC (as
exemplified by a specialised organisation in the food industry) and stress the importance of
geographical proximity for knowledge transfer. This centre is mainly related to nearby
businesses, but also with others more distant, since highways, facilitating interconnection,
conveniently connect each other. Other studies mainly focus on the types of activities TCs
perform, their services, fund raising, organisation and relationships with the public and
private sector. Modrego-Rico et al. (2005) develop indicators to measure their performance
considering all these factors and producing a TCs' taxonomy, in which there are interregional
differences in their specialisation. Moreover, some authors (e.g. Barge-Gil and Modrego-Rico
2008) evaluate the TCs' efforts in helping to reduce market failures. They conclude that
overall there is a positive outcome, because these centres give invaluable technological
services (mainly to SMEs), with an increase in R&D investment. Finally, they point out that a
key element, which improves outcomes, is cooperation with universities and firms.
3 http://www.earto.eu/about-earto/list-of-members.html. Accessed 28 May 2015.

This is a postprint version of: Morillo, F. & Efrain-Garcia, P. (2015). A bibliometric analysis of Technology Centres. Scientometrics, 104(3), 685-713.
The final publication is available at Springer via http://dx.doi.org/10.1007/s11192-015-1631-5
4
Objectives
This article presents a different approach applied to the study of TCs, which offers not only
an overview of these centres, but also additional information about their features. The
methodology is based on a bibliometric analysis of journal's publications produced by the
Spanish TCs, using the Web of Science (WoS). This study provides a broader framework for
understanding the role of these centres as promoters of firms' competitiveness. However,
the degree to which TCs' publications reflect firms' performance is beyond the scope of this
text.
The paper starts with an outline of TCs' scientific publications, examining the evolution of
their documents. Then it continues with the degree of collaboration with other institutions
(national or international), the Spanish institutional sectors and the scientific disciplines
represented in publications, ending with the regional distribution and their connections. In
particular, based on the above mentioned, the following hypotheses are formulated and
tested in the present study:
1. TCs are highly connected with national organisations and mainly with those from the
university sector.
In previous works, it has been indicated the importance of geographical proximity
(Baviera-Puig et al. 2012) and the connections with the public sector or even with a
particular university (see, for example, Giner and Santa María 2000). Therefore, it is
estimated that there will be a high percentage of national collaboration and, in
particular, of university cooperation.
2. TCs' performance is influenced by differences between regions, explained in part by
disparities between regional systems.
As stated in other articles, it is anticipated that there will be regional differences,
due in part to technological strategies followed by regions (see, for example, Giner
and Santa María 2000).
To provide a robust response to the second hypothesis, statistical analysis is used. The next
section of this work describes in detail the data, methodological approach and measures
employed. Results offer the descriptive and statistical tests and discussion and conclusions
explain these results in context, giving possible directions in future research.

This is a postprint version of: Morillo, F. & Efrain-Garcia, P. (2015). A bibliometric analysis of Technology Centres. Scientometrics, 104(3), 685-713.
The final publication is available at Springer via http://dx.doi.org/10.1007/s11192-015-1631-5
5
Materials and methodology
All the Spanish documents were downloaded from WoS, years 2008-2012, and those
publications signed by TCs at least once were selected. In this study, 75 TCs (Appendix Table
5) were gathered from different sources (through web pages information and/or through
email answers). These centres were identified, in WoS documents, and the Spanish
institutional sectors with which they collaborate, using automatic applications that analyse
addresses and assign optional codes from various master lists (Morillo et al. 2013a; Morillo
et al. 2013b).
In addition, to have a more comprehensive view of the regional typologies, some measures
obtained from the Spanish Statistical Office (INE)4 are used: R&D expenditure (percentage of
GDP), firms' innovation intensity (innovative activities expenditure / turnover x100), number
of firms with innovative activities per 1000 inhabitants and R&D university personnel per
1000 inhabitants. Besides, as most nationwide TCs are integrated in a register of MINECO
(the Spanish Ministry of Economy and Competitiveness)5, the sectoral classification of this
register was used. Those TCs included in the register, and studied in this work (i.e. 46
centres, Appendix Table 5), were assigned to their respective technological and/or industrial
sectors, as well as to their documents' categories (WoS), in order to compare both
classifications.
Furthermore, a nonparametric statistical analysis was carried out using SPSS (IBM Corp.
2013). In particular, Spearman rho coefficient was calculated to assess the association
between the regional variables, considering two significance levels (0.01 and 0.05). In
addition, a k-means cluster analysis was made, which aimed to determine three groups of
regions (of high, medium and low performance). Finally, to study the detail of the national
collaboration, connections between organisations from the different Spanish regions (TCs or
not) are displayed in a network generated with Pajek (Batagelj and Mrvar 2013).
4 http://www.ine.es/en/welcome.shtml. Accessed 28 May 2015.
5
http://www.idi.mineco.gob.es/portal/site/MICINN/menuitem.7eeac5cd345b4f34f09dfd1001432ea0/?vgnextoid=967227bba0d90210VgnVCM1000001034e20aRCRD. Accessed 28 May 2015.

This is a postprint version of: Morillo, F. & Efrain-Garcia, P. (2015). A bibliometric analysis of Technology Centres. Scientometrics, 104(3), 685-713.
The final publication is available at Springer via http://dx.doi.org/10.1007/s11192-015-1631-5
6
Results
The general results showed that TCs produced 5,068 documents and 4,586 articles in WoS,
in years 2008-2012 (i.e. 1.77% and 1.97% of the total Spanish output). On the one hand, the
evolution of TCs' documents presented a higher growth than the Spanish one (65% versus
24%, Fig. 1). Nevertheless, their average number of organisations and their average number
of authors were similar or lower than were those of Spain (3.29 versus 3.75 and 6.13 versus
10.76, respectively). On the other hand, considering articles and their citations, it could be
observed that TCs' scientific impact was slightly higher than the average. Overall, 86% of
their articles were cited, which was three points more than in the case of Spain.
Furthermore, 55% of TCs' articles were published in journals of the first quartile (Q1),
compared to less than 50% of the Spanish ones.
Fig. 1 Evolution of the TCs and Spanish documents (WoS, 2008-2012)
With respect to the links with other organisations, Table 1 offers the number of TCs'
documents, articles and percentages without collaboration, with only national, only
international, and national & international collaboration. It also shows the average number
of authors and organisations in each set of documents, the average cites per article, the
percentages without citations, the average impact factor of articles and the percentage of
articles in the first quartile. As in other works, collaboration implied greater impact than no
collaboration. In addition, the best results for all variables were yielded by the joint national
& international collaboration, possibly explained by a higher average number of authors and
0
10000
20000
30000
40000
50000
60000
70000
0
200
400
600
800
1000
1200
1400
2008 2009 2010 2011 2012
TCs (Doc) Spain (Doc)

This is a postprint version of: Morillo, F. & Efrain-Garcia, P. (2015). A bibliometric analysis of Technology Centres. Scientometrics, 104(3), 685-713.
The final publication is available at Springer via http://dx.doi.org/10.1007/s11192-015-1631-5
7
organisations. However, the highest percentages of articles were concentrated in only
national collaboration. In addition, if only national and national & international percentages
are summed, national collaboration represents as a whole almost 70% of articles (3,190) or
documents (3,510). Furthermore, although not shown in the table, the links between local
organisations (i.e. those occurring within a region) accounted for about 84% of this national
collaboration, highlighting the importance of geographical proximity for TCs.
Table 1 Type of TCs' collaboration by number of documents with average number of authors/organisations and by number of articles with impact variables (WoS, 2008-2012)
Type Doc %Doc Auth Org Art %Art AvgCites %No Cites AvgIF %Q1
National & international 1067 21.05 8.40 5.45 971 21.17 11.88 10.50 3.648 61.07
Only international 850 16.77 5.99 3.55 775 16.90 8.57 12.77 2.754 59.61
Only national 2443 48.20 5.79 2.92 2219 48.39 7.13 14.83 2.563 52.55
Without collaboration 708 13.97 4.04 1.00 621 13.54 6.29 17.71 2.008 50.40
Total 5068 100.00 6.13 3.29 4586 100.00 8.26 13.96 2.750 55.26
Doc: number of documents per type of collaboration; Auth: average number of authors in each set of documents; Org: average
number of organisations in each set of documents; Art: number of articles per type of collaboration; AvgCites: average cites per
article; %No Cites: percentage of articles without citations; AvgIF: average impact factor of articles; %Q1: percentage of articles in
the first quartile.
Taking into account the high percentage of national collaboration, Table 2 offers the bonds
between TCs and the Spanish institutional sectors. As it can be seen in the table, the
strongest relation appeared with university, followed by the links with other non-profit
organisations (NPOs), public research organisations (PROs) and the health sector. Regarding
the evolution of collaboration, the greatest raise was detected in the collaboration with
NPOs, followed by interactions among TCs and their ties with firms.
Table 2 TCs' collaboration with the Spanish institutional sectors (WoS documents, 2008-2012)
Sector 2008 2009 2010 2011 2012 Total % ∆
Administration 20 14 22 27 34 117 3.33 70
Firms 34 57 46 61 74 272 7.75 118
Health 112 115 106 149 134 616 17.55 20
NPOs 51 108 125 159 182 625 17.81 257
PROs 87 98 124 165 149 623 17.75 71
TCs 33 45 44 78 114 314 8.95 245
University 350 403 441 583 600 2377 67.72 71
National collaboration 520 618 630 845 897 3510 100.00 73
NPOs: non-profit organisations; PROs: public research organisations.
If sectors of MINECO's register are matched to WoS categories, it is possible to know what
the most important areas are, considering the number of publications. TCs included in
MINECO's register published 3,651 documents (i.e. 72% of the analysed papers). These

This is a postprint version of: Morillo, F. & Efrain-Garcia, P. (2015). A bibliometric analysis of Technology Centres. Scientometrics, 104(3), 685-713.
The final publication is available at Springer via http://dx.doi.org/10.1007/s11192-015-1631-5
8
documents were classified by sectors and WoS categories and presented in Appendix Table
6. As it can be seen, the main subjects are related to materials science, energy and
environmental sciences (for both thematic classifications). Moreover, the two last topics
include the largest number of TCs.
Considering TCs' collaboration, it is important to talk about the key role of Autonomous
Regions, because the regional arena is expected to be essential for industrial innovation. It
should be taken into account that there is a TC, AITEMIN, which is located in four regions
and has publications in Castile-La Mancha and Madrid. For this reason, it counts for both
regions, although the headquarters are located in Madrid. In Table 3, different measures are
shown for seventeen Spanish regions and in the studied period (2008-2012). On the one
hand, with reference to the output: total number of documents of TCs & collaborators,
number of TCs, TCs' documents, their percentages and TCs' documents per TC. On the other
hand, as to the regional's input indicators: average R&D expenditure (% of GDP), average
firms' innovation intensity (innovative activities expenditure / turnover x 100), average
number of firms with innovative activities per 1000 inhabitants and average R&D university
personnel per 1000 inhabitants. This last measure was also included because of the
important function of University in TCs' activities (high percentage of collaboration).
As it can be noticed (Table 3), the first two regions accumulated more than half of the total
TCs' documents (DocTC). Furthermore, with regard to the total number of documents of TCs
& collaborators (Total), the regions showed a similar trend. However, it is possible to
observe some considerable exceptions, as in the case of Madrid (ranking ninth by DocTC and
fourth by Total), because it had only two TCs. Nevertheless, Navarra ranked second by
DocTC with only five TCs, occupying the first position by DocTC per TC (RelDocTC). Moreover,
the Basque Country and Navarre had the highest values in R&D expenditure (RD), firms'
innovation intensity (Inn) and number of innovative firms (InnFirms), while Navarra also had
the top number of R&D University personnel (PersUniv). Conversely, the Canary and Balearic
Islands had the lowest values in almost all measures, having no TCs and owing all their
documents to national collaboration. Given the above, it appears that there may be some
relationship between the regional variables and the number of TCs' documents. Therefore,
and considering that not all the variables were normal, we performed a nonparametric
correlation (Table 4) for the five relative variables (RelDocTC, RD, Inn, InnFirms and
PersUniv) and the thirteen regions with TCs, excluding the Islands, Cantabria and La Rioja.
The table show significant correlations among all variables except for PersUniv and between
RD and RelDocTC. Nevertheless, PersUniv did present a significant correlation with InnFirms,

This is a postprint version of: Morillo, F. & Efrain-Garcia, P. (2015). A bibliometric analysis of Technology Centres. Scientometrics, 104(3), 685-713.
The final publication is available at Springer via http://dx.doi.org/10.1007/s11192-015-1631-5
9
which was the most correlated variable with RelDocTC, while RD presented high correlation
with Inn and InnFirms, both correlating with RelDocTC.
Table 3 Documents and statistical measures by region (17 regions, WoS and INE databases, 2008-2012)
Region Total TCs DocTC %DocTC RelDocTC RD Inn InnFirms PersUniv
Navarre 1190 5 1144 22.6 228.8 2.03 1.39 0.904 3.21
Basque Country 1601 11 1544 30.5 140.4 2.09 1.45 1.006 1.66
Aragon 255 2 155 3.1 77.5 1.03 1.12 0.698 2.19
Catalonia 1245 14 913 18.0 65.2 1.61 1.01 0.785 1.97
Extremadura 144 2 128 2.5 64.0 0.85 0.50 0.268 1.17
Madrid 662 2 97 1.9 48.5 1.98 1.04 0.634 2.23
Castile-La Mancha 130 2 73 1.4 36.5 0.68 0.67 0.392 0.59
Valencia 650 15 532 10.5 35.5 1.05 0.60 0.579 1.96
Castile-Leon 285 7 201 4.0 28.7 1.14 1.29 0.467 1.88
Asturias 99 2 51 1.0 25.5 0.98 0.68 0.411 1.41
Galicia 241 7 166 3.3 23.7 0.94 0.98 0.512 1.77
Andalusia 291 6 84 1.7 14.0 1.11 0.67 0.362 1.44
Murcia 87 1 7 0.1 7.0 0.86 0.54 0.479 2.45
Balearic Islands 45 0 0 0.0 0.0 0.37 0.18 0.380 0.97
Canary Islands 63 0 0 0.0 0.0 0.59 0.38 0.372 1.03
Cantabria 35 0 0 0.0 0.0 1.09 0.72 0.476 1.53
La Rioja 6 0 0 0.0 0.0 1.01 0.96 0.968 1.38
Total: total 2008-2012 documents of TCs & collaborators by region; TCs: number of TCs in each
region (2008-2012); DocTC: total 2008-2012 documents from TCs in each region; %DocTC:
DocTC's percentage of the total documents.
Table 4 Spearman's rho Nonparametric Correlations (13 regions with TCs' documents, WoS and INE, 2008 2012)
RelDocTC RD Inn InnFirms PersUniv
RelDocTC Correlation Coefficient 1.000 .505 .586
* .643
* .209
Sig. (2-tailed) .078 .035 .018 .494
RD Correlation Coefficient .505 1.000 .779
** .731
** .473
Sig. (2-tailed) .078 .002 .005 .103
Inn Correlation Coefficient .586
* .779
** 1.000 .729
** .355
Sig. (2-tailed) .035 .002 .005 .234
InnFirms Correlation Coefficient .643
* .731
** .729
** 1.000 .659
*
Sig. (2-tailed) .018 .005 .005 .014
PersUniv Correlation Coefficient .209 .473 .355 .659
* 1.000
Sig. (2-tailed) .494 .103 .234 .014
**. Correlation is significant at the 0.01 level (2-tailed).
*. Correlation is significant at the 0.05 level (2-tailed).
RelDocTC: total 2008-2012 documents from TCs in each region per TC; RD: regional average research and
development expenditure (% of GDP) (2008-2012); Inn: average firms' innovation intensity by region (innovative
activities expenditure / turnover) x100 (2008-2012); InnFirms: average firms with innovative activities per 1000
inhabitants (2008-2012) ; PersUniv: average R&D University personnel per 1000 inhabitants (2008-2012)

This is a postprint version of: Morillo, F. & Efrain-Garcia, P. (2015). A bibliometric analysis of Technology Centres. Scientometrics, 104(3), 685-713.
The final publication is available at Springer via http://dx.doi.org/10.1007/s11192-015-1631-5
10
Taking into account the relative variables of Table 4, a new statistical test was made to find
groups of similar regions regarding their overall characteristics. The objective was to obtain
three groups of high, medium and low performance. To this end, a k-means cluster analysis
was carried out with the thirteen regions with TCs and with three variables: RelDocTC, RD
and PersUniv (the other two correlated variables were excluded). The first cluster is formed
by the Basque Country and Navarre, both with high values in all variables, except for the
Basque Country in PersUniv, with a value under the average. The second cluster is the
biggest one, because includes seven regions: Aragon, Castile-Leon, Catalonia, Galicia,
Madrid, Murcia and Valencia. It has medium values, although higher for PersUniv and lower
for RelDocTC. The third cluster has four regions: Andalusia, Asturias, Castile-La Mancha and
Extremadura. As those of the first cluster, these regions are quite homogeneous, offering
low values in all variables, except for Extremadura in RelDocTC, with a value over the
average. Fig. 2 and Fig. 3 present distributions for the three clusters and two variables: RD
and InnFirms. As it can be seen, box-plots draw the highest values for the first cluster and
the lowest values for the third one. Fig. 2 shows an outlier, Madrid, explained by a high
percentage of R&D investment, although with lower values for innovation.
Fig. 2 Box-plots of the percentage of R&D expenditure of GDP for three clusters (k-means analysis)

This is a postprint version of: Morillo, F. & Efrain-Garcia, P. (2015). A bibliometric analysis of Technology Centres. Scientometrics, 104(3), 685-713.
The final publication is available at Springer via http://dx.doi.org/10.1007/s11192-015-1631-5
11
Fig. 3 Box-plots of firms with innovative activities per 1000 inhabitants for three clusters (k-means analysis)
When studying all the regional interactions and the total number of documents of TCs &
collaborators, it could be observed that those with a better performance boosted the others
production (Fig. 4). Madrid, even with just two low productive TCs, presented a great deal of
national collaboration (89%), due to documents jointly published by its non-Technology
organisations and TCs from other regions. Besides, the four regions with the highest
production, in documents of TCs & collaborators, draw on the map triangles of strong links.
However, for regions without TCs, cooperation was even more important as they needed to
connect all their documents in national collaboration if they wanted to reach TCs in other
regions (La Rioja, Cantabria and the Islands). Moreover, these regions also had varied
connections, considering the different links between geographical areas, and most of these
relationships were multilateral, including organisations from three or more regions (Fig. 4).
Some of them cooperated with their neighbours and others chose other associations
because they were top producers, no matter how far they were (the Balearic and Canary
Islands). In this sense, the Balearic Islands presented 42% of collaboration with the Basque
Country, although with Catalonia, geographically closer to them, they had 40% of documents
in common. Regarding the Canary Islands, they connected in 37% of their publications with
Navarre, far away from them, and had 29% of cooperation with Castile-La Mancha, located a
little closer. As far as Cantabria and La Rioja are concerned, nearby relations were preferred.
In the case of Cantabria, 63% of its documents were signed with the Basque Country, while
La Rioja had 83% of links with Navarre. With respect to the Spanish institutional sectors
involved in these collaborations, the university sector was the most participative (although
in less than half of the documents), followed by PROs (19%) and other public related sectors.

This is a postprint version of: Morillo, F. & Efrain-Garcia, P. (2015). A bibliometric analysis of Technology Centres. Scientometrics, 104(3), 685-713.
The final publication is available at Springer via http://dx.doi.org/10.1007/s11192-015-1631-5
12
In addition, a few firms, established mainly in the Islands, signed some of these publications.
Finally, the main disciplines of publication were related to engineering (particularly energy
and materials), medicine (neurosciences) and environmental topics.
Fig. 4 Network of collaboration among 17 Spanish regions with Pajek (WoS, 2008-2012) and number of TCs by region represented in a colour scale (a darker colour means a higher number of centres)
Discussion and conclusions
This study describes the importance of TCs as creators of scientific output, increasingly
connecting public and private sectors. The general results showed that these centres
produced less than 2% of the total Spanish publications, but their growth throughout the
period was much greater than the Spanish one and their scientific impact was also slightly
higher. Likewise, TCs' collaboration was much higher than the Spanish one and the national
links even more, as predicted in the first hypothesis. The latter is quite logical, considering
that TCs need to cooperate with different agents to provide a quick and effective service.
Moreover, a great deal of the national connections included collaboration between local
organisations, which is in line with other studies. For instance, the case offered by Baviera-
Puig et al. (2012) shows a high local cooperation, since geographical proximity is important
for knowledge transfer. However, these authors also point out that TCs can meet the needs

This is a postprint version of: Morillo, F. & Efrain-Garcia, P. (2015). A bibliometric analysis of Technology Centres. Scientometrics, 104(3), 685-713.
The final publication is available at Springer via http://dx.doi.org/10.1007/s11192-015-1631-5
13
of remote firms, provided they are properly connected. Therefore, this probably explains
those connections between distant regions on the map.
On the subject of the Spanish institutional sectors, the strongest relations appeared with
public organisations, mainly with university. Furthermore, there were great growths in the
cooperation with NPOs, TCs and, surprisingly, with firms, which is an indication that these
last seem to give increased importance to scientific publication. The high proportion of
documents in national collaboration with University could be explained by the strong links
between many TCs and some university departments, which was stated in the first
hypothesis. Moreover, most publications between TCs and firms were also produced by the
public sector, making it possible to see how TCs can encourage knowledge transfer between
both sectors. This was studied preliminarily in the work of Morillo et al. (2014), whose
findings foresee the importance of intermediaries to facilitate knowledge transfer. Besides,
the largest number of TCs and their main publications were related to industry (i.e.
engineering and technological areas), proving that support for firms' innovation by TCs has
an effect on their choice of research topics.
In addition, some parallelisms with other studies were observed, concerning differences
among TCs, which were partly due to the characteristics of their regional innovation systems
(e.g. Barge-Gil and Modrego-Rico 2008). In this work, the increase in R&D expenditure was
associated with the growth in the number of firms with innovative activities and in firms'
innovation intensity. Moreover, those regions with higher innovation values also showed
greater relative TCs' scientific output and offered important connections for smaller regions.
This confirms the second hypothesis of differences between regions explained in part by
disparities in regional development. That is, firms with innovative activities take advantage
from TCs' technological support that, in turn, depend on their respective regional RTD
systems, which play an important role in the promotion of competitiveness.
In the study by Gómez et al. (2005), the most technologically advanced regions are Navarra,
the Basque Country and Catalonia and at the other extreme are the Balearic and Canary
Islands. Besides, the authors state that Madrid is the strongest region from the scientific
point of view, while only a small percentage of its population works in the industrial sector.
Similarly, in our work, we could observe that Navarra and the Basque Country occupied the
first positions by relative TCs' scientific production, forming the first cluster of our study (the
high performance group). Moreover, the Balearic and Canary Islands also had very low
values in the input indicators, having no TCs. Additionally, Madrid (that belongs to the

This is a postprint version of: Morillo, F. & Efrain-Garcia, P. (2015). A bibliometric analysis of Technology Centres. Scientometrics, 104(3), 685-713.
The final publication is available at Springer via http://dx.doi.org/10.1007/s11192-015-1631-5
14
medium performance group) occupied the third position by R&D expenditure, but it only
had two TCs and medium values in TCs' documents and in innovation variables.
Nevertheless, it showed strong connections with the top producers, ranking fourth by total
number of documents of TCs & collaborators. Regarding regions without TCs (La Rioja,
Cantabria and the Islands), they produced some documents in collaboration, mainly signed
by three or more organisations. Besides, the university sector was the most participative,
establishing the majority of its relations with TCs from the Basque Country and Navarre in
engineering, medicine and environmental topics.
In conclusion, it can be said that the bibliometric point of view provides useful information
to assess TCs' performance and their compliance with the objectives for which they were
created. Likewise, it can be stated that RTD regional systems have an important role and a
relevant impact on the overall economic development. Further research may offer the firms'
perspective and see how TCs may help them in improving their competitiveness.
Acknowledgements
This work is supported by the Spanish Ministry of Science and Innovation (Grant CSO2011-25102).
We want to thank Borja González-Albo and Luz Moreno for their valuable collaboration in the
identification of TCs and Adrián A. Díaz-Faes for his suggestions about statistics methodology.
Appendix
Table 5 Technology Centres included in this study (with documents in WoS, 2008-2012)
Technology Centres & their locations In MINECO's
register
AIMEN, Pontevedra (Galicia) Yes
AITEMIN, Madrid & Toledo (Madrid & Castile-La Mancha) Yes
Asoc.Ind.Navarra (AIN) (Navarre) Yes
Asoc.Inv.Ind.Curtido Anexas, Barcelona (Catalonia)
Asoc.Prov.Emp.Cosech-Exp.Prd.Hort. Almería (Andalusia)
Azterlan, Vizcaya (Basque Country) Yes
Barcelona Media, Barcelona (Catalonia) Yes
C.And.Innov.Tecnol.Inf.Comun., Málaga (Andalusia) Yes
C.Avanz.Tecnol.Aeroespacial, Sevilla (Andalusia) Yes
C.Cirugía Mínima Invasión, Cáceres (Extremadura)
C.Desarr.Telecomunic., Valladolid (Castile-Leon)
C.Est.Inv.Técn., Guipúzcoa (Basque Country) Yes

This is a postprint version of: Morillo, F. & Efrain-Garcia, P. (2015). A bibliometric analysis of Technology Centres. Scientometrics, 104(3), 685-713.
The final publication is available at Springer via http://dx.doi.org/10.1007/s11192-015-1631-5
15
Technology Centres & their locations In MINECO's
register
C.Inv.Innov.Toxicol., UPC, Barcelona (Catalonia)
C.Inv.Med. Aplic., UNAV (Navarre) Yes
C.Nac.Energ.Renov., (Navarre)
C.Nac.Tecnol.Seg.Alim., (Navarre) Yes
C.Nuevas Tecnol.Agua, Sevilla (Andalusia)
C.Tecnol. Azucarera CTA, UVa, Valladolid (Castile-Leon)
C.Tecnol.Agr.Agroalim., Palencia (Castile-Leon) Yes
C.Tecnol.Bioméd., UPM, (Madrid)
C.Tecnol.Carne, Galicia (Ourense)
C.Tecnol.Forest.Madera, (Asturias)
C.Tecnol.Forestal de Cataluña, Lleida (Catalonia)
C.Tecnol.Gallego Acuicultura, A Coruña (Galicia)
C.Tecnol.Manresa, Catalonia (Barcelona)
C.Tecnol.Mar-Fund.CETMAR, Galicia (Pontevedra)
C.Tecnol.Nac.Conserva Alimentación, (Murcia) Yes
C.Tecnol.Nutr.Salud, Tarragona (Catalonia)
C.Tecnol.Telecomun.Cat., Barcelona (Catalonia)
C.Tecnol.Vilanova Geltrú, UPC, Barcelona (Catalonia)
CARTIF, Valladolid (Castile-Leon) Yes
Cecopesca, Anfaco, Pontevedra (Galicia) Yes
CEMITEC, (Navarre) Yes
Cetaqua, Barcelona (Catalonia)
CETEMMSA, Barcelona (Catalonia) Yes
CICAP, Córdoba (Andalusia)
CIDETEC, Guipúzcoa (Basque Country) Yes
CIS Madera, Ourense (Galicia)
CIT UPC, Barcelona (Catalonia)
Est.Exp.Las Palmerillas, Almería (Andalusia)
Fund.Ascamm, Barcelona (Catalonia) Yes
Fund.C.Tecnol.Aeron., Álava (Basque Country) Yes
Fund.CIDAUT, Valladolid (Castile-Leon) Yes
Fund.CIRCE, Zaragoza (Aragon) Yes
Fund.Gaiker, Vizcaya (Basque Country) Yes
Fund.I.Tecnol.Materiales, (Asturias) Yes
Fund.Tekniker, Guipúzcoa (Basque Country) Yes
Gradiant, Pontevedra (Galicia) Yes
I.Biomecánica, UPV, (Valencia) Yes
I.Biotecnol., ULe, León (Castile-Leon)
I.Inv.Energ.Renov.,UCLM, Albacete (Castile-La Mancha)
I.Inv.Textil Coop.Ind, UPC, Barcelona (Catalonia)
I.ITACA, UPV, (Valencia) Yes
I.Tecnol.Agroalim. (AINIA), (Valencia) Yes
I.Tecnol.Agroalim., Badajoz (Extremadura)
I.Tecnol.Aragón, Zaragoza (Aragon)
I.Tecnol.Calzado Conexas, Alacant (Valencia) Yes
I.Tecnol.Cerám., UJI, Castelló (Valencia) Yes

This is a postprint version of: Morillo, F. & Efrain-Garcia, P. (2015). A bibliometric analysis of Technology Centres. Scientometrics, 104(3), 685-713.
The final publication is available at Springer via http://dx.doi.org/10.1007/s11192-015-1631-5
16
Technology Centres & their locations In MINECO's
register
I.Tecnol.Construcción (AIDICO), (Valencia) Yes
I.Tecnol.Eléctrica, (Valencia) Yes
I.Tecnol.Embalaje,Transp.Logística, (Valencia) Yes
I.Tecnol.Informát., UPV, (Valencia) Yes
I.Tecnol.Juguete, Alacant (Valencia) Yes
I.Tecnol.Ópt.Color Imagen, (Valencia) Yes
I.Tecnol.Plástico (AIMPLAS), (Valencia) Yes
I.Tecnol.Textil, Alacant (Valencia) Yes
I.Toxicol., ULe, León (Castile-Leon)
Ideko, Guipúzcoa (Basque Country) Yes
Ikerlan S.Coop., Álava & Guipúzcoa (Basque Country) Yes
Inst.Tecnol.Metalmecánico, (Valencia) Yes
Inst.Tecnol.Mueble, Madera, Embalaje Afines, (Valencia) Yes
Leitat, Barcelona (Catalonia) Yes
Lortek, Basque Country (Guipúzcoa) Yes
Tecnalia, Álava, Guipúzcoa & Vizcaya (Basque Country) Yes
Vicomtech-IK4, Guipúzcoa (Basque Country) Yes

17
Tab
le 6
Wo
S ca
tego
ry b
y se
cto
r o
f M
INEC
O's
re
gist
er
(Wo
S d
ocu
men
ts, 2
00
8-2
01
2)
Wo
s C
ate
gory
A
B
C
C
G
CP
E
EC
EE
FA
H
LF
MM
N
N
P
SD
T TC
TI
TP
TS
TV
TY
V
S W
F
Mat
eria
ls S
cien
ce, M
ult
idis
cip
linar
y 2
46
1
90
1
65
1
54
1
45
2
85
9
6
22
8
93
1
99
1
7
24
3
22
8
76
1
60
5
8
26
2
06
2
24
1
55
2
17
4
2
24
6
5
Engi
ne
erin
g, E
lect
rica
l & E
lect
ron
ic
15
9
12
4
67
1
19
1
06
1
87
7
9
16
9
85
1
20
2
7
16
6
12
9
54
1
57
8
8
37
1
83
1
51
1
30
1
62
2
6
17
7
80
Envi
ron
men
tal S
cien
ces
14
1
14
1
12
9
12
1
13
0
16
1
11
6
17
2
12
9
14
1
0
14
3
13
9
11
9
14
9
10
7
2
15
6
15
8
13
7
14
6
1
16
0
11
1
Neu
rosc
ien
ces
20
1
47
9
1
1
18
2
0
9
21
1
8
15
0
12
1
2
14
9
14
6
20
2
0
12
2
0
12
1
0
12
1
0
22
2
1
Ener
gy &
Fu
els
62
1
21
1
31
1
30
1
11
1
53
1
05
1
18
1
05
4
4
2
13
8
51
2
6
10
0
19
3
1
19
1
24
2
6
12
0
3
13
0
21
Ph
ysic
s, A
pp
lied
1
33
8
3
66
9
1
78
1
47
5
7
11
1
53
7
9
22
1
26
1
16
2
9
66
2
9
28
1
08
1
09
8
1
95
1
1
02
2
9
On
colo
gy
4
14
6
6
2
3
8
1
9
7
14
2
1
3
14
6
14
6
4
3
5
4
8
4
8
1
10
2
Bio
tech
no
logy
& A
pp
lied
Mic
rob
iolo
gy
63
1
28
4
2
40
4
3
69
3
2
68
4
6
12
5
6
58
1
26
1
10
6
1
36
8
6
6
61
5
2
60
6
7
1
36
Bio
chem
istr
y &
Mo
lecu
lar
Bio
logy
2
7
12
6
19
1
8
22
3
1
14
2
9
22
1
23
5
2
3
12
9
12
2
21
1
8
8
25
2
2
18
2
5
5
26
1
7
Met
allu
rgy
& M
etal
lurg
ical
En
gin
eeri
ng
12
2
93
4
7
49
5
2
12
5
38
1
16
2
6
96
0
1
18
1
15
2
6
11
0
26
3
1
14
9
9
95
1
17
0
9
5
26
Mar
ine
& F
resh
wat
er B
iolo
gy
11
8
11
8
11
8
11
7
11
7
11
8
11
7
11
7
11
7
11
8
0
11
8
11
8
11
7
11
7
11
7
0
11
7
11
7
11
7
11
7
0
11
7
11
7
Foo
d S
cien
ce &
Tec
hn
olo
gy
47
4
2
67
5
2
51
5
4
40
7
8
11
2
46
4
4
2
42
6
1
55
4
9
6
57
4
8
40
4
7
4
65
4
4
Nan
osc
ien
ce &
Nan
ote
chn
olo
gy
10
2
77
5
9
60
4
9
11
1
28
7
7
27
7
5
4
10
4
84
2
3
54
1
6
7
82
8
8
49
8
6
1
74
1
7
Elec
tro
chem
istr
y 1
02
7
1
68
4
5
27
1
05
2
8
47
2
6
71
6
9
3
81
1
7
41
1
9
8
61
4
9
40
5
4
6
60
2
1
Ch
emis
try,
Ph
ysic
al
82
6
7
74
5
1
43
1
03
3
6
64
3
0
66
8
7
9
81
2
2
38
1
8
13
4
9
53
3
7
52
6
6
1
20
Gen
etic
s &
Her
ed
ity
16
1
03
1
2
11
1
2
18
1
0
18
1
4
10
2
2
14
1
03
1
02
1
6
13
3
1
6
15
1
4
15
2
1
8
12
Engi
ne
erin
g, M
ech
anic
al
81
5
0
33
8
0
55
9
7
34
8
7
33
4
8
10
8
3
55
1
8
53
2
0
9
91
8
5
43
9
5
0
84
3
5
Engi
ne
erin
g, M
anu
fact
uri
ng
83
2
8
33
8
8
51
9
0
26
7
6
40
3
5
10
6
7
43
2
6
46
2
2
9
91
5
9
40
8
6
3
83
4
5
Mat
eria
ls S
cien
ce, C
era
mic
s 2
7
24
2
3
26
9
6
10
3
23
9
9
10
2
5
2
27
2
7
9
23
1
1
2
25
9
8
12
2
5
1
28
1
1
Med
icin
e, R
esea
rch
& E
xper
imen
tal
5
10
3
6
6
5
6
5
5
5
10
3
0
6
10
3
10
2
5
4
0
5
5
5
6
0
5
4
Clin
ical
Neu
rolo
gy
9
92
3
4
9
9
3
1
0
9
93
7
4
9
3
92
9
1
0
7
9
4
3
4
6
10
1
0
Engi
ne
erin
g, C
hem
ical
2
9
45
7
4
66
7
0
76
4
6
85
6
4
11
1
1
55
2
0
29
4
6
11
5
6
2
73
1
1
66
3
7
1
11
Po
lym
er S
cien
ce
72
4
1
66
5
1
54
8
3
36
6
8
40
4
3
4
59
6
4
39
1
8
14
3
4
9
45
2
5
55
1
5
4
16
Gas
tro
ente
rolo
gy &
Hep
ato
logy
1
9
5
1
1
1
1
1
1
1
95
0
1
9
5
95
1
1
0
1
1
1
1
0
1
1
Inst
rum
ents
& In
stru
men
tati
on
8
0
44
3
7
50
5
1
78
3
6
66
5
0
44
1
7
61
5
6
31
6
7
42
2
3
79
5
8
51
6
5
13
7
4
43
Oce
ano
grap
hy
86
8
5
85
8
6
85
8
6
85
8
6
86
8
6
0
86
8
6
85
8
6
87
0
8
6
85
8
8
86
0
8
8
85
Imm
un
olo
gy
21
8
6
22
2
2
21
2
2
21
2
1
22
8
6
0
22
8
6
86
2
1
21
0
2
1
21
2
2
22
0
2
1
21
Hem
ato
logy
2
8
5
0
0
0
2
0
2
0
85
0
2
8
5
83
2
0
0
2
2
2
2
0
2
0
Ch
emis
try,
An
alyt
ical
5
9
43
4
5
41
3
5
64
2
3
57
4
0
42
7
4
8
51
3
4
42
2
3
12
5
2
49
3
5
51
4
5
6
22
Per
iph
eral
Vas
cula
r D
isea
se
1
79
0
0
1
1
0
1
1
7
9
1
0
79
7
9
1
1
1
1
0
0
0
1
1
1
Co
mp
ute
r Sc
ien
ce, A
rtif
icia
l In
telli
gen
ce
42
1
7
17
4
5
49
4
3
13
4
4
32
2
2
24
3
8
31
2
3
57
5
0
24
6
1
37
4
3
52
2
3
62
3
6
Co
mp
ute
r Sc
ien
ce, I
nte
rdis
cip
linar
y A
pp
licat
ion
s 4
3
30
1
3
37
4
6
49
9
5
1
33
3
4
35
4
6
34
1
9
57
4
6
35
6
0
46
2
6
46
3
2
68
4
2
Ph
arm
aco
logy
& P
har
mac
y 5
6
1
5
5
5
8
2
9
13
6
0
3
3
62
6
3
4
5
4
5
5
3
4
2
9
3
Au
tom
atio
n &
Co
ntr
ol S
yste
ms
48
3
1
38
5
6
48
5
6
31
5
6
41
3
5
10
4
8
43
3
4
43
3
1
9
53
5
3
41
5
3
4
56
3
4

18
Wo
s C
ate
gory
A
B
C
C
G
CP
E
EC
EE
FA
H
LF
MM
N
N
P
SD
T TC
TI
TP
TS
TV
TY
V
S W
F
Mu
ltid
isci
plin
ary
Scie
nce
s 1
9
63
1
6
15
1
7
20
1
4
19
1
9
63
2
1
7
63
6
3
18
1
7
2
18
1
7
17
1
6
2
20
1
6
Engi
ne
erin
g, E
nvi
ron
men
tal
42
5
2
36
3
4
34
5
9
31
6
6
34
4
2
2
55
4
2
21
5
8
17
3
6
2
59
4
1
58
2
6
6
20
Mat
eria
ls S
cien
ce, C
oat
ings
& F
ilms
56
3
5
30
3
6
41
6
2
28
5
1
27
3
0
18
5
3
49
9
2
6
14
1
6
39
4
9
37
2
6
0
39
1
4
Fish
erie
s 6
4
64
6
5
65
6
4
65
6
4
65
6
6
64
0
6
4
64
6
5
64
6
5
0
64
6
4
64
6
4
0
65
6
4
Ch
emis
try,
Ap
plie
d
25
2
5
33
3
3
34
3
4
24
4
2
50
1
8
5
28
2
3
23
2
4
18
1
2
7
32
1
9
28
0
2
9
19
Cel
l Bio
logy
5
6
4
6
3
3
7
3
6
5
62
0
5
6
4
62
4
3
2
4
6
4
6
0
6
3
Vet
erin
ary
Scie
nce
s 5
9
63
5
9
59
5
9
59
5
9
59
5
9
63
0
5
9
63
6
3
59
5
9
0
59
5
9
59
5
9
0
59
5
9
Car
dia
c &
Car
dio
vasc
ula
r Sy
stem
s 9
5
1
2
2
9
9
2
9
9
51
7
2
5
1
51
9
9
7
9
2
2
2
7
9
9
Op
tics
5
6
36
2
9
36
3
8
39
2
6
49
3
0
19
2
4
52
4
3
3
41
2
7
9
34
2
6
38
3
0
4
25
2
7
Ch
emis
try,
Mu
ltid
isci
plin
ary
41
4
4
38
2
6
20
4
7
19
3
0
22
4
4
1
45
5
2
24
2
3
13
5
3
1
31
2
6
33
0
3
3
13
Ph
ysic
s, C
on
den
sed
Mat
ter
49
4
1
34
3
0
30
5
2
24
4
3
25
4
0
5
51
4
9
20
3
0
17
7
4
1
45
3
6
39
0
4
3
17
Rad
iolo
gy, N
ucl
ear
Med
icin
e &
Med
ical
Imag
ing
19
3
0
5
4
21
2
3
2
23
2
1
30
1
7
3
31
3
2
19
1
9
18
2
0
5
3
2
17
2
3
18
Engi
ne
erin
g, B
iom
edic
al
35
2
5
19
3
1
34
3
5
19
4
4
32
3
5
23
3
2
35
2
3
35
4
1
23
3
6
31
2
0
32
1
4
44
4
1
Bio
chem
ical
Res
earc
h M
eth
od
s 2
0
36
9
1
1
11
2
4
5
21
1
4
35
4
1
7
37
3
0
17
1
1
5
20
1
8
15
1
8
4
23
9
Engi
ne
erin
g, In
du
stri
al
27
9
8
4
6
27
2
7
7
30
7
1
8
19
4
1
19
6
2
3
25
2
1
38
3
9
10
4
8
11
4
2
33
Ther
mo
dyn
amic
s 1
4
4
46
4
8
46
4
8
46
4
8
46
1
0
4
4
3
3
44
1
0
4
4
46
3
4
4
0
48
1
Engi
ne
erin
g, C
ivil
29
3
2
37
3
7
39
4
4
31
4
5
32
2
9
3
39
3
3
29
3
6
26
8
4
0
45
3
3
37
3
4
7
25
Mic
rob
iolo
gy
38
4
2
37
3
5
36
3
8
35
4
0
39
4
2
1
37
4
2
42
4
0
36
1
4
0
37
3
7
37
1
4
0
36
Mec
han
ics
17
2
1
26
3
3
22
3
8
18
3
4
22
8
5
3
0
10
8
2
1
3
1
31
3
6
9
32
0
3
9
4
Wat
er R
eso
urc
es
30
3
8
23
2
3
22
4
0
19
4
2
23
3
0
0
38
3
1
16
3
7
12
1
3
7
41
3
0
40
0
4
2
12
Co
nst
ruct
ion
& B
uild
ing
Tech
no
logy
2
0
22
3
2
30
4
0
39
3
0
40
2
6
20
2
3
1
28
2
3
23
2
1
8
31
4
0
25
2
5
1
35
2
1
Nu
trit
ion
& D
iete
tics
2
0
25
2
2
22
2
1
24
1
7
26
3
1
26
2
1
8
25
2
9
19
2
2
2
20
1
9
17
1
8
2
23
1
9
Op
erat
ion
s R
esea
rch
& M
anag
em
ent
Scie
nce
1
1
8
9
39
3
3
13
7
1
4
9
9
25
3
7
9
9
32
3
3
25
3
5
36
8
3
8
24
3
9
33
Tele
com
mu
nic
atio
ns
35
2
1
6
14
1
5
36
1
1
36
1
9
28
7
2
9
24
8
3
8
22
1
2
38
2
2
33
2
7
7
34
1
8
End
ocr
ino
logy
& M
etab
olis
m
10
3
7
11
1
1
10
1
1
10
1
1
11
3
7
0
10
3
7
38
1
0
11
0
1
0
10
1
0
10
0
1
1
10
Co
mp
ute
r Sc
ien
ce, I
nfo
rmat
ion
Sys
tem
s 1
6
8
3
14
1
9
20
6
2
0
13
1
2
11
1
5
9
10
2
4
28
1
4
25
1
1
20
1
6
11
2
8
17
Geo
scie
nce
s, M
ult
idis
cip
linar
y 3
0
30
3
1
32
3
5
35
3
1
35
3
1
30
0
3
0
31
3
1
30
3
0
0
31
3
5
30
3
0
0
32
3
0
Engi
ne
erin
g, M
ult
idis
cip
linar
y 2
6
13
1
5
25
2
1
32
1
3
29
1
7
15
3
2
1
20
1
4
17
1
1
3
26
2
2
17
2
5
3
30
1
4
Mat
eria
ls S
cien
ce, C
om
po
site
s 2
8
18
2
0
21
2
2
30
1
5
29
1
5
18
2
2
2
21
1
5
19
1
0
0
28
2
7
16
2
9
0
27
1
2
Agr
icu
ltu
re, D
airy
& A
nim
al S
cie
nce
3
1
31
3
2
31
3
1
31
3
1
32
3
2
31
0
3
1
31
3
1
31
3
1
0
31
3
1
31
3
1
0
31
3
1
Soil
Scie
nce
3
2
32
3
2
32
3
2
32
3
2
32
3
2
32
0
3
2
32
3
2
32
3
2
0
32
3
2
32
3
2
0
32
3
2
Agr
icu
ltu
re, M
ult
idis
cip
linar
y 1
7
17
2
0
18
1
8
17
1
7
20
3
0
17
0
1
7
17
2
0
19
1
7
0
19
1
8
17
1
8
0
20
1
7
Ro
bo
tics
2
1
4
11
1
4
11
1
3
4
13
1
2
6
1
7
21
1
1
20
5
1
2
1
13
2
1
22
0
1
4
5
Info
rmat
ion
Sci
ence
& L
ibra
ry S
cien
ce
2
22
5
2
5
5
5
5
2
2
2
0
5
25
2
2
2
4
3
5
5
7
2
0
7
2
Pla
nt
Scie
nce
s 2
1
24
2
2
22
2
1
23
2
0
21
2
3
24
1
2
2
26
2
4
21
2
1
1
21
2
0
22
2
2
1
21
2
1
Eco
logy
2
4
23
2
2
25
2
4
25
2
4
26
2
2
23
1
2
6
25
2
1
23
2
2
1
25
2
4
22
2
6
0
24
2
2

19
Wo
s C
ate
gory
A
B
C
C
G
CP
E
EC
EE
FA
H
LF
MM
N
N
P
SD
T TC
TI
TP
TS
TV
TY
V
S W
F
Bio
ph
ysic
s 1
7
14
8
1
2
10
1
7
3
16
9
1
7
6
16
1
7
11
1
0
9
6
15
1
5
7
15
3
1
7
10
Co
mp
ute
r Sc
ien
ce, S
oft
war
e En
gin
eeri
ng
16
1
3
2
5
6
16
1
1
8
3
14
6
1
7
14
1
1
7
11
5
1
8
17
1
8
17
4
2
3
6
Toxi
colo
gy
6
10
8
7
7
7
6
9
2
2
10
0
6
1
0
11
6
6
1
6
8
6
8
0
8
6
Envi
ron
men
tal S
tud
ies
19
1
9
18
2
0
21
2
1
18
2
2
18
2
0
2
21
2
0
18
2
0
20
2
2
0
23
1
9
21
1
2
1
20
Spec
tro
sco
py
13
3
7
9
2
2
21
5
2
3
13
3
1
0
6
5
4
10
8
9
1
3
15
3
5
7
1
5
8
Mat
hem
atic
al &
Co
mp
uta
tio
nal
Bio
logy
1
4
12
2
5
9
1
4
2
16
8
1
4
9
11
1
4
6
15
1
2
9
15
1
1
9
11
7
1
8
11
Ph
ysio
logy
5
1
8
4
5
6
5
3
7
6
19
3
4
1
9
19
5
6
3
5
5
3
5
2
7
6
Met
eoro
logy
& A
tmo
sph
eric
Sci
en
ces
12
1
2
11
1
1
17
1
8
12
1
9
11
1
3
0
12
1
3
11
1
2
13
0
1
3
18
1
5
12
0
1
5
12
Mat
hem
atic
s, A
pp
lied
1
2
11
0
0
3
1
2
0
12
3
1
1
3
9
11
2
1
2
9
3
12
9
1
5
9
3
18
3
Agr
on
om
y 1
9
19
1
9
19
1
9
19
1
9
19
1
9
19
0
1
9
19
1
9
19
1
9
0
19
1
9
19
1
9
0
19
1
9
Bio
div
ersi
ty C
on
serv
atio
n
19
1
9
19
1
9
19
1
9
19
1
9
19
1
9
0
19
1
9
19
1
9
19
0
1
9
19
1
9
19
0
1
9
19
Pu
blic
, En
viro
nm
enta
l & O
ccu
pat
ion
al H
ealt
h
7
14
6
9
7
7
7
1
1
8
18
2
9
1
7
14
6
8
2
7
8
6
9
0
8
8
Vir
olo
gy
2
18
2
2
2
2
2
2
2
1
8
0
2
18
1
8
2
2
0
2
2
2
2
0
2
2
Mat
eria
ls S
cien
ce, B
iom
ater
ials
1
6
12
1
3
16
1
3
16
1
1
14
1
2
13
0
1
5
13
1
1
12
1
0
0
15
1
4
11
1
6
0
15
1
1
Ph
ysic
s, A
tom
ic, M
ole
cula
r &
Ch
em
ical
1
5
9
7
10
4
1
7
5
9
4
10
2
1
5
14
1
4
1
2
1
0
9
8
8
0
11
1
Aco
ust
ics
7
4
5
8
8
11
2
1
1
6
5
5
9
6
4
8
9
6
10
1
1
7
8
4
16
6
Ch
emis
try,
Med
icin
al
0
13
3
2
1
3
0
3
4
1
2
0
0
13
1
5
0
1
1
0
2
0
1
0
3
0
Co
mp
ute
r Sc
ien
ce, T
heo
ry &
Met
ho
ds
9
2
3
12
1
3
11
4
1
0
7
4
7
12
2
4
1
2
12
9
1
5
11
5
1
1
7
12
1
1
Mat
eria
ls S
cien
ce, C
har
acte
riza
tio
n &
Tes
tin
g 1
6
13
1
0
11
1
0
16
9
1
4
6
13
0
1
5
13
6
1
3
5
0
16
1
6
9
16
0
1
6
5
Nu
clea
r Sc
ien
ce &
Tec
hn
olo
gy
16
8
0
3
8
1
6
2
16
7
8
7
1
1
10
0
1
3
5
7
16
1
1
10
9
5
1
5
5
Mat
eria
ls S
cien
ce, T
exti
les
6
3
11
5
9
9
1
1
4
9
3
5
4
5
9
2
4
5
7
13
1
1
2
1
12
4
Pat
ho
logy
3
1
5
3
3
3
3
3
3
3
15
0
3
1
5
15
3
3
0
3
3
3
3
0
3
3
Ph
ysic
s, M
ult
idis
cip
linar
y 7
1
0
5
4
4
9
1
8
2
11
1
9
1
1
4
5
2
1
5
8
5
8
0
9
1
Infe
ctio
us
Dis
ease
s 1
2
14
1
2
12
1
2
12
1
2
12
1
2
14
0
1
2
14
1
4
12
1
2
0
12
1
2
12
1
2
0
12
1
2
Neu
roim
agin
g 4
1
0
0
0
4
4
0
4
4
10
4
0
1
0
10
4
4
4
4
0
0
0
4
4
4
Psy
chia
try
6
9
1
1
6
6
1
6
6
9
5
1
9
9
6
6
5
6
1
1
1
5
6
6
Res
pir
ato
ry S
yste
m
0
14
0
0
0
0
0
0
0
1
4
0
0
14
1
4
0
0
0
0
0
0
0
0
0
0
Tran
spo
rtat
ion
Sci
ence
& T
ech
no
logy
1
0
8
6
10
1
0
12
6
1
3
7
9
3
11
1
0
7
11
9
3
1
2
11
9
1
2
2
13
8
Ch
emis
try,
Org
anic
8
9
6
5
5
1
0
3
6
2
9
0
8
10
5
2
2
0
4
5
3
4
0
3
2
Co
mp
ute
r Sc
ien
ce, H
ard
war
e &
Arc
hit
ectu
re
10
4
1
6
6
1
1
2
9
3
6
3
11
4
1
9
6
5
1
2
8
6
9
3
8
5
Man
agem
en
t 0
0
0
1
2
12
0
0
0
0
0
1
2
12
0
0
1
2
13
1
2
12
1
2
1
12
1
2
13
1
2
Par
asit
olo
gy
11
1
3
11
1
1
11
1
1
11
1
1
11
1
3
0
11
1
3
13
1
1
11
0
1
1
11
1
1
11
0
1
1
11
Ergo
no
mic
s 2
0
1
1
1
3
3
2
11
1
8
8
1
0
10
1
0
9
8
2
9
1
1
0
0
10
8
Geo
grap
hy,
Ph
ysic
al
11
1
1
11
1
2
11
1
1
11
1
2
11
1
2
1
12
1
2
11
1
1
12
1
1
1
12
1
1
12
0
1
2
12
Med
ical
Info
rmat
ics
9
1
1
4
10
9
1
1
1
9
3
11
4
3
1
1
0
12
1
1
10
4
1
4
9
1
2
12
Ph
ysic
s, N
ucl
ear
6
7
6
10
9
1
2
8
12
8
3
2
1
0
6
2
7
1
2
10
1
1
6
8
0
11
1

20
Wo
s C
ate
gory
A
B
C
C
G
CP
E
EC
EE
FA
H
LF
MM
N
N
P
SD
T TC
TI
TP
TS
TV
TY
V
S W
F
Fore
stry
1
0
10
9
9
9
1
0
10
1
1
9
11
0
1
0
11
9
1
0
9
0
11
1
0
11
1
0
0
11
1
0
Imag
ing
Scie
nce
& P
ho
togr
aph
ic T
ech
no
logy
7
8
5
6
6
7
5
8
5
7
1
7
8
6
8
8
0
7
6
1
0
7
0
9
5
Cel
l & T
issu
e En
gin
eer
ing
5
10
4
3
3
5
3
4
3
1
0
0
5
10
8
4
3
0
4
4
4
4
0
4
3
Mat
hem
atic
s, In
terd
isci
plin
ary
Ap
plic
atio
ns
5
4
0
4
2
4
0
2
0
4
1
5
5
3
3
2
1
6
5
3
6
1
5
1
Surg
ery
3
9
2
3
2
3
2
4
2
10
1
4
1
0
8
3
3
1
3
4
3
4
0
4
3
Zoo
logy
4
9
5
5
5
4
4
5
5
9
0
4
9
1
0
4
4
0
4
5
4
5
0
5
4
Agr
icu
ltu
ral E
ngi
ne
erin
g 6
8
7
7
7
9
6
9
6
5
0
8
5
3
9
3
1
9
9
5
9
0
9
3
Bio
logy
3
9
2
1
1
3
1
2
1
9
0
3
9
7
2
1
0
2
2
2
2
0
2
1
Cry
stal
logr
aph
y 8
6
3
4
4
9
3
9
3
7
0
9
8
2
7
2
1
9
8
8
8
0
8
2
Der
mat
olo
gy
1
9
1
1
1
1
1
1
1
9
0
1
9
9
1
1
0
1
1
1
1
0
1
1
Ph
ysic
s, M
ath
emat
ical
3
5
0
1
3
3
0
3
2
5
2
1
5
5
2
3
2
3
1
1
1
2
3
2
Beh
avio
ral S
cien
ces
6
8
6
6
6
6
6
6
6
8
0
6
8
8
6
6
0
6
6
6
6
0
6
6
Co
mp
ute
r Sc
ien
ce, C
yber
net
ics
2
1
2
7
6
7
1
6
2
1
0
1
1
6
5
6
0
6
2
6
6
0
8
2
Ento
mo
logy
8
8
8
8
8
8
8
8
8
8
0
8
8
8
8
8
0
8
8
8
8
0
8
8
Ger
iatr
ics
& G
ero
nto
logy
1
6
2
3
1
2
1
4
2
7
2
3
8
6
1
3
3
1
4
1
4
0
4
3
Ph
ysic
s, F
luid
s &
Pla
smas
6
5
4
7
7
7
6
7
6
4
2
7
6
4
4
3
2
7
7
5
5
0
6
3
Psy
cho
logy
, Exp
erim
enta
l 0
4
0
1
0
0
0
1
0
5
1
1
5
4
0
1
1
0
1
3
1
0
1
1
Spo
rt S
cie
nce
s 0
0
1
7
0
0
0
8
0
7
8
7
7
0
0
7
7
0
7
0
7
0
7
7
Uro
logy
& N
eph
rolo
gy
0
8
0
0
0
0
0
0
0
8
0
0
8
8
0
0
0
0
0
0
0
0
0
0
Ch
emis
try,
Ino
rgan
ic &
Nu
clea
r 5
2
2
5
6
7
1
7
2
1
0
5
2
2
1
1
1
5
7
1
6
0
2
1
Reh
abili
tati
on
5
3
3
4
5
5
3
6
5
4
3
4
4
3
5
7
3
5
4
4
4
2
7
6
Stat
isti
cs &
Pro
bab
ility
6
4
0
0
2
6
0
6
2
4
2
4
4
0
6
3
2
6
4
5
4
2
7
2
Tran
spo
rtat
ion
7
6
5
7
6
7
6
7
5
6
1
7
7
5
6
6
1
7
6
6
7
0
6
6
Cri
tica
l Car
e M
ed
icin
e
1
5
0
0
1
1
0
1
1
5
1
0
5
5
1
1
1
1
0
0
0
1
1
1
Ho
rtic
ult
ure
6
6
6
6
6
6
6
6
6
6
0
6
6
6
6
6
0
6
6
6
6
0
6
6
Mic
rosc
op
y 4
4
2
2
2
4
0
4
0
4
0
2
4
2
4
0
2
4
4
2
4
0
4
0
Min
eral
ogy
3
2
2
3
6
6
3
6
2
2
0
3
3
2
2
2
0
3
5
2
3
0
2
2
Myc
olo
gy
6
6
6
6
6
6
6
6
6
6
0
6
6
6
6
6
0
6
6
6
6
0
6
6
Ort
ho
ped
ics
0
2
2
2
0
0
0
4
0
4
4
2
4
2
0
2
2
0
2
0
2
0
2
2
Psy
cho
logy
0
3
0
3
0
0
0
3
0
6
3
3
6
3
0
3
3
0
3
0
3
0
3
3
An
ato
my
& M
orp
ho
logy
0
5
0
0
0
0
0
0
0
5
0
0
5
5
0
0
0
0
0
0
0
0
0
0
Evo
luti
on
ary
Bio
logy
5
3
3
5
5
5
5
5
3
3
0
5
5
3
3
3
0
5
3
3
5
0
3
3
Inte
rnat
ion
al R
elat
ion
s 5
5
5
5
5
5
5
5
5
5
0
5
5
5
5
5
0
5
5
5
5
0
5
5
Mat
eria
ls S
cien
ce, P
aper
& W
oo
d
2
2
2
1
1
2
3
5
2
4
0
2
4
2
3
1
0
5
2
4
2
0
5
3
Med
icin
e, G
ener
al &
Inte
rnal
0
5
0
0
0
0
0
0
0
5
0
0
5
5
0
0
0
0
0
0
0
0
0
0
Min
ing
& M
iner
al P
roce
ssin
g 5
5
1
1
1
5
1
5
1
5
0
5
5
1
5
1
0
5
5
5
5
0
5
1

21
Wo
s C
ate
gory
A
B
C
C
G
CP
E
EC
EE
FA
H
LF
MM
N
N
P
SD
T TC
TI
TP
TS
TV
TY
V
S W
F
Ph
ysic
s, P
arti
cles
& F
ield
s 5
0
0
0
5
5
0
5
5
0
5
0
0
0
5
5
5
5
0
0
0
5
5
5
Co
mm
un
icat
ion
0
2
0
1
1
0
0
0
0
2
1
1
2
2
1
2
1
1
1
1
1
1
2
1
Engi
ne
erin
g, O
cean
4
4
4
4
4
4
4
4
4
4
0
4
4
4
4
4
0
4
4
4
4
0
4
4
Lan
guag
e &
Lin
guis
tics
0
0
0
3
3
0
0
0
0
0
3
3
0
0
3
4
3
3
3
1
3
3
4
3
Psy
cho
logy
, Ap
plie
d
1
1
0
4
0
1
0
4
0
4
4
4
4
0
1
4
4
1
4
1
4
0
4
4
Rem
ote
Sen
sin
g 4
3
3
4
3
4
3
4
4
4
0
4
4
3
4
3
0
4
3
4
4
0
4
3
Tran
spla
nta
tio
n
0
4
0
0
0
0
0
0
0
4
0
0
4
4
0
0
0
0
0
0
0
0
0
0
Alle
rgy
3
3
3
3
3
3
3
3
3
3
0
3
3
3
3
3
0
3
3
3
3
0
3
3
Den
tist
ry, O
ral S
urg
ery
& M
edic
ine
3
3
3
3
3
3
3
3
3
3
0
3
3
3
3
3
0
3
3
3
3
0
3
3
Dev
elo
pm
enta
l Bio
logy
1
3
1
1
1
1
1
1
1
3
0
1
3
3
1
1
0
1
1
1
1
0
1
1
Edu
cati
on
, Sci
enti
fic
Dis
cip
line
s 2
2
0
1
0
2
0
3
0
3
1
3
3
0
2
1
1
2
3
2
3
0
3
1
Engi
ne
erin
g, M
arin
e
3
2
2
3
2
3
2
3
3
3
0
3
3
2
3
2
0
3
2
3
3
0
3
2
Geo
chem
istr
y &
Geo
ph
ysic
s 2
1
1
3
2
3
2
3
2
2
0
2
3
1
2
1
0
3
2
2
2
0
3
1
Geo
grap
hy
1
1
1
3
2
1
1
2
1
2
2
3
2
1
2
3
2
2
3
1
3
1
3
3
Ger
on
tolo
gy
0
0
0
3
1
1
0
3
0
2
2
2
2
1
1
3
2
1
2
1
3
0
3
2
Lin
guis
tics
0
0
0
2
2
0
0
0
0
0
2
2
0
0
2
3
2
2
2
1
2
2
3
2
Rep
rod
uct
ive
Bio
logy
1
3
1
1
1
1
1
1
1
3
0
1
3
3
1
1
0
1
1
1
1
0
1
1
Urb
an S
tud
ies
2
2
2
3
2
2
2
3
2
3
1
3
3
2
2
3
1
2
3
2
3
0
3
3
An
esth
esi
olo
gy
1
1
1
2
2
1
1
1
1
1
1
2
1
1
2
2
1
2
2
1
2
1
2
2
Arc
hae
olo
gy
1
1
2
2
2
2
1
2
2
1
0
1
1
2
1
1
0
1
2
1
1
0
2
1
Art
1
1
2
2
2
2
1
2
2
1
0
1
1
2
1
1
0
1
2
1
1
0
2
1
Eco
no
mic
s 1
1
1
2
2
1
1
1
1
1
1
2
1
1
2
2
1
2
2
1
2
1
2
2
Engi
ne
erin
g, A
ero
spac
e
2
0
0
2
1
2
0
2
1
1
0
2
1
0
1
0
0
2
1
1
2
0
1
0
Engi
ne
erin
g, G
eolo
gica
l 0
0
1
2
2
2
2
2
1
0
0
1
2
1
0
0
1
2
2
1
0
0
2
0
Hea
lth
Car
e Sc
ien
ces
& S
erv
ices
2
0
0
0
2
2
0
2
2
0
2
0
0
0
2
2
2
2
0
0
0
2
2
2
Med
ical
Lab
ora
tory
Tec
hn
olo
gy
0
2
0
0
0
0
0
0
0
2
0
0
2
2
0
0
0
0
0
0
0
0
0
0
Op
hth
alm
olo
gy
0
2
0
0
0
0
0
0
0
2
0
0
2
2
0
0
0
0
0
0
0
0
0
0
Ped
iatr
ics
1
2
1
1
1
1
1
1
1
2
0
1
2
2
1
1
0
1
1
1
1
0
1
1
Psy
cho
logy
, Dev
elo
pm
enta
l 0
2
0
0
0
0
0
0
0
2
0
0
2
2
0
0
0
0
0
0
0
0
0
0
Agr
icu
ltu
ral E
con
om
ics
& P
olic
y 1
1
1
1
1
1
1
1
1
1
0
1
1
1
1
1
0
1
1
1
1
0
1
1
Arc
hit
ectu
re
1
1
1
1
1
1
1
1
1
1
0
1
1
1
1
1
0
1
1
1
1
0
1
1
Ast
ron
om
y &
Ast
rop
hys
ics
1
1
1
1
1
1
1
1
1
1
0
1
1
1
1
1
0
1
1
1
1
0
1
1
Au
dio
logy
& S
pe
ech
-Lan
guag
e P
ath
olo
gy
0
0
0
0
0
0
0
0
0
0
0
0
0
0
0
1
0
0
0
1
0
0
1
0
Bu
sin
ess
, Fin
ance
0
0
0
1
1
0
0
0
0
0
1
1
0
0
1
1
1
1
1
0
1
1
1
1
Edu
cati
on
& E
du
cati
on
al R
esea
rch
0
1
0
0
0
0
0
0
0
1
0
0
1
1
0
0
0
0
0
0
0
0
0
0
Edu
cati
on
, Sp
ecia
l 0
0
0
0
0
0
0
0
0
0
0
0
0
0
0
1
0
0
0
1
0
0
1
0
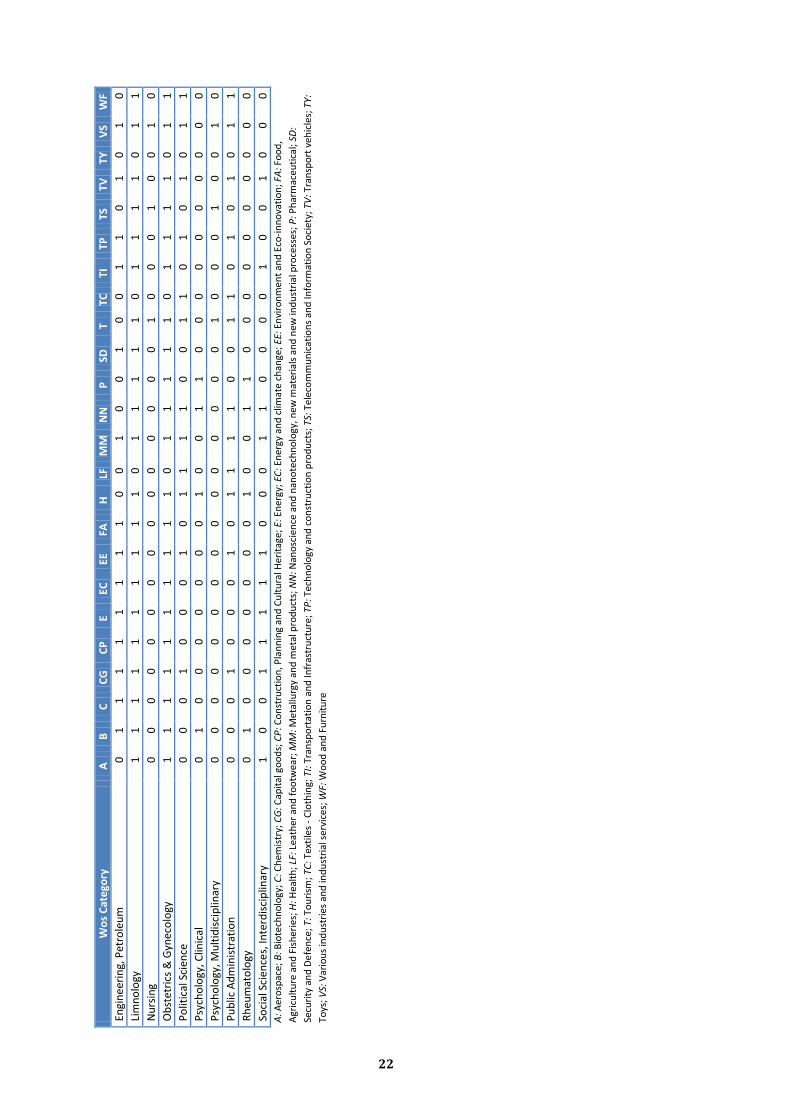
22
Wo
s C
ate
gory
A
B
C
C
G
CP
E
EC
EE
FA
H
LF
MM
N
N
P
SD
T TC
TI
TP
TS
TV
TY
V
S W
F
Engi
ne
erin
g, P
etro
leu
m
0
1
1
1
1
1
1
1
1
0
0
1
0
0
1
0
0
1
1
0
1
0
1
0
Lim
no
logy
1
1
1
1
1
1
1
1
1
1
0
1
1
1
1
1
0
1
1
1
1
0
1
1
Nu
rsin
g 0
0
0
0
0
0
0
0
0
0
0
0
0
0
0
1
0
0
0
1
0
0
1
0
Ob
stet
rics
& G
ynec
olo
gy
1
1
1
1
1
1
1
1
1
1
0
1
1
1
1
1
0
1
1
1
1
0
1
1
Po
litic
al S
cien
ce
0
0
0
1
0
0
0
1
0
1
1
1
1
0
0
1
1
0
1
0
1
0
1
1
Psy
cho
logy
, Clin
ical
0
1
0
0
0
0
0
0
0
1
0
0
1
1
0
0
0
0
0
0
0
0
0
0
Psy
cho
logy
, Mu
ltid
isci
plin
ary
0
0
0
0
0
0
0
0
0
0
0
0
0
0
0
1
0
0
0
1
0
0
1
0
Pu
blic
Ad
min
istr
atio
n
0
0
0
1
0
0
0
1
0
1
1
1
1
0
0
1
1
0
1
0
1
0
1
1
Rh
eum
ato
logy
0
1
0
0
0
0
0
0
0
1
0
0
1
1
0
0
0
0
0
0
0
0
0
0
Soci
al S
cien
ces,
Inte
rdis
cip
linar
y 1
0
0
1
1
1
1
1
0
0
0
1
1
0
0
0
0
1
0
0
1
0
0
0
A
: Aer
osp
ace;
B: B
iote
chn
olo
gy; C
: Ch
emis
try;
CG
: Cap
ital
go
od
s; C
P: C
on
stru
ctio
n, P
lan
nin
g an
d C
ult
ura
l Her
itag
e; E
: En
ergy
; EC
: En
ergy
an
d c
limat
e ch
ange
; EE:
En
viro
nm
ent
and
Eco
-in
no
vati
on
; FA
: Fo
od
,
Agr
icu
ltu
re a
nd
Fis
her
ies;
H: H
ealt
h; L
F: L
eath
er a
nd
fo
otw
ear;
MM
: Met
allu
rgy
and
met
al p
rod
uct
s; N
N: N
ano
scie
nce
an
d n
ano
tech
no
logy
, new
mat
eria
ls a
nd
new
ind
ust
rial
pro
cess
es;
P: P
har
mac
euti
cal;
SD:
Secu
rity
an
d D
efe
nce
; T: T
ou
rism
; TC
: Tex
tile
s -
Clo
thin
g; T
I: T
ran
spo
rtat
ion
an
d In
fras
tru
ctu
re; T
P: T
ech
no
logy
an
d c
on
stru
ctio
n p
rod
uct
s; T
S: T
elec
om
mu
nic
atio
ns
and
Info
rmat
ion
So
ciet
y; T
V: T
ran
spo
rt v
ehic
les;
TY:
Toys
; VS:
Var
iou
s in
du
stri
es a
nd
ind
ust
rial
se
rvic
es;
WF:
Wo
od
an
d F
urn
itu
re

23
References
Ahlqvist, T., Halonen, M., Eerola, A., Kivisaari, S., Kohl, J., Koivisto, R., Myllyoja, J., & Wessberg, N.
(2012). Systemic transformation, anticipatory culture, and knowledge spaces: constructing
organisational capacities in roadmapping projects at VTT Technical Research Centre of Finland.
Technology Analysis & Strategic Management, 24(8), 821–841.
doi:10.1080/09537325.2012.715490
Barge-Gil, A., & Modrego, A. (2011). The impact of research and technology organizations on firm
competitiveness. Measurement and determinants. The Journal of Technology Transfer, 36(1), 61-
83. doi:10.1007/s10961-009-9132-4
Barge-Gil, A., & Modrego-Rico, A. (2008). Are technology institutes a satisfactory tool for public
intervention in the area of technology? A neoclassical and evolutionary evaluation. Environment
and Planning C: Government and Policy, 26(4), 808-823. doi:10.1068/c70m
Batagelj, V., & Mrvar, A. (2013). Pajek – Program for Large Network Analysis. Retrieved from
http://vlado.fmf.uni-lj.si/pub/networks/pajek/. Accessed 28 May 2015.
Baviera-Puig, A., Buitrago-Vera, J., & Mas-Verdú, F. (2012). Trade areas and knowledge-intensive
services: the case of a technology centre. Management Decision, 50(8), 1412-1424.
doi:10.1108/00251741211262006
Giner, J., & Santa María, M. J. (2000). La política de centros tecnológicos y de servicios: la experiencia
de las regiones valenciana y Emilia-Romagna. Revista de estudios regionales, 57, 131-149.
Gómez, I., Bordons, M., Morillo, F., & Fernández, M. T. (2005). Regionalisation of science and
technology data in Spain. Research evaluation, 14(2), 137-148. doi:10.3152/147154405781776193
IBM Corp. (Released 2013). IBM SPSS Statistics for Windows. Version 22.0. Armonk, NY: IBM Corp.
Mas-Verdú, F. (2007). Services and innovation systems: European models of Technology Centres.
Service Business, 1(1), 7–23. doi:10.1007/s11628-006-0002-y
Modrego-Rico, A., Barge-Gil, A., & Núñez-Sánchez, R. (2005). Developing indicators to measure
technology institutes' performance. Research Evaluation, 14(2), 177-184.
doi:10.3152/147154405781776229
Morillo, F., Aparicio, A., González-Albo, B., & Moreno, L. (2013a). Towards the automation of
addresses identification. Scientometrics, 94(1), 207-224. doi:10.1007/s11192-012-0733-6
Morillo, F., González-Albo, B., & Moreno, L. (2014). Public-private co-publications beyond university-
industry links. In Proceedings of STI 2014 Leiden. Retrieved from
http://sti2014.cwts.nl/download/f-y2w2.pdf. Accessed 28 May 2015.

24
Morillo, F., Santabárbara, I., & Aparicio, J. (2013b). The automatic normalisation challenge: Detailed
addresses identification. Scientometrics, 95(3), 953–966. doi:10.1007/s11192-013-0965-0
Schramm, L.L., Nyirfa, W., Grismer, K., & Kramers, J. (2011). Research and development impact
assessment for innovation-enabling organizations. Canadian public administration, 54(4), 567-
581. doi:10.1111/j.1754-7121.2011.00193.x