Embed Size (px)
Citation preview


Of TfCf^


1D28
.1:414
iHsr.'o^r
NOV 191986
J-/aJiAW**
WORKING PAPER


^k Behavioral Theory of Interest Rate Formation
by
James H. Hines, Jr.
WP- 177 1-86 January 1986

HO 28
^, 1773 U
NOV 2 1986

A Behavioral Theory of Interest Rate Formation
James H. Hines, Jr.
Sloan School of Managment
Massachusetts Institute of Technology
Introduction, This paper developes and marshals empirical support for a theory of the
nominal, short-term, risk-free interest rate. Unlike most approaches to the problem, the
formulation presented here does not assume equality of supply and demand for securities. Rather,
the formulation is a mechanism which would help to bring supply and demand into balance in a
larger macroeconomic model. Empirical support is offered at two levels of aggregation: Empirical
studies of individual human decision making are used to suggest an appropriate structure; the
structure is then estimated using macro-economic data.
In the proposed formulation the risk free interest rate moves in response to liquidity
pressures experienced principally by intermediaries. Liquidity pressures cause movements in the
interest rate relative to the "underlying interest rate", a construct which represents the interest rate
environment to which people have become accustomed.
The formulation has grown from work on the M.I.T. System Dynamics National Model
(for a description of the modeling project see Forrester 1984 and 1979). The National Model is a
simulation model of an industrial economy. It possesses two production sectors, a household
sector, a financial sector, and a government sector. The Model is intended to aid in understanding
the major behavior modes of industriahzed economies including the business cycle, the Kuznets
cycle, the economic long wave, inflation and deflation, and economic growth. (For discussion of
the several major economic behavior modes see Schumpeter 1944; Volker 1978; and Forrester
1976, 1982).
In some respects the National Model represents a departure from prior economic modeling.
The nature of this departure gives rise to the need for a new interest rate formulation. Three
characteristics are particularly important in this regard. First, the National Model does not permit
exogenous time-dependent inputs l; consequently, exogenous interest rates could not be used as
explanatory variables in the interest rate formulation. Using exogneous interest rates begs the
question of how interest rates are formed. Second, the National Model unfolds in continuous time,
and, therefore, the use of simultaneous equations is less appropriate than in most other economic
1. More precisely, the only exogenous inputs are noise and idealized test inputs designed to
disturb the system and elicit its dynamic response.

models. Finally, model construction has emphasized the portrayal of decision making heuristics
more than the derivation or application of optimizing decision rules.
The emphasis on the nominal, short-term, risk-free interest rate is one of convention. The
important simplifying strategy in a macro-model examining major movements in the economy (as
opposed to fine movements in interest rates) is to form one basic interest rate with strict regard to
the rigor imposed by the requirements of behavioral modeling. Other rates can then be derived
from this one as needed. Any rate can be regarded as basic; other rates may then be calculated by
adjustments up or down depending upon whether those rates are more or less risky than the basic
rate^.
As the basic rate, I have chosen the nominal, short-term, risk-free interest rate. This choice
is in broad keeping with economic tradition, although many theorists would focus on the real,
short-term, risk-free interest rate. In the United States, however, there are no instruments carrying
the real rate, and consequendy representing demand and supply pressures in a behavioral model
might become problematic were the real rate used. The nominal risk-free, short-term interest rate,
on the other hand, corresponds closely to the interest rate on a federal government note. The note
is virtually risk-free in terms of default risk because the government has the ability to print money
to pay its debt.^
The first section following considers the the more traditional equilibrium approach to
interest rate formation including Walras' taonnement adjustment process. The next section
presents an alternative adjustment process based upon a modification to Walras' auctioneer. The
"auctioneer" of the new formulation permits trades out of equilibrium and is willing to buy and sell
for his own account The third section of this paper discusses the behavior of the new formulation
and summarizes statistical tests.
1. Simultaneous Equations and Tatonnement
Simultaneous Equations. The theory of interest rate formation developed in this essay
is fundamentally a supply and demand formulation. The formulation, however, is distinguishable
from supply-demand formulations in most other econometric work. In such work interest rates are
2. Translations between short and long rates would also involve expectations regarding changes
in the short or long rates and, perhaps, risk premia for different maturity habitats (Modigliani
and ShiUer 1973, Modigliani and Sutch 1966).
3. There have been instances in which governments have defaulted on debt denominated in local
currency, although such instances are not common. The default risk on the debt of the
industrialized nations is extremely small.
JHH42.2 1/14/86 2

chosen to equate desired supply and desired demand (see for example, Friedman 1980a, 1980b,
1977; Friedman and Roley 1980, Modigliani, Rasche, and Cooper 1970, Hendershott 1977,
Bosworth and Duesenberry 1973). More specifically, the desired (primary) purchases of a
security by lenders and the desired issues of that security by borrowers are specified as functions
of the interest rate on that security. The condition that desired purchases (demand) equal desired
issues (supply) is then imposed. With this condition the desired amount of securities and the
interest rate can be determined.'*
For example, if g(i,z) is a function determining desired loans DL (or securities purchases)
and f(i,z) a function determining desired borrowing DB (or issues), where "i" is the interest rate
and "z" is exogenous factors; a system of three simultaneous equations may be written:
DL = g(i,z) (1)
DB = f(i,z) (2)
DL = DB. (3)
Equations (1) and (2) may be substituted into (3) to yield
g(i,z)=f(i,z) (4)
which may be solved for a unique interest rate i under suitable restrictions on g and f The interest
rate so discovered may then be substinated into either (1) or (2) to uncover the amount demanded
and supplied.
It might be noted that the simultaneous equations approach is an equilibrium approach. In
equilibrium desired quantities equal actual quantities.^ The desires of sellers and buyers can both
be fulfilled only if the quantities they each have in mind are the same, otherwise one of the groups
will find itself short of transacting parmers. The simultaneous equations approach requires that
4. Modigliani, Rasche and Cooper (1970) equate the public's demand for demand deposits to the
supply offered by banks. The IS-LM approach makes use of simultaneous equalities between
goods supplied and goods demanded (IS) and between money demanded and money supplied
(LM) to obtain equilibrium figures for GNP and interest rates (Dombusch and Fischer 1981,
Ch. 4, eq. 6a and 12a).
5. More precisely, desired quantities equal actual quantities in a stress-free equilibrium. Mostgenerally, an equilibrium might be considered as a condition in which aU states (integrations)
of a system are constant or are growing at a constant rate. Such a condition can result whendesires are not fulfilled but where opposing forces in the system conspire to prevent further
movement of actual quantities toward desired. This is termed a "stressed" equilibrium. There
is a pervasive beUef among economists (including economists working in the system
dynamics tradition) that actors in the economic system can analyze a stressed equilibrium and
take action to achieve a more satisfactory equilibrium.
JHH42.2 1/14/86 3

sellers' desired quantities always equal buyers' desired quantities (equation 3). Hence, the
simultaneous equations approach carries the assumption that financial markets are always in
equiUbrium.
Real-life interest rates are not literally determined by the solution of simultaneous
equations. This conclusion results both from observation (people do not appear to solve
simultaneous equations) and from a recognition of the informational and cognitive limitations
faced by decision makers: No individual or group of individuals could possibly know all the
functions of all the players in the financial markets. And, even if all functions were known, the
solution of the set of simultaneous equations resulting therefrom would be prohibitively expensive,
if possible to achieve at all.
Since the process of solving simultaneous equations does not literally describe the real
world process of interest rate formation, use of simultaneous equations in models of interest rate
determination must rest upon the assumption that a process exists in the real world which quickly
equates the desired demand to the desired supply of securities (Cf. Eberlein 1984, p. 183 ff.), . In
a modeling context, "quick" means quick in relation to other processes represented in the larger
model within which the interest rate formulation is embedded. In an empirical context, "quick"
means quick relative to the frequency of observations.
The use of simultaneous equations in the present context seems less appropriate than in the
work of Friedman and others cited above for two reasons. First, the previously cited work was
intended for quarterly models, while the formulation presented in these pages is intended for a
continuous-time model. Second, the formulation presented below is intended to account for the
general level of interest rates, not the differences between rates on different securities. Since most
of the previously cited work includes,as explanatory variables, rates on other securities; that work
may be considered as accounting for interest rate differentials which may move faster than the
entire structure of interest rates taken as a whole.
^
The Adjustment Process. The present work does not assume simultaneities, but
focusses on the process which moves interest rates toward equilibrium. Walras (1954)
appropriately called this process "a groping" or tatonnement process. In Walras' formulation, an
"auctioneer""^ calls out an interest rate, participants make offers to lend and borrow at this interest
6- Modigliani, Rasche and Cooper (1970) do not use exogenous interest rates as explanatory
variables.
7. The term "auctioneer" is common. "Master of Ceremonies" would better describe the intended
function.
JHH42.2 1/14/86 4

rate. If desired loans do not match desired borrowing, the auctioneer calls out a new interest rate.
He continues in this fashion until offers to borrow equal offers to lend, at which point he permits
the participants to transact
While Walras' process is considered even by those who use it as "a fairly extreme
idealization of the mechanism by which prices are determined" (Malinvaud 1972, 140), it is well to
note that it is actually only a bit less unwieldly than the solution of simultaneous equations. Instead
of requiring massive amounts of information and computational power, this process requires the
massive and patient cooperation of institutions and the public at large. The process is really little
more than a hypothetical computational technique for the solution of a set of simultaneous
equations (Goodwin 1951).
2. An Alternative Adjustment Process.
Realism and Computational Ease. The lack of realism in Walras' tatonnement may
be identified in at least two linked ways. First, transactions cannot take place before an equilibrium
price is determined, whereas on real-world commodity and stock exchanges "without exception
contracts are made at each of the prices called." (Malinvaud p. 139). Second, the auctioneer,
although a kind of intermediary, is not permitted to take a position in the market, that is, he is not
permitted to buy and sell for his own account; unlike his real-life counterparts. Realism may be
improved, therefore, by permitting transactions out of equilibrium and permitting the intermediary
to buy and sell for his own account.
A straightforward improvment in realism may be achieved by replacing Walras' auctioneer
with an aggregated financial intermediary. The simplification involved in taking this step is quite
the reverse of that made by Walras: The intermediary, rather than being a party to no transactions,
can be assumed to be a party to every transaction. Such an arrangement decreases the
computational effort required by the auctioneer and points the way to a realistic and practical way
of representing interest-rate determination in a dynamic, continuous-time macro-economic model.
If the intermediary stands ready to borrow and lend, it will find the information necessary
to set interest rates encapsulated in its inventory of securities or of money. The inventories
integrate, and thereby summarize, the entire history of transactions. A large inventory of securities
or a small inventory of money indicates borrowers have been selling securities to the intermediary
at a rate greater than investors have been buying securities from it. When the intermediary's
money balances are low, that is when it is illiquid, it should, and it will be motivated to, raise the
JHH42.2 1/14/86

price at which it will buy or sell from its own account^. The converse holds when securities are
low and liquid funds are high.
Assuming that intermediaries are prepared to buy and sell from their own accounts at a
price (as long as their supplies last) implies a decoupling of quantities demanded and supplied. If
intermediaries are wilUng to absorb differences between supply and demand, at least while their
inventories last, there is no rigid requirement that desired supply equal desired demand in the non-
intermediary sectors. Hence, the formulation suggested here is a disequilibrium formulation in the
sense that desired supply does not have to equal desired demand.^
It is important to note that while the formulation does not assume equality between supply
and demand, it does not preclude equality. Indeed, this formulation would be one of the
mechanisms tending to bring a larger macro-economic model to an equilibrium in which desired
demand for securities equals desired supplies.
It is interesting that the description of interest rate formation in terms of intermediaries is
valid for the particular market in which the risk-free rate is set. In that market government
securities dealers are the primary intermediary (often dealing with other intermediaries such as
banks). In giving a first-hand description of the Federal Reserve's open market transactions on a
particular day, Paul Meek (1978) writes: "...A last-minute contact with the traders indicates that
banks and others are beginning to sell treasury bills to dealers in greater volume than buyers are
taking from them. Dealers are raising the rates they are bidding for treasury bills...". I might add
that dealers at this point have a low "inventory" of liquid funds.
The question remains as to how to formulate, in a way consistent with observation, the
manner in which intermediaries determine a reasonable interest rate. In the modem interpretation
of Walras (Samuelson's (1947, p. 270), Goodwin 1951, Negishi 1962) price movement (dp/dt) is
proportional to the difference between supply and demand. This formulation possesses the virtue
of simplicity and may be well suited to the analytical needs of stability theory, but it is not well
grounded in empirical observation of how people make decisions and is, therefore, less well suited
to the needs of a behavioral macro-economic model. In addition, the formulation assumes
continuity in interest rate movements. Since prices are not physical accumulations, there is no
8. An intermediary may also restrict its lending activities.
9. A further way in which the formulation can be a disequilibrium formulation is that there is no
requirement that sectors receive what they desire. This is consistent with the observed
occurrence of credit crunches (Sinai 1976).
JHH42.2 1/14/86 6

reason to make this assumption. It is desirable to create a formulation which does not assume
continuity and which is firmly grounded in observation of human decision making.
An appropriate place to begin thinking about the way people choose rates is the literature on
individual decision making. A large and growing body of such work suggests that the process
termed "adjustment and anchoring" is a common strategy for arriving at judgments like interest rate
determination (Hogarth 1980 p.47, Tversky and Kahneman 1974, Kleinmuntz 1985). In the
adjustment and anchoring process people come to a judgment by adjusting a preexisting quantity
(the anchor) to take account of currently available information.
The empirically observed adjustment and anchoring strategy is here hypothesized to
undergird the interest rate setting process in the real world. ^^ More particularly, it is hypothesized
that in the presence of supply and demand imbalance, summarized by the inventory positions of
intermediaries 1 ^ people choose a current interest rate by adjusting up or down an anchor here
termed the "underlying interest rate". The underlying interest rate represents the interest rate
environment to which people have become accustomed.
A mathematical formulation suitable for use in a simulation model involves clarifying three
issues. First, it is necessary to consider the manner in which the current interest rate is adjusted
above or below the anchor; second, the way people form the anchor itself must be considered; and,
finally, the manner in which inventories are translated into an adjustment tenn must be described.
Multiplicative Adjustment. Kahneman and Tversky (1982, p. 168) present results
suggesting that a given difference in price is perceived as less important as the price increases. For
example a five dollar difference in price on a $15 item is subjectively more important than a five
dollar difference on a $125 item. This suggests that for a given state of liquidity the difference
between the anchor and the risk-free rate should increase as rates increase in order for the
psychological impact of the difference to remain the same. A functional form in which the effect of
hquidity enters multiplicatively possesses this characteristic.
TO^ This discussion makes an aggregative leap. Hogarth (1980) and Tversky and Kahneman(1974) examined individual decision making. Here I am discussing an aggregation of
decisions made by many people. As discussed below, this consideration suggests the need
for empirical validation at a macro level.
11. It is possible to formulate this either on the basis of the inventory positions of intermediaries
alone or on the basis of the inventory positions of both intermediaries and non-intermediaries.
For realistic adjustment times in the non-intermediary sector, there is Uttle dynamic difference
since money-inventory imbalances are corrected quickly.
JHH42.2 1/14/86 7
RFIRt=UIRt*ELRt (5)
ELRt=f(i"tS''"^^i^^s' liquidityt) (6)
Where RFIR- Risk Free Interest Rate
UIR - Underlying Interest Rate
ELR - Effect of Liquidity on the risk free Rate
f A decreasing function
In equation 5 the effect of supply and demand enters multiplicatively, indicating that the
difference between the risk free rate and the underlying rate depends upon the underlying rate.
Hence, during periods of high interest rates, indicated by a high value of UIR (see below), the gap
between UIR and RFIR will be greater than during periods of low rates for identical values of
ELR.
The Underlying Interest Rate. The underlying rate, analogous to the "underlying
inflation rate" or the "underlying unemployment rate", is that rate which people feel generally holds
at the present time, abstracting from the effects of transitory pressures on the actual interest rate.
The underlying interest rate is the reference condition to which people have become accustomed; it
continually adjusts as interest rates change and people become accustomed to the changed
environment A weighted average with recent experience weighted most heavily would seem to be
an appropriate mathematical representation of this concept An exponential average possesses this
property and is easily representable in a simulation model (Forrester1961, p. 406-4 11). While a
small modification will be considered in the section of this essay dealing with behavior and in
appendix 2, for most purposes the underlying rate may be defined as:
UIRt= (RFIRt - UIRt)/TAUIR (7)
Where UIR -Underiying Interest Rate
RFIR -Risk Free Interest Rate
TAUIR -Time to Adjust Underlying Interest Rate
and the dot (•) represents a time derivative.
The speed of adjustment of UIR toward RFIR depends on the parameter TAUIR. The
diagram below charts the adjustment path of UIR for a step increase in RFIR for several values of
TAUIR.
JHH42.2 1/14/86
1 UIR1
Exponential Adjustment Paths
2 UIR2 3 UIR3
il
k\
il
l)
1.000
0.750 -
0.500
0.250
0.0

rate will be the same in an equilibrium with constant nominal rates and no maturity preferences.
Hence, a notion of a future stress-free (hence, equilibrium) short rate is very close to a notion of a
normal long rate. Indeed, Modigliani and Sutch (1966) (M-S) suggest that Keynes's normal rate
can be approximated by a weighted average of past experience where recent experience is weighted
most heavily. An exponential average possesses this property; hence, (7) conforms to the M-S
computational form of the normal rate.
Modigliani and Sutch also considered an extrapolative component in expectations of future
rates. M-S, however, were concerned with interest rate expectations over the entire course of the
future, rather than with the very long-run expectation of the future short rate. It seems possible
that the extrapolative component reflects expectations of continuing pressures over the short and
medium term. Such extrapolative terms may not be present in the expectation of the future short
rate at such time when pressures have relaxed.
Modigliani and Shiller (1973) reconsidered the problem of interest rate expectations in the
light of inflationary expectations. They concluded that interest rate expectations include a separable
effect of inflation. Whether this would hold true for the underlying rate which connotes a rate to
which people have become accustomed is less clear. In any event, the fact that the extrapolative
component may be unimportant in forming the underlying rate suggests that a separate impact of
inflation might be difficult to discern if expectations of inflation are also regressive (cf. Modigliani
and Shiller, 20-21).
Effect of Liquidity. While the terminology of "liquidity" tends to restrict attention to
money balances, it is well to note that the effect with which we are concerned can be viewed as a
function either of the inventories of securities or the inventory of money. One can work with either
inventory because an increase in one implies an equal decrease in the other.
Because the concern here is with movements common to rates on all securities, a potentially
troublesome aggregation issue can be largely avoided by considering the inventory of money, since
instruments used as money will be quite similar. Consequendy, money inventories will be
explicitly considered and the "liquidity" terminology is descriptive.
The simplest variable measuring the state of Uquidity is the difference between actual and
desired money holdings. However, this difference will be sensitive to the price level and
institutional size, which one might expect to be unimportant in the determination of interest rates.
Inventory discrepancies, therefore, should be measured relative to some base. Either desired
inventories or actual inventories are prime candidates. Choosing inventories as the base yields the
following expression where intermediaries' money inventories are termed "reserves":
JHH42.2 1/14/86 10

ELR = f(RAR)RAR = (R-DR) / R

considering the relative available reserves of the banking system where, as discussed below,
desired reserves are taken to be identical to required reserves. RAR went as low as -.25 during
1984 and as high as 0. Rates remained between 1 1% and 8%. Consequently, a value of a in the
range of 1 or 2 would seem reasonable.
3. Behavior and Estimation.
Behavior. Equations 5,7,9, and 10 constitute a theory of interest rate formation. The
equations are reproduced below for convenience.
RFIRt = UIRt*ELRt (11)
UIRt = (RFIRt - UIRt)/TAUIR (12)
ELRt = f(RARt) = e-«*RAR^ (13)
RARt = (Rf DRt) / Rt (14)
Where -RFIR - Risk Free Interest Rate
UIR - Underlying Interest Rate
ELR - Effect Liquidity on the risk free Rate
TAUIR - Time to Adjust Underlying Interest Rate
R - Reserves
DR - Desired Reserves
JHH42.2 1/14/86 12

The stock and flow diagram'^ of the structure may be drawn as follows:
A sense for the dynamics implied by the above structure may be gained by considering a
plot, shown below, from a simulation. In this simulation TAUIR (measured in years) and a are
both set to 2, a reasonable value for each as discussed above. Initially UIR is 2% per year, and
reserves are set equal to desired reserves, so RAR begins at its equilibrium value of zero. The
structure is disturbed from equilibrium by a 10% step decrease in reserves; after some years
reserves step up to their original (equilibrium) level. Plotted in the diagram below are the risk free
interest rate RFIR, the underlying interest rate UIR, and relative available reserves RAR.
12. Stock and flow diagrams are in common use in system dynamics. They provide a close
pictorial representation of a system of integral equations. The diagrams appear in several
styles, the above diagram was created using STELLA® on a Macintosh computer. In the
above diagram, the box represents an integration. The "Pipeline" arrow into the box
represents a rate of flow which is controlled by the "valve" symbol termed CUIR (Change in
UIR). CUIR, mathematically, is the time derivative of UIR. Circles represent constants or
functions. Single-line arrows represent information connections and reveal the arguments of
each function. For a good discussion of diagramming conventions in system dynamics see
Richardson andPugh (1981, chapters 1-2).
JHH42.2 1/14/86 13

1 RAR
Interest Rate Formulation Simulated Behavior
2 RFIR 3 UIR
1
i)

The analysis of the above behavior provides the logic for uncovering a flaw in the
formulation. Just as the structure causes interest rates to increase exponentially in response to a
maintained decrease in reserves, the structure will cause rates to decay exponentially in response to
a maintained increase in reserves. Equation 11, however, indicates that once the underlying rate
reaches zero, the risk free rate will also equal zero. Equation 12 indicates that if the two rates are
identical, no further movement occurs in the structure. Consequently this structure carries the
small risk that rates will get "stuck" at zero.^^ The appendix to this essay contains a small
modification to the structure developed above which removes the risk entirely. Since evidence of
the small modification would be difficult, if not impossible, to pick up in the available time-series
data, I proceed directly to a discussion of empirical validity.
Estimation. The structure developed above has been based upon empirical observation
at the individual level, whereas it is intended to represent macro behavior. It is necessary now to
present evidence that the formulation is consistent with macro-economic observation. Toward this
end, the structure will be estimated econometrically, significant parameter estimates of reasonable
magnitude and predicted sign will constitute evidence that the formulation is consistent with macro-
economic data on interest rates and reserves.
The fu-st step is to convert equations 11-14 into a form which can be estimated. A
convenient way to do this is to solve the differential equation^'*. Substituting 1 1 into 12 and
solving fcr UIR yields:
ln(UIRt) = ln(UIRto) + (l/TAUIR)J(ELRs - 1) ds (15)
to
From (1 1) we know that:
UIRt = RFIRt / ELRf (16)
Substituting 16 into 15 and rearranging yields
13. In a truly continuous-time simulation, UIR will never reach zero. However, since actual
simulations must proceed by finite steps, UIR can hit zero in an actual simulation.
Furthermore, the problem of getting "stuck" does not materialize suddenly; a UIR "very close"
to zero will be "very close" to being stuck at that value.
14. It would also be possible to approximate the differential equation with a difference equation.
As win be seen, the solution of the differential equation results in a "quasi" linear equation.
The difference equation would be non-linear. Further, there is some evidence that the use ofdifference equations as an approximation to an underlying continuous-time model can cause
problems (Richardson, 1981).
JHH42.2 1/14/86 15

InCRFDlt) = ln(UIRto) + ln(ELRt) + (l/TAUIR)J(ELRs - l)ds (17).
to
Substituting for ELR using 13 and reexpressing the integral produces:
t
ln(RFIRt) = In(UIRto) - a*RARt + (lArAUIR){je-a*RAR^ds - (t-to)} (18)
to
or for estimating purposes:
ln(RFIRt)= k + z*RARt + h*{CELRt - (t-to)} (19)
Where z= (-a), h = (1/TAUIR), and CELR is a month by month accumulation.
The integration in equation 1 8 may be approximated with a month-by-month accumulation
CELR. The approximation would be exact ifRAR were constant during the month, changing only
in the instantaneous transition from one month to the next.
The entire equation may be estimated by the following method: Start with an estimate of a
and form the month-by-month accumulation of the exponential CELR. Next, estimate h and the
coefficient z using ordinary least squares. Form a new month-by-month accumulation CELR by
adjusting the old estimate of a toward (-z). Continue in this manner until the a used to form the
accumulation CELR and (-z) converge.
The question of what data to use in estimating 19 remains to be discussed. Data on the
risk-free nominal interest rate interest rate poses no significant problem since time series on
treasury bills are readily available (see appendix 1). Observation of RAR poses a greater problem.
Data relating to depository institutions can be used with the assumption that the reserve positions of
depository institutions are highly correlated with the reserve positions of other intermediaries. This
assumption is discussed at greater length below.
In forming RAR for depository institutions, a problem exists. While information
concerning the reserves of depository institutions is available (see appendix 1), data on desired
reserves is not. Here, I will use required reserves (see appendix 1) as a proxy for desired
reserves 15 7his seems conscionable since required reserves are likely the major determinant of
desired reserves. Other factors, such as changing interest rate spreads (Cf Modigliani, Rasche
15. The difficulty in deriving an estimable expression for free reserves is noted by Modigliani,
Rasche, and Cooper (1970).
JHH42.2 1/14/86 16

and Cooper (1970, especially eq. 3.11), fluctuations in the degree of Federal Reserve displeasure
at borrowing from the discount window, the covariance between deposits and withdrawals, and
the degree of risk in the lending portfolio, will result in what are likely to be minor variations in
desired reserves away from the level of required reserves.
It is possible to consider the distortion introduced by using RAR of depository institutions
instead of RAR of all intermediaries. It seems likely that the relative inventory positions of all
intermediaries are highly correlated because financial instruments may be quickly traded between
intermediaries. It is difficult to imagine a pool of excess Uquidity obtaining for a significant period
in one set of intermediaries while another class is illiquid. It must be true that tiie relative available
reserves of different intermediaries are correlated. This means that^^:
RARt = j*RARtb + et (20)
where RAR'' is relative available reserves for depository institutions, e is a disturbance term
and j>0. This means that
b
ELRt = e-«*RAR^ = e-a*J*RAR^ (21)
and the estimate (-z), obtained from 19 is actually an estimate of a*j. Since theory calls for
positive j and a, a positive estimatj'; (-z) would constitute evidence in favor of the. tiieory. i"^
OLS estimation of equation 19, using data from January of 1959 to June of 1985^^^
produces the results summarized on line 1 in figure 1 below.
16. No intercept constant appears in 20 because such a constant would imply tiiat balancedUquidity among depository institutions implies imbalanced liquidity elsewhere in the economy.This seems unreasonable.
17. Bias is also introduced by the error term in (20). In the absence of an obvious instrument nocorrection has been made for this factor.
18. The time period chosen was determined by the availability of time series data. A description
of the data used may be found in appendix 1
.
JHH42.2 1/14/86 17

Figure 1 : Estimation Results
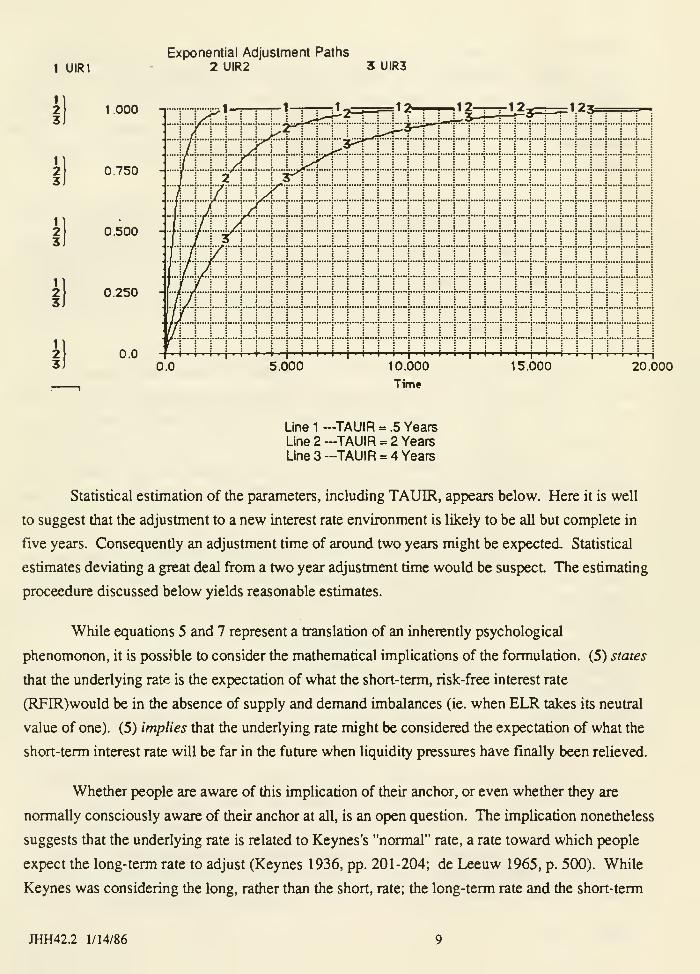
.83—a reasonable range. The autocorrelation function and partial autocorrelation functions for the
errors from this regression appear below. The process is indistinguishable from white nnispl^1_UJUl^SSS
-_JAi^A:-e«rfck,+«>A.£0ft«Ji4a J
wv^
•!
•5"*«Yj**-**««*j«»*»-.w«*« j-tljaBj^aw-—
+
4^::
In order to test the stability of these results the data has been divided in half and regressions
performed on each half. The third line of figure 1 contains estimates using data from January of
1959 to March of 1972, while the fourth line contains estimates using data from March of 1972 to
June of 1985. It is clear that decreasing the amount of data increases the variance of the estimates
of both h (1/TAUIR) and z (-a*j). Taking this increase in variance into account, the estimates
appear to be within tolerable ranges of one another indicating that the coefficients are stable. The
Chow test (Pindyck and Rubinfeld, p. 123-126) gives an explicit test of the hypothesis that the
regressions are identical. The F-statistic for this case is 1.0221. Under the hypothesis that the
regressions are identical, large values of the statistic are increasingly unlikely. Statistics greater
than 1.0221 would be expected with a probability greater than one half. Consequently, the
hypothesis seems to be quite acceptable. More formally, the hypothesis that the regressions are
identical cannot be rejected at the fifty per cent confidence level.
4. Summary and Conclusions
In this paper a behavioral theory of interest rate formulation has been developed and tested.
The theory postulates a disequilibrium adjustment process. At the heart of the theory is an
intermediary willing to buy and sell for its own account at prices which do not immediately equate
supply and demand.
The important informational input into the price setting formulation is the intermediary's
inventory of money. The inventory of money is an accumulation of the history of the non-financial
sectors' realized purchases and sales of securities. A low money inventory indicates that the non-
financial sectors have been selling securities at a rate greater than they have been buying them. An
increase in the interest rate is the appropriate response in this situation. Real-life intermediaries, in
19. As a check, a regression employing a first order correction was performed. The error termswere very definitely not white noise.
JHH42.2 1/14/86 19

fact, are motivated to increase rates under these circumstances. The converse applies when money
inventories are high and the intermediary is highly liquid.
The interest rate is adjusted up or down relative to an anchor termed the "underlying interest
rate". The underlying interest rate is the rate to which people have become accustomed. It is
represented mathematically as an weighted average of past values of the actual interest rate with
recent experience weighted most heavily.
Empirical support for the formulation exists at two levels of aggregation. Research into the
nature of human decision making at the individual level indicates that adjustment and anchoring is a
common strategy for making decisions like those involved in interest rate determination.
Econometric estimation was used to validate the process at a macroeconomic level of aggregation.
The research reported in this paper can be extended in two directions: one empirical and the
other theoretic. Better data can be collected on the reserves and desired reserves of intermediaries.
Altematively, more sophisticated estimation techniques might be utilized to correct for biases
introduced by using surrogate measures. Observation of the way interest rates are actually
determined by those who actually determine them would provide an even more valuable
opportunity to confirm or disconfirm the formulation suggested in this paper. Observation at the
individual decision making level would also provide the opportunity to refine the theory presented
here.
Theory might also be extended through disaggregation. While this paper dealt at a highly
aggregated level, the disequiUbrium process described herein could be applied to a more detailed
model which included several different securities and several different intermediaries. Such an
effort would involve a shift in purpose. The overarching goal of the current research has been a
theory of interest rate formation realistic enough to contribute to, yet simple enough not to
obfuscate, an understanding of the major macroeconomic behavior modes. The goal of
disaggregation would be the increased understanding of behavior modes in the financial markets.
Appendix 1: Data Sources
This appendix provides information on the data, and their transformation, used to estimate
equation 19. The risk-free rate is based on CITIBASE's (Citibank 1985) secondary market rate on
three month treasury bills (data series FYGM3, see also Federal Reserve Bulletin, table 1.20)).
This rate is calculated on a bank-discownt basis. To convert this to a continuous time yield, the
following calculation were performed. First, the percentage discount (DISC) is
DISC = FYGM3 / 4. A 1.1
JHH42.2 1/14/86 20

The decimal discrete-time yield (DTY) may now be written as
DTY = DISC/(100-DISC). A1.2
This may be converted to a continuous-time yield (CTY) as
CTY = In (1 -t- DTY). A1.3
Finally, prior to performing regressions, this was converted to a yearly percentage basis:
RFIR = CTY * (365/90) * 100 A1.4
Relative available reserves RAR are defined as the difference between reserves and desired
reserves, divided by reserves. The data series used for reserves was ClTlBASE's FZRNBA,
nonborrowed reserves of depository institutions, and for desired reserves ClTlBASE's FZRQA,
required reserves of depository institutions. Neither FZRNBA nor FZRQA are seasonally
adjusted. The series are, however, adjusted for changes in reserve requirements, in particular the
change in institutions required to hold reserves associated with the Monetary Control Act of 1980.
The correlation between the RAR used in this report and an alternate RAR constructed with
non-seasonally adjusted, non-reserve-adjusted time series (FZRNB and FZRMB) is .976. The
alternate definition ofRAR was tested over the full range of observations (1959/1 to 1985/6).
Parameter estimates were insignificantly different from those reported in the text using data
adjusted for changes in reserve requirements.
Appendix 2: Modification to Interest Rate Structure
As discussed in the text, the structure contains a risk that rates will become "stuck" at zero.
A small modification removes this risk. The change involves introducing a new variable, the
indicated underlying rate lUR, toward which the underlying rate adjusts. The indicated underlying
rate is identical to the risk-free rate, except the underlying rate does not go to zero, but rather to
some minimum value.
Behaviorally such a modification implies there is some lowest reference rate which is
greater than zero. Economically this minimum rate may be be determined by the costs of
intermediation. The minimum rate may be interpreted as the average cost of intermediation
expressed as a fiiaction of the amount intermediated.
A restatement of the interrest rate formulation using a possible definition of the indicated
underlying rate is^^:
20. A function involving a gradual approach to MUIR, in place of the abrupt change introduced bythe max function, would also be a possible assumption. The use of such a function, however,introduces additional complications and further dynamics without materially enriching the
current discussion.
mH42.2 1/14/86 21

RFIRt = UIRt*ELRt (A2.1)
UIRt = (lURt - UIRt)/TAUIR
lURj = max(RFIRt, MUIR)(A2.2)
(A2.3)
(A2.4)
Where: RFIRUIRELRlURMUIRTAUIRRARe
a
-Risk Free Interest Rate
-Underlying Risk Free Interest Rate
-Effect of Liquidity on the risk free Rate- Indicated Underlying Interest Rate- Minimum Underlying Interest Rate, a constant- Time to Adjust the Underlying Interest Rate- Relative Available Reserves- The exponential function
- a constant
The new definition of the underlying interest rate appears as A2.3. The modified stock and
flow diagram appears below.
A comparison of the behavior between the original formulation and the modified
formulation appears below. In the simulation, TAUIR and a are set to 2. The structure is
disturbed from equilibrium by a fifty per cent step increase in reserves around year 1. Reserves
step down to their original level around year 28.
JHH42.2 1/14/86 22

Behavior of Modified vs. Un-Modified Structure
0.025
0.019
0.013
6.250e-3 -
0.00.0 30.000
The diagram above illustrates the possibility that the (unmodified) Risk Free Rate and
(unmodified) Underlying Rate can "stick" at zero. It shows that the modified structure eliminates
this risk. It should be noted that although the structure keeps the underlying rate from dropping
below MUIR, the risk free rate may drop lower.
REFERENCES
Bosworth, Barry and James Duesenberry. 1973. "A Flow of Funds Model and Its
Implications." Issues in Federal Debt Management., Proceeding of a conference held at MelvinVillage, New Hampshire, sponsored by The Federal Reserve Bank of Boston.
Box, George E. P. and Gwilym M. Jenkins. 1976. Time Series Analysis: Forecasting andControl. Toronto:Holden-Day.
Citibank. 1985. CITIBASE: Citibank Economic Database. Machine -readable magneticdata file. New York: Citibank, NA.
De Leeuw, Frank. 1965. "A Model of Financial Behavior." in The Brookings QuarterlyEconometric Model of the United States, edited by James S. Duesenberry, Gary Fromm,Lawrence Klein, and Edwin Kuh. Chicago: Rand McNally and Company.
Dombusch, Rudiger and Stanley Fischer. 1981. Macroeconomics. 2nd ed. New York:McGraw-Hill Book Company.
Eberlein, Robert. "Simplifying Dynamic Models by Retaining Selected Behavior Modes."Ph.D. diss., Sloan School of Management, M.I.T., Cambridge.
Friedman, Benjamin M. 1977. "Financial Flow Variables and the Short-Run Determinationof Long-Term Interest Rates." Journal ofPolitical Economy. 85(4):661-689.
JHH42.2 1/14/86 23

. 1980a. "How Important is Disaggregation in Structural Models of Interest
Rate Detemnination?" The Review ofEconomics and Statistics. 62(2):27 1-276.
1980b. "The Effect of Shifting Wealth Ownership on the Term Structure of
Interest Rates: The Case of Pensions." Quarterly Journal ofEconomics. 94:567-590.
Friedman, Benjamin M. and V. Vance Roley. 1980. "Models of Long-term Interest Rate
Determination." The Journal ofPortfolio Management. 6(Spring):35-45.
Forrester, Jay W. 1984. "The System Dynamics National Model-Objectives, Philosophy,
and Status." Paper read at International System Dynamics Conference, August 2-4, at Oslo,
Norway.
1982. "Mechanisms of Price Transmission." Address invited by Statistics
Canada as part of a Canadian Government series on prices and inflation. Ottawa, March 9.
. 1979. "An Alternative Approach to Economic Policy: Macro Behavior from
Micro Structure." in Economic Issues of the Eighties, edited by N.M. Kamrany and R.H. Day,
80-108. Baltimore: The Johns Hopkins University Press.
1976. "Business Structure, Economic Cycles, and National Policy."
Futures. Jnnc: 195-214.
. 1961. Industrial Dynamics. Cambridge, Ma: The M.I.T. Press.
Goodwin, R.M. 1951. "Iteration, Automatic Computers, and Economic Dynamics,"Metroeconomica. 3:1-7.
Hendershott, Patric H. 1977. Understanding Capital Markets:, Volume I: A Flow-of-
Funds Financial Model. Lexington, Ma.: Lexington Books, D.C. Heath and Company.
Johnston, J. 1972. Econometric Methods. 2d ed. New York: McGraw-Hill BookCompany.
Kahneman, Daniel and Amos Tversky. 1982. "The Psychology of Preferences." Scientific
American. 246(1): 160-173.
Kleinmuntz, Don N. "Cognitive heuristics and Feedback in a Dynamic Decision
Environment." Management Science. 31(6):680-702.
Malinvaud, E. 1972. Lectures on Microeconomic Theory. Advanced Textbooks in
Economics, Vol. 2. New York: American Elsevier Publishing Co., Inc.
Meek, Paul. 1978. Open Market Operations. New York: Federal Reserve Bank of NewYork. Cited in Financial Markets and Institutions by Robert D. Auerbach. New York: MacMillanPublishing Co., Inc. 1983.
M.I.T. Center for Computational Research. 1983. Regression, Simulation, and Time-
Series Analycis. Volume 4 of Troll Reference Manual.. 3rd ed. Cambridge: M.I.T.
Modigliani, Franco, Robert Rasche, and J. Philip Cooper. 1970. "Central Bank Policy,
the Money Supply, and the Short-Term Rate of Interest". Money, Credit , and Banking. 2(2): 166-
218.
JHH42.2 1/14/86 24

Morecroft, John D.W. 1983. "System Dynamics: Portraying Bownded Rationality."
OMEGA the International Journal ofManagement Science. 1 1 : 1 3 1 - 1 42.
Pindyck, Robert S. and Daniel L. Rubinfeld. 1981. Econometric Models and EconomicForecasts. New York: McGraw-HiU Book Company.
Richardson, George P. 1984. The Evolution of the Feedback Concept in American SocialScience. Ph.D. diss. Sloan School of Management, M.I.T., Cambridge, Ma.
1981. "Statistical Estimation of Parameters in a Predator-Prey Model: AnExploration Using Synthetic Data." Working paper D-33 14-1, System Dynamics Group, SloanSchool of Management, Cambridge, Ma.
Richardson, George P. and Alexander L. Pugh HI. 1981. Introduction to SystemDynamics Modeling with DYNAMO. Cambridge, Ma.:The M.I.T. Press.
Samuelson, Paul Anthony. [1947] 1976. Fowndations ofEconomic Analysis. Reprint.
New York: Atheneum.
Schumpeter, Joseph. 1944. "The Analysis of Economic Change." Readings in BusinessCycle Theory, 1-9. Philadelphia: The Blakiston Company. (Reprinted from The Review ofEconomic Statistics, 17(1935):2-10.
Sinai, Allen. 1976. "Credit Crunches-An Analysis of the Postwar Experience." In
Parameters and Policies in the U.S. Economy, edited by Otto Eckstein, 244-274. Amsterdam:North-Holland.
Tversky, Amos and Daniel Kahneman. 1979. "Judgment Under Uncertainty: Heuristicsand Biases." 5c/ertce. 185(4 157): 1124- 1131.
Volker, Paul A. 1978. The Rediscovery of the Business Cycle. London: The Free Press.
Walras L. 1954. Elements ofPure Economics. Translated by William Jaff6. Homewood,Il.:Richard D. Irwin, Inc.
JHH42.2 1/14/86 25

^


DategASEMENT
^.Oi^um*
^^^^\^

3 ^a&a DDM D77 IDD