Embed Size (px)
Citation preview

IN VITRO SYSTEMS
A 3-dimensional human embryonic stem cell (hESC)-derivedmodel to detect developmental neurotoxicity of nanoparticles
Lisa Hoelting • Benjamin Scheinhardt • Olesja Bondarenko •
Stefan Schildknecht • Marion Kapitza • Vivek Tanavde • Betty Tan •
Qian Yi Lee • Stefan Mecking • Marcel Leist • Suzanne Kadereit
Received: 27 July 2012 / Accepted: 19 November 2012 / Published online: 2 December 2012
� The Author(s) 2012. This article is published with open access at Springerlink.com
Abstract Nanoparticles (NPs) have been shown to
accumulate in organs, cross the blood–brain barrier and
placenta, and have the potential to elicit developmental
neurotoxicity (DNT). Here, we developed a human
embryonic stem cell (hESC)-derived 3-dimensional (3-D)
in vitro model that allows for testing of potential devel-
opmental neurotoxicants. Early central nervous system
PAX6? precursor cells were generated from hESCs and
differentiated further within 3-D structures. The 3-D model
was characterized for neural marker expression revealing
robust differentiation toward neuronal precursor cells, and
gene expression profiling suggested a predominantly fore-
brain-like development. Altered neural gene expression
due to exposure to non-cytotoxic concentrations of the
known developmental neurotoxicant, methylmercury,
indicated that the 3-D model could detect DNT. To test for
specific toxicity of NPs, chemically inert polyethylene NPs
(PE-NPs) were chosen. They penetrated deep into the 3-D
structures and impacted gene expression at non-cytotoxic
concentrations. NOTCH pathway genes such as HES5 and
NOTCH1 were reduced in expression, as well as down-
stream neuronal precursor genes such as NEUROD1 and
ASCL1. FOXG1, a patterning marker, was also reduced.
As loss of function of these genes results in severe nervous
system impairments in mice, our data suggest that the 3-D
hESC-derived model could be used to test for Nano-DNT.
Keywords Human embryonic stem cells � Neurospheres �Developmental neurotoxicity (DNT) � Polyethylene
nanoparticles � Methylmercury
Introduction
Engineered nanoparticles (NPs) are incorporated into an
increasing number of commercial products, ranging from
food constituents and cosmetics to electronics, coatings,
paints and optics, and are explored for medical applica-
tions, and soil and water remediation. It can thus be
expected that human exposure will increase. NPs have been
shown to be toxic in vivo in animal models and in vitro cell
cultures (Arora et al. 2012). A wealth of data demonstrates
that NPs enter the blood circulation and organs, including
the brain, and cross the placenta. This points toward
potential health risks for humans, including cardiovascular
Electronic supplementary material The online version of thisarticle (doi:10.1007/s00204-012-0984-2) contains supplementarymaterial, which is available to authorized users.
L. Hoelting � S. Schildknecht � M. Kapitza � M. Leist �S. Kadereit (&)
Department of Biology, University of Konstanz,
Universitaetsstrasse 10, 78457 Konstanz, Germany
e-mail: [email protected]
L. Hoelting � B. Scheinhardt � S. Mecking � M. Leist �S. Kadereit
Konstanz Research School Chemical Biology,
University of Konstanz, Konstanz, Germany
B. Scheinhardt � S. Mecking
Department of Chemistry, University of Konstanz,
Konstanz, Germany
O. Bondarenko
Laboratory of Molecular Genetics, National Institute
of Chemical Physics and Biophysics, Tallinn, Estonia
V. Tanavde � B. Tan � Q. Y. Lee
Bioinformatics Institute Agency for Science Technology
and Research (A*STAR), Singapore, Singapore
V. Tanavde
Institute for Medical Biology, A*STAR, Singapore, Singapore
123
Arch Toxicol (2013) 87:721–733
DOI 10.1007/s00204-012-0984-2

disease, pulmonary diseases, impairment of brain function
and developmental toxicity (Buzea et al. 2007; Wick et al.
2010). Mechanisms of toxicity are diverse and include
oxidative stress, integration into mitochondria, activation
of immune responses, changes in receptor or channel
function by incorporated NPs, and interaction with
enzymes. Toxicity mechanisms differ between the different
NPs and depend on their chemical composition, shape, and
surface properties (Buzea et al. 2007).
Developmental neurotoxicity (DNT), that is, impairment
of nervous system development, with resulting structural or
functional defects is difficult to model in animals. The
potential of NPs to cause DNT is suggested by the finding
that prenatal exposure to low concentrations of diesel
exhaust containing NPs affected locomotor activity and the
monoaminergic system in mice (Suzuki et al. 2010). Fur-
thermore, studies have detected behavioral changes and
alterations in gene expression in the brain of rodents after
prenatal exposure to titanium dioxide (TiO2) NPs. Genes
associated with apoptosis, oxidative stress, brain develop-
ment, and psychiatric disease were altered (Hougaard et al.
2010; Shimizu et al. 2009). Therefore, there is an urgent
need to assess the potential of engineered NPs to elicit
DNT in humans.
Embryonic stem cells (ESC) have been shown to
faithfully recapitulate stages of early neural development
and are increasingly used to investigate neural develop-
ment and to assess DNT (Colleoni et al. 2011; Stummann
et al. 2009; Zimmer et al. 2011b, 2012). Here, we
developed a three-dimensional (3-D) in vitro model
derived from human embryonic stem cells (hESCs) to
evaluate DNT of chemically inert polyethylene NPs (PE-
NPs). A 3-D model has the advantage to provide an
environment to the differentiating cells that allows for
3-D cellular interactions, similar to the in vivo situation
where developing cells are exposed to 3-D signals
and morphogen gradients. Exposure to the known devel-
opmental neurotoxicant, methylmercury, indicated sensi-
tivity of the model. When exposing the model to non-
cytotoxic concentrations of PE-NPs, we measured a
reduction in the expression of neural markers, suggesting
that the 3-D model could be used to assess NP-induced
DNT (Nano-DNT).
Materials and methods
Cells and differentiation cultures
Human embryonic stem cells (hESCs, WA09 line) were
obtained from WiCell (Madison, WI, USA) and cultured
according to standard protocol (Thomson et al. 1998).
Import of hESCs and experiments described herein are
approved under license # 1710-79-1-4-27. WA09 cells
were differentiated in adherent culture to PAX6? neural
progenitor cells as described, with slight modifications
(Chambers et al. 2009). Briefly, differentiation was initi-
ated on day 3 (labeled ‘hESC’ in figures) by replating
WA09 cells in single-cell suspension onto Matrigel-coated
(BD Biosciences, Franklin Lakes, NJ USA) plates. Three
days later, on day 0 of differentiation (d0), neural differ-
entiation was promoted by adding neural differentiation
medium and dual SMAD inhibition. On day 8 (d8), the
adherent cells were digested to small clumps with dispase
(Invitrogen, Carlsbad, USA) and transferred to low-
adhesion plates (Corning, Corning, USA) in DMEM/F12
medium supplemented with B27 (Invitrogen, Carlsbad,
USA), noggin (42 ng/ml; R&D Systems Minneapolis,
USA), dorsomorphin (600 nM, Tocris Bioscience, Bristol,
UK), FGF2 (20 ng/ml, R&D Systems Minneapolis, USA),
and 10 lM ROCK inhibitor (Tocris, Bristol, UK). After
three days, the medium was carefully aspirated and
replaced by fresh medium without ROCK inhibitor. Every
3–4 days, medium was changed and neurospheres were
sheered slightly to prevent large aggregations.
Transcriptome analyses
mRNA was prepared from replicate ([6) cultures on
indicated days from undifferentiated hESCs (day 3), d0, d5,
d15, d22, and d25 cells. Replicates were pooled, and RNA
processing and probe preparation were preformed as
described (Zimmer et al. 2011a). For hESCs, d0, and d5 of
differentiation, biological triplicates were generated. For
d15 biological duplicates, and for d22 and d25 of differ-
entiation, biological singletons were produced. Each sam-
ple was hybridized in triplicates to Illumina Sentrix
HumanHT-12 BeadChip gene arrays (Illumina, San Diego,
USA). Technical replicates were assigned to each array
using a block randomized design subject to the constraint
that each replicate was run on at least two different
BeadChips to eliminate batch effects. The BeadChips were
scanned and data were acquired using BeadStudio soft-
ware. The average signal intensity values were normalized
using quantile normalization in BeadStudio. Further sta-
tistical analyses and data analyses (principal component
analysis (PCA), gene ontology (GO), hierarchical, and self-
organizing map (SOM) clustering were performed with
Partek Genomic Suite software (Partek, Inc., MI, USA)
with a false discovery rate (FDR) of 0.01 or 0.005 to
identify genes that changed significantly during the
differentiation process. FDR was calculated using the
Benjamini–Hochberg method. Hierarchical and SOM
clustering were unsupervised. The raw microarray data are
deposited in the EBI array express database (accession
number E-MTAB-1343).
722 Arch Toxicol (2013) 87:721–733
123

Immunofluorescence and flow cytometry
Cells were fixed and stained with standard methods as
described (Zimmer et al. 2011b), using the following
antibodies: PAX6 (Covance, Princeton, New Jersey), NES
(R&D Systems, Minneapolis, USA), A2B5, PSA-NCAM,
CD133 (Miltenyi Biotech, Bergisch Gladbach, Germany),
and CXCR4 (BD Biosciences, Franklin Lakes, NJ USA).
For flow cytometry, single-cell suspensions were prepared
on indicated days of differentiation by accutase (PAA,
Pasching Austria) digest and stained as described (Kade-
reit et al. 2002). Fluorescence was acquired on an Accuri
flow cytometer C6 (BD Biosciences, Franklin Lakes, NJ
USA) and analyzed with CFlow software (BD Biosci-
ences, Franklin Lakes, NJ USA). For the incorporation of
PE-NPs, single-cell suspensions were prepared after 24
and 48 h of exposure, and fluorescence emitted by the
PE-NP was acquired on an Aria flow cytometer (BD
Biosciences, Franklin Lakes, NJ USA) and analyzed with
Diva software (BD Biosciences, Franklin Lakes, NJ
USA).
Quantitative RT-PCR
mRNA was extracted at indicated time points from pooled
duplicate culture wells and processed as described (Zim-
mer et al. 2011a). Real-time quantification for each gene
was expressed relative to the amount of the housekeeping
gene RPL13A for expression kinetics and PE-NP toxicity
experiments, and the geometric mean of RPL13A and
GAPDH for methylmercury toxicity experiments (Vande-
sompele et al. 2002). Expression was calculated using the
2^(-delta delta C(t)) method. The list of primers is given
in Suppl. 1.
Toxicity testing
All toxicity experiments on neurospheres started on day
three after initiation of suspension cultures (d11). Neuro-
spheres were treated either for 48 h in acute testing or for
18 days in DNT testing. For DNT, toxicants (methylmer-
cury or PE-NPs) were replenished with each medium
change. LUHMES cells (human neuronal precursors) were
cultured and differentiated as described (Schildknecht et al.
2009) for 4 days to neurons and then treated for 48 h with
PE-NPs at the indicated concentrations. As NPs at high
concentrations interfered with the resazurin reduction
assay, cell viability was indirectly assessed by measuring
intracellular ATP content as an alternative endpoint for cell
viability (Schildknecht et al. 2009). Otherwise, cell via-
bility was assessed by standard resazurin reduction assay
(Zimmer et al. 2011b).
Polyethylene nanoparticle synthesis
Polyethylene nanoparticles (PE-NPs) were prepared in an
aqueous microemulsion process, yielding narrowly dis-
persed anisotropic nanocrystals with a number average
particle size of typically 33 nm. Between different batches,
this average varied by 2 nm. For reduction of the high
surfactant (sodium dodecyl sulfate) content necessary in
this procedure, the as-obtained polymer dispersions were
extensively dialyzed against water to yield dispersions with
a typical surfactant and polymer content of\0.2 and[1 %,
respectively, and a zeta potential of -30 mV. The high
surface tension of[65 mN m-1 indicated complete removal
of free surfactant. However, colloidal stability of the
nanoparticles in culture medium was fully retained, as
demonstrated by dynamic light scattering (DLS) measure-
ments (see Suppl. 2). As control for synthesis residues, the
aqueous PE-NP dispersions were centrifuged with Macro-
sep Advance centrifugation units (10 kDa cut-off), to filter
out the NPs from the solvent. This NP-free solution
(‘solvent’) was then used as a negative control, compared
to the non-centrifuged PE-NP dispersions. Fluorescently
labeled NPs were synthesized as above, while incorporat-
ing a perylene diimide (PDI) dye as fluorescence marker.
Covalent linking of the dye prevented phase separation and
undesired release of the dye from the nanoparticles. For
more details, see Suppl. 2.
Statistics
All experiments were performed with at least three bio-
logical replicates. Quantitative RT-PCR experiments were
performed in technical duplicates or triplicates. To evaluate
significant changes in gene expression compared to control
cells, paired t-tests were performed in GraphPad Prism
software using the log-transformed delta Ct-values to
determine the significance of changes in gene expression
between the mean delta Ct-values of untreated cells and
methylmercury-treated cells, or between solvent and
PE-NPs-treated cells.
Results
Differentiation of hESCs along the neural lineage
To model the three-dimensional (3-D) situation of early
human central nervous system (CNS) development, we
developed a hESC-derived culture system in which CNS
progenitor cells mature in a 3-D neurosphere system. We
first differentiated hESCs to an almost pure population
of CNS PAX6? progenitor cells as described (Chambers
et al. 2009). Monitoring PAX6 expression by quantitative
Arch Toxicol (2013) 87:721–733 723
123

real-time PCR revealed peak expression on day 8 (d8) of
differentiation (Fig. 1a). On d8, cells expressed the neural
stem cell marker NES (nestin) and were highly enriched for
PAX6 protein-expressing cells (Fig. 1b). As further dif-
ferentiation of PAX6? cells in adherence was inefficient
(data not shown), we detached the cells on d8 and replated
them as small clumps into suspension culture (Fig. 1c).
Within 24 h, the cells formed round spheres (neuro-
spheres). With increasing differentiation time, rosette-like
structures became visible within the neurospheres (Fig. 1d,
lower panels, arrows), suggesting progressing differentia-
tion. During the differentiation process, cell numbers per
well were reproducible between experiments (Fig. 1e).
Transcriptome profiling during differentiation
To characterize the differentiation process within the 3-D
neurosphere structures in more detail, mRNA was pre-
pared and transcriptomes of the differentiating cells were
analyzed with microarrays during the differentiation pro-
cess. Notably, the transcriptomes of each differentiation
stage differed significantly from each other and clustered
readily apart, with large blocks of genes progressively
downregulated, as well as blocks of genes that were
upregulated over time, indicative of progressive changes
in gene expression patterns during differentiation (Fig. 1f,
Suppl. 3a). Interestingly, among the top 30 regulated
hESC 5 80.1
1
10
100
days of differentiation
PA
X6
expr
essi
on
[rel
. to
hE
SC
± S
EM
]
e
a
d
b
days: hESC 0 5 15 22 25
c
f
PAX6 NES PAX6 NES
100 µm
hESC d8 d15 d22 d29
adherent phase suspension phase
(Pax6+)
d15 d22 d29
500 µm
d15 d22 d290
1
2
3
4
cell
num
bers
[in×1
06pe
r wel
l±
SE
M]
100 µm
500 µm 500 µm
100 µm 100 µm200 µm
100 µm
Fig. 1 Differentiation of hESCs-derived PAX6? cells to neural
progenitors in a three-dimensional neurosphere system. hESCs were
differentiated for 8 days in monolayer cultures to highly enriched
Pax6? cells. On day 8 (d8), cells were detached and replated as small
clumps into suspension cultures to mature further for additional
21 days (d08–29). a On indicated days, mRNA was prepared and
analyzed for the expression of PAX6 by qPCR. PAX6 expression in
hESCs was set arbitrarily to 1 and expression calculated relative to
expression in hESCs. Mean values ± SEM, n = 3. b PAX6 (red) and
nestin (NES) (green) staining of adherent cells on d8. c Culture
scheme to differentiate PAX6? cells further within neurospheres.
d Phase contrast images of neurospheres on days of differentiation 15,
22, and 29 (d15, d22, d29). Lower panels show higher magnifications
of neurospheres with visible rosettes (arrows). e On indicated days,
single-cell suspensions were made from neurosphere cultures and cell
numbers counted per well. Shown are counts of 6–10 biological
replicates (mean ± SEM). f Hierarchical clustering analysis of genes
significantly regulated (p \ 0.01) during neural differentiation of
hESCs to day 25 cells
724 Arch Toxicol (2013) 87:721–733
123

genes, 21 increased during differentiation (Suppl. 4).
Among these, marker genes for neural and neuronal
development such as DMRT3 (a transcription factor
expressed in the developing forebrain), RSPO1 (Wnt
signaling), GPM6A (neuronal membrane glycoprotein),
and TRH (tri-peptide neurotransmitter and neuromodula-
tor in both central nervous and peripheral systems) were
particularly strongly upregulated. Genes central to neu-
rodevelopment were also upregulated (Table 1). High
expression of patterning markers such as PAX6, EMX2,
and LHX2 suggested the generation of cerebral cortex
precursor cells (Monuki et al. 2001; Muzio and Mallam-
aci 2003). Pluripotency factors, on the other hand, such as
POU5F1, NANOG, UTF1, LEFTY1, DPPA4 and CD24
were strongly downregulated during differentiation (Sup-
pl. 5, 6).
When analyzing gene expression in unsupervised
SOM (self-organizing map) analysis, three distinct clus-
ters of gene expression emerged (Suppl. 3b). Of 4,140
genes regulated with high significance (FDR, false dis-
covery rate \0.005), 1,814 genes were upregulated.
Within these genes, the top 3 gene ontology (GO) cat-
egories were ‘nervous system development’, ‘neuron
differentiation’, and ‘cell proliferation in forebrain’,
indicative of robust differentiation along the neural
lineage (Table 2).
Expression of neural and neuronal markers
during differentiation within neurospheres
Next, expression of markers specific for the different stages
of neural differentiation was verified by quantitative RT-
PCR. Pluripotency-associated genes such as NANOG and
LEFTY1 became undetectable by d8 while POU5F1
decreased significantly, to remain expressed at very low
levels (Fig. 2a). The neural stem cell markers EPHA4 and
PAX6 peaked on day 8 of differentiation and remained
expressed throughout the following 28 days of suspension
culture, while CD133 and NES peaked between 7 and
14 days of suspension culture (d15–25) (Fig. 2b).
Increasing expression of regional cortical patterning genes
such as EMX2, LHX2, FOXG1, and PAX6 underlined the
emergence of central nervous system (CNS) precursors
(Fig. 2b, c). The neural progenitor markers HES5 and
DLL1 both peaked on d15 and decreased thereafter
(Fig. 2b), confirming the transcriptome data (Suppl.
Fig. 3c). Increasing expression of neuronal precursor cell
markers (ASCL1, DCX, and NEUROD1) and neuronal cell
markers (ABAT, TUBB3, KCNJ6, and SLC17A6) strongly
suggested the emergence of neuronal precursor cells and
further differentiation to more mature neurons (Fig. 2e, f).
Surface expression of the neural progenitor cell markers
CXCR4 and CD133 was found highest from d8 to d15,
Table 1 Neurodevelopmental genes significantly upregulated during differentiation within neurospheres
Gene p value
DLL1 Delta like 5.57E-04 Neural precursor
HES5 Transcriptional repressor 2.26E-04 Neural precursor
ASCL1 Mash1, achaete-scute complex homolog 4.16E-06 Neuronal precursor
DCX Doublecortin 1.84E-06 Neuronal precursor
FOXG1 Forkhead box G1 1.40E-02 Very rostal
EMX2 Empty spiracles homolog 2 3.64E-08 Forebrain
GLI3 GLI-Kruppel family member 3.34E-04 Dorsal forebrain
NEUROG2 Neurogenin 2 2.88E-03 Dorsal forebrain
LHX2 LIM/homeobox protein 3.16E-07 Dorsal forebrain
NR2F1 Nuclear receptor subfamily 1.29E-06 Ventral forebrain
MSX1 Homeobox msh-like 1 1.55E-04 Ventral midbrain
OTX1 Orthodenticle homolog 1 5.65E-07 Dorsal fore- and midbrain
OTX2 Orthodenticle homolog 2 3.29E-05 Dorsal fore- and midbrain
ATOH1 Math 1 atonal homolog 1.41E-02 Hindbrain
NCAN Neurocan 2.69E-03 Neuronal adhesion and neurite growth during development
STX1A Syntaxin 1A 2.37E-05 Synapse-associated
SYP Synaptophysin 1.44E-02 Synaptic vesicle-associated
MAPT Microtuble-associated protein tau 3.62E-06 Alzheimer-associated
TH Tyrosine hydroxylase 1.71E-02 Dopaminergic neurons
TUBB3 Tubulin beta 3 3.45E-03 Cytoskeleton protein
For references, see (Kuegler et al. 2010)
Arch Toxicol (2013) 87:721–733 725
123

with peak expression of 78 ± 6 % and 88 ± 6 % of cells,
respectively (Fig. 2g). A2B5, expressed on glial progeni-
tors increased rapidly during the first week of suspension
culture, to plateau around 80 ± 8 % of cells on day 22.
PSA-NCAM, a marker for neuronal precursors, was
already expressed on 58 ± 8 % of the cells on d8, to peak
Table 2 Top 10 GO categories in cluster 1 (upregulated genes)
GO category Enrichment
Score
Enrichment
p value
% genes that
are present
Genes in list/
genes in GO
GO ID #
Nervous system development 16.8 5.0E-08 15.5 59/381 7399
Neuron differentiation 12.1 5.5E-06 24.3 18/74 30182
Cell proliferation in forebrain 11.3 1.3E-05 83.3 5/6 21846
Cilium 9.3 8.7E-05 18.4 21/114 5929
Negative chemotaxis 9.2 1.0E-04 62.5 5/8 50919
Multicellular organismal development 9.1 1.1E-04 10.8 97/900 7275
Synaptosome 9.0 1.2E-04 19.0 19/100 19717
Inner ear morphogenesis 8.8 1.5E-04 25.0 12/48 42472
Central nervous system development 8.4 2.2E-04 18.8 18/96 7417
Wnt receptor signaling pathway, calcium modulating pathway 8.4 2.3E-04 33.3 8/24 7223
hESC 8 15 25 29 360.00
0.25
0.50
0.75
1.00
gene
exp
ress
ion
[rel.
to h
ES
C±
SE
M]
a b
c d
e f
g h
hESC 8 15 25 29 360.1
1
10
100
1000PAX6NESCD133EPHA4
hESC 8 15 22 29 360.01
0.1
1
10
100
1000
TUBB3
ABAT
SCL17A6KCNJ6
hESC 8 15 22 29 360.1
1
10
100
1000
10000
100000
EMX2LHX2FOXG1ge
ne e
xpre
ssio
n[re
l. to
hE
SC
± S
EM
]
hESC 8 15 22 29 360.1
1
10
100
1000
10000
HES5DLL1
hESC 8 15 22 29 360.1
1
10
100
1000
ASCL1DCXNEUROD1ge
ne e
xpre
ssio
n[re
l. to
hE
SC
± S
EM
]
8 15 22 290
25
50
75
100
CD133CXCR4
days of differentiation
posi
tive
cells
[in %
]
8 15 22 290
25
50
75
100
A2B5PSA NCAM
days of differentiation
OCT4
LEFTY1NANOG
Fig. 2 Marker expression
during differentiation of hESCs
to neural cells. hESCs were
differentiated as in Fig. 1c and
analyzed for marker expression.
a–f At indicated time points,
mRNA was extracted, gene
expression quantified by
quantitative RT-PCR and
expressed as mean values
normalized to expression in
hESCs, set arbitrarily to 1.
Mean values ± SEM, n = 4. g,
h Expression of surface marker
proteins measured by flow
cytometry. Neurospheres were
processed to single cells on
indicated days and stained.
Expression was assessed in
viable cells and expressed as
percentage of all viable cells.
Mean values ± SEM, n = 6
726 Arch Toxicol (2013) 87:721–733
123
on d15 with 84 ± 5 % of positive cells, indicating the
presence of a high proportion of neuronal precursor cells
within the neurospheres (Fig. 2h).
Sensitivity of the system to the developmental
neurotoxicant methylmercury
Methylmercury is among the few chemicals that are known
to elicit DNT in humans (Grandjean et al. 2006). We and
others have shown that ESC-derived neural differentiation
systems can detect toxic effects of methylmercury on
marker gene expression already at low, non-cytotoxic
concentrations (Stummann et al. 2009; Zimmer et al.
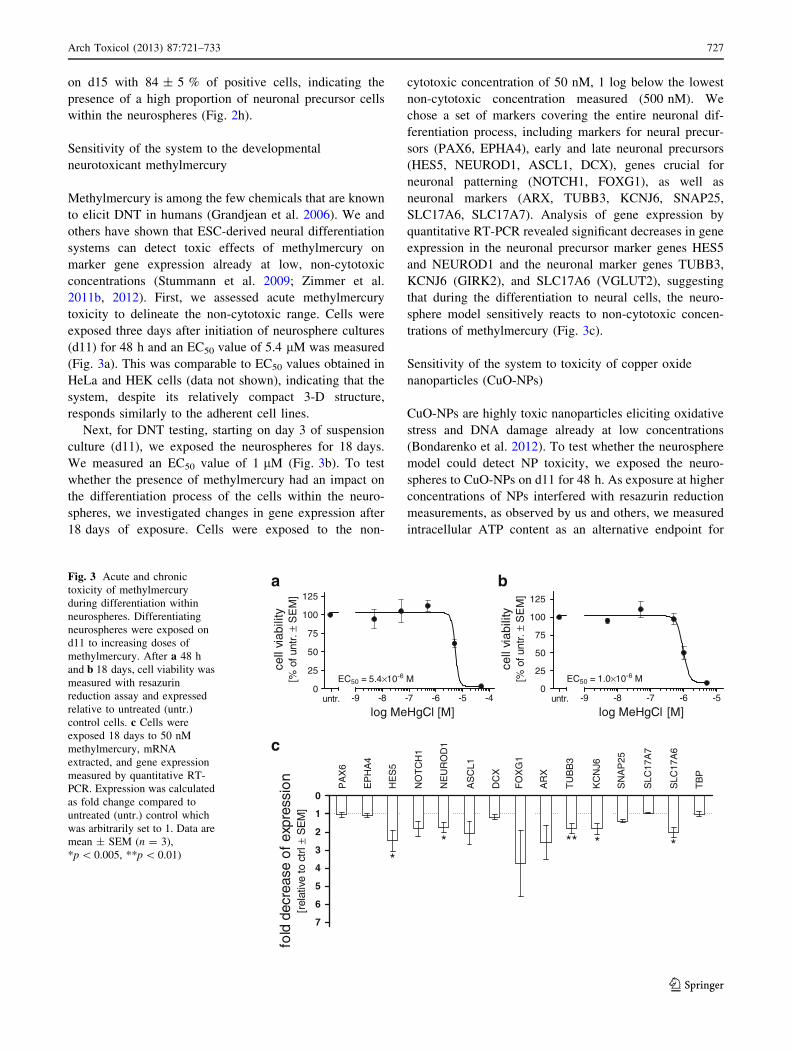
2011b, 2012). First, we assessed acute methylmercury
toxicity to delineate the non-cytotoxic range. Cells were
exposed three days after initiation of neurosphere cultures
(d11) for 48 h and an EC50 value of 5.4 lM was measured
(Fig. 3a). This was comparable to EC50 values obtained in
HeLa and HEK cells (data not shown), indicating that the
system, despite its relatively compact 3-D structure,
responds similarly to the adherent cell lines.
Next, for DNT testing, starting on day 3 of suspension
culture (d11), we exposed the neurospheres for 18 days.
We measured an EC50 value of 1 lM (Fig. 3b). To test
whether the presence of methylmercury had an impact on
the differentiation process of the cells within the neuro-
spheres, we investigated changes in gene expression after
18 days of exposure. Cells were exposed to the non-
cytotoxic concentration of 50 nM, 1 log below the lowest
non-cytotoxic concentration measured (500 nM). We
chose a set of markers covering the entire neuronal dif-
ferentiation process, including markers for neural precur-
sors (PAX6, EPHA4), early and late neuronal precursors
(HES5, NEUROD1, ASCL1, DCX), genes crucial for
neuronal patterning (NOTCH1, FOXG1), as well as
neuronal markers (ARX, TUBB3, KCNJ6, SNAP25,
SLC17A6, SLC17A7). Analysis of gene expression by
quantitative RT-PCR revealed significant decreases in gene
expression in the neuronal precursor marker genes HES5
and NEUROD1 and the neuronal marker genes TUBB3,
KCNJ6 (GIRK2), and SLC17A6 (VGLUT2), suggesting
that during the differentiation to neural cells, the neuro-
sphere model sensitively reacts to non-cytotoxic concen-
trations of methylmercury (Fig. 3c).
Sensitivity of the system to toxicity of copper oxide
nanoparticles (CuO-NPs)
CuO-NPs are highly toxic nanoparticles eliciting oxidative
stress and DNA damage already at low concentrations
(Bondarenko et al. 2012). To test whether the neurosphere
model could detect NP toxicity, we exposed the neuro-
spheres to CuO-NPs on d11 for 48 h. As exposure at higher
concentrations of NPs interfered with resazurin reduction
measurements, as observed by us and others, we measured
intracellular ATP content as an alternative endpoint for
0
25
50
75
100
125
-9 -8 -7 -6 -5 -4untr.
EC50 = 5.4×10⁻⁶ M
log MeHgCl [M]
cell
viab
ility
[% o
f unt
r.±
SE
M]
c
0
25
50
75
100
125
-9 -8 -7 -6 -5untr.
EC50 = 1.0×10⁻⁶ M
log MeHgCl [M]
cell
viab
ility
[% o
f unt
r.±
SE
M]
a b
EP
HA
4
HE
S5
NO
TC
H1
FO
XG
1
AR
X
NE
UR
OD
1
AS
CL1
DC
X
TU
BB
3
KC
NJ6
SN
AP
25
SLC
17A
7
TB
P
PA
X6
SLC
17A
6
0
1
2
3
4
5
6
7
** ** * *
fold
dec
reas
e o
f ex
pres
sio
n[r
elat
ive
to c
trl ±
SE
M]
Fig. 3 Acute and chronic
toxicity of methylmercury
during differentiation within
neurospheres. Differentiating
neurospheres were exposed on
d11 to increasing doses of
methylmercury. After a 48 h
and b 18 days, cell viability was
measured with resazurin
reduction assay and expressed
relative to untreated (untr.)
control cells. c Cells were
exposed 18 days to 50 nM
methylmercury, mRNA
extracted, and gene expression
measured by quantitative RT-
PCR. Expression was calculated
as fold change compared to
untreated (untr.) control which
was arbitrarily set to 1. Data are
mean ± SEM (n = 3),
*p \ 0.005, **p \ 0.01)
Arch Toxicol (2013) 87:721–733 727
123

cytotoxicity. The EC50 value was 35 lg/ml (Suppl. 7),
comparable to the EC50 of 20 lg/ml measured in adherent
cell lines such as A549 cells (Karlsson et al. 2008).
However, as CuO-NPs release toxic copper ions over time,
they are not an appropriate validation control to assess the
long-term exposure effects in DNT measurements. Fur-
thermore, we observed significant aggregation of CuO-NPs
in culture medium which precluded an accurate determi-
nation of concentration-dependent toxicity of non-aggre-
gated NPs. We, therefore, opted to use well-defined
polyethylene NPs (PE-NPs), synthesized in-house under
defined conditions.
Assessment of acute toxicity of chemically inert
polyethylene nanoparticles (PE-NPs)
Polyethylene is an innocuous polymer considered to be
biologically and chemically inert under physiological
conditions. Moreover, it allows the synthesis of NPs with a
defined and narrow size distribution and with the capacity
to stay non-aggregated in culture medium. PE-NPs thus
allow for the investigation of biological effects of bioper-
sistent nanoparticles upon chronic exposure. PE-NPs were
prepared in an aqueous microemulsion process, generating
narrowly dispersed anisotropic nanocrystals with number
average particle sizes of 33 nm (Fig. 4a, b) that could be
maintained in aqueous dispersion in a stable non-aggregated
state for prolonged periods of time ([3 months). No
aggregation of PE-NPs occurred in cell culture medium
(Fig. 4b, lower panel). To better visualize the uptake of
PE-NPs, we incorporated a fluorophore during the syn-
thesis process.
To determine the toxicity range, acute toxicity was
measured after 48 h in HeLa cells, with an EC50 value of
450 lg/ml (Fig. 4c). To exclude toxicity of potential
synthesis by-products in the PE-NP aqueous dispersion,
toxicity of ultra-filtered PE-NP dispersion (devoid of
PE-NPs, i.e., ‘solvent’ control) was also tested, and no
changes in ATP content in cells treated with PE-NP-free
dispersion were observed (Fig. 4c, open circle). As toxicity
to HeLa cells may not reflect toxicity to neural cells, we also
tested acute toxicity on mature dopaminergic human neu-
rons (Schildknecht et al. 2009). LUHMES cells were incu-
bated for 48 h with increasing concentrations of PE-NPs,
and an EC50 value of 257 lg/ml was determined (Fig. 4d).
Incorporation of PE-NPs into neurospheres
Neurospheres were incubated on d11 with increasing
concentrations of fluorescence-labeled PE-NPs, and incor-
poration was analyzed by fluorescence imaging and flow
cytometry. PE-NPs were readily incorporated into the
neurospheres after 24 h (data not shown) and were easily
detected under the microscope at a concentration of
360 lg/ml at 48 h (Fig. 5a). Analysis of single-cell sus-
pensions by flow cytometry revealed that despite the 3-D
structure of the neurospheres, the PE-NPs had penetrated
deep into the neurosphere and incorporated into most of the
0
25
50
75
100
125
EC50 = 450 µg/ml
untr.
22.5 45 90 18
036
072
014
40
PE-NP [µg/ml]
AT
P c
onte
nt[%
of u
ntr.
± S
EM
]
0
25
50
75
100
untr.
22.5 45 90 18
036
072
014
40
EC50 = 257 µg/ml
PE-NP [µg/ml]
AT
P c
onte
nt[%
of u
ntr.
± S
EM
]
a
c d
1 10 100 1000 10000
Size (nm)
b
Num
ber
(%)
0
10
20
Num
ber
(%)
0
10
20
30
30Fig. 4 Acute toxicity of
polyethylene nanoparticles
(PE-NPs). Toxicity of PE-NPs
was tested in HeLa cells and
human neurons (LUHMES).
a Transmission electron
microscopy (TEM) image of
PE-NPs, stained with
phosphotungstic acid to increase
contrast. b Dynamic light
scattering (DLS) size
distribution by number of PE-
NPs in water (upper panel) and
culture medium (lower panel).c Intracellular ATP content after
incubation of HeLa cells with
indicated concentrations of PE-
NPs (black circles) for 48 h,
expressed as proportion ± SEM
of untreated (untr.) cells, n = 3.
Open circle data pointrepresents solvent control.
d Intracellular ATP content
after incubation of human
neurons (LUHMES cells) with
PE-NPs for 48 h, expressed as
proportion ± SEM of untreated
cells, n = 2–5
728 Arch Toxicol (2013) 87:721–733
123
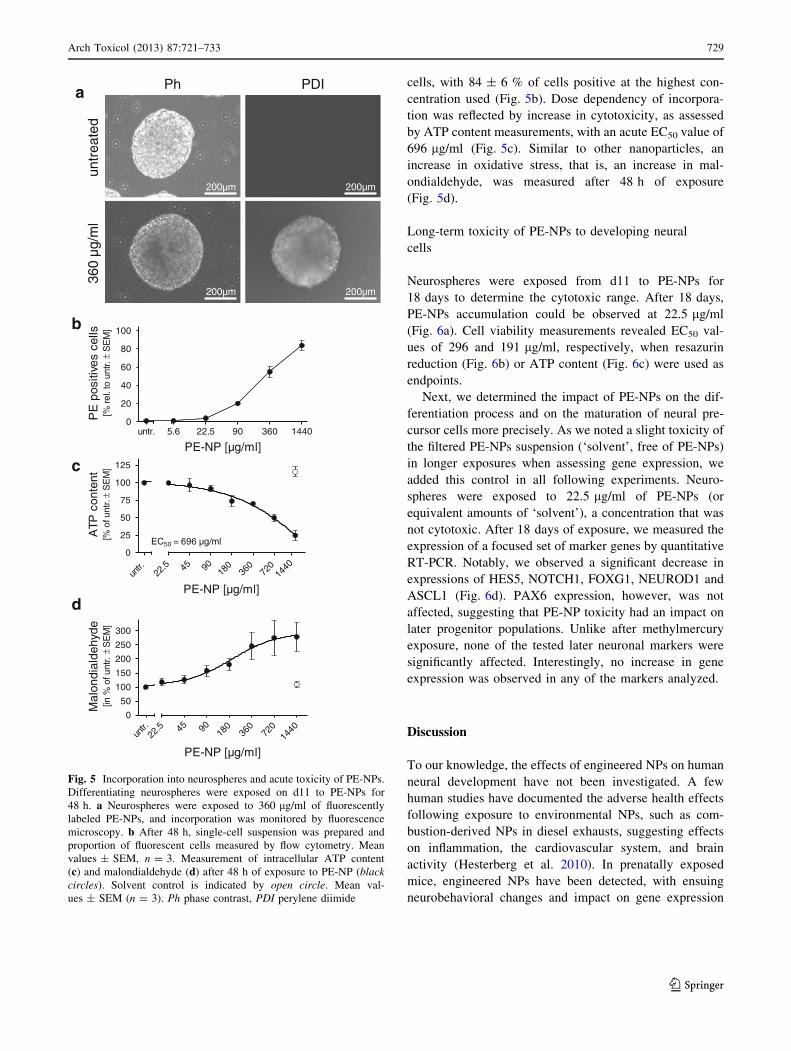
cells, with 84 ± 6 % of cells positive at the highest con-
centration used (Fig. 5b). Dose dependency of incorpora-
tion was reflected by increase in cytotoxicity, as assessed
by ATP content measurements, with an acute EC50 value of
696 lg/ml (Fig. 5c). Similar to other nanoparticles, an
increase in oxidative stress, that is, an increase in mal-
ondialdehyde, was measured after 48 h of exposure
(Fig. 5d).
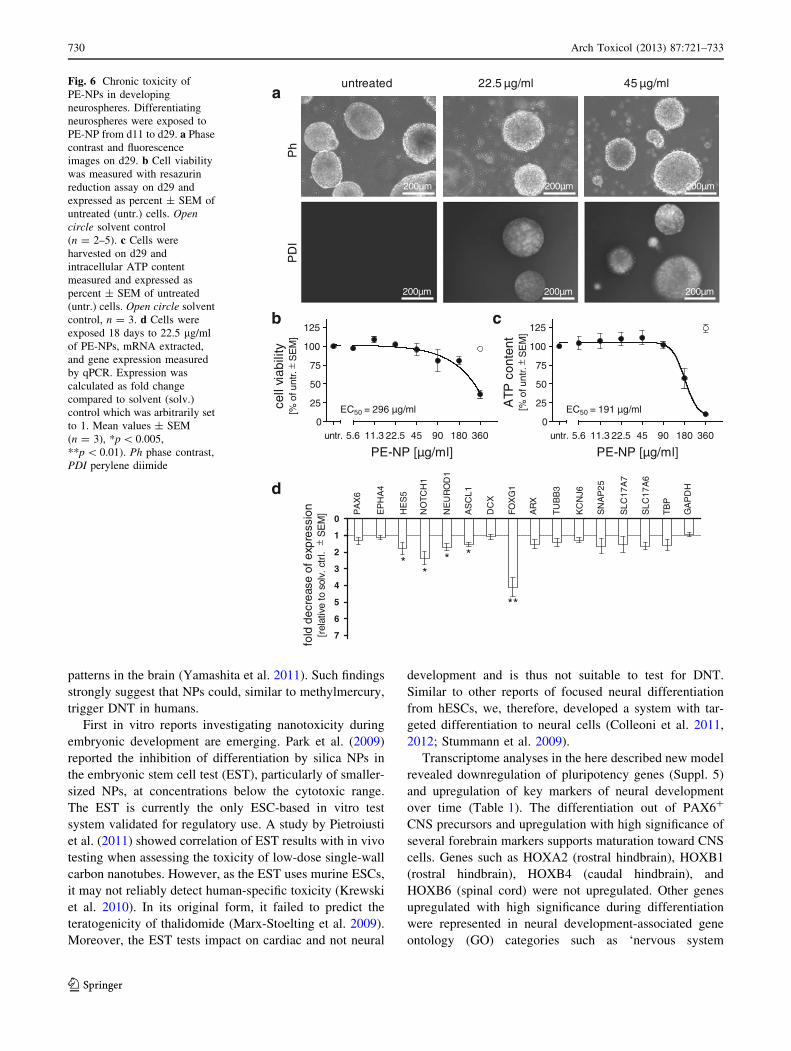
Long-term toxicity of PE-NPs to developing neural
cells
Neurospheres were exposed from d11 to PE-NPs for
18 days to determine the cytotoxic range. After 18 days,
PE-NPs accumulation could be observed at 22.5 lg/ml
(Fig. 6a). Cell viability measurements revealed EC50 val-
ues of 296 and 191 lg/ml, respectively, when resazurin
reduction (Fig. 6b) or ATP content (Fig. 6c) were used as
endpoints.
Next, we determined the impact of PE-NPs on the dif-
ferentiation process and on the maturation of neural pre-
cursor cells more precisely. As we noted a slight toxicity of
the filtered PE-NPs suspension (‘solvent’, free of PE-NPs)
in longer exposures when assessing gene expression, we
added this control in all following experiments. Neuro-
spheres were exposed to 22.5 lg/ml of PE-NPs (or
equivalent amounts of ‘solvent’), a concentration that was
not cytotoxic. After 18 days of exposure, we measured the
expression of a focused set of marker genes by quantitative
RT-PCR. Notably, we observed a significant decrease in
expressions of HES5, NOTCH1, FOXG1, NEUROD1 and
ASCL1 (Fig. 6d). PAX6 expression, however, was not
affected, suggesting that PE-NP toxicity had an impact on
later progenitor populations. Unlike after methylmercury
exposure, none of the tested later neuronal markers were
significantly affected. Interestingly, no increase in gene
expression was observed in any of the markers analyzed.
Discussion
To our knowledge, the effects of engineered NPs on human
neural development have not been investigated. A few
human studies have documented the adverse health effects
following exposure to environmental NPs, such as com-
bustion-derived NPs in diesel exhausts, suggesting effects
on inflammation, the cardiovascular system, and brain
activity (Hesterberg et al. 2010). In prenatally exposed
mice, engineered NPs have been detected, with ensuing
neurobehavioral changes and impact on gene expression
a
b
c
0
20
40
60
80
100
untr. 5.6 22.5 90 360 1440
PE-NP [µg/ml]
PE
pos
itive
s ce
lls[%
rel.
to u
ntr.
SE
M]
±±
±un
trea
ted
360
µg/m
lPh
200µm
PDI
200µm
200µm
0
50
100
150
200
250
300
untr.
22.5 45 90 18
036
072
014
40
PE-NP [µg/ml]
Mal
ondi
alde
hyde
[in %
of u
ntr.
SE
M]
200µm
d
0
25
50
75
100
125
untr.
22.5 45 90 18
036
072
014
40
EC50 = 696 µg/ml
PE-NP [µg/ml]
ATP
con
tent
[% o
f unt
r. S
EM
]
Fig. 5 Incorporation into neurospheres and acute toxicity of PE-NPs.
Differentiating neurospheres were exposed on d11 to PE-NPs for
48 h. a Neurospheres were exposed to 360 lg/ml of fluorescently
labeled PE-NPs, and incorporation was monitored by fluorescence
microscopy. b After 48 h, single-cell suspension was prepared and
proportion of fluorescent cells measured by flow cytometry. Mean
values ± SEM, n = 3. Measurement of intracellular ATP content
(c) and malondialdehyde (d) after 48 h of exposure to PE-NP (blackcircles). Solvent control is indicated by open circle. Mean val-
ues ± SEM (n = 3). Ph phase contrast, PDI perylene diimide
Arch Toxicol (2013) 87:721–733 729
123
patterns in the brain (Yamashita et al. 2011). Such findings
strongly suggest that NPs could, similar to methylmercury,
trigger DNT in humans.
First in vitro reports investigating nanotoxicity during
embryonic development are emerging. Park et al. (2009)
reported the inhibition of differentiation by silica NPs in
the embryonic stem cell test (EST), particularly of smaller-
sized NPs, at concentrations below the cytotoxic range.
The EST is currently the only ESC-based in vitro test
system validated for regulatory use. A study by Pietroiusti
et al. (2011) showed correlation of EST results with in vivo
testing when assessing the toxicity of low-dose single-wall
carbon nanotubes. However, as the EST uses murine ESCs,
it may not reliably detect human-specific toxicity (Krewski
et al. 2010). In its original form, it failed to predict the
teratogenicity of thalidomide (Marx-Stoelting et al. 2009).
Moreover, the EST tests impact on cardiac and not neural
development and is thus not suitable to test for DNT.
Similar to other reports of focused neural differentiation
from hESCs, we, therefore, developed a system with tar-
geted differentiation to neural cells (Colleoni et al. 2011,
2012; Stummann et al. 2009).
Transcriptome analyses in the here described new model
revealed downregulation of pluripotency genes (Suppl. 5)
and upregulation of key markers of neural development
over time (Table 1). The differentiation out of PAX6?
CNS precursors and upregulation with high significance of
several forebrain markers supports maturation toward CNS
cells. Genes such as HOXA2 (rostral hindbrain), HOXB1
(rostral hindbrain), HOXB4 (caudal hindbrain), and
HOXB6 (spinal cord) were not upregulated. Other genes
upregulated with high significance during differentiation
were represented in neural development-associated gene
ontology (GO) categories such as ‘nervous system
0
25
50
75
100
125
untr. 11.3 22.5 45 905.6 180 360
EC50 = 191 µg/ml
PE-NP [µg/ml]
ATP
con
tent
[% o
f unt
r.±
SE
M]
0
25
50
75
100
125
EC50 = 296 µg/ml
untr. 11.3 22.5 45 905.6 180 360
PE-NP [µg/ml]
cell
viab
ility
[% o
f unt
r.±
SE
M]
a
b c
d
untreated 22.5 µg/ml 45 µg/ml
Ph
200µm 200µm 200µm
200µm 200µm 200µmP
DI
EP
HA
4
HE
S5
NO
TC
H1
FO
XG
1
AR
X
NE
UR
OD
1
AS
CL
1
DC
X
TU
BB
3
KC
NJ6
SN
AP
25
SL
C1
7A
7
TB
P
PA
X6
SL
C1
7A
6
GA
PD
H
0
1
2
3
4
5
6
7
** *
**
*
fold
dec
reas
e of
exp
ress
ion
[rel
ativ
e to
sol
v. c
trl.
± S
EM
]
Fig. 6 Chronic toxicity of
PE-NPs in developing
neurospheres. Differentiating
neurospheres were exposed to
PE-NP from d11 to d29. a Phase
contrast and fluorescence
images on d29. b Cell viability
was measured with resazurin
reduction assay on d29 and
expressed as percent ± SEM of
untreated (untr.) cells. Opencircle solvent control
(n = 2–5). c Cells were
harvested on d29 and
intracellular ATP content
measured and expressed as
percent ± SEM of untreated
(untr.) cells. Open circle solvent
control, n = 3. d Cells were
exposed 18 days to 22.5 lg/ml
of PE-NPs, mRNA extracted,
and gene expression measured
by qPCR. Expression was
calculated as fold change
compared to solvent (solv.)
control which was arbitrarily set
to 1. Mean values ± SEM
(n = 3), *p \ 0.005,
**p \ 0.01). Ph phase contrast,
PDI perylene diimide
730 Arch Toxicol (2013) 87:721–733
123

development,’ ‘neuron differentiation,’ and ‘cell prolifer-
ation in forebrain’ (Table 2). Overall, the transcriptome
data suggest a predominantly forebrain-like development.
Among the top 30 regulated genes, 21 genes were
upregulated. All upregulated genes, except 6 of unknown
function, were associated with neural development and
function (Suppl. 4), indicating a robust differentiation
along neural lineage. Neural stem cell markers such as
PAX6, EPHA4, and KCNN3 were strongly regulated. The
same was observed for genes with a role in neural/neuronal
development such as DMRT3, RSPO1, GPMA6, EVI1/
PRDM3, ENKUR, ABHD14A, and GUCY1B3. Genes
associated with disease such as MMRN1 (familial parkin-
sonism), ABAT (autism), and MAP6 (depression and
schizophrenia-like symptoms) were also upregulated (for
gene functions and references see Suppl. 4).
Analysis by quantitative RT-PCR confirmed the
expression patterns observed in transcriptome analyses.
Emergence of neuronal precursor cells was corroborated by
the presence of a high percentage of PSA-NCAM protein-
expressing cells. PSA-NCAM is the polysialylated form of
neural cell adhesion molecule (NCAM) and is expressed on
neuronal precursor cells in association with migrating
phenotype, corroborating the increased expression of DCX,
a marker for migrating neuroblasts (Quartu et al. 2008).
The known DNT substance, methylmercury, was used to
test the performance of the developed 3-D model. Acute
cytotoxicity was similar to that observed in standard cell
lines such as HeLa cells, and long-term exposure resulted in
an EC50 comparable to values measured by others in a
hESC-derived neural differentiation systems (Stummann
et al. 2009). When assessing the effects of 50 nM methyl-
mercury exposure on the expression of neural marker genes,
we detected an effect on the expression of the NOTCH
target gene HES5. NOTCH1 itself was, however, not
decreased significantly. Similar to Stummann et al., we also
detected a decrease in the expression of the early neuronal
precursor marker NEUROD1, but no significant reduction
in NEUROD1 target genes ASCL1, DCX, and DLL1 (data
not shown), suggesting a loss of certain subpopulations of
neuronal precursor rather than a mere block of the NEU-
ROD1 pathway. Contrary to Stummann et al., however,
who detected no impact on neuronal genes at non-cytotoxic
concentrations, we detected an effect on the expression of
the neuronal genes TUBB3, KCNJ6, an ion channel mod-
ulating neuronal excitability, expressed in dopaminergic
neurons (Reyes et al. 2012), and SLC17A6 (vesicular glu-
tamate transporter). Other neuronal genes such as ARX,
SNAP25, and SLC17A7 were not significantly affected.
Overall, our data suggest the selective loss of subpop-
ulations of neuronal progenitors and possibly a defect in
maturation toward neuronal phenotype in the presence of
methylmercury. It will now be of interest to study the
effects of methylmercury in more detail in this system to
possibly delineate more precise mechanisms of methyl-
mercury toxicity during neural development. TUBB3, for
example, was also affected by methylmercury exposure in
our murine DNT model (Zimmer et al. 2011b). Mutations
in the TUBB3 gene result in so-called TUBB3 syndromes,
which are more or less severe, depending on the exact type
of mutation. Similar to methylmercury-induced poisoning,
the spectrum of nervous system malformations includes
spasticity, cognitive and behavioral impairments, and pro-
gressive peripheral sensorimotor axonal degeneration
(Grandjean and Herz 2011; Tischfield and Engle 2010).
For DNT testing with NPs, we synthesized polyethylene
NPs (PE-NPs) that remained non-aggregated in aqueous
solution and cell culture medium over prolonged periods of
time. PE-NPs were studied here as a model for surfactant
stabilized, shape-persistent NPs composed of a hydropho-
bic chemically inert material. Similar to other materials
where the bulk form is innocuous and the nanoparticulate
forms toxic, we observed cytotoxicity of the PE-NPs both
in adherent cells and neurospheres within 48 h (Figs. 4, 5,
6). PE-NPs penetrated deep into the 3-D neurosphere
structure, and similar to a majority of NPs, elicited oxi-
dative stress in the cells, and a dose-dependent cytotoxicity
(Fig. 5b, c, d).
A key finding in this study was that at a concentration as
low as 22.5 lg/ml of PE-NPs, we measured altered gene
expression in the 3-D model. This concentration was four
times lower than the lowest non-cytotoxic concentration
measured. At this concentration, neural differentiation, as
measured by changes in the expression of genes important
for neurodevelopment, was perturbed. NOTCH pathway
genes NOTCH1 and HES5, as well as downstream targets
such as NEUROD1 and ASCL1 (both markers for neuronal
precursor cells), were reduced in expression. NOTCH
pathway plays a key role in both embryonic neural devel-
opment and adult brain plasticity in animal models (Lasky
and Wu 2005). NOTCH1 and NOTCH2 knockout mice die
around E11, and HES5 gene-deleted mice have a 30–40 %
reduction in Muller glial cells (Yoon and Gaiano 2005).
NEUROD1 knockout mice develop a severe neurological
phenotype (Miyata et al. 1999). ASCL1 is an important
regulator of neurogenesis in the ventral telencephalon, and
gene-deleted mice have multiple defects in neurogenesis in
the ventral telencephalon, including a severe loss of
neurons (Casarosa et al. 1999; Castro et al. 2011). Inter-
estingly, expression of FOXG1, a brain-specific transcrip-
tional repressor essential for the early development of the
telencephalon, while not significantly affected by methyl-
mercury treatment, was also reduced by PE-NP exposure.
FOXG1 mutant mice die at birth with dramatic hypoplasia
of the cerebral hemispheres, particularly of the ventral
telencephalon (Xuan et al. 1995). Moreover, FOXG1
Arch Toxicol (2013) 87:721–733 731
123

mutations are responsible for the congenital variant of Rett
syndrome which, among other symptoms, includes micro-
cephaly (Mencarelli et al. 2010).
Our data thus point to a potential impact of PE-NPs on
progenitor cells and neuronal development, and further-
more suggest that NPs may affect the complex process of
telencephalon differentiation.
Similar to other reports (Colleoni et al. 2011, 2012;
Stummann et al. 2009) using targeted neural differentiation
of hESCs to model human neural development and to
assess neural-specific impact of toxicants, we developed
here a 3-D model to assess nanotoxicity to neural cell
differentiation and showed impact on the expression of
genes crucial to neural development. However, it is unclear
at this point, how a reduction in the expression of these
crucial and early neurodevelopmental genes would impact
in vivo neural development and elicit DNT. At this point,
not many studies have investigated the impact of NPs on
neural development in animal models. However, the few
that have suggest that even innocuous NP such as TiO2-
NPs reach the brain of the pups and have an impact on the
development of the nervous system, with alterations in the
dopaminergic system in the prefrontal cortex and moderate
neurobehavioral alterations (Takeda et al. 2009; Hougaard
et al. 2010; Takahashi et al. 2010). It was also shown that
the NPs elicited changes in gene expression in the brains of
the exposed pups (Shimizu et al. 2009). To our knowledge,
no previous human-specific in vitro study has investigated
the impact of NPs on neural differentiation. As a proof-of-
principle, we have shown that our 3-D neurosphere model
detects the known DNT compound, methylmercury, with
good sensitivity and that expression of neurodevelopmental
genes was affected upon NP exposure. Whether the used
polyethylene NPs would affect developmental processes
other than neural development is unclear at this point and
could be tested in a humanized version of the EST. Testing
of silica NPs and SWCNT in the original EST suggests NPs
could be toxic to embryonic development in general (Park
et al. 2009; Pietroiusti et al. 2011).
Acknowledgments The authors wish to thank the Doerenkamp-
Zbinden Foundation for generous funding, EU-FP7 ESNATS project
(SK, ML), the Konstanz Research School Chemical Biology (LH and
BS), and the Agency for Science and Technology & Research (VT,
BT, QL). OB was supported by SF0690063s08 and ETF8561 grants.
We also thank Anne Kahru and Daniel Dietrich for helpful comments.
The authors also wish to thankfully acknowledge the use of the iHOP
data base (iHOP—http://www.ihop-net.org/) for data mining during
the gene array analyses.
Conflict of interest The authors declare that they have no conflict
of interest.
Open Access This article is distributed under the terms of the
Creative Commons Attribution License which permits any use,
distribution, and reproduction in any medium, provided the original
author(s) and the source are credited.
References
Arora S, Rajwade JM, Paknikar KM (2012) Nanotoxicology and
in vitro studies: the need of the hour. Toxicol Appl Pharmacol
258(2):151–165. doi:10.1016/j.taap.2011.11.010
Bondarenko O, Ivask A, Kakinen A, Kahru A (2012) Sub-toxic
effects of CuO nanoparticles on bacteria: kinetics, role of Cu
ions and possible mechanisms of action. Environ Pollut
169:81–89
Buzea C, Pacheco II, Robbie K (2007) Nanomaterials and nanopar-
ticles: sources and toxicity. Biointerphases 2(4):MR17–MR71
Casarosa S, Fode C, Guillemot F (1999) Mash1 regulates neurogen-
esis in the ventral telencephalon. Development 126(3):525–534
Castro DS, Martynoga B, Parras C et al (2011) A novel function of
the proneural factor Ascl1 in progenitor proliferation identified
by genome-wide characterization of its targets. Genes Dev
25(9):930–945. doi:10.1101/gad.627811
Chambers SM, Fasano CA, Papapetrou EP, Tomishima M, Sadelain
M, Studer L (2009) Highly efficient neural conversion of human
ES and iPS cells by dual inhibition of SMAD signaling.
Nat Biotechnol 27(3):275–280 doi:http://www.nature.com/nbt/
journal/v27/n3/suppinfo/nbt.1529_S1.html
Colleoni S, Galli C, Gaspar JA et al (2011) Development of a neural
teratogenicity test based on human embryonic stem cells:
response to retinoic acid exposure. Toxicol Sci 124(2):370–377
Colleoni S, Galli C, Gaspar JA, Meganathan K, Jagtap S, Hescheler J,
Sachinidis A, Lazzari G (2012) Characterization of a neural
teratogenicity assay based on human ESCs differentiation
following exposure to valproic acid. Curr Med Chem Oct 4.
[Epub ahead of print] PubMed PMID: 23061626
Grandjean P, Herz KT (2011) Methylmercury and brain development:
imprecision and underestimation of developmental neurotoxicity
in humans. Mt Sinai J Med J Transl Pers Med 78(1):107–118.
doi:10.1002/msj.20228
Grandjean P, Harari R, Barr DB, Debes F (2006) Pesticide exposure
and stunting as independent predictors of neurobehavioral
deficits in Ecuadorian school children. Pediatrics 117(3):e546–
e556
Hesterberg TW, Long CM, Lapin CA, Hamade AK, Valberg PA
(2010) Diesel exhaust particulate (DEP) and nanoparticle
exposures: what do DEP human clinical studies tell us about
potential human health hazards of nanoparticles? Inhal Toxicol
22(8):679–694. doi:10.3109/08958371003758823
Hougaard KS, Jackson P, Jensen KA et al (2010) Effects of prenatal
exposure to surface-coated nanosized titanium dioxide (UV-
Titan). A study in mice. Part Fibre Toxicol 7:16
Kadereit S, Deeds LS, Haynesworth SE et al (2002) Expansion of
LTC-ICs and maintenance of p21 and BCL-2 expression in cord
blood CD34(?)/CD38(-) early progenitors cultured over human
MSCs as a feeder layer. Stem Cells 20(6):573–582
Karlsson HL, Cronholm P, Gustafsson J, Moller L (2008) Copper
oxide nanoparticles are highly toxic: a comparison between
metal oxide nanoparticles and carbon nanotubes. Chem Res
Toxicol 21(9):1726–1732. doi:10.1021/tx800064j
Krewski D, Acosta D Jr, Andersen M et al (2010) Toxicity testing in
the 21st century: a vision and a strategy. J Toxicol Environ
Health B Crit Rev 13(2–4):51–138
Kuegler PB, Zimmer B, Waldmann T et al (2010) Markers of murine
embryonic and neural stem cells, neurons and astrocytes:
732 Arch Toxicol (2013) 87:721–733
123

reference points for developmental neurotoxicity testing. Altex
27(1):17–42
Lasky JL, Wu H (2005) Notch signaling, brain development, and
human disease. Pediatr Res 57(5 Pt 2):104R–109R
Marx-Stoelting P, Adriaens E, Ahr HJ et al (2009) A review of the
implementation of the embryonic stem cell test (EST). The
report and recommendations of an ECVAM/ReProTect Work-
shop. Altern Lab Anim 37(3):313–328
Mencarelli MA, Spanhol-Rosseto A, Artuso R et al (2010) Novel
FOXG1 mutations associated with the congenital variant of Rett
syndrome. J Med Genet 47(1):49–53. doi:10.1136/jmg.2009.
067884
Miyata T, Maeda T, Lee JE (1999) NeuroD is required for
differentiation of the granule cells in the cerebellum and
hippocampus. Genes Dev 13(13):1647–1652
Monuki ES, Porter FD, Walsh CA (2001) Patterning of the dorsal
telencephalon and cerebral cortex by a roof plate-Lhx2 pathway.
Neuron 32(4):591–604
Muzio L, Mallamaci A (2003) Emx1, Emx2 and Pax6 in specification,
regionalization and arealization of the cerebral cortex. Cereb
Cortex 13(6):641–647. doi:10.1093/cercor/13.6.641
Park MV, Annema W, Salvati A et al (2009) In vitro developmental
toxicity test detects inhibition of stem cell differentiation by
silica nanoparticles. Toxicol Appl Pharmacol 240(1):108–116
Pietroiusti A, Massimiani M, Fenoglio I et al (2011) Low doses of
pristine and oxidized single-wall carbon nanotubes affect
mammalian embryonic development. ACS Nano 5(6):4624–
4633
Quartu M, Serra M, Boi M, Ibba V, Melis T, Del Fiacco M (2008)
Polysialylated-neural cell adhesion molecule (PSA-NCAM) in
the human trigeminal ganglion and brainstem at prenatal and
adult ages. BMC Neurosci 9(1):108
Reyes S, Fu Y, Double K et al (2012) GIRK2 expression in dopamine
neurons of the substantia nigra and ventral tegmental area.
J Comp Neurol 520(12):2591–2607. doi:10.1002/cne.23051
Schildknecht S, Poltl D, Nagel DM et al (2009) Requirement of a
dopaminergic neuronal phenotype for toxicity of low concen-
trations of 1-methyl-4-phenylpyridinium to human cells. Toxicol
Appl Pharmacol 241(1):23–35
Shimizu M, Tainaka H, Oba T, Mizuo K, Umezawa M, Takeda K
(2009) Maternal exposure to nanoparticulate titanium dioxide
during the prenatal period alters gene expression related to brain
development in the mouse. Part Fibre Toxicol 6:20
Stummann TC, Hareng L, Bremer S (2009) Hazard assessment of
methylmercury toxicity to neuronal induction in embryogenesis
using human embryonic stem cells. Toxicology 257(3):117–126
Suzuki T, Oshio S, Iwata M et al (2010) In utero exposure to a low
concentration of diesel exhaust affects spontaneous locomotor
activity and monoaminergic system in male mice. Part Fibre
Toxicol 7:7. doi:10.1186/1743-8977-7-7
Takahashi Y, Mizuo K, Shinkai Y, Oshio S, Takeda K (2010) Prenatal
exposure to titanium dioxide nanoparticles increases dopamine
levels in the prefrontal cortex and neostriatum of mice. J Toxicol
Sci 35(5):749–756
Takeda K, Suzuki K, Ishihara A, Kubo-Irie M, Fujimoto R, Tabata M,
Oshio S, Nihei Y, Ihara T, Sugamata M (2009) Nanoparticles
transferred from pregnant mice to their offspring can damage the
genital and cranial nerve systems. J Health Sci 55(1):95–102
Thomson JA, Itskovitz-Eldor J, Shapiro SS et al (1998) Embryonic
stem cell lines derived from human blastocysts. Science
282(5391):1145–1147. doi:10.1126/science.282.5391.1145
Tischfield MA, Engle EC (2010) Distinct alpha- and beta-tubulin
isotypes are required for the positioning, differentiation and
survival of neurons: new support for the ‘multi-tubulin’ hypoth-
esis. Biosci Rep 30(5):319–330
Vandesompele J, De Preter K, Pattyn F, et al. (2002) Accurate
normalization of real-time quantitative RT-PCR data by geo-
metric averaging of multiple internal control genes. Genome
Biol 3(7):RESEARCH0034
Wick P, Malek A, Manser P et al (2010) Barrier capacity of human
placenta for nanosized materials. Environ Health Perspect
118(3):432–436
Xuan S, Baptista CA, Balas G, Tao W, Soares VC, Lai E (1995)
Winged helix transcription factor BF-1 is essential for the
development of the cerebral hemispheres. Neuron 14(6):1141–
1152
Yamashita K, Yoshioka Y, Higashisaka K et al (2011) Silica and
titanium dioxide nanoparticles cause pregnancy complications in
mice. Nat Nanotechnol 6(5):321–328
Yoon K, Gaiano N (2005) Notch signaling in the mammalian central
nervous system: insights from mouse mutants. Nat Neurosci
8(6):709–715
Zimmer B, Kuegler PB, Baudis B et al (2011a) Coordinated waves of
gene expression during neuronal differentiation of embryonic
stem cells as basis for novel approaches to developmental
neurotoxicity testing. Cell Death Differ 18(3):383–395
Zimmer B, Schildknecht S, Kuegler PB, Tanavde V, Kadereit S, Leist
M (2011b) Sensitivity of dopaminergic neuron differentiation
from stem cells to chronic low-dose methylmercury exposure.
Toxicol Sci 121(2):357–367
Zimmer B, Lee G, Stiegler NV et al (2012) Evaluation of
developmental toxicants and signaling pathways in a functional
test based on the migration of human neural crest cells. Environ
Health Perspect 9:9
Arch Toxicol (2013) 87:721–733 733
123