Embed Size (px)
Citation preview

9M 2020 Results
Hanover – November 11, 2020
Ticker: CON
ADR-Ticker: CTTAY
http://www.continental-ir.com Wolfgang Schaefer – CFO

Confidential
Space for Sender Information
Agenda
9M 2020 Results – November 11, 2020
© Investor Relations Continental AG 2
Current Situation
Group Highlights
Automotive Technologies
Rubber Technologies
Powertrain Technologies
Cash Flow and Liquidity
Outlook
Back-up and Fact Sheets 2019 – 9M 2020
3
4
10
12
14
15
17
21

Confidential
Space for Sender Information
1 | Current SituationRecap of Q3 2020
3
9M 2020 Results – November 11, 2020
© Investor Relations Continental AG
Passenger car & light truck production (vs. prior year)
› (-) Worldwide: -3.5%
› (+) China: 11%
› (+) North America: 0.5%
› (-) Europe: -8%
› Lagging recovery in Germany (-16%) and France (-23%)
Replacement tires (PLT)
› (-) Worldwide: -3%
› (+) China: 10%
› (+/-) North America: 0%
› (-) Europe: -7%
› Soft demand for winter tires
Industrial and aftermarket
› Sequential improvement in all regions
› (+) China: robust year-on-year growth
Markets
Quick and successful ramp-up of activities in all businesses & regions
Continued cost and capex discipline
› Fixed costs (excl. D&A) : >8% down year-to-date
› Capex: -36% year-to-date
› Well on track to reach full-year targets
› Fixed costs reduction (excl. D&A) >5% Y-o-Y
› Capex reduction >25% Y-o-Y
Further major restructuring approved
› Discontinue tire production in Aachen at the end of 2021
› Discontinue automotive electronics production in Karben by the end of
2023 and closure by the end of 2024
› Transformation of Regensburg location by end of 2024
› Expenses of €687 mn recognized
Goodwill impairments
› €649 mn in Vehicle Networking and Information following reduced mid-
term passenger car & light truck production expectations
Continental
Confidential
Space for Sender Information
2 | Group HighlightsTransformation 2019 – 2029 Overview
4
9M 2020 Results – November 11, 2020
© Investor Relations Continental AG
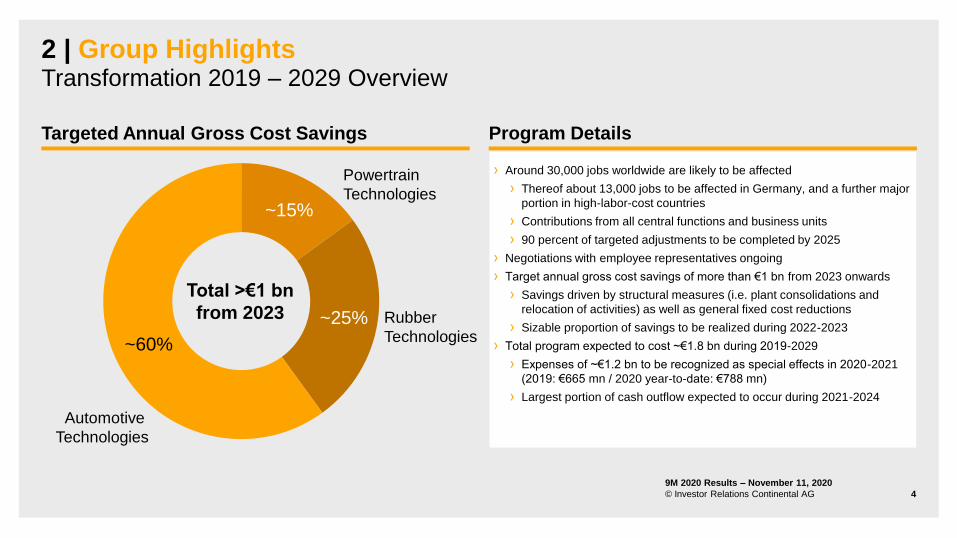
Targeted Annual Gross Cost Savings Program Details
› Around 30,000 jobs worldwide are likely to be affected
› Thereof about 13,000 jobs to be affected in Germany, and a further major
portion in high-labor-cost countries
› Contributions from all central functions and business units
› 90 percent of targeted adjustments to be completed by 2025
› Negotiations with employee representatives ongoing
› Target annual gross cost savings of more than €1 bn from 2023 onwards
› Savings driven by structural measures (i.e. plant consolidations and
relocation of activities) as well as general fixed cost reductions
› Sizable proportion of savings to be realized during 2022-2023
› Total program expected to cost ~€1.8 bn during 2019-2029
› Expenses of ~€1.2 bn to be recognized as special effects in 2020-2021
(2019: €665 mn / 2020 year-to-date: €788 mn)
› Largest portion of cash outflow expected to occur during 2021-2024
Powertrain
Technologies
Rubber
Technologies
Automotive
Technologies
Total >€1 bn
from 2023
~60%
~25%
~15%

Confidential
Space for Sender Information
2 | Group HighlightsThere's a lot of Continental in the new ID.3
9M 2020 Results – November 11, 2020
© Investor Relations Continental AG 5Sources: Continental, Volkswagen; Background: AdobeStock

Confidential
Space for Sender Information
2 | Group HighlightsVitesco Technologies Strongly Benefitting from Increasing Electrification Demand
9M 2020 Results – November 11, 2020
© Investor Relations Continental AG 6
Strong market reception of EMR3 E-axle Sizable business win supports future growth
High Voltage Axle Drive
› Combination of e-motor,
inverter and reducer
› High power density and
compact size
› All-in-one integrated
solution reduces efforts
for vehicle
manufacturers
High Voltage Box
› Redeployment of our electronics
integration competence for new
high-voltage electrification
application
› On-Board Charger, DC/DC
converter and Power Distribution
Unit integrated into a single device
› Enables battery charging from the
AC power grid as well as from
DC charging stations
>€2 bn order from major OEM
Supplying numerous OEMs, e.g.
Peugeot
e-208
Opel
Corsa-e
Hyundai
Encino
Lafesta
Dongfeng
Yixuan

Confidential
Space for Sender Information
2 | Group HighlightsMost Important KPIs for 9M 2020
9M 2020 Results – November 11, 2020
© Investor Relations Continental AG 7
1Before amortization of intangibles from PPA, changes in the scope of consolidation and special effects
2 Amortization of intangibles from PPA
3Net income attributable to the shareholders of the parent
4 Calculated as reported EBIT for the last twelve months (LTM) divided by average operating assets for the LTM
9M 2019 9M 2020 Change Comments
Sales €33.4 bn €26.8 bn -19.7% Organic growth -18.1%; FX -€578 mn
Adjusted EBIT1
Adjusted EBIT1 margin
PPA2
Special effects
Carve-out effects
Restructuring
Goodwill impairments
Other effects
€2,361 mn
7.1%
-€134 mn
-€2,621 mn
-€28 mn
-€97 mn
-€2,305 mn
-€191 mn
€629 mn
2.4%
-€138 mn
-€1,563 mn
-€74 mn
-€823 mn
-€649 mn
-€17 mn
-€1,732 mn
-470 bps
Structural program: -€788 mn
Gain from sale of SAS JV: €157 mn
NIAT3 -€926 mn -€1,168 mn -€242 mn
Free cash flow before acquisitions excluding
carve-out effects
-€266 mn €105 mn €371 mn
Gearing ratio
Equity ratio
34%
37%
39%
32%
+470 bps
-580 bps
Trailing ROCE4 2.5% -4.0% -650 bps
Net indebtedness €5,454 mn €4,923 mn YE 2019: €4,072 mn

Confidential
Space for Sender Information1Before amortization of intangibles from PPA, consolidation and special effects
2 Sequential operating leverage: Delta adjusted EBIT / delta adjusted sales seen from Q2/2020 to Q3/20203 Before changes in the scope of consolidation and exchange-rate effects
2 | Group HighlightsQ3 2020 – Sales and Earnings Performance
9M 2020 Results – November 11, 2020
© Investor Relations Continental AG 8
■ Automotive Technologies ■ Rubber Technologies ■ Powertrain Technologies ■ Consolidation | Organic Growth3 | Adj. EBIT Margin1
Sales
› Impact from FX:
› Continental Group -3.7%
› Automotive Technologies -3.4%
› Rubber Technologies -4.1%
› Powertrain Technologies -3.3%
Adjusted EBIT1
› Margins positively impacted by cost measures
and raw material prices
› Sequential operating leverage2
› Group: 40%
› Automotive Technologies: 36%
› Rubber Technologies: 45%
› Powertrain Technologies: 38%
-2.7%
2.4%
-1.4%
1,926 1,909
4,561 4,333
4,6734,101
-57 -48
10,295
Q3 2020Q3 2019
11,103
539
230
647
-31
-126 -25
832
99
Q3 2019
111
Q3 2020
612
-6.4%
Sales (€ mn) Adjusted EBIT1 (€ mn)
-6.5%
5.0%
11.8%
5.6%
8.1%
5.8%
2.4%
15.0%

Confidential
Space for Sender Information
2 | Group HighlightsComparison of Regional Production vs. Sales Growth by Group Sectors in Q3 2020
9
9M 2020 Results – November 11, 2020
© Investor Relations Continental AG PC< production by region Automotive Technologies sales Powertrain Technologies sales
Europe1 North America1 China1 Worldwide1
-15
-10
-5
0
5
10
15
1Shown as change in organic sales Y-o-Y w/o consolidation effects; China incl. Hong Kong
2 Adjusted for deconsolidation of Chinese HBS joint venture
-15
-10
-5
0
5
10
15
-15
-10
-5
0
5
10
15
-15
-10
-5
0
5
10
15
~-2%-pts~+6%-pts
∆ Y-o-Y in % ∆ Y-o-Y in % ∆ Y-o-Y in % ∆ Y-o-Y in %
Automotive Powertrain
Q3 2019 47% 46%
Q3 2020 44% 45%
Europe share of sales
Automotive Powertrain
Q3 2019 26% 25%
Q3 2020 27% 24%
North America share of sales
Automotive Powertrain
Q3 2019 13% 18%
Q3 2020 15% 20%
China share of sales2 Automotive Technologies weighted
PC< production
Powertrain Technologies weighted
PC< production
Outperformance

Confidential
Space for Sender Information
3 | Automotive TechnologiesQ3 2020 – Autonomous Mobility and Safety
9M 2020 Results – November 11, 2020
© Investor Relations Continental AG 10
Sales
› Deconsolidation effect of -€123 mn on reported
sales from Chinese HBS joint venture
› Organic growth in China and North America
outpaced local PC< production
› European sales impacted by weak German
production
Adjusted EBIT1
› Sequential operating leverage2: 43%
› Fixed cost savings could not fully compensate
for lost volumes
Order intake: €3.3 bn
› Continued delays in sourcing decisions,
especially in ADAS
› ~€1.8 bn business win for one-box integrated
brake system MK C2 with SOP 2024
Organic Growth3 | Adj. EBIT Margin1
2,290
1,987
Q3 2019 Q3 2020
147125
Q3 2019 Q3 2020
1Before amortization of intangibles from PPA, consolidation and special effects
2 Sequential operating leverage: Delta adjusted EBIT / delta adjusted sales seen from Q2/2020 to Q3/20203 Before changes in the scope of consolidation and exchange-rate effects
Sales (€ mn) Adjusted EBIT1 (€ mn)
6.8%
6.3%
-5.0%

Confidential
Space for Sender Information
3 | Automotive TechnologiesQ3 2020 – Vehicle Networking and Information
9M 2020 Results – November 11, 2020
© Investor Relations Continental AG 11
Sales
› Double-digit organic growth in China
› Negative demand development in North
America and Europe
› Decline mainly attributed to disruptive
technological change within Human Machine
Interface business unit
Adjusted EBIT1
› Sequential operating leverage2: 30%
› Positive impact from higher sales and higher
degree of capacity utilization negatively
impacted by license fees and legal costs
Order intake: €1.2 bn
› Continued delays in sourcing decisions,
especially in Human Machine Interface
business unit
› Continued success with new orders for body
and telematics control units
2,409
2,130
Q3 2019 Q3 2020
83
-26
Q3 2019 Q3 2020
1Before amortization of intangibles from PPA, consolidation and special effects
2 Sequential operating leverage: Delta adjusted EBIT / delta adjusted sales seen from Q2/2020 to Q3/20203 Before changes in the scope of consolidation and exchange-rate effects
Organic Growth3 | Adj. EBIT Margin1
Sales (€ mn) Adjusted EBIT1 (€ mn)
3.4%
-1.2%
-7.9%

Confidential
Space for Sender Information
4 | Rubber TechnologiesQ3 2020 – Tires
9M 2020 Results – November 11, 2020
© Investor Relations Continental AG 12
Sales
Adjusted EBIT1
› Sequential operating leverage2: 47%
› Strong price/mix almost compensated for
substantial FX headwinds and volume declines
› Significant raw material tailwind of ~€90 mn
› Margins strongly supported by fixed cost
reductions
2,9902,889
Q3 2019 Q3 2020
0.5%
420
494
Q3 2020Q3 2019
1Before amortization of intangibles from PPA, consolidation and special effects
2 Sequential operating leverage: Delta adjusted EBIT / delta adjusted sales seen from Q2/2020 to Q3/20203 Before changes in the scope of consolidation and exchange-rate effects
Organic Growth3 | Adj. EBIT Margin1
Sales (€ mn) Adjusted EBIT1 (€ mn)
14.0%
17.1%
› Impact from FX: -3.9%
› Volume: -1.8%
› Strong Chinese and US markets could not
compensate for still tepid European market
› Slow start to winter tire sell-in
› Price/mix: +2.4%
› Strong mix contribution and solid replacement
pricing more than offset OE price cuts

Confidential
Space for Sender Information
4 | Rubber TechnologiesQ3 2020 – ContiTech
9M 2020 Results – November 11, 2020
© Investor Relations Continental AG 13
Sales
› Impact from FX: -4.3%
› Steady recovery in all end markets
› OE: -6.4% organic, supported by Mobile Fluid
Systems and Surface Solutions business units
› Industrial & Aftermarket: -3.5% organic, with
highest growth in Air Spring Systems
business unit
› Double-digit organic growth in China
Adjusted EBIT1
› Sequential operating leverage2: 38%
› Margin recovery supported by increased
volumes, performance enhancement measures
and strict fixed cost management
› Restructuring measures proceeding according
to plan
1,5981,470
Q3 2020Q3 2019
119154
Q3 2019 Q3 2020
-5.0%
1Before amortization of intangibles from PPA, consolidation and special effects
2 Sequential operating leverage: Delta adjusted EBIT / delta adjusted sales seen from Q2/2020 to Q3/20203 Before changes in the scope of consolidation and exchange-rate effects
Organic Growth3 | Adj. EBIT Margin1
Sales (€ mn) Adjusted EBIT1 (€ mn)
7.5%
10.6%

Confidential
Space for Sender Information
5 | Powertrain TechnologiesQ3 2020 – Powertrain
9M 2020 Results – November 11, 2020
© Investor Relations Continental AG 14
1,926 1,909
Q3 2019 Q3 2020
-126
111
Q3 2019 Q3 2020
2.4%
1Before amortization of intangibles from PPA, consolidation and special effects
2 Sequential operating leverage: Delta adjusted EBIT / delta adjusted sales seen from Q2/2020 to Q3/20203 Before changes in the scope of consolidation and exchange-rate effects4 Former Hybrid and Electric Vehicle business unit
Organic Growth3 | Adj. EBIT Margin1
Sales (€ mn) Adjusted EBIT1 (€ mn)
-6.5%
5.8%
Sales
› Electrification Technology4 business unit sales
at €130 mn (€64 mn in Q3 2019) mainly driven
by power electronics and high voltage E-axle
› Outperformance in Europe and China led by
Electrification Technology business unit
› Solid demand for Electronic Controls and
Sensing & Actuation business units
Adjusted EBIT1
› Sequential operating leverage2: 38%
› Fixed costs discipline & restructuring supported
profitability
› Margin ex. Electrification Technology4 business
unit of 9.7%
Order intake: €3.9 bn
› >€2 bn order from major OEM for our high
voltage box

Confidential
Space for Sender Information
6 | Cash Flow and LiquidityFree Cash Flow Benefited in Q3 from Reversal of Working Capital Effects
9M 2020 Results – November 11, 2020
© Investor Relations Continental AG 15
Operating Cash Flow
› Reversal of negative working capital effects
from Q2 2020
Investing Cash Flow
› Capex 39% below prior year
Financing Cash Flow
› Dividend payment of €600 mn occurred on
July 17, 2020 (PY: €950 mn on May 2, 2019)
› Redemption of €750 mn bond due in
September 2020
› Purchase of the remaining shares in an already
fully consolidated company for €170 mn
Cash Flow Q3 2020 (€ mn)
1,089
2,227
-37
∑1,083
∑ 2,190
-6
Operating Investing Free Cash Flowbefore acquisitions
excluding carve-out effects
Financing
Carve-out effects Acquisitions
-61 -12
-746-427
∑ -439∑ -807
343
1,800
-106
-1,619
Q3 2019 Q3 2020 Q3 2019 Q3 2020 Q3 2019 Q3 2020 Q3 2019 Q3 2020

Confidential
Space for Sender Information
6 | Cash Flow and LiquidityFinancial Position Remains Solid
9M 2020 Results – November 11, 2020
© Investor Relations Continental AG 16
Credit Lines
› Solid financial position
› Availability of the credit facilities is not subject
to financial covenants or ratings triggers
Bonds
› Redemption of €750 mn bond due in
September 2020
Liquidity and Bond maturities (€ mn)
1Bond amounts shown are nominal values
Bond maturities1Liquidity
200
3,325
April 2021 Sept. 2023
2,456 2,516
7,629
Total liquidity
available
Cash as at
June 30, 2020
Unutilized
committed
credit lines
60
Changes in
cash incl. FX
Cash as at
Sept. 30, 2020
10,144
≥

Confidential
Space for Sender Information
7 | Outlook: Current Market AssumptionsContinued Y-o-Y Decline Expected in Most Markets in Q4
17
Vehicle Production Replacement Tires
Passenger Cars
& Light Trucks
Commercial
Vehicles
Passenger Cars
& Light Trucks
Commercial
Vehicles
Q4e 2020 FYe 2020 Q4e 2020 FYe 2020 Q4e 2020 FYe 2020 Q4e 2020 FYe 2020
Europe -3% to -5% -23% to -24% +8% to +13% -25% to -26% -4% to -6% -12% to -13% -1% to -3% -4% to -5%
North America -1% to -3% -20% to -21% -14% to -19% -40% to -41% -4% to -6% -11% to -12% -1% to -3% -4% to -5%
China -4% to -6% -7% to -8% -10% to -15% +19% to +21% +1% to +3% -5% to -6% n.a. n.a.
Worldwide -4% to -6% -18% to -19% -9% to -14% -11% to -13% -1% to -3% -12% to -13% n.a. n.a.
Q4e = Q4 estimates.
FYe = Full-year estimates
Sources: IHS, own estimates
9M 2020 Results – November 11, 2020
© Investor Relations Continental AG

Confidential
Space for Sender Information
7 | Outlook: Continental Group 2020
18
9M 2020 Results – November 11, 2020
© Investor Relations Continental AG
1Before amortization of intangibles from PPA, consolidation and special effects
2019 2020E
Consolidated sales
Adj. EBIT1 margin
€44.5 bn
7.4%
Around €37.5 bn
Around 3%
Automotive sales
Adj. EBIT1 margin
€26.5 bn
4.4%Around €22.0 bn
Around -1.5%
Rubber sales
Adj. EBIT1 margin
€18.0 bn
12.4%Around €15.5 bn
Around 10.5%
Raw materials cost impact for Rubber Headwind of €50 mn 9M: tailwind of €130 mn; further tailwind of about €70 mn expected in Q4
Special effects -€3,312 mn 9M: -€1,563 mn; further expenses expected in Q4
Capex before financial investments in % of sales 7.4% About 6.3%
Free cash flow before acquisitions and excluding
carve-out effects €1.3 bn Positive, but significantly below 2019

Confidential
Space for Sender Information

Confidential
Space for Sender Information
Disclaimer
9M 2020 Results – November 11, 2020
© Investor Relations Continental AG 20
› This presentation has been prepared by Continental Aktiengesellschaft solely in connection with the Analyst and Investor Call on November 11, 2020, and the subsequent analyst
and investor meetings. It has not been independently verified. It does not constitute an offer, invitation or recommendation to purchase or subscribe for any shares or other securities
issued by Continental AG or any subsidiary and neither shall any part of it form the basis of, or be relied upon in connection with, any contract or commitment concerning the
purchase or sale of such shares or other securities whatsoever.
› Neither Continental Aktiengesellschaft nor any of its affiliates, advisors or representatives shall have any liability whatsoever (in negligence or otherwise) for any loss that may arise
from any use of this presentation or its contents or otherwise arising in connection with this presentation.
› This presentation includes assumptions, estimates, forecasts and other forward-looking statements, including statements about our beliefs and expectations regarding future
developments as well as their effect on the results of Continental. These statements are based on plans, estimates and projections as they are currently available to the
management of Continental. Therefore, these statements speak only as of the date they are made, and we undertake no obligation to update publicly any of them in light of new
information or future events. Furthermore, although the management is of the opinion that these statements, and their underlying beliefs and expectations, are realistic as of the date
they are made, no guarantee can be given that the expected developments and effects will actually occur. Many factors may cause the actual development to be materially different
from the expectations expressed here. Such factors include, for example and without limitation, changes in general economic and business conditions, fluctuations in currency
exchange rates or interest rates, the introduction of competing products, the lack of acceptance for new products or services and changes in business strategy.
› All statements with regard to markets or market position(s) of Continental or any of its competitors are estimates of Continental based on data available to Continental. Such data are
neither comprehensive nor independently verified. Consequently, the data used are not adequate for and the statements based on such data are not meant to be an accurate or
proper definition of regional and/or product markets or market shares of Continental and any of the participants in any market.
› Unless otherwise stated, all amounts are shown in millions of euro. Please note that differences may arise as a result of the use of rounded amounts and percentages.
› Adjustment to the consolidated financial statements as of March 31, 2020: As part of the change in the accounting policy for revenue recognition for subsidiaries in China, the
Continental Group recognized the following amounts in the first quarter of 2020 as a result of an error correction in accordance with IAS 8, Accounting Policies, Changes in
Accounting Estimates and Errors. Sales increased by €68.7 million to a total of €9,912.7 million for the Continental Group, while manufacturing costs rose by €68.9 million to a total
of €7,652.1 million. In the consolidated statement of financial position, trade accounts receivable were adjusted by €81.6 million to a total of €7,323.9 million, cash and cash
equivalents by €27.9 million to a total of €2,555.0 million, trade accounts payable by €74.9 million to a total of €6,727.8 m illion, and short-term other financial liabilities by €34.8
million to a total of €906.2 million. The effect on gross margin on sales and subsequent earnings figures of -€0.2 million is not material.

Confidential
Space for Sender Information
Back-up
9M 2020 Results – November 11, 2020
© Investor Relations Continental AG 21

Confidential
Space for Sender Information
Back-upComparison of Regional Production vs. Sales Growth by Group Sectors in 9M 2020
22
9M 2020 Results – November 11, 2020
© Investor Relations Continental AG PC< production by region Automotive Technologies sales Powertrain Technologies sales
Europe1 North America1 China1 Worldwide1
-35
-30
-25
-20
-15
-10
-5
0
5
10
15
1Shown as change in organic sales Y-o-Y w/o consolidation effects; China incl. Hong Kong
2 Adjusted for deconsolidation of Chinese HBS joint venture
-30
-25
-20
-15
-10
-5
0
5
10
15
-15
-10
-5
0
5
10
15
-30
-25
-20
-15
-10
-5
0
5
10
15
~+4%-pts ~+10%-pts
∆ Y-o-Y in % ∆ Y-o-Y in % ∆ Y-o-Y in % ∆ Y-o-Y in %
Automotive Powertrain
9M 2019 48% 48%
9M 2020 46% 46%
Europe share of sales
Automotive Powertrain
9M 2019 25% 24%
9M 2020 24% 22%
North America share of sales
Automotive Powertrain
9M 2019 13% 17%
9M 2020 16% 20%
China share of sales2
0
Automotive Technologies weighted
PC< production
Powertrain Technologies weighted
PC< production
Outperformance
Confidential
Space for Sender Information
Back-upKey Historical Credit Metrics
23
9M 2020 Results – November 11, 2020
© Investor Relations Continental AG
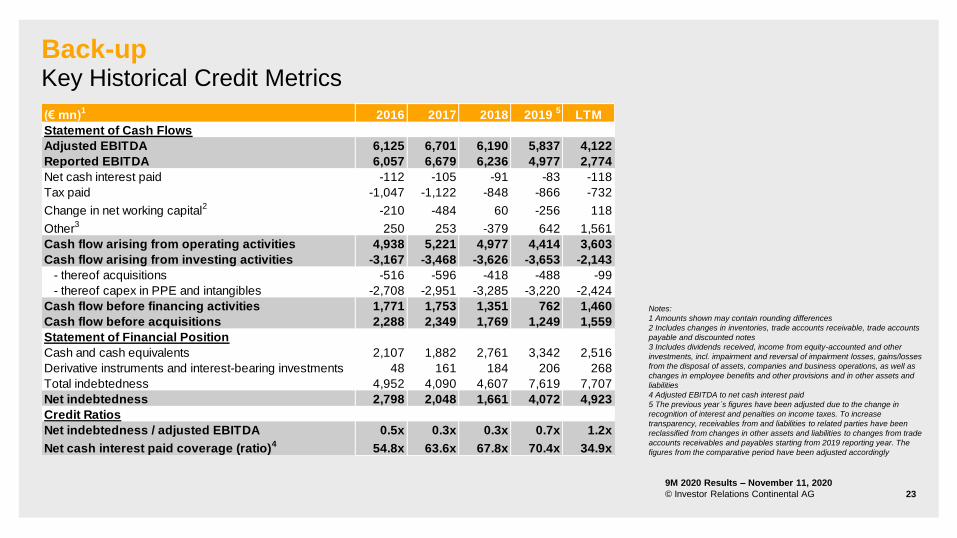
Notes:
1 Amounts shown may contain rounding differences
2 Includes changes in inventories, trade accounts receivable, trade accounts
payable and discounted notes
3 Includes dividends received, income from equity-accounted and other
investments, incl. impairment and reversal of impairment losses, gains/losses
from the disposal of assets, companies and business operations, as well as
changes in employee benefits and other provisions and in other assets and
liabilities
4 Adjusted EBITDA to net cash interest paid
5 The previous year´s figures have been adjusted due to the change in
recognition of interest and penalties on income taxes. To increase
transparency, receivables from and liabilities to related parties have been
reclassified from changes in other assets and liabilities to changes from trade
accounts receivables and payables starting from 2019 reporting year. The
figures from the comparative period have been adjusted accordingly
(€ mn)1
2016 2017 2018 2019 5
LTM
Statement of Cash Flows
Adjusted EBITDA 6,125 6,701 6,190 5,837 4,122
Reported EBITDA 6,057 6,679 6,236 4,977 2,774
Net cash interest paid -112 -105 -91 -83 -118
Tax paid -1,047 -1,122 -848 -866 -732
Change in net working capital2
-210 -484 60 -256 118
Other3
250 253 -379 642 1,561
Cash flow arising from operating activities 4,938 5,221 4,977 4,414 3,603
Cash flow arising from investing activities -3,167 -3,468 -3,626 -3,653 -2,143
- thereof acquisitions -516 -596 -418 -488 -99
- thereof capex in PPE and intangibles -2,708 -2,951 -3,285 -3,220 -2,424
Cash flow before financing activities 1,771 1,753 1,351 762 1,460
Cash flow before acquisitions 2,288 2,349 1,769 1,249 1,559
Statement of Financial Position
Cash and cash equivalents 2,107 1,882 2,761 3,342 2,516
Derivative instruments and interest-bearing investments 48 161 184 206 268
Total indebtedness 4,952 4,090 4,607 7,619 7,707
Net indebtedness 2,798 2,048 1,661 4,072 4,923
Credit Ratios
Net indebtedness / adjusted EBITDA 0.5x 0.3x 0.3x 0.7x 1.2x
Net cash interest paid coverage (ratio)4
54.8x 63.6x 67.8x 70.4x 34.9x

Confidential
Space for Sender Information
Back-upCapex, Depreciation and Earnings per Share – Breakdown for 9M 2020
24
Capex, Depreciation and PPA1 (€ mn) EPS excl. PPA1,2 (€)
1
2 1,2
1Amortization of intangibles from PPA
2Assuming corporate tax rate of 28%
3 Including effects from IFRS 16
■ Capex (PPE), percentage of sales | ■ Depreciation, w/o PPA1 | ■ PPA1
Reported EPS
5.84
PPA per
share after tax
0.505.34
EPS excl.
PPA
1,956 2,204
1,3791,506
4,240
2,705
128 134 138
20192018 2020
5.9% 6.6%
5.1%
3
3
3
3
9M 2020 Results – November 11, 2020
© Investor Relations Continental AG
--

Confidential
Space for Sender Information 9M 2020 Results – November 11, 2020
© Investor Relations Continental AG 25
Issuer Continental AG Conti-Gummi Finance
B.V., Netherlands1
Conti-Gummi Finance
B.V., Netherlands1
Continental AG Continental AG
Issue Senior Notes
Principal
amount€500 mn €750 mn €625 mn €600 mn €750 mn
Offering price 99.804% 99.559% 99.589% 99.802% 98.791%
Rating
at issue date
Baa1 (Moody’s)
BBB+ (Fitch)
Baa2 (Moody’s)
BBB (Fitch)
Baa2 (Moody’s)
BBB (Fitch)
Baa1 (Moody’s)
BBB+ (Fitch)
Baa2 (Moody’s)
BBB (Fitch)
Current rating
(group)BBB (S&P2), BBB (Fitch3), Baa2 (Moody’s4)
Coupon 0.00% p.a. 2.125% p.a. 1.125% p.a. 0.375% p.a. 2.500% p.a.
Issue date Sept. 12, 2019 May 27, 2020 June 25, 2020 Sept. 27, 2019 May 27, 2020
Maturity Sept. 12, 2023 Nov. 27, 2023 Sept. 25, 2024 June 27, 2025 Aug. 27, 2026
Interest
payment
Annual
Nov. 27
Annual
Sept. 25
Annual
June 27
Annual
Aug. 27
WKN A2YPE5 A28XTQ A28YEC A2YPAE A28XTR
ISIN XS2051667181 XS2178585423 XS2193657561 XS2056430874 XS2178586157
Denomination€1,000 with minimum
tradable amount €1,000
€1,000 with minimum
tradable amount €1,000
€1,000 with minimum
tradable amount €1,000
€1,000 with minimum
tradable amount €1,000
€1,000 with minimum
tradable amount €1,000
1Guaranteed by Continental AG
2Contracted rating since May 19, 2000
3 Contracted rating since November 7, 20134 Contracted rating since January 1, 2019
Back-upRelevant Bonds

Confidential
Space for Sender Information 9M 2020 Results – November 11, 2020
© Investor Relations Continental AG 26
Back-upInvestment Grade Credit Profile
Continental’s current credit rating is:
› Fitch (since April 20, 2020): BBB, outlook stable
› S&P (since March 30, 2020): BBB, outlook negative
› Moody’s (since March 13, 2020): Baa2, outlook negative
Continental’s targets:
› Rating: BBB / BBB+
› Leverage ratio1: well below 1.00x
› Gearing ratio2: below 20%
› Equity ratio3: above 35%
Leverage ratio1 Gearing ratio2 Equity ratio3
1Net indebtedness divided by adjusted EBITDA (LTM); IFRS 16 applied starting 2019
2Net indebtedness divided by equity; IFRS 16 applied starting 2019
3 IFRS 16 applied starting 2019

Confidential
Space for Sender Information 9M 2020 Results – November 11, 2020
© Investor Relations Continental AG 27
2006 2007 2008 2009 2010 2011 2012 2013 2014 2015 2016 2017 2018 2019 2020
BBB+ / Baa1
BBB / Baa2
BBB- / Baa3
BB+ / Ba1
BB / Ba2
BB- / Ba3
B+ / B1
B / B2
S&P, Fitch / Moody’s
Standard & Poor’s1 Moody’s2
Fitch3
Before
Siemens VDO
Non-in
vestm
ent
gra
de
Investm
ent
gra
de
1 Contracted rating since May 19, 20002 Contracted rating since January 1, 20193 Contracted rating since November 7, 2013
Back-upContinental’s Credit Rating

Confidential
Space for Sender Information 9M 2020 Results – November 11, 2020
© Investor Relations Continental AG 28
Fact Sheets2019 – 9M 2020
Confidential
Space for Sender Information
Fact SheetsSales and Adjusted EBIT1 by Quarter
29
Adjusted EBIT1Sales
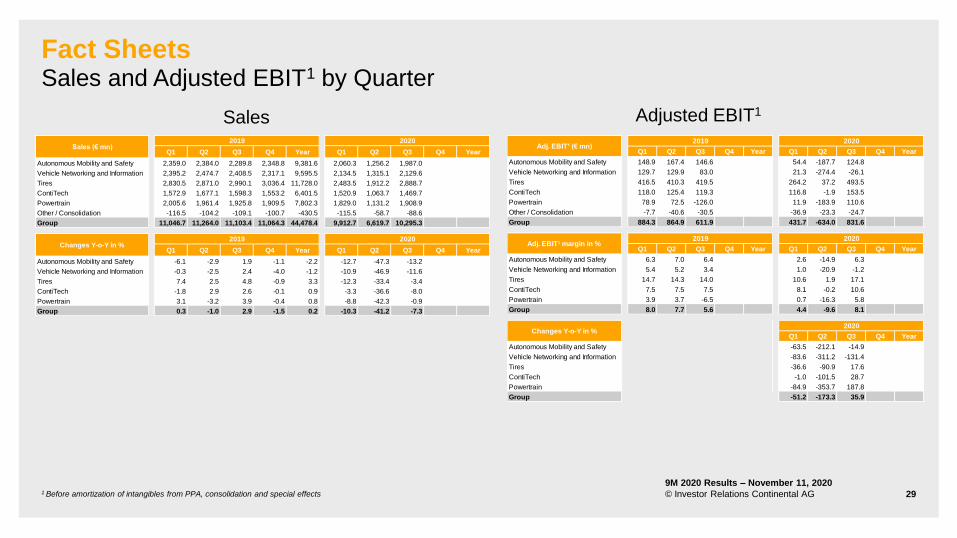
1 Before amortization of intangibles from PPA, consolidation and special effects
9M 2020 Results – November 11, 2020
© Investor Relations Continental AG
Q1 Q2 Q3 Q4 Year Q1 Q2 Q3 Q4 Year
Autonomous Mobility and Safety 2,359.0 2,384.0 2,289.8 2,348.8 9,381.6 2,060.3 1,256.2 1,987.0
Vehicle Networking and Information 2,395.2 2,474.7 2,408.5 2,317.1 9,595.5 2,134.5 1,315.1 2,129.6
Tires 2,830.5 2,871.0 2,990.1 3,036.4 11,728.0 2,483.5 1,912.2 2,888.7
ContiTech 1,572.9 1,677.1 1,598.3 1,553.2 6,401.5 1,520.9 1,063.7 1,469.7
Powertrain 2,005.6 1,961.4 1,925.8 1,909.5 7,802.3 1,829.0 1,131.2 1,908.9
Other / Consolidation -116.5 -104.2 -109.1 -100.7 -430.5 -115.5 -58.7 -88.6
Group 11,046.7 11,264.0 11,103.4 11,064.3 44,478.4 9,912.7 6,619.7 10,295.3
Q1 Q2 Q3 Q4 Year Q1 Q2 Q3 Q4 Year
Autonomous Mobility and Safety -6.1 -2.9 1.9 -1.1 -2.2 -12.7 -47.3 -13.2
Vehicle Networking and Information -0.3 -2.5 2.4 -4.0 -1.2 -10.9 -46.9 -11.6
Tires 7.4 2.5 4.8 -0.9 3.3 -12.3 -33.4 -3.4
ContiTech -1.8 2.9 2.6 -0.1 0.9 -3.3 -36.6 -8.0
Powertrain 3.1 -3.2 3.9 -0.4 0.8 -8.8 -42.3 -0.9
Group 0.3 -1.0 2.9 -1.5 0.2 -10.3 -41.2 -7.3
Changes Y-o-Y in %2019 2020
Sales (€ mn)2019 2020
Q1 Q2 Q3 Q4 Year Q1 Q2 Q3 Q4 Year
Autonomous Mobility and Safety 148.9 167.4 146.6 54.4 -187.7 124.8
Vehicle Networking and Information 129.7 129.9 83.0 21.3 -274.4 -26.1
Tires 416.5 410.3 419.5 264.2 37.2 493.5
ContiTech 118.0 125.4 119.3 116.8 -1.9 153.5
Powertrain 78.9 72.5 -126.0 11.9 -183.9 110.6
Other / Consolidation -7.7 -40.6 -30.5 -36.9 -23.3 -24.7
Group 884.3 864.9 611.9 431.7 -634.0 831.6
Q1 Q2 Q3 Q4 Year Q1 Q2 Q3 Q4 Year
Autonomous Mobility and Safety 6.3 7.0 6.4 2.6 -14.9 6.3
Vehicle Networking and Information 5.4 5.2 3.4 1.0 -20.9 -1.2
Tires 14.7 14.3 14.0 10.6 1.9 17.1
ContiTech 7.5 7.5 7.5 8.1 -0.2 10.6
Powertrain 3.9 3.7 -6.5 0.7 -16.3 5.8
Group 8.0 7.7 5.6 4.4 -9.6 8.1
Q1 Q2 Q3 Q4 Year
Autonomous Mobility and Safety -63.5 -212.1 -14.9
Vehicle Networking and Information -83.6 -311.2 -131.4
Tires -36.6 -90.9 17.6
ContiTech -1.0 -101.5 28.7
Powertrain -84.9 -353.7 187.8
Group -51.2 -173.3 35.9
Changes Y-o-Y in %2020
Adj. EBIT¹ (€ mn)2019 2020
Adj. EBIT¹ margin in %2019 2020

Confidential
Space for Sender Information
Fact SheetsEBITDA and EBIT by Quarter
30
EBITEBITDA
9M 2020 Results – November 11, 2020
© Investor Relations Continental AG
Q1 Q2 Q3 Q4 Year Q1 Q2 Q3 Q4 Year
147.2 164.4 -590.9 159.0 -120.3 11.8 -193.9 45.8
112.9 111.8 -1,465.8 -84.2 -1,325.3 139.6 -358.5 -921.8
414.0 398.2 391.4 448.0 1,651.6 256.6 31.0 231.3
96.0 64.8 95.8 49.3 305.9 89.8 -39.3 102.6
60.9 56.3 -367.8 -411.5 -662.1 -22.9 -244.3 -106.2
-7.7 -42.2 -33.2 -35.0 -118.1 -38.6 -24.1 -25.1
823.3 753.3 -1,970.5 125.6 -268.3 436.3 -829.1 -673.4
Q1 Q2 Q3 Q4 Year Q1 Q2 Q3 Q4 Year
6.2 6.9 -25.8 6.8 -1.3 0.6 -15.4 2.3
4.7 4.5 -60.9 -3.6 -13.8 6.5 -27.3 -43.3
14.6 13.9 13.1 14.8 14.1 10.3 1.6 8.0
6.1 3.9 6.0 3.2 4.8 5.9 -3.7 7.0
3.0 2.9 -19.1 -21.6 -8.5 -1.3 -21.6 -5.6
7.5 6.7 -17.7 1.1 -0.6 4.4 -12.5 -6.5
Q1 Q2 Q3 Q4 Year Q1 Q2 Q3 Q4 Year
-41.8 -24.7 -634.3 -20.8 -115.4 -92.0 -217.9 -107.8
-38.8 -48.1 -530.2 -134.0 -234.1 23.6 -420.7 -37.1
4.7 -19.3 -13.0 -17.5 -12.2 -38.0 -92.2 -40.9
-21.2 -41.9 38.0 -47.2 -22.8 -6.5 -160.6 7.1
-38.7 -49.1 -322.3 -12,759.4 -652.7 -137.6 -533.9 71.1
-19.2 -32.7 -331.4 -87.9 -106.7 -47.0 -210.1 65.8
2019 2020
2019 2020
2019 2020
Q1 Q2 Q3 Q4 Year Q1 Q2 Q3 Q4 Year
Autonomous Mobility and Safety 270.0 292.7 260.4 322.2 1,145.3 151.3 -61.6 168.0
Vehicle Networking and Information 235.4 269.7 32.4 44.9 582.4 276.3 -225.4 -72.5
Tires 610.0 597.8 613.8 676.1 2,497.7 471.6 241.8 435.8
ContiTech 178.8 152.9 184.3 154.5 670.5 179.4 49.6 201.8
Powertrain 186.0 185.4 -10.7 -168.2 192.5 116.5 -91.3 14.6
Other / Consolidation -6.5 -41.6 -30.8 -32.3 -111.2 -34.7 -21.2 -22.8
Group 1,473.7 1,456.9 1,049.4 997.2 4,977.2 1,160.4 -108.1 724.9
Q1 Q2 Q3 Q4 Year Q1 Q2 Q3 Q4 Year
Autonomous Mobility and Safety 11.4 12.3 11.4 13.7 12.2 7.3 -4.9 8.5
Vehicle Networking and Information 9.8 10.9 1.3 1.9 6.1 12.9 -17.1 -3.4
Tires 21.6 20.8 20.5 22.3 21.3 19.0 12.6 15.1
ContiTech 11.4 9.1 11.5 9.9 10.5 11.8 4.7 13.7
Powertrain 9.3 9.5 -0.6 -8.8 2.5 6.4 -8.1 0.8
Group 13.3 12.9 9.5 9.0 11.2 11.7 -1.6 7.0
Q1 Q2 Q3 Q4 Year Q1 Q2 Q3 Q4 Year
Autonomous Mobility and Safety -24.3 -9.8 18.5 3.2 -5.6 -44.0 -121.0 -35.5
Vehicle Networking and Information -16.9 -13.6 -92.7 -87.2 -58.1 17.4 -183.6 -323.8
Tires 11.8 -7.3 1.7 -3.5 0.1 -22.7 -59.6 -29.0
ContiTech -8.7 -18.0 25.7 -10.4 -4.4 0.3 -67.6 9.5
Powertrain -10.3 -15.4 -134.9 -243.3 -66.5 -37.4 -149.2 236.4
Group -5.2 -12.1 -25.7 -38.1 -20.2 -21.3 -107.4 -30.9
Changes Y-o-Y in %2019 2020
(€ mn)2019 2020
Margin in %2019 2020

Confidential
Space for Sender Information
Fact SheetsConsolidated Statement of Income
31
9M 2020 Results – November 11, 2020
© Investor Relations Continental AG 1
Other valuation effects: gains/losses debt instruments at amortized costs and gains/losses debt instruments non-SPPI
2020 2019 2020 2019
1 - 9 1 - 9 Q3 Q3
Sales 26,827.7 33,414.1 10,295.3 11,103.4
Cost of sales -20,897.9 -25,327.8 -7,636.0 -8,449.7
Gross margin on sales 5,929.8 8,086.3 2,659.3 2,653.7
Research and development expenses -3,142.2 -3,357.2 -1,009.2 -1,124.3
Selling and logistics expenses -1,807.7 -2,023.3 -582.7 -676.6
Administrative expenses -856.7 -857.8 -285.5 -271.9
Other income 1,144.7 1,083.5 331.1 360.5
Other expenses -2,340.7 -3,186.9 -1,789.6 -2,761.5
Income from at-equity accounted investees 6.1 -139.0 3.1 -150.4
Other income from investments 0.5 0.5 0.1
Earnings before interest and tax -1,066.2 -393.9 -673.4 -1,970.5
Interest income 71.9 87.6 22.0 28.5
Interest expense -202.4 -218.5 -72.1 -76.1
Effects from currency translation -78.3 -30.4 -59.3 -23.2
Effects from changes in the fair value of derivative instruments and other valuation effects 1 66.0 2.4 29.6 9.9
Financial result -142.8 -158.9 -79.8 -60.9
Earnings before tax -1,209.0 -552.8 -753.2 -2,031.4
Income tax expense 60.6 -342.8 49.9 53.5
Net income -1,148.4 -895.6 -703.3 -1,977.9
Non-controlling interests -19.7 -30.8 -16.0 -8.5
Net income attributable to the shareholders of the parent -1,168.1 -926.4 -719.3 -1,986.4
Basic earnings per share (in €) -5.84 -4.63 -3.60 -9.93
Diluted earnings per share (in €) -5.84 -4.63 -3.60 -9.93
(€ mn)

Confidential
Space for Sender Information
Assets (€ mn) September 30, 2020 December 31, 2019 September 30, 2019
Goodwill 4,373.8 5,113.5 5,107.1
Other intangible assets 1,516.4 1,691.8 1,708.5
Property, plant and equipment 13,698.7 14,932.7 14,735.9
Investment property 11.3 11.7 11.8
Investments in equity-accounted investees 389.7 397.7 417.9
Other investments 163.6 197.6 197.2
Deferred tax assets 2,558.1 2,174.4 2,171.3
Defined benefit assets 10.2 7.8 41.1
Long-term contract assets — 0.1 0.1
Long-term derivative instruments and interest-bearing investments 126.8 54.0 54.2
Long-term other financial assets 119.8 114.6 117.1
Long-term other assets 26.5 28.6 25.0
Non-current assets 22,994.9 24,724.5 24,587.2
Inventories 4,427.4 4,694.4 5,038.9
Trade accounts receivable 7,989.5 7,711.6 8,712.7
Short-term contract assets 118.4 89.1 102.8
Short-term other financial assets 148.7 118.5 111.7Short-term other assets 1,371.4 1,406.7 1,477.2
Income tax receivables 239.5 240.5 287.7
Short-term derivative instruments and interest-bearing investments 141.6 151.5 153.7
Cash and cash equivalents 2,515.5 3,341.8 1,971.2
Assets held for sale 18.2 89.6 88.4Current assets 16,970.2 17,843.7 17,944.3
Total assets 39,965.1 42,568.2 42,531.5
Fact SheetsConsolidated Statement of Financial Position – Assets
32
9M 2020 Results – November 11, 2020
© Investor Relations Continental AG

Confidential
Space for Sender Information
Equity and liabilities (€ mn) September 30, 2020 December 31, 2019 September 30, 2019
Subscribed capital 512.0 512.0 512.0
Capital reserves 4,155.6 4,155.6 4,155.6
Retained earnings 11,753.9 13,522.1 13,820.8
Other comprehensive income -4,168.6 -2,794.4 -3,045.6
Equity attributable to the shareholders of the parent 12,252.9 15,395.3 15,442.8
Non-controlling interests 381.3 480.4 467.9
Total equity 12,634.2 15,875.7 15,910.7
Long-term employee benefits 5,837.1 5,406.3 5,777.6
Deferred tax liabilities 211.8 305.4 361.0
Long-term provisions for other risks and obligations 1,467.8 666.1 262.7
Long-term indebtedness 5,138.5 3,375.2 3,077.9
Long-term other financial liabilities 31.0 31.7 32.0
Long-term contract liabilities 12.7 16.7 11.8
Long-term other liabilities 47.2 20.0 18.6
Non-current liabilities 12,746.1 9,821.4 9,541.6
Short-term employee benefits 1,351.6 1,368.7 1,520.8
Trade accounts payable 6,008.7 7,111.0 6,868.6
Short-term contract liabilities 279.6 234.9 197.6
Income tax payables 930.2 938.6 859.3
Short-term provisions for other risks and obligations 1,356.6 1,261.6 1,166.7
Short-term indebtedness 2,568.8 4,243.8 4,554.7
Short-term other financial liabilities 1,114.5 1,046.3 1,000.2
Short-term other liabilities 974.8 666.2 911.3
Current liabilities 14,584.8 16,871.1 17,079.2
Total equity and liabilities 39,965.1 42,568.2 42,531.5
Fact SheetsConsolidated Statement of Financial Position – Total Equity and Liabilities
33
9M 2020 Results – November 11, 2020
© Investor Relations Continental AG

Confidential
Space for Sender Information
Fact SheetsConsolidated Statement of Cash Flows
34
9M 2020 Results – November 11, 2020
© Investor Relations Continental AG
2020 2019 2020 2019
Net income -1,148.4 -895.6 -703.3 -1,977.9
Income tax expense -60.6 342.8 -49.9 -53.5
Financial result 142.8 158.9 79.8 60.9EBIT -1,066.2 -393.9 -673.4 -1,970.5
Interest paid -120.5 -110.5 -49.6 -57.1
Interest received 25.5 50.7 7.3 8.5
Income tax paid -555.4 -689.5 -185.4 -219.4
Dividends received 19.0 26.2 8.1 10.2
Depreciation, amortization, impairment and reversal of impairment losses 2.843,41
4,373.9 1.398,31
3,019.9
Income from equity-accounted investees and other investments, incl. impairment and reversal of impairment losses -6.6 138.5 -3.2 150.4
Gains/losses from the disposal of assets, companies and business operations -183.2 -7.1 -11.4 -2.8Changes in
inventories 40.8 -397.1 334.4 -41.5
trade accounts receivable -483.4 -473.6 -1,694.4 -217.7
trade accounts payable -846.8 -792.3 1,602.0 -122.2
employee benefits and other provisions 1,125.4 271.0 966.0 285.1
other assets and liabilities 223.6 -169.6 490.9 239.9Cash flow arising from operating activities 1,015.6 1,826.7 2,189.6 1,082.8
Cash flow from the disposal of assets 46.6 23.1 15.2 7.6
Capital expenditure on property, plant and equipment, and software -1,235.9 -1,990.6 -425.3 -696.9Capital expenditure on intangible assets from development projects and miscellaneous -153.0 -194.3 -33.9 -56.9Cash flow from the disposal of companies and business operations 301.9 1.1 17.4 0.3Acquisition of companies and business operations -26.8 -415.9 -12.3 -61.3Cash flow arising from investing activities -1,067.2 -2,576.6 -438.9 -807.2
Cash flow before financing activities (free cash flow) -51.6 -749.9 1,750.7 275.6
Change in indebtedness 157.1 961.3 -847.1 -105.4Successive purchases -172.8 -70.8 -170.0 -0.3Dividends paid -600,0 -950.0 -600,0 —Dividends paid to and cash changes from equity transactions with -21.9 -25.5 -2.2 -0.7Cash and cash equivalents arising from first-time consolidation of subsidiaries — 0.4 — —Cash flow arising from financing activities -637.6 -84.6 -1,619.3 -106.4
Change in cash and cash equivalents -689.2 -834.5 131.4 169.2
Cash and cash equivalents at the beginning of the reporting period 3,341.8 2,761.4 2,455.6 1,786.3Effect of exchange-rate changes on cash and cash equivalents -137.1 44.3 -71.5 15.7Cash and cash equivalents at the end of the reporting period 2,515.5 1,971.2 2,515.5 1,971.2
January 1 to September 30 Third Quarter(€ mn)
1 Expenses from derecognitions of brand values are likewise included.

Confidential
Space for Sender Information
Fact SheetsReported and Adjusted 9M 2020 Results
351 Before amortization of intangibles from PPA, changes in the scope of consolidation and special effects
9M 2020 Results – November 11, 2020
© Investor Relations Continental AG
(€ mn)
2019 2020 2019 2020 2019 2020 2019 2020 2019 2020 2019 2020 2019 2020
Sales 7,032.8 5,303.5 7,278.4 5,579.2 8,691.6 7,284.4 4,848.3 4,054.3 5,892.8 4,869.1 -329.8 -262.8 33,414.1 26,827.7
EBIT -279.3 -136.3 -1,241.1 -1,140.7 1,203.6 518.9 256.6 153.1 -250.6 -373.4 -83.1 -87.8 -393.9 -1,066.2
Amortization of intangible assets from PPA 42.3 49.4 15.0 14.2 68.2 67.7 8.1 7.1 133.6 138.4
Total special effects 743.8 127.8 1,540.0 812.9 27.7 261.1 37.6 53.1 267.9 304.9 4.3 2.9 2,621.3 1,562.7
Total consolidation effects -1.6 1.4 -0.8 0.7 0.3 -5.5 0.1 -5.6
Total consolidation and special effects 742.2 127.8 1,541.4 812.1 27.7 261.8 37.9 47.6 267.9 304.9 4.3 2.9 2,621.4 1,557.1
Adjusted operating result (adj. EBIT) 1 462.9 -8.5 342.6 -279.2 1,246.3 794.9 362.7 268.4 25.4 -61.4 -78.8 -84.9 2,361.1 629.3
in % of adjusted sales 6.7% -0.2% 4.7% -5.0% 14.3% 10.9% 7.5% 6.8% 0.4% -1.3% 7.1% 2.4%
Powertrain Cons. / Corr. GroupVehicle Networking
and Information
Autonomous Mobility
and SafetyTires ContiTech
(€ mn)
2019 2020 2019 2020 2019 2020 2019 2020 2019 2020
Sales 14,252.2 10,841.1 13,450.7 11,266.5 5,892.8 4,869.1 -181.6 -149.0 33,414.1 26,827.7
EBIT -1,520.4 -1,277.9 1,460.2 672.0 -250.6 -373.4 -83.1 -86.9 -393.9 -1,066.2
Amortization of intangible assets from PPA 42.3 49.4 83.2 81.9 8.1 7.1 133.6 138.4
Total special effects 2,283.8 940.7 65.3 314.2 267.9 304.9 4.3 2.9 2,621.3 1,562.7
Total consolidation effects -0.2 -0.8 0.3 -4.8 0.1 -5.6
Total consolidation and special effects 2,283.6 939.9 65.6 309.4 267.9 304.9 4.3 2.9 2,621.4 1,557.1
Adjusted operating result (adj. EBIT) 1 805.5 -288.6 1,609.0 1,063.3 25.4 -61.4 -78.8 -84.0 2,361.1 629.3
in % of adjusted sales 5.7% -2.7% 12.0% 9.5% 0.4% -1.3% 7.1% 2.4%
Automotive
TechnologiesRubber Technologies
Powertrain
TechnologiesCons. / Corr. Group

Confidential
Space for Sender Information
ReferencesUseful Links
9M 2020 Results – November 11, 2020
© Investor Relations Continental AG 36
Continental Investor Relations website www.continental-ir.com
Annual and interim reports www.continental-corporation.com/en/investors/reports
Fact Book / Investor Presentation https://www.continental.com/resource/blob/216182/efcf10cdc6ebd9fbc952e257cd2dcfd7/investor-
presentation-2020-data.pdf
Investor Relations
events and presentations
https://www.continental.com/en/investors/events-and-presentations
Sustainability at Continental
(presentation and fact sheet for investors)
https://www.continental.com/resource/blob/23136/8b04da84d56f973fd247b1f131226184/sustainability-
presentation-data.pdf
Corporate Sustainability www.continental-sustainability.com
2019 Integrated Sustainability Report https://www.continental.com/en/sustainability/downloads
Corporate Governance Principles www.continental-corporation.com/en/company/corporate-governance/principles-and-declarations
Continental shares https://www.continental.com/en/investors/shares
Continental debt and rating https://www.continental.com/en/investors/debt-and-rating

Confidential
Space for Sender Information
ContinentalFinancial Calendar
9M 2020 Results – November 11, 2020
© Investor Relations Continental AG 37
2021
Annual Financial Press Conference March 9, 2021
Annual Shareholders’ Meeting (incl. key data for Q1 2021) April 29, 2021
Q1 Financial Report May 6, 2021
Half-Year Financial Report August 5, 2021
Nine-Month Financial Report November 10, 2021
2020
Annual Financial Press Conference March 5, 2020
Q1 Financial Report May 7, 2020
Annual Shareholders’ Meeting (virtual) July 14, 2020
Half-Year Financial Report August 5, 2020
Nine-Month Financial Report November 11, 2020
Capital Market Days (w/o Powertrain Technologies) December 8-16, 2020

Confidential
Space for Sender Information
ContactEquity and Debt Markets Relations
9M 2020 Results – November 11, 2020
© Investor Relations Continental AG 38
Vahrenwalder Str. 9
30165 Hanover
Germany
e-mail: [email protected]
Fax: +49 511 938-1080
www.continental-ir.com
Michael Saemann
Analysts, Institutional Investors and
Sustainability Investors
Phone: +49 511 938-1307
e-mail: [email protected]
Christopher Macke
Analysts and Institutional Investors
Phone: +49 511 938-1062
e-mail: [email protected]
Klaus Paesler
Analysts, Institutional Investors, ADR
and Private Investors
Phone: +49 511 938-1316
e-mail: [email protected]
Sabine Reese
Sustainability, ASM, CMD
Organization, IR Website, Capital
Market Disclosure Requirements
Phone: +49 511 938-1027
e-mail: [email protected]
Bernard Wang
Head of IR
Phone: +49 511 938-1068
e-mail: [email protected]
Jana Maddison
Assistant to the Head of IR
Roadshow and Conference Organization
Phone: +49 511 938-1163
e-mail: [email protected]