Embed Size (px)
Citation preview

9.8. Theories of Reaction Rates
We will consider one theory for reaction rates…………………
Transition State TheoryTransition State Theory
(please also take a look at Collision Theory in Chang textpages 473-474)
…..theory developed by Henry Eyring in the 1930s
…..enables us to calculate the rate constant for a reactionwith accuracy.

Henry Eyring
(1901-1981)


Transition State Theory
A + B X‡ C + D
…A and B are reactants and are always in equilibrium with X ‡, the activated complex (according to this theory)
…..X ‡ is the activated complex (also referred to as a transition-state complex) of relatively high energy
…….the activated complex should not be thought of as an unstableisolatable intermediate because it is assumed to always be in the process of decomposing………..
k

A + B X ‡ C + D
……the equilibrium between reactants and activated complexis not conventional……
The equilibrium constant may be written as:
K ‡ = [X ‡ ] / {[A][B]}
The rate for the reaction may be expressed as follows:
Rate = [X ‡] = K ‡ {[A][B]}
….where is the frequency of crossing the activation energy barrierand [X ‡] is the concentration of activated complex at the top of the barrier.

Rate = [ X ‡] = K ‡ { [A] [B] }
We may also write the expression for the Rate as follows:
Rate = k [A] [B]
Thus,
k = K ‡ (k has units of s-1)
It has been shown that = kBT / h
where kB is the Boltzmann constant, h is Planck’s constant.
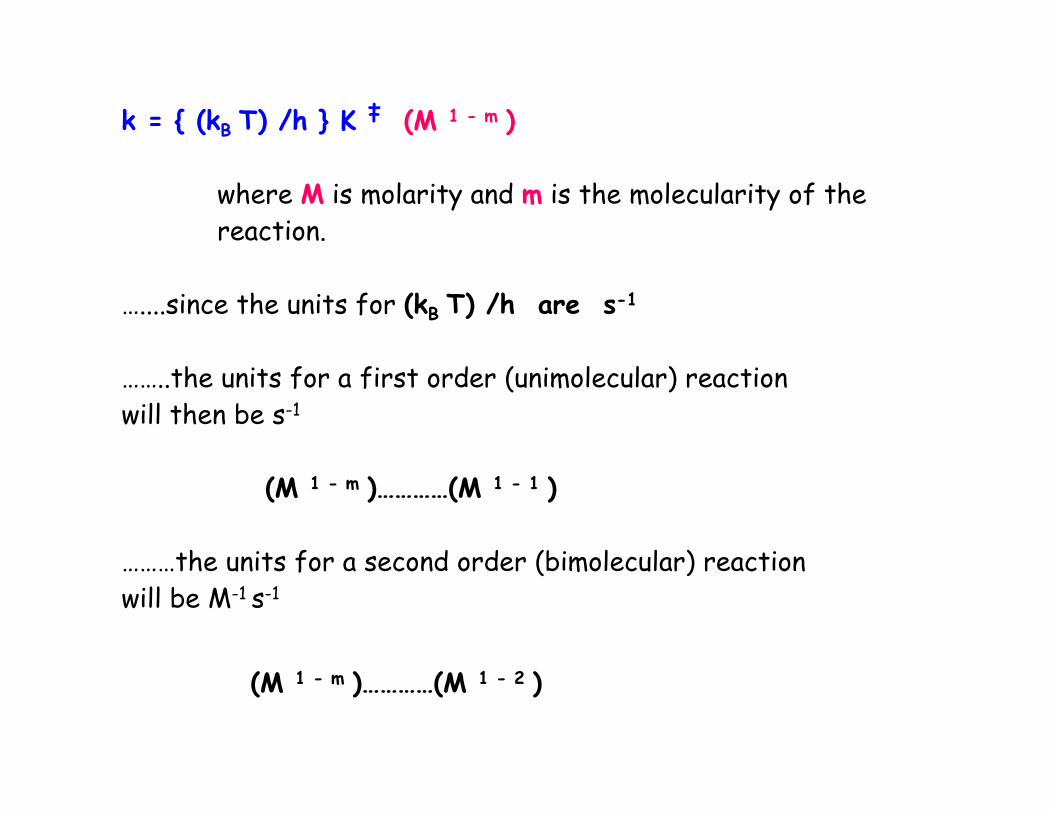
k = { (kB T) /h } K ‡ (M 1 - m )
where M is molarity and m is the molecularity of the reaction.
k = { (kB T) /h } K ‡ (M 1 - m )
where M is molarity and m is the molecularity of the reaction.
…....since the units for (kB T) /h are s-1
……..the units for a first order (unimolecular) reaction will then be s-1
(M 1 - m )…………(M 1 - 1 )
………the units for a second order (bimolecular) reaction will be M-1 s-1
(M 1 - m )…………(M 1 - 2 )

Thermodynamic Formulation of Transition State Theory
G° ‡ = - RT ln K ‡
K ‡ = e - G° ‡ / (RT)
G° ‡ is the standard molar Gibbs Energy of activation and is given by:
G° ‡ = G° (activated complex) - G° (reactants)

G° ‡ = G° (activated complex) - G° (reactants)
Activated Complex
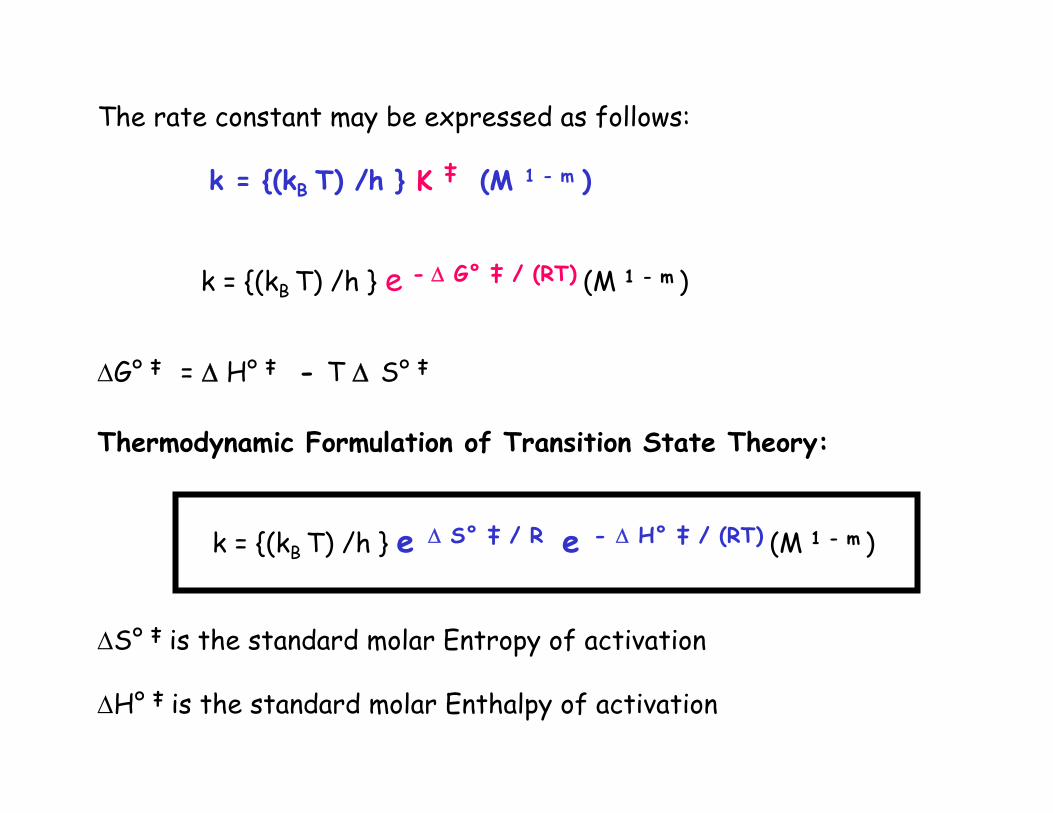
The rate constant may be expressed as follows:
k = {(kB T) /h } K ‡ (M 1 - m )
k = {(kB T) /h } e - G° ‡ / (RT) (M 1 - m )
G° ‡ = H° ‡ - T S° ‡
Thermodynamic Formulation of Transition State Theory:
k = {(kB T) /h } e S° ‡ / R e - H° ‡ / (RT) (M 1 - m )
S° ‡ is the standard molar Entropy of activation
H° ‡ is the standard molar Enthalpy of activation

……we have now introduced the equation for the rate constantas developed using transition state theory………
……other theories have also been used to develop expressions orequations for the rate constant of Activation……
……three of the expressions developed are as follows:
(1) k = A e – Ea/RT (Arrhenius Expression)
(2) k = PZ e - Ea/RT (Collision Theory)
(3) k = {(kB T) /h } e S° ‡ / R e - H° ‡ / (RT) (M 1 - m )
(Transition State Theory)

(1) k = A e – Ea/RT (Arrhenius Expression)
(2) k = P Z e - Ea/RT (Collision Theory)
(3) k = {(kB T) /h } e S° ‡ / R e - H° ‡ / (RT) (M 1 - m )
(Transition State Theory)assume H° ‡ = Ea
A = P Z = {(kB T) /h } e S° ‡ / R
P is the probability factor …….it takes into account the factthat in a collision complex the molecules must be properlyoriented for a successful collision leading to reaction.
Z is the number of binary collisions that is occurring.
Recall: A, the frequency factor represents the frequency of collisions between reactant molecules.

A = P Z = {(kB T) /h } e S° ‡ / R
……. if the reactants are atoms or simple small molecules thanthe little energy will be redistributed in formation of activated complex………
so S° ‡ will typically have a small positive or negativevalue.
………..if instead the reactants are large molecules, macromolecules,or complex molecules then S° ‡ will typically have a large positive or negative value.

……..we made the assumption that H° ‡ = Ea
……..but actually more accurately it should be …………
Ea = U° ‡ + RT
where:
U° ‡ is the standard molar internal energy of activation.

Derivation of the Equation: Ea = ΔUo‡ + RT
k = hTk B exp(ΔSo‡/R) exp(–ΔHo‡/RT)
ln k = ln
hTk B + (ΔSo‡/R) – (ΔHo‡/RT) (1)
For Ideal Gas behaviour:
ΔHo‡ = ΔUo‡ + P ΔVo‡ = ΔUo‡ + RT Δn‡ (2)
where:
Δn‡ = (no. of moles of activated complex) – (no. of moles of reactants)
= 1 – m (3)
therefore:
ΔHo‡ = ΔUo‡ + (1 – m) RT (4)
Note that for Ideal Gas behaviour, ΔUo‡ and ΔSo‡ are independent of T

Differentiate equation (1) with respect to T:
dTd (ln k) =
hTk
ln dTd B +
dTd (ΔSo‡/R) –
dTd (ΔHo‡/RT)
=
h
kTk
h B
B
+ 0 +
2RT1 ΔHo‡ –
dTd
RT1
(ΔUo‡ + (1 – m)RT)
=
2RT1
T1 ΔHo‡ –
RT1 (1 – m)RT
=
2RT1 (ΔHo‡ + RT – (1 – m)RT)
=
2RT1 (ΔHo‡ + mRT) (5)

Starting with the Arrhenius equation:
ln k = ln A –
RT1 Ea
Differentiate with respect to T:
dTd (ln k) = 0 +
2RT1 Ea =
2RT1 Ea (6)
Compare this with the (1/RT2) term of equation (5) on previous slide:
Ea = ΔHo‡ + mRT = ΔUo‡ + (1 – m)RT + mRT
= ΔUo‡ + RT (7)
Ea = ΔUo‡ + RT

At constant pressure:
H° ‡ = U° ‡ + P V ° ‡
Ea = H° ‡ - P V ° ‡ + RT
For reactions in solution
the P V ° ‡ term is negligible
so the equation becomes ……….
Ea = H° ‡ + RT

k = {(kB T) /h } e S° ‡ / R e - H° ‡ / (RT) (M 1 - m )
In solution,
with assumption that P V ° ‡ term is negligible
so…….. Ea = H° ‡ + RT
k = {(kB T) /h } e S° ‡ / R e – (Ea-RT) / (RT) (M 1 - m )
k = e {(kB T) /h } e S° ‡ / R e – Ea / (RT) (M 1 - m )
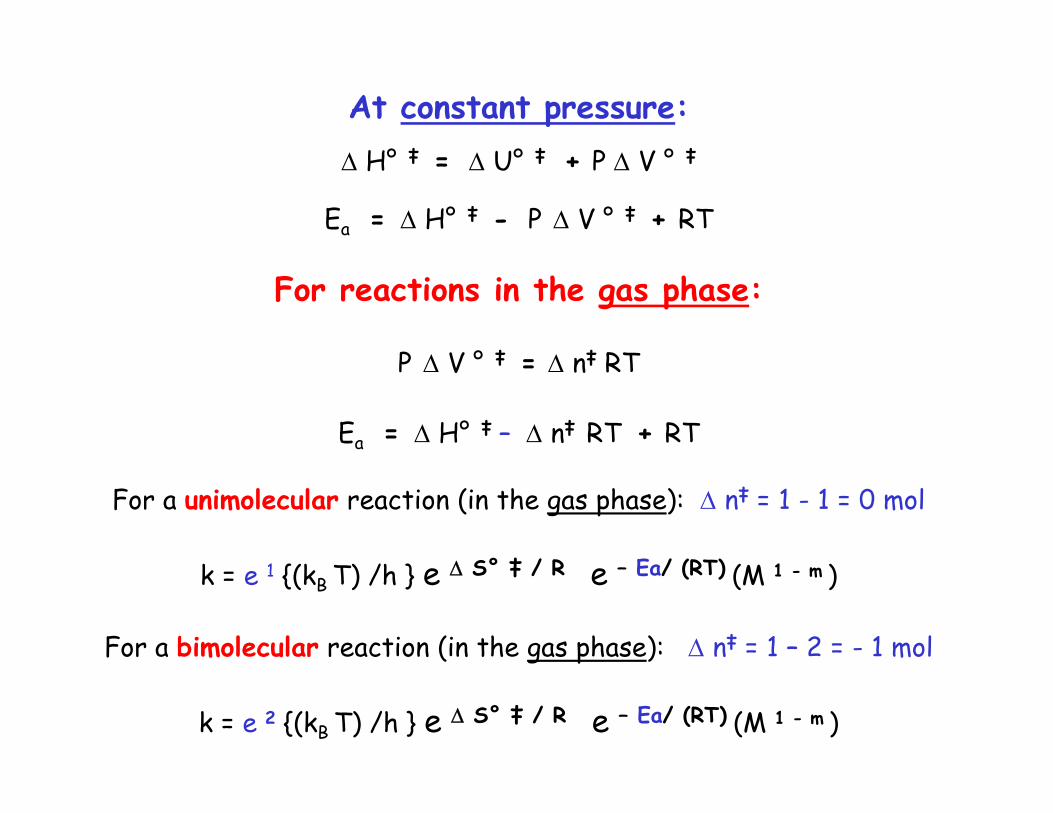
At constant pressure: H° ‡ = U° ‡ + P V ° ‡
Ea = H° ‡ - P V ° ‡ + RT
For reactions in the gas phase:
P V ° ‡ = n‡ RT
Ea = H° ‡ – n‡ RT + RT
For a unimolecular reaction (in the gas phase): n‡ = 1 - 1 = 0 mol
k = e 1 {(kB T) /h } e S° ‡ / R e – Ea/ (RT) (M 1 - m )
For a bimolecular reaction (in the gas phase): n‡ = 1 – 2 = - 1 mol
k = e 2 {(kB T) /h } e S° ‡ / R e – Ea/ (RT) (M 1 - m )

Example 12.2 from Chang Text
The pre-exponential factor and activation energy for the unimolecularreaction
CH3NC (g) CH3CN (g)
are 4.0 x 10¹³ s-1 and 272 kJ/mol, respectively. Calculate the values of H°‡, S°‡, G°‡ at 300 K.
Solution

12.37. (a) The pre-exponential factor and activation energy for the hydrolysis of t-butyl chloride are 2.1 x 10¹⁶ s-1 and 102 kJ,respectively. Calculate the values of H° ‡ and S° ‡ at 286 K.(Hint: this reaction occurs in the condensed phase)
Solution:

12.37. (b) The pre-exponential and activation energy for the gas-phase cycloaddition of maleic anhydride and cyclopentadiene are5.9 x 107 M-1 s-1 and 51 kJ , respectively. Calculate the values of∆So ‡ and ∆Ho ‡ at 293 K for the reaction.
Solution:

9.9. Catalysis
• a catalyst accelerates a chemical reaction but undergoes nonet chemical change
• catalyst lowers Ea of reaction by providing alternate pathwaythat avoids rate-determining step of uncatalyzed reaction
• catalysts don’t change the Gibbs E of reactants or products
• some catalysts also provide stability against temperaturechanges

Example:Decomposition of hydrogen peroxide:
2H2O2 (aq) 2H2O(l) + O2(g)Ea for uncatalyzed reaction is 76 kJ k = A e – Ea/RT
k = A 4.76 x 10⁻¹⁴
Effect of Catalysts:(a) Add in a bit of iodide ion and the Ea decreases to 57 kJ
k = A e – Ea/RT = A 1.02 x 10⁻¹⁰
so increases rate by factor of 2000 (1.02 x 10⁻¹⁰/4.76 x 10-14)
(b) Add in a bit of the enzyme, catalase and Ea decreases to 8 kJ
k = A e – Ea/RT = A 0.04so increases rate by factor of 1011

Activation Energies
Activated Complex • The reaction rate may may be increased by lowering the Ea
• A catalyst lowers the Ea for a reaction
• Catalysts do not change the position of equilibrium for a reaction ………they are also not consumed in the reaction.

Homogeneous Catalysis• a catalyst that is in the same phase as the reaction mixture
Examples:
decomposition of hydrogen peroxide in presence of iodide ionsor the enzyme, catalase……in both cases all components are dissolved in solution.
Heterogeneous Catalysis• a catalyst that is in a different phase from the reaction mixture
Examples: decomposition of phosphine (PH3) on hot tungsten
decomposition of gaseous ammonia on tungsten surfaceNH3 (g) ½ N2 (g) + 3/2 H2 (g)

Enzymes
• are homogeneous biological catalysts
• enzymes contain an active site that binds substrate (reactant) and turns it into product
• many therapeutic approaches are based on inhibiting the enzymesthat catalyze certain biological reactions/processes
e.g. treatment of AIDS includes continual administration of protease inhibitors (e.g. Ritanovir) which inhibit HIVprotease.

Example:
2 H2O2 → 2 H2O + O2
- 1 % decomposed after 3 days at 25oC
ΔGo = -103.10 kJ ΔHo = -94.64 kJ
- Very slow in pure aqueous solution
- Dependence on [E] : rate (or velocity) = k [catalyst]1
- When [S] is low : rate (or velocity) = k [S]1
- When [S] is high : rate (or velocity) = k [S]0 = Rmax = Vmax
-d[H2O2]/dt = k [H2O2] [catalyst]

Catalyst Rate (M s-1) a Ea (kJ)
________________________________________________
None 10-8 71
HBr 10-4 50
Fe2+/Fe3+ 10-3 42
Hematin or Haemoglobin 10-1 ---
Fe(OH)2TETA+ 10+3 29
Catalase b 10+7 8
a Run with [H2O2] = 1 M and [catalyst] = 1 M
b 10 million molecules per second at maximum rate

Role of catalase in lowering the activation energy for the decomposition of H2O2

Kinetics of Enzymatic Reactions
Active at very low [enzyme] : 10-10 to 10-8 M
Difficult to measure [enzyme] – therefore study [S]
(1) Dependence on [E] : Rate0 = v0 = k [E]
(2) Low values of [S] : Rate0 = v0 = k [S]
(3) High values of [S] : Rate0 = v0 = Rmax = Vmax
Expected if E forms a complex, ES , with S. At high [S] ,
all of E is tied up in the complex. E working at full capacity !!
Turnover number = Rmax/[E]0
where: [E]0 = total enzyme site concentration

Plot of the initial rate (v0) of an enzyme-catalyzed reaction versus substrate concentration [S].

Plot of Gibbs energy versus reaction coordinate for an enzyme-catalyzed reaction.

Chang Text #13.8 The hydrolysis of urea,
(NH2)2CO + H2O → 2 NH3 + CO2
has been studied by many researchers. At 100°C the (pseudo) first-order rate constant is 4.2 x 10⁻⁵ s-1. The reaction is catalyzed by the enzyme urease, which at 21°C has a rate constant of 3 x 10⁴ s-1. If the enthalpies of activation for the uncatalyzed and catalyzed reactions reactions are 134 kJ and 43.9 kJ, respectively.
(a) calculate the temperature at which the nonenzymatic hydrolysis of urea would proceed at the same rate as the enzymatic hydrolysis at 21°C.

Solution
….we are interested in finding the temperature at which the rate of the uncatalyzed would be the same as that for the catalyzed at 21°C. ….assume A is the same for both catalyzed and uncatalyzed rxns.

(b) Calculate the lowering of ΔG‡ due to urease.
(c) Comment on the sign of ∆S‡ . Assume that ∆H‡ ≈ Ea and thatboth ΔH‡ and ΔS‡ are independent of temperature .
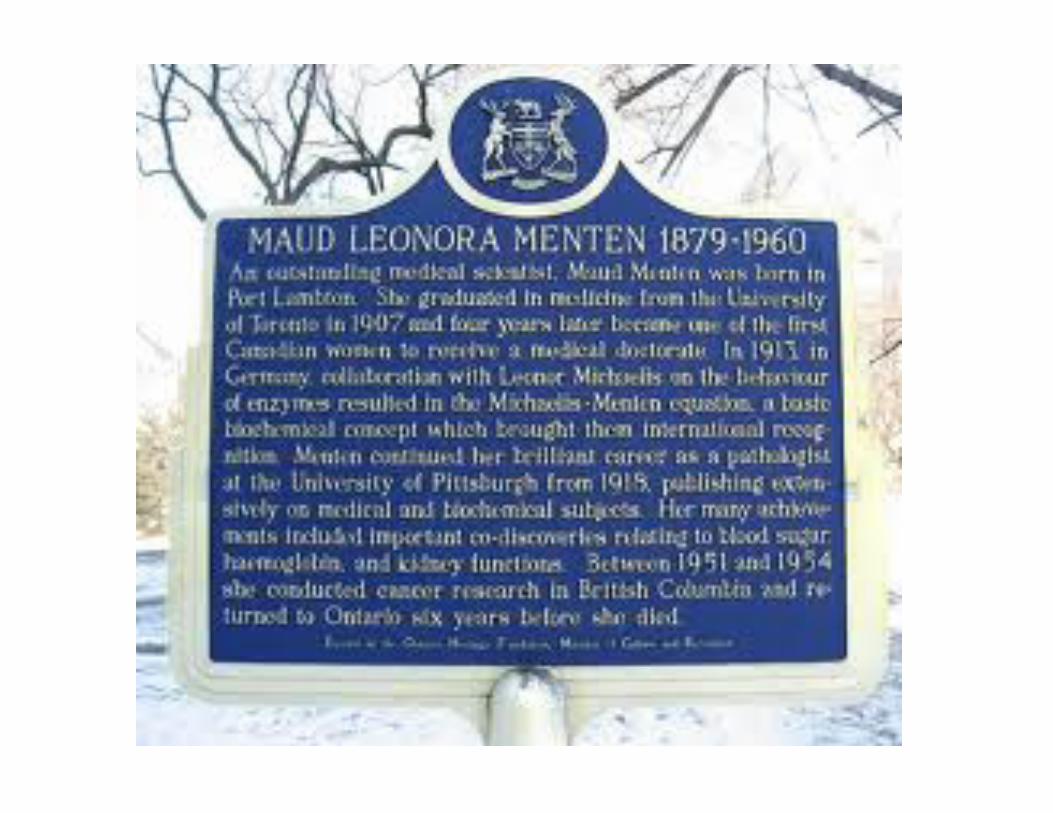

Maud Leonora Menten
(1879 – 1960)
An outstanding medical scientist, Maud Menten was born in Port Lambton. She graduated in medicine from the University of Toronto in 1907 and four years later became one of the first Canadian women
to receive a medical doctorate. In 1913, in Germany, collaboration with Leonor Michaelis on the behaviour of enzymes resulted in the
Michaelis-Menten equation, a basic biochemical concept which brought them international recognition. Menten continued her brilliant career as a pathologist at the University of Pittsburgh from 1918, publishing
extensively on medical and biochemical subjects. Her many achievements included important co-discoveries relating to blood
sugar, haemoglobin and kidney functions. Between 1951 and 1954 she conducted cancer research in British Columbia and returned to
Ontario six years before she died.

Maud Menten Leonor Michaelis

The Michaelis-Menten Mechanism of Enzyme Catalysis (1913)
E + S ES E + P
R = k1 [E][S] R = k-1 [ES] R = k2 [ES]
Rate (or velocity) of product formation: (during initial stages of reaction – before [P] is significant)
Rate0 = R0 = v0 = (d[P]/dt)0 = k2 [ES]
Apply Steady-State Approximation to [ES] : (Haldane (1926))
d[ES]/dt = k1 [E][S] – k-1 [ES] – k2 [ES] = 0
k-1 k1 k2

Plot of the concentrations of the various species in an enzyme-catalyzed reaction. It is assumed that [S]0 >> [E]0 and that the rate
constants k1 , k-1 and k2 are of comparable magnitudes.
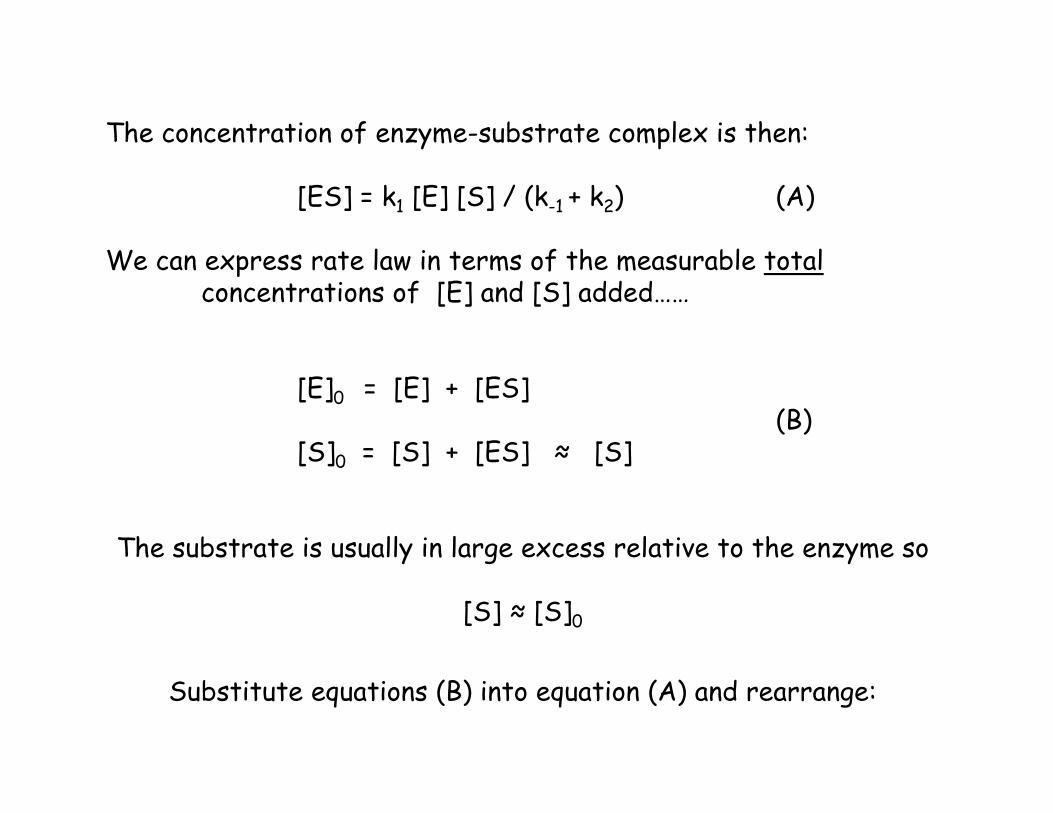
The concentration of enzyme-substrate complex is then:
[ES] = k1 [E] [S] / (k-1 + k2) (A)
We can express rate law in terms of the measurable totalconcentrations of [E] and [S] added……
[E]0 = [E] + [ES](B)
[S]0 = [S] + [ES] ≈ [S]
The substrate is usually in large excess relative to the enzyme so
[S] ≈ [S]0
Substitute equations (B) into equation (A) and rearrange:

[ES] = k1 ( [E]0 – [ES] ) [S] / (k-1 + k2)
= {k1/(k-1+k2)} [E]0 [S] – {k1/(k-1+k2)} [S] [ES]
Therefore:
(1 + {k1/(k-1+k2)} [S] ) [ES] = {k1/(k-1+k2)} [E]0 [S]
And:
[ES] = {k1/(k-1+k2)} [E]0 [S] / (1 + {k1/(k-1+k2)} [S] )
= [E] 0 / [ 1 + {(k-1 + k2)/ k1} (1 /[S] ) ]
Rate0 = R0 = v0 = k2 [ES]
R0 = v0 = (k2 [E]0 ) / [ 1 + {(k-1 + k2)/ k1} {1 /[S] } ]

R0 = v0 = (k2 [E]0 ) / [ 1 + {(k-1 + k2)/ k1} {1 /[S] } ]
= (k2 [E]0 ) / [ 1 + (KM/[S]) ]
= Rmax / [ 1 + (KM/[S]) ] (C)
where:
KM = {(k-1 + k2)/ k1} is the Michaelis constant
Rmax = Vmax = k2 [E]0 = maximum rate

Three special cases:
1. Low [S] : KM/[S] >> 1
Rate ≈ (Rmax/KM) [S]
Rate is proportional to [S] (or [S]0)
2. High [S] : KM/[S] << 1
Rate is proportional to Rmax = maximum rate
3. KM = [S] :
Rate = Rmax/2 = Vmax/2

Graphical determination of Vmax (= Rmax) and KM

Lineweaver-Burk Plot:
Rearrange equation (C) to:
1/R0 = 1/v0 = 1/Rmax + {KM/Rmax} {1/[S] } (D)
Plot: ……… 1/v0 versus 1/[S] ……… gives straight line…………
Slope = KM/Vmax = KM/Rmax
y-intercept = 1/Vmax = 1/Rmax
x-intercept = - 1/KM

Lineweaver-Burk plot for an enzyme-catalyzed reaction obeying Michaelis-Menten kinetics

Eadie-Hofstee Plot:
Multiply both sides of equation (D) by (Vmax v0) and rearrange to:
v0 = - KM (v0/[S]) + Vmax (E)
Plot …… v0 versus (v0/[S]) …… to give a straight line
Slope = - KM x-intercept = (Vmax/KM) y-intercept = Vmax
Qualitatively, Eadie-Hofstee plot spreads the values at high [S] (where v0 → Vmax) whereas Lineweaver-Burk plot compresses them there.

Eadie-Hofstee plot for an enzyme-catalyzed reaction obeying Michaelis-Menten kinetics

Enzyme Inhibition
Inhibitors decrease rate of an enzyme-catalyzed reaction. Very important application:
Feedback Mechanism
Activity of enzymes regulated by feedback of inhibitor, F , so that end-product acts as specific inhibitor to enzyme. Thus, amounts of products can be controlled.
Glycolytic Pathway is an example of a Feedback Mechanism.

Control of regulatory enzymes frequently involves Feedback Mechanism. In this sequence of reactions catalyzed by enzymes, the first enzyme in the series is inhibited by product F. At the
early stages of the reaction, [F] is low and its inhibitory effect is minimal. As [F] reaches a certain level, it can lead to total
inhibition of the first enzyme and hence turns off its own source of production. This is analogous to a thermostat turning off a heat supply when the ambient temperature reaches a preset
level.

Reversible Inhibitors
Equilibrium exists between enzyme and the inhibitor.
3 important types follow:
Competitive , Noncompetitive and Uncompetitive Inhibition.
Irreversible Inhibitors
Inhibition increases with time. Finally achieved when:
[Inhibitor] > [Enzyme]

Three types of reversible inhibition.
(a) Competitive.
Both S and I compete for same active site. Only ES complex leads to product, P.
(b) Noncompetitive.
I binds to a site other than the active site. ESI complex does not lead to product, P.
(c) Uncompetitive.
I binds only to the ES complex. ESI complex does not lead to product, P.

Competitive Inhibition
k-1 k1 k2
E + S ← → ES → E + P + I
↕ KI =
]EI[]I][E[
EI
EI does not form products

Competitive Inhibition
Use Michaelis-Menten kinetics
Apply Steady-State approximation to ES :
v0 = ))K/]I([1])(S/[K(1
V
IM
max
where: KI = ]EI[]I][E[

Competitive Inhibition
Lineweaver-Burk equation becomes:
0v1 =
maxImax
M
V1
]S[1
K]I[1
VK
Plot (1/v0) versus (1/[S]) at constant [I]
y-intercept =
maxV1 = same as in normal Lineweaver-Burk plot
Slope =
Imax
M
K]I[1
VK
Slope is enhanced by a factor: (1 + ([I]/KI))

Competitive Inhibition

Competitive Inhibition
Dehydrogenation of succinic acid: COOH │ succinic CH2 dehydrogenase H ─ C ─ COOH │ ← → ║ CH2 HOOC─ C ─ H │ COOH Succinic acid Fumaric acid
Malonic acid , HOOC–CH2–COOH , resembles succinic acid in
structure and can combine with the enzyme to act as an inhibitor

Competitive Inhibition
inhibited0
normal0
)v()v( = 1 +
IMI
M
KKK]S[]I[K
To overcome inhibition, need to increase [S] relative to [I]
so that at high [S] :
[S] KI >> KM KI
and
inhibited0
normal0
)v()v( ≈ 1 +
I
M
K]S[]I[K ≈ 1

Noncompetitive Inhibition k-1 k1 k2
E + S ← → ES → E + P + + I I
↕ ↕ KI = ]EI[]I][E[ =
]ESI[]I][ES[
EI + S ← → ESI
EI and ESI do not form products
Since I does not interfere with formation of ES ,
noncompetitive inhibition cannot be reversed by ↑ [S] .

Noncompetitive Inhibition
Use Michaelis-Menten kinetics
If we assume that:
KI = ]EI[]I][E[ =
]ESI[]I][ES[
then the initial rate is given by:
v0 = ))K/]I([1])(S[K(
]S[V
IM
max

Noncompetitive InhibitionLineweaver-Burk equation becomes:
0v1 =
ImaxImax
M
K]I[1
V1
]S[1
K]I[1
VK
Plot (1/v0) versus (1/[S]) at constant [I]
y-intercept =
ImaxK
]I[1V1
Slope =
Imax
M
K]I[1
VK
Slope and y-intercept are both enhanced by a factor: (1 + ([I]/KI))

Noncompetitive Inhibition

Noncompetitive Inhibition
Plot of (1/v0) versus (1/[S]) gives a straight line with an increase
in slope and intercept compared with “normal” Lineweaver-Burk plot.
inhibited0
normal0
)v()v( = 1 +
IK
]I[
Degree of noncompetitive inhibition is independent of [S]
Depends only on [I] and KI

Noncompetitive Inhibition
Example:
Reversible reactions between sulfhydryl groups of cysteine
residues with heavy metal ions:
2 –SH + Hg2+ ↔ –S–Hg–S– + 2 H+
–SH + Ag+ ↔ –S–Ag + H+

Uncompetitive Inhibition
Does not bind to enzyme – instead, to (reversibly) the
enzyme–substrate complex to yield an inactive ESI complex k-1 k1 k2
E + S ← → ES → E + P
+
I
↕ KI = ]ESI[]I][ES[
ESI
ESI does not form a product

Uncompetitive Inhibition
Again, since I does not interfere with the formation of ES,
cannot be reversed by ↑ [S]. Then :
v0 = ))K/]I([1](S[K
]S[V
IM
max
where: KI = ]ESI[]I][ES[

Uncompetitive InhibitionLineweaver-Burk equation becomes:
0v1 =
Imaxmax
M
K]I[1
V1
]S[1
VK
Plot (1/v0) versus (1/[S]) at constant [I] yields a straight line in which
the y-intercept increases by ([I]/KI) while the slope remains constant :
y-intercept =
maxV1
IK
]I[1 = enhanced by a factor of (1 + ([I]/KI))
Slope =
max
M
VK = same as in normal Lineweaver-Burk plot

Uncompetitive Inhibition
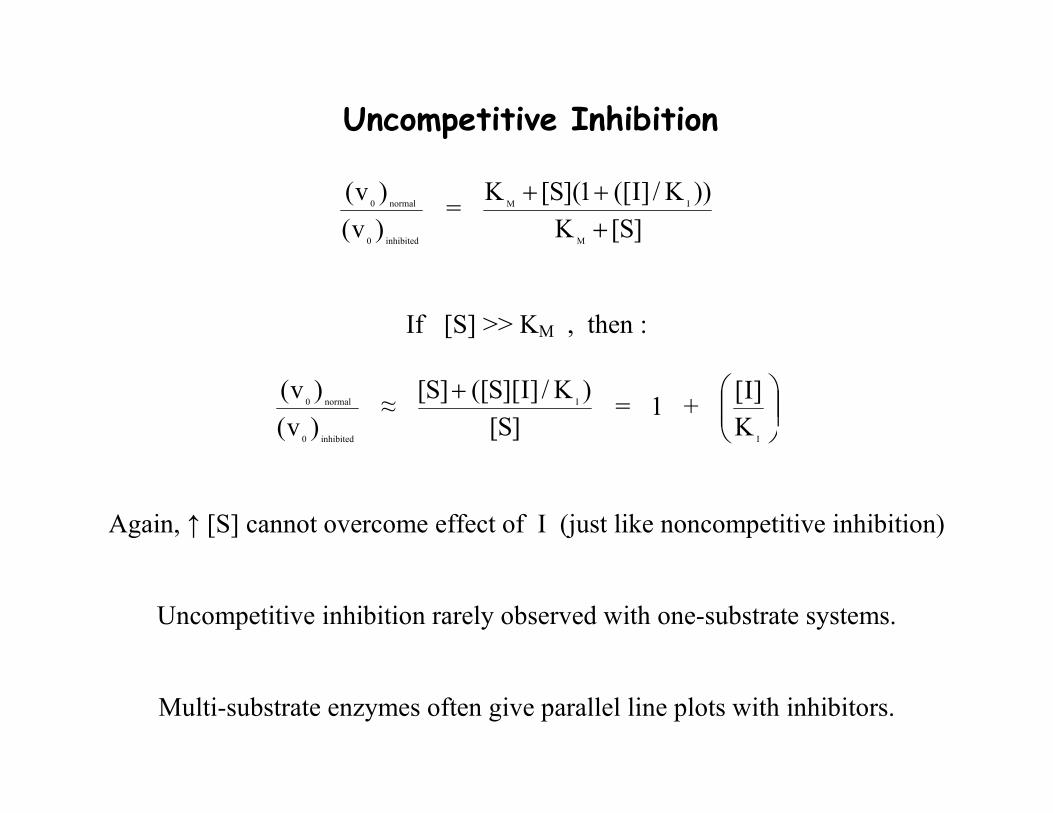
Uncompetitive Inhibition
inhibited0
normal0
)v()v( =
]S[K))K/]I([1](S[K
M
IM
If [S] >> KM , then :
inhibited0
normal0
)v()v( ≈
]S[)K/]I][S([]S[
I = 1 +
IK
]I[
Again, ↑ [S] cannot overcome effect of I (just like noncompetitive inhibition)
Uncompetitive inhibition rarely observed with one-substrate systems.
Multi-substrate enzymes often give parallel line plots with inhibitors.

Example: Enzymatic Inhibition
(a) An enzyme has a KM value of 2.8 x 10⁻⁵ M and a Vmax value of 53 μM min-1. Calculate the value of v0 if [S] = 3.7 x 10⁻⁴ M, [I] = 4.8 x 10⁻⁴ M and KI = 1.7 x 10⁻⁵ M for:
(i) an uninhibited reaction, (ii) a competitively inhibited reaction, (iii) a noncompetitively inhibited reaction and (iv) an uncompetitively inhibited reaction.

Example: Enzymatic Inhibition
(b) The degree of inhibition i is given by: i % = (1 – α) x 100% , where:
α =
Calculate the percent inhibition for the three examples ofinhibited reactions of part (a). Comment on the significance of your results.
duninhibite0
inhibited0
)v()v(

9.10. Isotope Effects in Chemical Reactions
……..when an atom in a reactant molecule is replaced by one of its isotopes …….the equilibrium and rate constants for the reaction may change……..
Equilibrium Isotope Effects……..refers to changes to equilibrium as a result of isotope substitution.
Kinetic Isotope Effects……………refers to changes in rates as a result of isotope substitution.
……the underlying theory behind isotope effects is complicated we will only consider overall simple perspective here………

…..isotopic replacement DOES NOT effect the electronic structure of the molecule …….however rate of a reaction is still often profoundly affected…….
As a simple example, lets consider substitution of deuterium (D)for hydrogen…….
H2, HD, D2
……..the zero point energies for these molecules are:
H2 26.5 kJ/mol
HD 21.6 kJ/mol
D2 17.9 kJ/mol
(*** zero point energies = ground state vibrational energies)(*** the lower the ground state vibrational energy the more
difficult to break the molecule apart)

…..since D2 has the lowest zero-point energy the dissociationof this molecule takes more energy and will be the slowest
(relative to the dissociation of H2 or HD)
D2 2D

According to this figure the Ea for dissociation of H2 and D2 may be expressed as follows:
EH = Estretch – EH0
ED = Estretch – ED0
EH0, ED
0, are the zero point energiesfor these molecules……….
Estretch ….is the difference betweenthe lowest possible potential energyand the potential energy of the activated complex…….
Activation Energies for dissociation of H2 and D2

Let’s calculate the ratio of the rate constants for the dissociationof H2 and D2……….
kH/kD = [A e-(Estretch – EH0)/RT] / [A e-(Estretch – ED0)/RT]
= e (EH0 - ED0)/RT
= e {(26.5 – 17.9) x 1000 J/mol } / (8.314 J/molK)(300K)
= 31

………….this is an extreme example usually we are more interested in breaking of a bond between hydrogen and some other atom…….
Example…..rupture of C-H bond versus rupture of C-D bond.In this case there is still a kinetic isotope effect but not as profound as that seen for dissociation of D2 versus H2.
In fact the ratio of kC-H/kC-D is usually on the order of 5.
……we exploit kinetic isotope effects in order to study organicor biological processes (e.g. enzyme mechanisms).
(there is a good example of this in the Chang text pages 482-3)

Chang Text 12.38. A person may die after drinking D2O instead of H2O for a prolonged period (on the order of days). Explain. Since D2O has practically the same properties as H2O, how would you test the presence of large quantities of the former in the victim’sbody.
Solution:
….the lower ground state vibrational energy level for bonds in which D is substituted in place of H means there is a higher activation energybarrier for disrupting these bonds. …..the rate of H+ ion exchange will then be faster than D+ exchange……therefore the dissociation constants for deuterated acids are smaller than that for acids with the normal H+ ion………this will affectthe acid-base balance in the body and can lead to death.
Run Mass Spec analysis on body fluid sample this will reveal presenceof heavier isotope of hydrogen.

9.11. Reactions in Solution
What is the major difference between gas phase reactions and reactions in solution ????
THE SOLVENT
…..in some cases solvent only has minor effect in other cases it has a profound effect. Why ?
GAS PHASE REACTION in SOLUTION

…..solvent creates a cage……known as the ”solvent cage” effect……..
• if two molecules collide in the gas phase and do not react theywill usually move away from each other……………and it is VERY UNLIKELY that this pair of molecules will collide again.
• when two molecules collide in solution …..they may not be able to move apart again quickly because they are surrounded by solventmolecules…………
…..these molecules are temporarily caught within a “solvent cage”(DON’T get the impression that this is an actual cage…..the solventmolecules are in constant motion but create a “cage effect”)

“Solvent Cage”
• cage effect causes molecules to remain together for a longer timethan if they were in the gas phase
• in solution molecules may collide with each other (i.e. the same pairof molecules) HUNDREDS of times before moving far apart.

It is important to note that there are many factors that influencethe energetics and rate of reactions occurring in solution……………..
For example, if the reaction involves reactants that are chargedmolecules than solvation of the ionic molecules has majorimpact on the magnitude and sign of S‡.
……..where charged molecules are involved the value of S‡ will depend on the charge of the activated complex relative to the charge of the reactants………….
(C2H5)3N + C2H5I (C2H5)4N+ I - S‡ = - 172 kJ
Co(NH3)5Br 2+ + OH- Co(NH3)4Br(OH)+ + NH3 S‡ = 83.7 kJ
……if the reactants carry less of a net charge than the activated complex than S‡ will be negative……………..

9.12 Oscillating Reactions
…..complex reactions …….that don’t follow “normal behavior”
……reactions where the concentration of reactants, intermediates,or products vary periodically in time……
……these oscillations (or variations in concentration) occur in thepresence of a feedback mechanism in which a PRODUCT increasesor decreases the reaction rate……
……the oscillations can be sustained ONLY if the reaction is heldfar from equilibrium…………this can be achieved by either supplyingreactants or removing products constantly from the reactionvessel …..
……several processes in a biological cell include oscillatory reactions….

Example…..
In the Glycolytic Cycle……….
enzymes catalyze the breakdown of glucose with production of ATP and NADH.
the enzyme, phosphofructokinase, is inhibited by high concentrations of ATP and activated by ADP.(phosphofructokinase is an enzyme of the glycolytic cycle)
in the early stages of glycolysis …..ATP levels are low and ADPlevels are high…..enzyme is very active and rate of production ofNADH is high…..
……as concentration of ATP rises (a product of glycolysis) the enzyme becomes inhibited and rate of production of NADH decreases…..
……eventually ATP levels falls again and enzyme is active………..
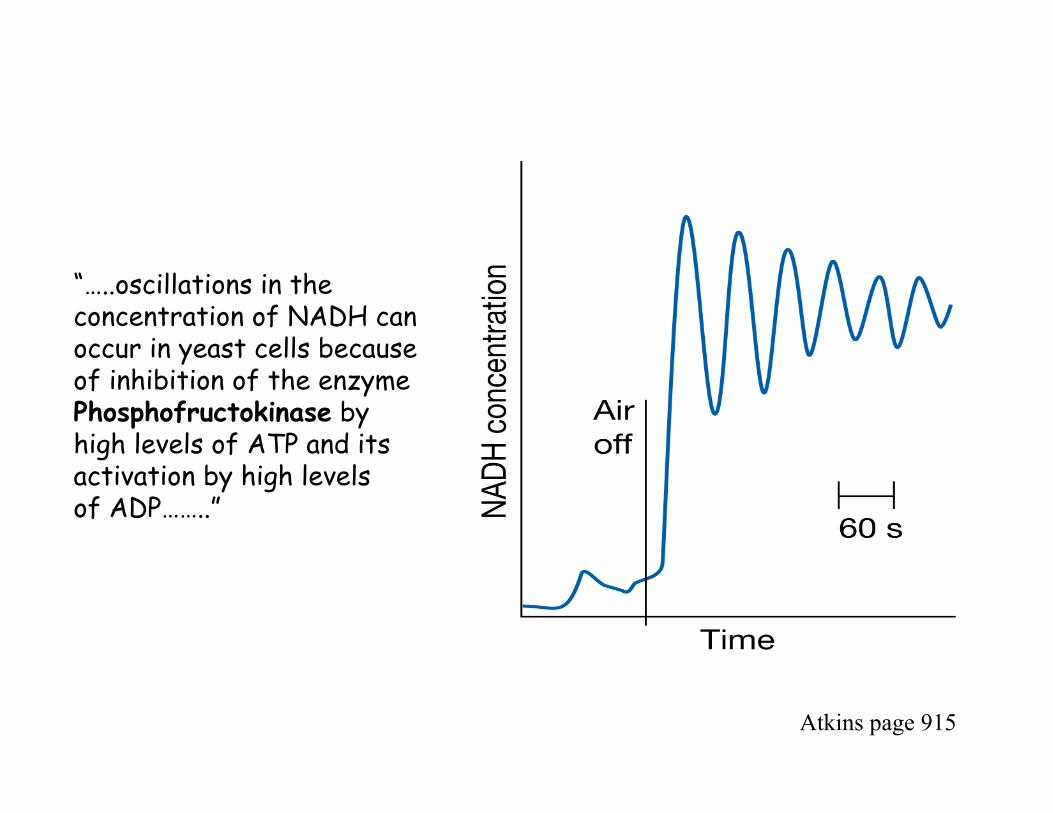
“…..oscillations in the concentration of NADH can occur in yeast cells because of inhibition of the enzymePhosphofructokinase by high levels of ATP and its activation by high levelsof ADP……..”
Atkins page 915
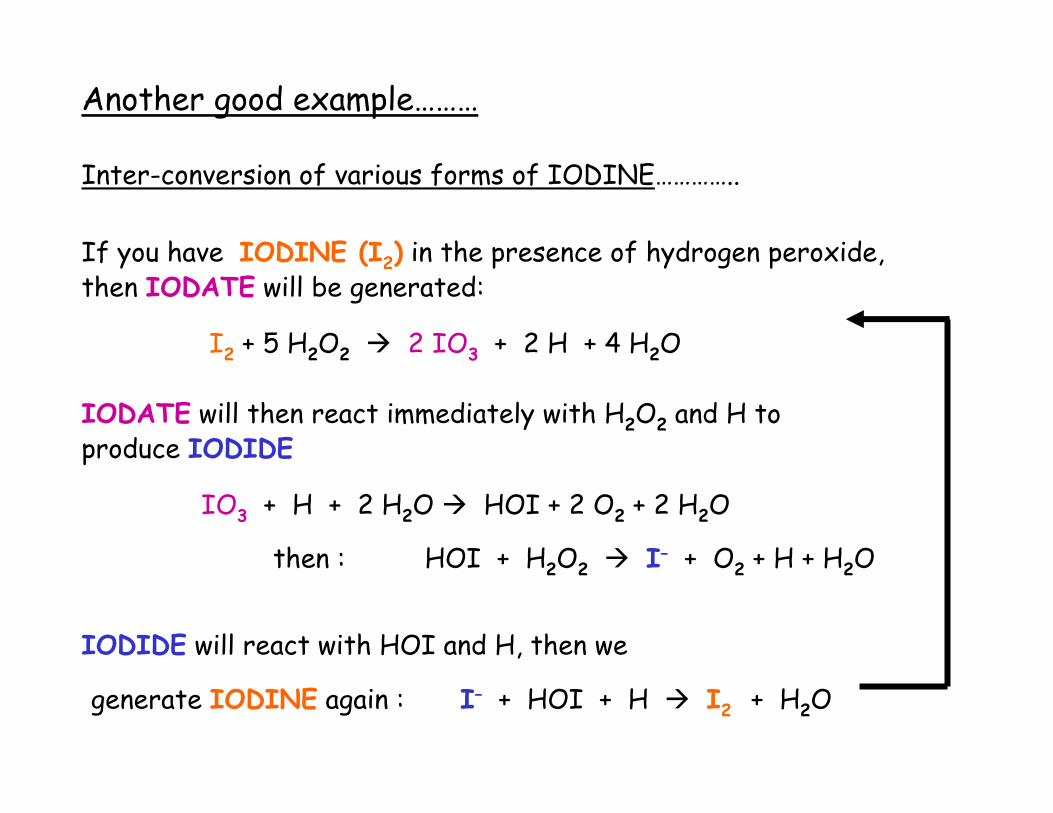
Another good example………
Inter-conversion of various forms of IODINE…………..
If you have IODINE (I2) in the presence of hydrogen peroxide, then IODATE will be generated:
I2 + 5 H2O2 2 IO3 + 2 H + 4 H2O
IODATE will then react immediately with H2O2 and H to produce IODIDE
IO3 + H + 2 H2O HOI + 2 O2 + 2 H2O
then : HOI + H2O2 I– + O2 + H + H2O
IODIDE will react with HOI and H, then we
generate IODINE again : I– + HOI + H I2 + H2O

Therefore the overall effect for the IODINE species
is an oscillation :
IODINE …………..then … IODATE …….then….. IODIDE
I2 IO3 I– I2 IO3 I– I2 IO3 I– . . .
Atkins page 916
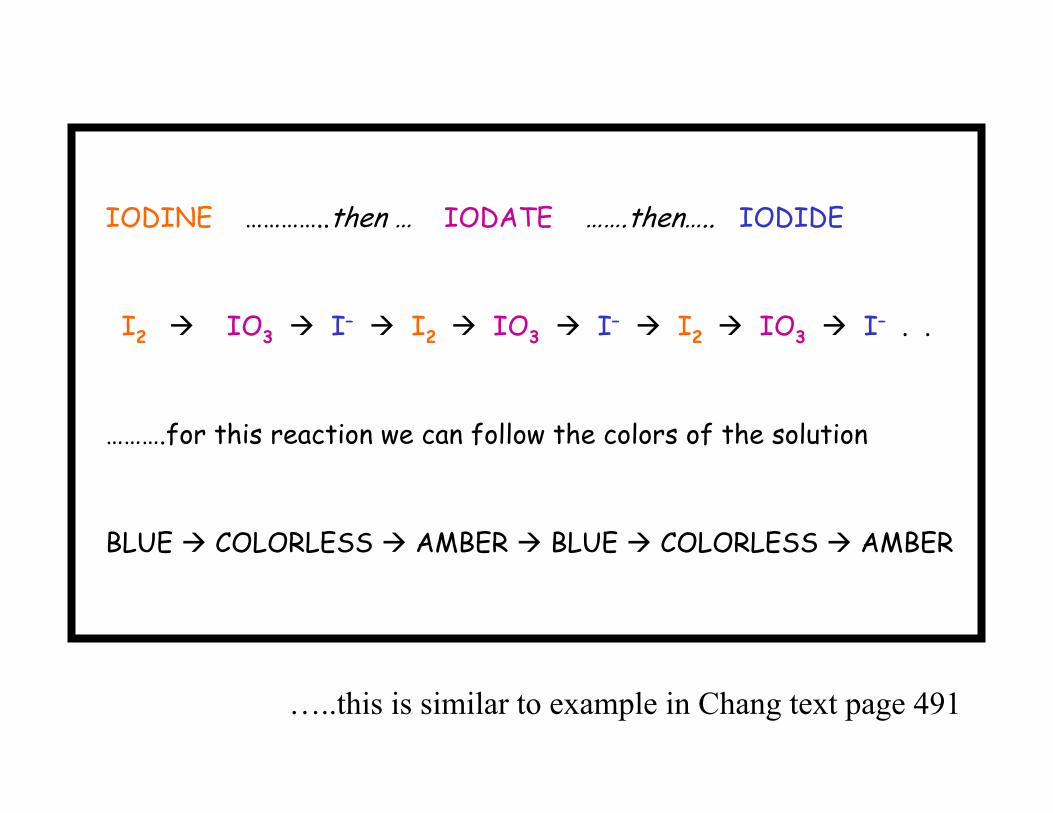
IODINE …………..then … IODATE …….then….. IODIDE
I2 IO3 I– I2 IO3 I– I2 IO3 I– . .
……….for this reaction we can follow the colors of the solution
BLUE COLORLESS AMBER BLUE COLORLESS AMBER
…..this is similar to example in Chang text page 491
Autocatalysis
…..autocatalysis is the catalysis of a reaction by the products.
• An example of autocatalysis is the Belousov-Zhabotinskii reaction(BZ reaction) (this is one of the first autocatalytic reactions to be studied and well-characterized)………..
• The BZ reaction occurs when: malonic acid [CH2(COOH)2] and sulfuric acid are dissolved in water with potassium bromate (KBrO3) and a cerium salt….
……mechanism of the BZ reaction involves 18 elementary stepsand 20 different chemical species………………..
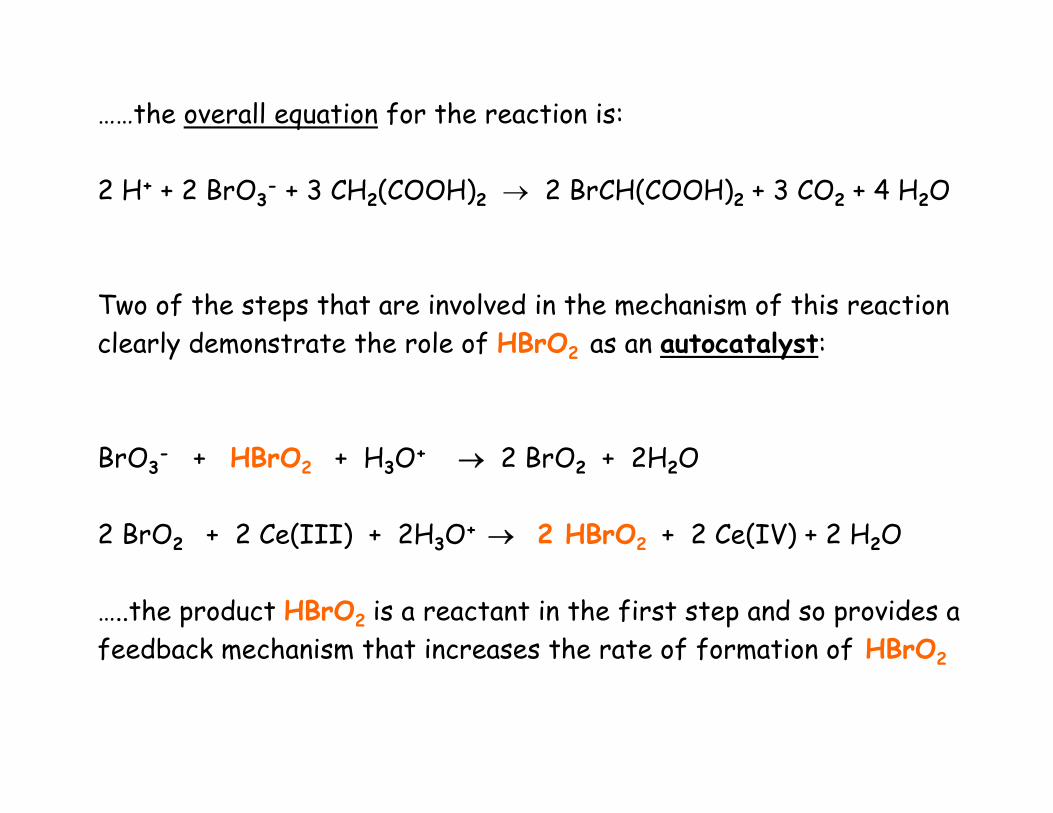
……the overall equation for the reaction is:
2 H+ + 2 BrO3- + 3 CH2(COOH)2 2 BrCH(COOH)2 + 3 CO2 + 4 H2O
Two of the steps that are involved in the mechanism of this reactionclearly demonstrate the role of HBrO2 as an autocatalyst:
BrO3- + HBrO2 + H3O+ 2 BrO2 + 2H2O
2 BrO2 + 2 Ce(III) + 2H3O+ 2 HBrO2 + 2 Ce(IV) + 2 H2O
…..the product HBrO2 is a reactant in the first step and so provides a feedback mechanism that increases the rate of formation of HBrO2

…..during the reaction the concentration of Ce 4 + and Ce 3+ changes(i.e. oscillates) as does the concentration of Br - ………
page 491 in Chang Text

Another Example: The Lotka – Volterra Mechanism
(a) A + X X + X d[A]/ dt = - ka [A][X]
(b) X + Y Y + Y d[X]/dt = - kb [X][Y]
(a) Y B d[B]/dt = kc [Y]
- steps (a) and (b) are autocatalytic
- concentration of A is held constant by supplying it to reaction vessel as it becomes depleted…..
Periodic Variation of X and Y

• at some stage there may onlybe a little X ….rxn (a) then producesmore X and production of X autocatalyzes reaction to produceeven more X…..
……..results in surge of X
• once X is formed reaction (b) canproduce Y, occurs slowly initially but autocatalysis leads to surge in Y.
Surge in Y removes X, rxn (a) slowsdown and then produces less X which slows down reaction (b) ………and cycle repeats itself !!

A Final Example: “The Brusselator”
A X d[X] /dt = ka [A]
B + X Y + C d[Y]/dt = kb [B] [X]
X + X + Y X + X + X d[Y]/dt = - kc [X]2[Y]
X D d[X]/dt = - kd [X]
……the reactants A and B are maintained at constant concns. so the variables are the concentrations of X and Y.

• interesting feature of this reactionis that no matter what the initialconcentration of X and Y the system will settle down into the same “ periodic variation of concentrations”
• common trajectory that the systemmigrates to is called a limit cycle
• a limit cycle is something thatmathematicians refer to as anattractor because it attractstrajectories in close proximity
Taken from Atkins Text page 917

CHEMICAL CHAOSCHEMICAL CHAOS
……for some reactions we CANNOT predict for some reactions we CANNOT predict the composition of the the composition of the system from its original system from its original compositioncomposition…………..
…….concentrations burst into .concentrations burst into CHAOTIC oscillationCHAOTIC oscillation…………………………
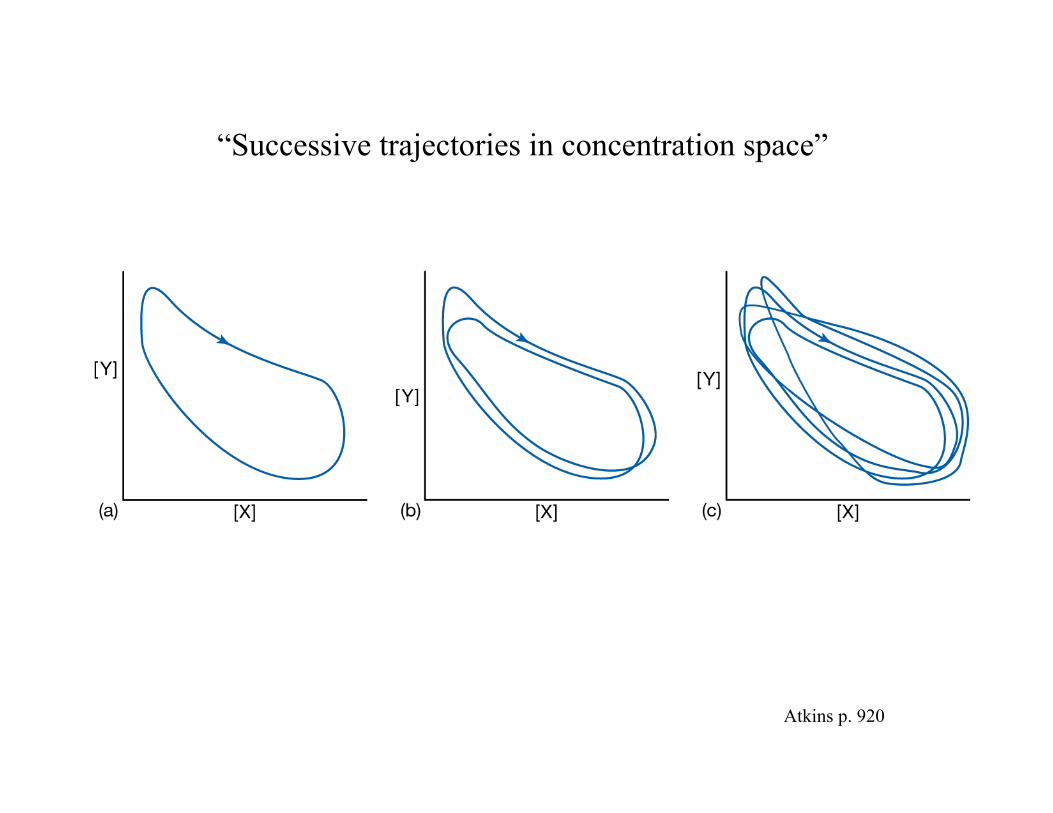
“Successive trajectories in concentration space”
Atkins p. 920

….in some cases the trajectory of the composition of the system may take a paththat NEVER RETRACESitself over time……
……this path is calleda strange attractor.
Atkins page 920