Embed Size (px)
Citation preview

164
© Proshutinsky A.Yu., Toole J.M., Krishfield R.A., Anderson D.M., Ashjian C.J., Baggeroer A.B., Freitag L.E., Pickart R.S., and von der Heydt K., 2020, Journal of Oceanological Research, 2020, Vol. 48, No. 3, P. 164–198
UDK 551.467 DOI: 10.29006/1564-2291.JOR-2020.48(3).10
90 years of arctic ocean exploration at the Woods hole oceanographic institution
proshutinsky a.yu.1, toole J.M.1, Krishfield r.a.1, anderson d.M.1, ashjian c.J.1, Baggeroer a.B.1,2, freitag l.e.1, pickart r.s.1, von der heydt K.1
1Woods Hole Oceanographic Institution, Woods Hole, MA 02543, USA, e-mail: [email protected]
2Massachussetts Institute of Technology, Cambridge, MA 02139, USA, e-mail: [email protected] Submitted 30.08.2020, accepted 28.10.2020.
In 2020, the Woods Hole Oceanographic Institution (WHOI) celebrates 90 years of research, education, and exploration of the World Ocean. Since inception this has included Arctic studies. In fact, WHOI’s first technical report is on the oceanographic data obtained during the submarine “Nautilus” polar expedition in 1931. In 1951 and 1952, WHOI scientists supervised the collection of hydrographic data during the U.S. Navy SkiJump I & II expeditions utilizing ski-equipped aircraft landings in the Beaufort Sea, and inferred the Beaufort Gyre circulation cell and existence of a mid-Arctic ridge. Later classified studies, particularly concerning under-ice acoustics, were conducted by WHOI personnel from Navy and Air Force ice camps. With the advent of simple satellite communications and positioning, WHOI oceanographers began to deploy buoys on sea ice to obtain surface atmosphere, ice, and upper ocean time series data in the central Arctic beginning in 1987. Observations from these first systems were limited technologically to discrete depths and constrained by power considerations, satellite throughput, as well as high costs. As technologies improved, WHOI developed the drifting Ice-Tethered Profiler (ITP) to obtain vertically continuous upper ocean data several times per day in the ice-covered basins and telemeter the data back in near real time to the lab. Since the 1980s, WHOI scientists have also been involved in geological, biological, ecological and geochemical studies of Arctic waters, typically from expeditions utilizing icebreaking vessels, or air supported drifting platforms. Since the 2000s, WHOI has maintained oceanographic moorings on the Beaufort Shelf and in the deep Canada Basin, the latter an element of the Beaufort Gyre Observing System (BGOS). BGOS maintains oceanographic moorings via icebreaker, and conducts annual hydrographic and geochemical surveys each summer to document the Beaufort Gyre freshwater reservoir that has changed significantly since earlier investigations from the 1950s–1980s. With the experience and results demonstrated over the past decades for furthering Arctic research, WHOI scientists are well positioned to continue to explore and study the polar oceans in the decades ahead.
Keywords: history, Arctic Ocean, methods of observations, instrumentation, acoustics, oceanography, sea ice, biology, geology, geochemistry

165
Journal of Oceanological Research. 2020. Vol. 48. No. 3. P. 164–198
introduction
The Woods Hole Oceanographic Institution
The WHOI is an independent non-profit research and education organization with funding from government grants and contracts, private donations, and industry contracts. The idea to organize WHOI was born in the 1920s based on several meetings between Frank R. Lillie (who later served as the director of Marine Biological Laboratory located in Woods Hole village) and Wickliffe Rose (later president of the Rockefeller Foundation’s General Education Board). In 1927, a National Academy of Sciences Committee on Oceanography was established. The committee, chaired by Lillie, recommended that oceanographic activ-ities on the U.S. West Coast be strengthened and that a well-equipped oceanographic insti-tution be established on the East Coast able to investigate various aspects of ocean physics, biology and geology using state-of-the-art instrumentation and methods of ocean research. Numerous discussions and correspondences among scientists involved in the institutional planning resulted in the pioneering vision of an oceanographic research discipline involving experts in many ocean-related fields working together on questions relating to the global ocean as a whole. This approach, after 90 years of work, is still supported by WHOI scien-tists, maintaining the Institution’s leading position in world ocean studies.
The Institution’s current annual operating budget is approximately $215 million U.S. dollars. Areas of active research span a wide range of topics related to ocean and earth science and marine policy, including interdisciplinary work involving the coastal ocean, ocean life, ocean exploration, and climate change. Approximately 1000 employees, including more than 500 scientists, engineers, ship’s crew, and technicians, work within six scientific departments and more than 40 centers and laboratories. WHOI operates the Global Class R/V “Atlantis”, Ocean Class R/V “Neil Armstrong”, coastal vessel “Tioga”, and several small boats. There is a fleet of underwater vehicles such as the human-occu-pied submersible “Alvin”; remotely operated vehicles (ROVs) such as ROV “Jason/Me-dea”; autonomous underwater vehicles (AUVs) including AUV “Sentry” and various REMUS vehicles, and towed sensor systems. Several U.S. National Facilities are based at WHOI such as the National Deep Submergence Facility (NDSF); National Ocean Sciences Accelerated Mass Spectrometer (NOSAMS); and the Northeast National Ion Microprobe Facility (NENIMF). Detailed information about WHOI research, exploration and educa-tion may be found at the WHOI websites www.whoi.edu, https://www.whoi.edu/who-we-are/about-us/history-legacy/, https://www.whoi.edu/multimedia/v-history-of-whoi-ships/ and many others.
Motivation for Arctic Research
Internationally, prior to the 1950s, expeditions to the Arctic that included scientific observations were mostly limited to surface vessels. Exceptions include one submarine visit in 1931 (that only operated amongst the ice floes at the surface, see more informa-

166
Proshutinsky A.Yu. et al.
tion below), one Soviet drifting ice camp with 4 participants led by Ivan Papanin in 1937 (e.g. Shirshov and Fedorov, 1938; Popov et al., 2019; also more information is available at https://www.whoi.edu/page.do?pid=66677), and some airship expeditions (e.g. Arm-strong, 1958).
In the post-war era when true icebreaker vessels were constructed, submarines learned how to operate under the ice, aircraft were developed that could traverse great distances, and military considerations made resources and logistics available for Arctic research. In the 1990s, the joint Environmental Working Group of USA and Russia investigators consolidated available hydrographic observations from both Soviet and US sources into an atlas spanning the 1950s to 1990s at decadal resolution (Timokhov and Tanis, 1997). This synthesis suggested that the Arctic environment was basically unchanging (as might be expected due to the existence of a solid sea ice cover and rel-atively shallow entrances to the Arctic basins). Satellite observations beginning in the late 1970s showed that the extent of Arctic ice was decreasing over time changed that view.
In recent decades, observational data show that the Arctic Ocean has been undergo-ing significant and rapid change, likely in part as a consequence of global warming. Air and seawater temperatures are increasing, sea ice is melting and its volume and extent are declining, permafrost is thawing, storminess is increasing, sea level is rising, coastal erosion is accelerating, and biological processes are becoming more complex and diverse (e.g. Proshutinsky et al., 2015). Better understanding of the Arctic Ocean circulation and
Fig. 1. Evolution of WHOI Arctic research. The figure gives examples of historical and ongoing WHOI exploration, science, instrumentation and observational activities. Historical time (x-axis) is displayed nonlinearly, with time (and activity) advancing from left to right.
Horizontal arrows of different colors indicate period and duration of expeditions or projects. Most of these activities are discussed in the text.

167
Journal of Oceanological Research. 2020. Vol. 48. No. 3. P. 164–198
its changes under global warming is also needed to predict changes in the Atlantic Meri-dional Overturning Circulation as a part of the global conveyer belt. Beyond Arctic en-vironmental change, there have also been immense socio-economic impacts, not only on Arctic residents but also on the rest of the world associated with issues such as oil and gas exploration and extraction, trade, navigation, tourism, food security, military operations, and industrial pursuits. Such rapid changes in the Arctic environment are unprecedented in the observational record.
The manifestations of climate change are arguably more evident in the Arctic than anywhere else on Earth, and it is becoming clear that its continuation may have catastrophic effect not only for the Arctic region but also for the rest of the globe. Thus, developing understanding of the causes and consequences of Arctic climate change is critically important for assessing global climate-related impacts. The pronounced cli-matic signals at high latitudes provide an exceptional opportunity to document these changes, analyze the underlying processes and consequences of such variability, and ultimately understand the mechanisms driving climate that will allow for more accurate climate prediction. In this situation, the long-term observations such as data sets col-lected by WHOI scientists provide valuable information to help to solve the problems outlined above.
early expeditions
Submarines and airships
WHOI’s involvement in Arctic Ocean studies began shortly after the foundation of the Institution in 1930 when Sir Hubert Wilkins (https://en.wikipedia.org/wiki/Hubert_Wilkins) acquired the surplus U.S. Navy submarine O-12 (Fig. 1). The vessel was re-named “Nautilus”, outfitted for research, and prepared for an audacious undersea expedi-tion whose goal was to reach the North Pole. The leader of the scientific staff was Harald Ulrik Sverdrup (https://en.wikipedia.org/wiki/Harald_Sverdrup_(oceanographer)), who planned to make magnetic, hydrographic (ocean depth), oceanographic (water temper-ature and salinity at standard levels, and biological sampling) and meteorological obser-vations from a specifically rigged diving compartment (see Sverdrup and Soule, 1933 for details). After a perilous transatlantic passage, the submarine was directed into the pack ice north of Spitsbergen in August 1931. Damage to the vessel’s diving plane scuttled the original plan of sailing to the Pole and relegated “Nautilus” to making oceanographic observations in and around the marginal ice zone outside of the full pack. However, the several short runs “Nautilus” made under ice proved that submarines could feasibility operate in and under the ice pack. The first scientific report with data from this expedition was published as WHOI contribution #1 by Sverdrup and Soule (1933) and formed the basis of the first WHOI contribution to Arctic studies.
Another early contribution to Arctic studies having WHOI participation and closely related to the “Nautilus” expedition was the 1931 polar flight of the airship “Graf

168
Proshutinsky A.Yu. et al.
Zeppelin” (video about this flight: https://www.youtube.com/watch?v=oVP2pZX2yGo). In July, 1931, the airship carried a team of scientists from Germany, the United States, the Soviet Union, and Sweden on an exploration of the Arctic, making meteorological observations, measuring variations in the earth’s magnetic field and making a photographic survey of unmapped regions using a panoramic camera that automatically took several pictures per minute. The original plan was to fly from Spitzbergen to Fairbanks, Alaska, and during the return, pass over the North Pole where a rendezvous with submarine “Nautilus” was scheduled. However, the plans changed due to the “Nautilus” mechanical problems noted earlier and a shorter flight was made from Leningrad over the Kara Sea during the week of 24 July to 1 August 1931. The five-stage flight covered 13,310 kilometers. Information obtained during the flight literally changed the map of the Arctic region. Edward Hanson “Iceberg” Smith, one of two Americans aboard this flight, had been recommended by Harvard University, the American Geographic Society and the National Academy of Sciences. Later from 1950 to 1956, Smith served as WHOI director (for whom the Institution’s Smith Laboratory is named).
Aircraft landings on sea ice
Airborne methods of Arctic Ocean mapping were continued by WHOI investigators in 1951 and 1952 through Operation “SkiJump 1 and 2”.
These expeditions were an outgrowth the plans of the U.S. Office of Naval Re-search to investigate the water properties of the Arctic Ocean. In 1951, a single DC-3 airplane (designated by the U.S. Navy as the R4D) fitted with a ski-wheel combina-tion and equipped as a flying laboratory made twelve landings on sea ice floes in the Beaufort Gyre region (Fig. 2a). The scientific team included W.V. Kielhorn, of the Office of Naval Research, and WHOI’s John Holmes and L. Valentine Worthington. During the spring of 1951, the study area was limited by the range of the DC-3 air-plane and only 3 oceanographic sampling stations were occupied. In 1952, two Navy P-2V (flying tankers) airplanes were added to the DC-3. As the P-2V planes were ca-pable of landing on the ice and refueling the DC-3, the oceanographic surveys could be extended much farther from the expedition’s land base at Point Barrow (Alaska, Fig. 2a) than in 1951. Hydrographic stations were made through holes drilled in the ice at some of these landing sites using a light-weight winch mounted in the DC-3 aircraft. Video report about this expedition is available at https://www.youtube.com/watch?v=y06yMRy_oJk.
On the basis of these oceanographic station data, Worthington (1953) inferred the existence of an anticyclonic ocean gyre in the Canada Basin North of Alaska (Fig. 2a), and a submarine ridge separating the deepest waters of the Eurasian side of the Arctic Ocean from those of the Canadian-Alaskan sector (not shown). Both these features were subsequently confirmed and the Lomonosov Ridge was later described in detail in the Soviet literature.
169
Journal of Oceanological Research. 2020. Vol. 48. No. 3. P. 164–198
later xxth century observations
Drifting ice stations (acoustics)
The motivation for arctic studies from drifting ice stations in the 1970s and 1980s was mostly driven by U.S. Navy interests in acoustic methods to detect under ice sub-marine activity. Today, acoustic research and its applications have largely shifted to envi-ronmental monitoring. Some results from fifteen years of Arctic acoustic investigations (1978–1993, see Fig. 1 and Fig. 3a with names of field experiments) conducted by WHOI in collaboration with other institutions were summarized by Keith von der Heydt and Arthur Baggeroer in 1994. Since 1978, seven acoustic experiments have been conducted from ice camps and two from ships moored to ice floes (Fig. 3a). According to von der
Fig. 2. (a) – Locations of landings with oceanographic observations conducted during 1951 and 1952 by the SKIJUMP expeditions (yellow circles; Modified after Worthington, 1953).
Arrows show an anticyclonic circulation (Beaufort Gyre) discovered by Worthington (1953). (b) – Climatological (1950–1980) water salinity at 50 m from the Arctic Climatology Project (Timokhov and Tanis, 1997). There is a salinity minimum in the center of the Beaufort Gyre (region bounded by thick red line); (from Proshutinsky et al., 2009a). (c) – Schematics of the surface water circulation of the Arctic Ocean with Beaufort Gyre centered over the Canada
Basin. (d) – Freshwater content in the Arctic Ocean. Colors show freshwater content (meters) based on climatological water salinity data. Solid lines are contours of climatological mean sea
level pressure (dbar) and arrows depict direction and relative intensity of surface winds.

170
Proshutinsky A.Yu. et al.
Heydt and Baggeroer (1994), these projects focused on investigation of basin reverbera-tion, long-range acoustic propagation, ambient noise, tectonic structure of sea floor, and sea ice dynamics at the edge of the ice marginal zone. Below, following information pro-vided by von der Heydt and Baggeroer (1994), we briefly describe these experiments and some important WHOI accomplishments from these studies.
The principal goal of Canada Basin acoustic reverberation experiment (CAN-BARX, 1978) and the 1980 and 1982 Fram experiments (Fig. 3a; see also details in Dyer and Baggeroer, 1980; Baggeroer and Dyer, 1982) was to improve understanding of fundamental acoustic issues through use of modern research tools such as arrays of hydrophones; wide-dynamic-range, multi-channel, data-acquisition systems; and new processing methods. During those three expeditions backscatter, or reverberation, was observed to persist for half an hour at low frequencies with some of the sound traveling across the entire Arctic Ocean.
They were able to determine a rough image the Russian continental slope almost 3000 km, or 4000 seconds two-way travel time, across the Arctic from the CANBARX ice station in the Beaufort Sea. To generate the acoustic signals, 400 kgs of explosives left over from WWII were used. (One cannot do this now because of our concerns for marine mammals.) The acoustic propagation for signal coherence and multipath was ex-amined. Several seismic refraction measurements for the structure of the arctic seafloor were conducted and the subsequent analyses have shown that wind- and ocean-influenced internal ice stresses resulting in ice motion and fracturing were the primary sources of ambient noise.
The CANBARX and subsequent FRAM experiments brought digital recording to the Arctic when von der Heydt and Prada introduced multichannel, gain ranging and time synchronized data acquisition. These first system could record 24 channels of data with a 160 dB dynamic range and 250 Hz sampling frequency. This was the start of an evolution of systems with the advances in electronics to over 50 channels with a 1 kHz sampling frequency which was a revolutionary advance for low frequency acoustics in both the Arctic and shipboard acquisition systems. The original system required crates of 9 track tapes; now the data all fit on terabyte-capacity solid state drives which can be carried in a brief case.
The seismic refraction observations indicated a crustal structure with approximately 4.3 km of sediment overlying an oceanic basement and a 9.8–10.7 km depth beneath the seafloor to the Moho. The CANBARX data from the Canada Basin indicated an unusual oceanic basement in which layer 3 is either exceptionally thin or absent. After correcting for sediment loading and crustal radioactivity an age for these sediments of between 90 and 130 m.y. B.P. was suggested. This range is consistent with recent magnetic studies and heat flow data.
Two of the four experiments in the FRAM series were devoted to acoustical studies in which WHOI and MIT led the field activities. These were large programs which stud-ied many aspects of acoustics including reverberation, seismic refraction and reflection, long range transmissions, ambient noise and ice mechanics. (Baggeroer and Dyer, 1982).
171
Journal of Oceanological Research. 2020. Vol. 48. No. 3. P. 164–198
As part of the Fram II and Fram IV experiments, the first seismic refraction measure-ments for the Fram and Nansen Basins in Eurasian Arctic were obtained (Duckworth et al., 1982) and (Duckworth and Baggeoer, 1985). These were the first measurements which estimated the sediment and the layer 2 and layer 3 thicknesses down to the Moho. Resulting age estimates, correlated using magnetic anomalies put them at approximately 35 and 22 MY BP. The Fram experiments (Johnson, 1983; Fig. 3a) showed that acoustic measurements alone were inadequate for explaining responses of the acoustic environ-ment to atmospheric and oceanographic forcing. A multidisciplinary sampling strategy that integrated oceanographic, meteorological, and acoustic measurements was needed.
In this sense, the Marginal Ice Zone Experiments (MIZEX, see Fig. 3a for geo-graphic locations; see Horn and Johnson, 1986) of 1983 and 1984 were designed to con-struct a coherent view of the relationship between various energy fluxes at the ice edge. The focus was large-scale, involving multi-ship sampling of short-lived (days to weeks), 10- to 50-kilometer eddies that form where the ice pack meets open water in the summer months. The acoustically tracked hydrophone array proved difficult to maintain as re-searches struggled to find, recover, and redeploy sensors before they moved out of range, all the while recording data. Despite the difficulties, an understanding of ambient noise and sound propagation fluctuations at the ice edge were developed.
After testing new techniques and instrumentation during the 1987 Prudhoe Bay Ex-periment (PRUDEX), the 1989 Coordinated East Arctic Experiment (CEAREX; Pritchard et al., 1990) north of Fram Strait (between Greenland and Spitsbergen) was mounted. CEAREX involved a coordination of ship and ice-camp sampling strategies. It was one
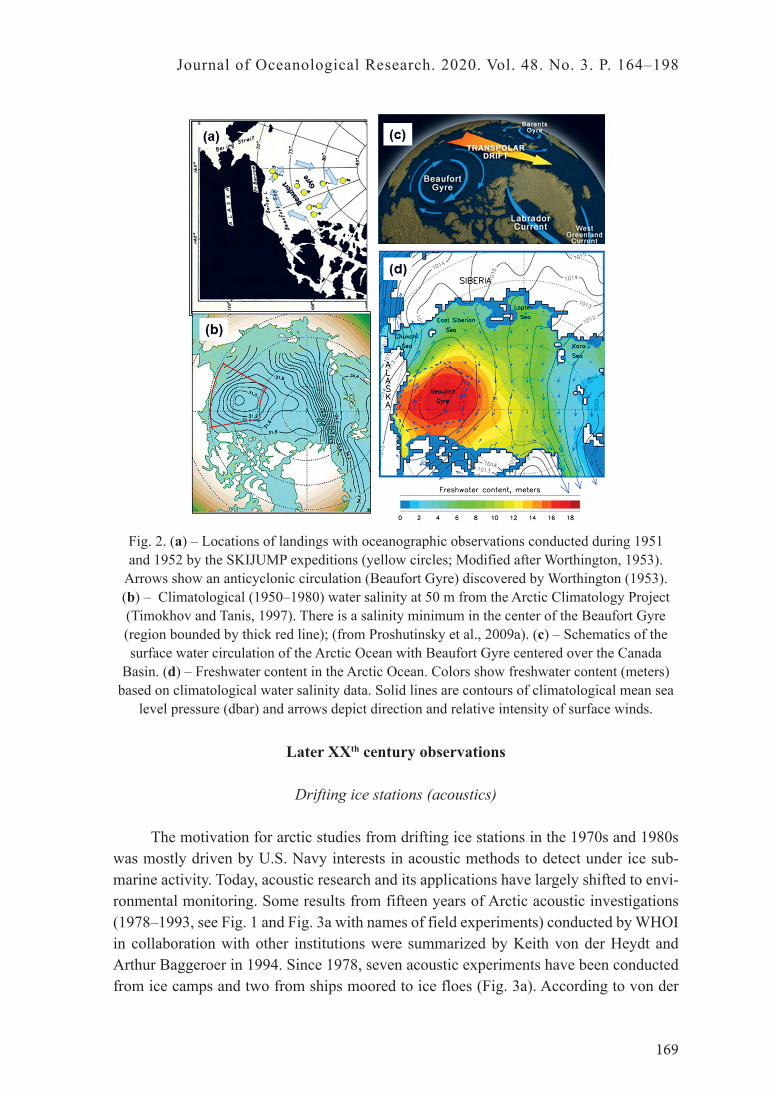
Fig. 3. (a) – Geography of expeditions with acoustic experiments (modified after von der Heydt and Baggeroer, 1994). (b) – Positions of moorings of the most recent experiments
CANAPE (2017–2018) and CAAREX (2019–present. Locations of moorings of the most recent experiments CANAPE (2016–2017, yellow pentagon) and CAATEX (2019–present, moorings
are shown by circles). Courtesy of Matthew Dzieciuch (Scripps Oceanographic Institution) and Hanna Sagen (Nansen Polar Center, Bergen, Norway).

172
Proshutinsky A.Yu. et al.
of the few occasions up to that date when environmental parameters, including the am-bient acoustics, were sampled during the winter months from a ship drifting with the ice pack. At the spring ice camp, designated “A”, there were two main objectives. The first, undertaken as “A” camp drifted southward toward the ice edge, was to monitor the effect of changing oceanography on acoustic propagation using low-frequency signals received from a second ice camp, designated “O” about 100 kilometers to the northeast. The sec-ond objective was to simultaneously monitor the ambient noise field and meteorological and oceanographic parameters in a 100-kilometer square area using portable buoy sys-tems transported by helicopter. Unfortunately, the collected data was limited because “A” camp had to be evacuated prematurely when it drifted through the Fram Strait to within 30 kilometers of the open North Atlantic.
The 1994 Sea Ice Mechanics Initiative (SIMI) consisted of back-to-back field pro-grams in the Beaufort Sea, intended to gather data during the very much under-sampled winter months. SIMI’s focus was ice-mechanical processes including the evolution of processes that lead to catastrophic events such as ridging and rafting over scales of mil-limeters to kilometers. A horizontal hydrophone array was used to locate ice events and maintain an inventory of event statistics (Miller and Schmidt, 1991; Dudko et al., 1998).
As part of a joint effort between U.S. investigators and the Russian Shirshov Institute of Oceanology, the TransArctic Acoustic Propagation experiment (TAP) was conducted in 1994 involving an ice camp established on the Yermak Plateau, 2600 km distant from the SIMI camp north of Prudhoe Bay. The purpose of this experiment was to determine the feasibility of monitoring temperature changes in Arctic Basin using Ocean Acoustic Thermometry. The effort was led by Peter Mikhalevsky of SAIC (now LEIDOS) and Alexander Gavrilov (now at Curtin University, Australia). A specially-designed Russian acoustic source roughly 3 meters wide transmitted signals with 195 dB source level at the very low frequency of 19.6 Hz, chosen to optimize the tradeoffs between amplitude loss from the overlying ice cover, available bandwidth for travel time measurements and physical size of the source. Both narrowband signals for measuring acoustic stability and coherence and broadband signals for travel time measurements were utilized. The narrowband signals led to estimates of the relative distances between the two camps to less than 10 meters while the broadband ones using synchronized time bases from GPS permitted the inversion of modal dispersion data from which a tomographic signal was determined. By exploiting the selective transmission loss from the Lomonosov Ridge the conclusion was the Atlantic mid water in the eastern Arctic had warmed approximately 0.5°C when compared to Russian CTD data taken in the 1970’s. This estimate was later confirmed by the SCICEX submarine program where a continuous profile across the Arc-tic was obtained from US submarine transits. The excellent data received by the acoustic sensors demonstrated that acoustic thermometry can be used to collect year‐round data in the Arctic Ocean. The oceanographic structure of the Arctic and the depth distribution of the acoustic modes make the Arctic especially suitable for acoustic thermometry. In fact, acoustic thermometry has many advantages for collecting climate data in the Arctic over satellite, icebreaker, or submarine. Long-term observations of the changes in acoustic
173
Journal of Oceanological Research. 2020. Vol. 48. No. 3. P. 164–198
phase, travel time, and amplitude of many transarctic paths could provide synoptic meas-urements of Arctic Ocean temperature and sea ice properties. The chief complications to implementation include the size, power requirement and cost of the acoustic transmitters required for transarctic signal propagation and protections for marine mammals (see Von der Heydt K. and Baggeroer, 1994 for details).
Drifting ice stations (biology)
Ice station SHEBA that drifted from Canadian Basin over the Northwind Ridge and Chukchi Plateau and back over the Basin from October 1997 to October 1998 in the Western Arctic Ocean was the platform for a yearlong WHOI zooplankton studies. Four hydrographic regimes, containing different population life stage structures of the target species, were encountered. Expatriate Pacific species were observed in Pacific Water that had advected over the Northwind Ridge. Annual variations in zooplankton biomass and the abundance, vertical distribution, life stage proportions, and body size and condition for five target copepod species (Calanus glacialis, C. hyperboreus, Metridia longa, Mi-crocalanus pygmaeus, Oithona similis) were found to follow a strongly seasonal cycle (Ashjian et al., 2003). Zooplankton biomass was greatest over the Chukchi Plateau dur-ing summer and lowest over the basin during the fall and winter. Highest biomass was seen in the upper 200 m during the summer productive season but in the 200–1500 m depth interval for the rest of the year due to ontongentic downwards migration of large bodied copepods. The target copepod species followed two general life history strategies: (1) sustained reproduction with all life stages present throughout the year and constant depth distribution (M. longa, M. pygmaeus, O. similis) and (2) pulsed reproduction with overlapping cohorts present and ontogenetic redistribution of preferred depths through the year (C. glacialis, C. hyperboreus). Based on population age structure, both C. hyper-boreus and C. glacialis were reproducing in the Arctic Ocean. However, extremely low abundances of C. glacialis suggested that this species may not be self-sustaining in the Arctic Ocean. Plankton biomass was greater than that historically observed in the region, suggesting that the Arctic Ocean is more productive Arctic Ocean than traditionally be-lieved.
The Multidisciplinary drifting Observatory for the Study of Arctic Climate (MO-SAiC) expedition is a more recent example of WHOI’s biological and ecosystem studies in the central Arctic. The MOSAiC expedition is an international, multidisciplinary year-long study of the annual evolution of the coupled physical-biological-chemical systems of the Arctic Ocean. International teams focusing on atmosphere, sea ice, ocean physics, biogeochemistry, and the ecosystem worked collaboratively from R/V “Polarstern” that was frozen into the ice from October 2019–September 2020. WHOI biology work fo-cused on annual cycles in zooplankton abundances, vertical distributions, and grazing, reproduction, and respiration rates, offering the opportunity to contrast biological con-ditions observed during the 1997–1998 SHEBA expedition in the Canada Basin of the Arctic Ocean with the current conditions in the Eastern Arctic.

174
Proshutinsky A.Yu. et al.
Automated buoys
In the 1980s, it was becoming clear that Arctic observing approaches had to be flexible and transformative, taking into account the continually changing climate. The traditional approach of acquiring Arctic observations from research vessels in the regions without ice in summer and from crewed icebreakers, airplanes and ice drifting stations had to be augmented with multi-faceted measurement systems operating autonomously to provide year-round information in real time. Addressing this need, WHOI researchers started developing ice-tethered buoys ranging from devices with relatively simple ob-serving capabilities to complex multifunctional autonomously drifting and observing sys-tems. The major idea was to develop an efficient network of autonomous Arctic observing systems measuring year-round environmental, biological, geo-chemical and ecosystem parameters in the ocean, ice, and atmosphere and transferring observations in real time to data centers via satellites.
An early prototype of one of the complex systems was the Arctic Environmental Drifting Buoy (AEDB) deployed in 1987 from icebreaker “Polarstern” (Fig. 4). The AEDB consisted of a surface float housing transmitters and data logger, and a 125 m long mooring line attached to the float and fed through a 1 m diameter ice hole. Along the mooring line were deployed 2 fluorometers, conductivity and temperature loggers, an Acoustic Doppler Current Profiler (ADCP), a current meter, and a time-series sediment trap. After deployment, the AEDB proceeded southwesterly with the Transpolar Drift at an average speed of 15.3 km/day, with a maximum speed of 88.8 km/day. On 2 January 1988, the AEDB melted through its supporting ice floe and dropped into the water while passing through the Fram Strait. For the remaining drift period the AEDB was either free-floating on the water surface or submerged underneath the sea ice. Throughout this period, the system successfully logged and transmitted (when surfaced) position, tem-perature, and strain caused by the ice on the sphere. Although the sediment trap package was lost during the drift, valuable data were collected by the other instruments throughout the deployment. The ice thermistor data were used to estimate vertical oceanic heat flux, while the continuous ADCP observations over the Yermak Plateau provided a wealth of
Fig. 4. Arctic Environmental Drifting Buoy (AEDB) deployment in 1987 (a) and recovery (b) in 1988 after 255 days of drifting.

175
Journal of Oceanological Research. 2020. Vol. 48. No. 3. P. 164–198
information about internal waves in the ice-covered ocean (Plueddemann et al., 1998). The buoy was recovered from the Icelandic ship R/V “Arni Fridriksson” off southeastern Greenland after completing a 3,900 km of drift in 255 days.
The success of this program with in situ observations being transmitted to WHOI laboratories in real time was subsequently used to improve this system and transform these technologies, leading to the 1991–1998 Ice-Ocean Environmental Buoy Program (IOEB). The autonomous buoy system contained meteorological sensors measuring air temperature, pressure, wind velocity, ice temperature, as well as ocean sensors on a sub-ice mooring system, including CT recorders, dissolved oxygen sensors, an Acoustic Dop-pler Current Profiler (ADCP), fluorometers, transmissometers, electromagnetic current meters, and a sediment trap (Krishfield et al., 1993; Fig. 5).
In all, the IOEB measured geophysical parameters (Fig. 6a) over a range extending from the lower atmosphere just above the ice surface down through the ice column and into the upper ocean, as deep as the bottom of the Arctic halocline. Most instruments and sensors sampled at hourly intervals, and were tracked by Argos satellites. Between 1992 and 1998, three buoy systems were deployed, recovered and re-deployed several times in multiyear pack ice in the Arctic Ocean (see Fig. 6b showing the buoy trajectories).
The processing scheme for the telemetered data, as well as the individual IOEBs and field operations, are described in detail by Krishfield et al. (1993, 1999). Scientific results of these observations were used to study the biogeochemistry of Arctic waters and Transpolar Drift (e.g. Honjo, 1995), eddies and internal waves (e.g. Krishfield et al., 2002; Plueddeman et al., 1998), and ocean mixing (e.g. Yang et al., 2004). For example, it was observed that mixing events reaching the depth of the halocline that occurred in various regions in the Arctic Ocean were mechanically forced by strong winds. Impor-tantly, it was also found that the buoy-observed mixing occurred only in the spring and winter when the stratification was relatively weak. This indicated that despite a very
Fig. 5. (a) – Schematic of Ice-Ocean-Environmental Buoy. (b) – Drift tracks for all IOEBs from April 1992 through November 1998. The dotted line shows the 2000 m isobath.
Modified from Yang et al. (2004).
176
Proshutinsky A.Yu. et al.
stable stratification associated with the Arctic halocline, the warm subsurface thermo-cline water is not always insulated from the mixed layer. Interestingly, during the peri-od 1992–1998, ninety-five probable IOEB-eddy encounters were identified during four deployments that included 44 months of buoy drift. The typical eddy encounter rate was 1 per 100 km of drift. The highest encounter rate was in the Canada Basin, but a signifi-cant number of eddies were also found to the west of the basin, over the Chukchi Plateau.
xxist century research
Drifting buoys
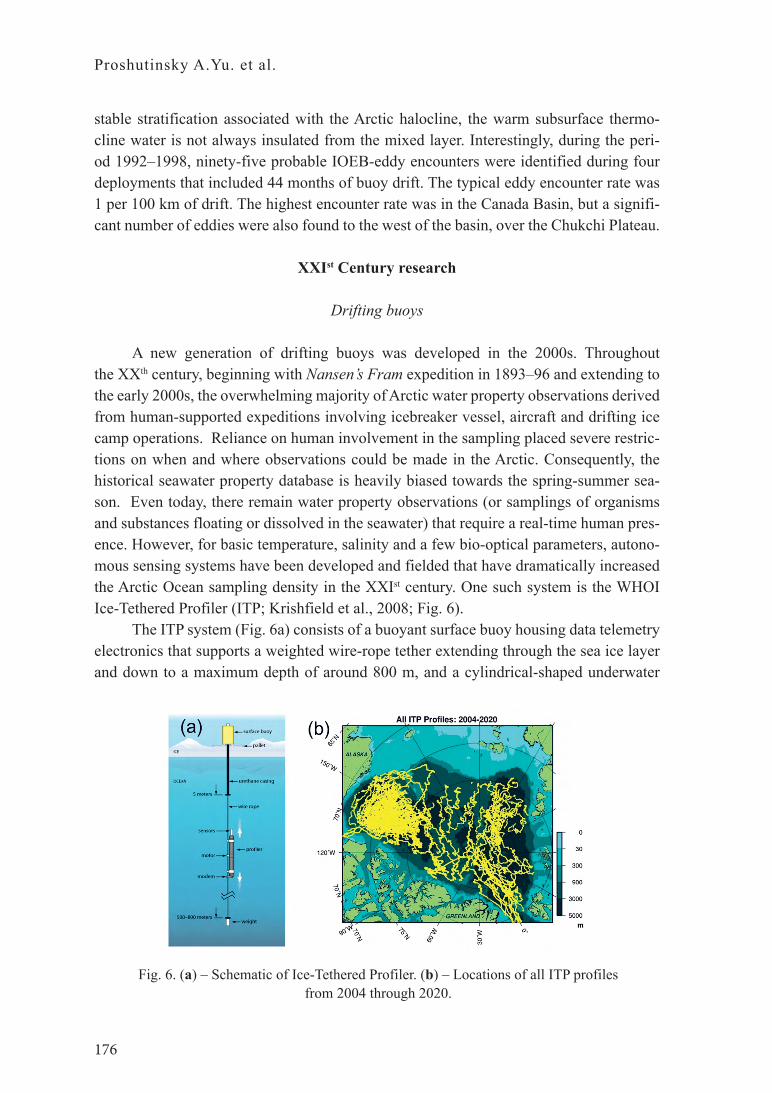
A new generation of drifting buoys was developed in the 2000s. Throughout the XXth century, beginning with Nansen’s Fram expedition in 1893–96 and extending to the early 2000s, the overwhelming majority of Arctic water property observations derived from human-supported expeditions involving icebreaker vessel, aircraft and drifting ice camp operations. Reliance on human involvement in the sampling placed severe restric-tions on when and where observations could be made in the Arctic. Consequently, the historical seawater property database is heavily biased towards the spring-summer sea-son. Even today, there remain water property observations (or samplings of organisms and substances floating or dissolved in the seawater) that require a real-time human pres-ence. However, for basic temperature, salinity and a few bio-optical parameters, autono-mous sensing systems have been developed and fielded that have dramatically increased the Arctic Ocean sampling density in the XXIst century. One such system is the WHOI Ice-Tethered Profiler (ITP; Krishfield et al., 2008; Fig. 6).
The ITP system (Fig. 6a) consists of a buoyant surface buoy housing data telemetry electronics that supports a weighted wire-rope tether extending through the sea ice layer and down to a maximum depth of around 800 m, and a cylindrical-shaped underwater
Fig. 6. (a) – Schematic of Ice-Tethered Profiler. (b) – Locations of all ITP profiles from 2004 through 2020.

177
Journal of Oceanological Research. 2020. Vol. 48. No. 3. P. 164–198
vehicle that employs a traction drive system to crawl up and down the wire transporting sensors through the water column. Battery capacity is sufficient to allow twice-daily one-way profiles over 750-m depth spans for over 1 year. (The sampling schedule is flexible and user adjustable during a mission.) The base ITP system includes a sensor measuring seawater temperature, conductivity and pressure, from which seawater salinity may be derived. While profiling, the sensor logs data at 1 Hz, which at a nominal profile speed of 0.25 m/s yields samples at 25-cm vertical resolution. The underwater data are relayed from the vehicle to the surface buoy over an inductive modem link; an Iridium satellite data telemetry system subsequently uploads the observations to WHOI data servers where automated routines format the data, perform preliminary processing and make the obser-vations available in near real time via ftp (see www.whoi.edu/itp) and over the Global Telecommunications System (GTS). Some ITP systems are augmented with additional sensors, either mounted on the profiling vehicle (e.g. Timmermans et al., 2010; Laney et al., 2013; Cole et al., 2015) or attached to the tether just below the ice-ocean interface (e.g. Islam et al., 2016). From 2004 to the time of this writing, some 110 ITP systems have been deployed in the Arctic (many lasting one year or longer before being recovered or destroyed by convergent sea ice motions or being dragged into shallow water – Toole et al., 2011; Fig. 6b). These systems have collectively returned more than 100,000 vertical profiles of Arctic water properties (or short time-series from a single depth). The program has been international in scope with contributions from the European Union and countries therein, Asian nations and Russia in addition to the U.S.
In recent years, in addition to broadly distributing ITP systems to try and obtain basin-scale coverage of the evolving water properties, several specialized buoys were fielded within coordinated arrays of instrument systems constituting process experiments. The Marginal Ice Zone study supported by the U.S. Office of Naval Research was such an effort with ITP instruments fitted with CTD and point current meters were deployed in conjunction with Arctic Ocean Flux Buoys, Ice Mass Balance buoys, Weather Stations and ocean gliders. Cole et al. (2017) report some of the findings.
Bottom-tethered moorings
In 2002–2004, the Western Arctic Shelf-Basin Interactions Program (SBI) fo-cused on physically mediated exchanges between the Chukchi and Beaufort Sea shelves and the adjacent Canada Basin. Since then scientists at WHOI have continued to in-vestigate how Pacific water progresses poleward from Bering Strait to the central Arc-tic. As part of SBI, an array of 8 moorings was maintained across the Beaufort shelf-break and slope, east of Pt. Barrow (Fig. 7a). This was the first high-resolution array across an Arctic shelfbreak, revealing that there was a shelfbreak jet in the Beaufort Sea transporting seasonally-varying Pacific water throughout the year (Nikolopoulos et al., 2009). In the spring the jet is bottom-intensified and transports winter water (Fig. 7b second row), while in the summer it is surface-intensified and transports warm Alaskan Coastal Water (Fig. 7b third row).

178
Proshutinsky A.Yu. et al.
Since the conclusion of SBI, a single mooring has been maintained in the center of the Beaufort shelfbreak jet as part of the Arctic Observing Network (AON, Fig. 7a). This dataset, in conjunction with the original SBI array, has demonstrated that storm-driven upwelling and downwelling events occur regularly (Lin et al., 2019; Foukal et al., 2019), even in the presence of nearly 100% ice cover (Schulze and Pickart, 2012). During up-welling the shelfbreak jet is reversed and warm Atlantic water can get transported to the shelf (Fig. 7b bottom row). A single strong easterly wind event such as this one can flux nearly as much heat into the Canada Basin as that transported to the Beaufort shelf an-nually from Bering Strait (Pickart et al., 2013). Furthermore, the amount of freshwater transported offshore during a strong event is comparable to the year-to-year variability in the freshwater content of the Beaufort Gyre (Proshutinsky, 2009b).
Boundary current dynamics, together with water mass properties, also impact biological signatures and processes near the shelf edge. High-resolution measurements of zooplankton and particles, made with an underwater microscope (Video Plankton Recorder), revealed a discontinuity in distributions between the slope and basin. These features are likely maintained by alongslope currents that constrained further north-ward transport. Experiments quantifying the grazing impact of the dominant copepod species found that the grazing was insufficient to consume all of the primary production so that much of it would fall to the seafloor and be utilized by the benthos (Campbell et al., 2009).
Notably, the annual mean transport of Pacific water in the Beaufort shelfbreak jet (order 0.1 Sv) is only a fraction of that exiting Barrow Canyon. Using historical shipboard
Fig. 7. (a) – Location of the SBI moorings (blue squares) and the Chukchi slope moorings ( red squares). Vertical sections of (b) – alongstream velocity (cm s-1, positive is eastward),
and (right) potential temperature (color, °C) overlain by salinity (contours). The second (third) row is the spring (summer) seasonal mean. The bottom row is a snapshot from an autumn
upwelling event. The red star / black dashed line denotes the long-term AON mooring.
а b

179
Journal of Oceanological Research. 2020. Vol. 48. No. 3. P. 164–198
CTD and ADCP data, Corlett and Pickart (2017) demonstrated that there is a west-ward-flowing current over the Chukchi continental slope, which they named the Chukchi Slope Current. Using a mooring array from 2013–2014 to the west of Barrow Canyon (Fig. 7a), it has been documented that the Slope Current is present throughout the year and transports approximately 0.5 Sv of Pacific water (Li et al., 2019). A regional numer-ical model demonstrates that the current emanates from Barrow Canyon (Spall et al., 2018). Many questions remain regarding the path and fate of the Chukchi Slope Current, which is the subject of ongoing study at WHOI.
Observing Systems
The chief motivation for WHOI investigators to initiate the Beaufort Gyre Explo-ration Project (BGEP, http://www.whoi.edu/beaufortgyre) and the Beaufort Gyre Observ-ing System (BGOS) in 2003 was to test the hypothesis of Proshutinsky et al. (2002) on the origin of a large pool of low salinity water in the center of the Canada Basin (Fig. 2b–d). This region is home to the Beaufort Gyre, a major circulation cell within the Arctic Ocean characterized by distinct atmosphere-sea-ice-ocean and biogeochemical features (e.g. Proshutinsky et al., 2015, 2019 a,b). Hydrographic observations show the salinity minimum at the Beaufort Gyre center (Fig. 2b and Fig. 2d) which extends from the surface to ~400 m depth (not shown) and represents a fresh water reservoir totaling approximately 17,000 km3 (Proshutinsky et al., 2009a). This volume, calculated relative to a reference mean salinity (34.8), represents fresh water that has accumulated in this region from different sources including ice melting, river outflows, atmospheric precipi-tation and water transport from the Pacific and Atlantic Oceans via straits.
The BGEP/BGOS program was formulated under the assumption that on annual and longer time scales, the inflow and outflow of fresh water from different Arctic Ocean sources and sinks are not balanced. It was hypothesized that due to an imbalance be-tween the sources and sinks of fresh water, the ocean can accumulate fresh water in the Beaufort Gyre under influence of prevailing anticyclonic winds over the Canada Basin. In turn, a relaxation or reversal of those winds (Proshutinsky and Johnson, 1997; Proshu-tinsky et al., 2002) could result in an export of fresh water. It was also hypothesized that the Beaufort Gyre has impacts on the climate further afield in two ways: First, fresh water accumulates in the Beaufort Gyre which results in a deficit of fresh water flowing into the North Atlantic. This deficit creates the conditions for deep convection of ocean waters and heat release from the ocean to atmosphere in the subpolar regions; it also promotes intensification of the Atlantic Meridional Overturning Circulation. Second, when there are prevailing counter-clockwise (cyclonic) winds over the Arctic, fresh wa-ter released from the Beaufort Gyre region could inhibit the processes of deep convec-tion, reduce the intensity of the Atlantic Meridional Overturning Circulation and result in climate cooling. Such periodical releases of fresh water from the Arctic Ocean, which have occurred in the 1970s, 1980s, and 1990s, are known as ‘Great Salinity Anomalies’ (Dickson et al., 1988; Belkin et al., 1998).

180
Proshutinsky A.Yu. et al.
Starting in August 2003, a team of WHOI scientists in collaboration with research-ers from the Institute of Ocean Sciences, Canada and the Japan Agency for Marine‐Earth Science and Technology (JAMSTEC) began to acquire time series observations of tem-perature, salinity, currents, geochemical tracers, sea ice draft and sea level in the Beau-fort Gyre Region on annual cruises as a contribution to the Arctic Observing Network (AON) (Fig. 8). Measurements were obtained from shipboard sensor systems as well as over longer time periods using moorings, drifting buoys and remote sensing tech-niques. The cruises have continued every year through 2019 (including maintaining the moorings) providing long-term observations of the oceanographic environment of the BG across decades in all seasons. Over the 2003–2018 period, the Beaufort Gyre ob-serving program has returned 1012 ship-based CTD profiles at standard locations and 1155 XCTD profiles between the standard sites (to increase spatial resolution), deployed/recovered of 59 moorings, deployed 49 Ice-Tethered Buoys, 28 Ice Mass Balance Buoys, 21 Arctic Ocean Flux buoys, and 12 Up-Tempo buoys (all measuring ocean and sea-ice properties) as well as 10 O-buoys (measuring atmospheric chemistry).
The BGOS mooring data allow year-round estimation of steric height variability, sea ice draft, and variations in the vertical distribution of freshwater content (see Pro-shutinsky et al., 2009a and 2009b). Month-long repeat hydrographic sections conducted annually in the July–October time window have quantified variability in ocean and ice characteristics in the region in time and space. Remote sensing techniques examine the
Fig. 8 (a) – Beaufort Gyre region (BGR) with BGOS mooring locations depicted as stars (moorings A, B, C and D), and sites of standard CTD stations where observations of sea ice
and water physical and geochemical parameters have been conducted over 2003–2018; (b) – Time-averaged summer freshwater content (m, relative to reference salinity 34.8) in the BGR for 1950s–1980s (left) and 2013–2018 (right). (c) Schematic of BGOS moorings. MMP stands for McLain Mooring Profiler which measures pressure, temperature, salinity and speed
of ocean currents with vertical resolution of 25 cm.

181
Journal of Oceanological Research. 2020. Vol. 48. No. 3. P. 164–198
broader spatial variability of the sea ice thickness and horizontal structure of sea surface height. Since the start of the BGOS monitoring program, liquid freshwater content in the Beaufort Gyre region has shown significant interannual variability, with periods of rapid change between periods of relative stability (Proshutinsky et al., 2019). Superimposed on interannual variability, since 2003 the Beaufort Gyre freshwater content has increased; 2018 freshwater content (~23,300±2,000 km3) was ~6,400 km3 greater than in 2003. Not only does this have important consequences for sea-ice, ocean dynamics, and ecosystems within the Arctic, but a possible fresh water release from the Arctic of this magnitude could cause one more salinity anomaly in the North Atlantic with magnitude comparable to that of the Great Salinity Anomaly (GSA, Dickson et al., 1988) of the 1970s.
In 2009, the first JGR-Oceans special issue dedicated to the Beaufort Gyre observa-tions and modeling issues was published (see Proshutinsky et al., 2009a; https://agupubs.onlinelibrary.wiley.com/doi/toc/10.1002/(ISSN)2169-9291.BEAUFORTG1). The papers of this special issue focused on the atmospheric, sea ice, oceanographic, and some biogeo-chemical features of this region and describe the Beaufort Gyre climate system variability at seasonal to decadal timescales, employing historical and the most recent data, simple hypotheses, and models to estimate changes.
In 2020, the JGR-Oceans special section “Forum for Arctic Modeling and Observational Synthesis (FAMOS) 2: Beaufort Gyre Phenomenon” publication was completed (see Proshut-insky et al., 2019a; (https://agupubs.onlinelibrary.wiley.com/doi/toc/10.1002/(ISSN)2169-9291.FAMOS2). In this collection, 39 papers contribute time series of the Beaufort Gyre data; new methodologies in observing, modeling, and analysis; interpretation of measurements and model output; and discussions and findings that shed light on the mechanisms regulating Beaufort Gyre dynamics as it transitions to a new state under different climate forcing.
Thus, the Beaufort Gyre system has the potential to drive significant future climate changes (Proshutinsky et al., 2015, 2019 a,b).
Ice-Based Observatories
An example of in situ ocean, atmosphere and sea ice observing systems is the Ice Based Observatory (IBO, Fig. 9) which includes meteorological, biogeochemical, oceanographic, and sea ice sensors. Over the past decade, numerous IBOs have been deployed Arctic-wide, measuring important environmental parameters year round with high spatial and temporal resolution. Future developments could include, for example, integration of IBOs, moored in-strumentation and mobile platforms, such as AUVs. For the latter, development of basin-scale, under-ice geopositioning and communications networks is a priority. Future autonomous ob-serving systems should have enhanced abilities to survive ice ridging and operate reliably in the seasonal ice zone and open water. Data returned from autonomous and integrated systems are necessary for operational arctic weather predictions, numerical model initialization and validation, and improved understanding of Arctic Ocean processes and long-term change. Although expeditionary field programs will continue to provide valuable information about Arctic change, true understanding will require sustained, integrated observing systems.

182
Proshutinsky A.Yu. et al.
Geochemistry and particle organic carbon
Other WHOI investigators seek to clarify the characteristics of the biological pump (including its functionality) in the central Canada Basin by examining the export of particulate organic carbon (POC) and other components to the deep basin. As a re-sult of prior biogeochemical investigations, it has been established that biological pump processes in the cryopelagic Arctic Ocean are – presently – unique among major ocean basins with regard to functionality and particle provenance (i.e., allochthonous vs au-tochthonous inputs) as a consequence of the dominant role of sea ice conditions, hy-drography and land-locked nature of the basin. WHOI investigators initiated a biogeo-chemical flux program in the deep Canada Basin. This program provided information on settling particles obtained from time-series sediment trap samples collected over 4 years at different depths at BGOS mooring locations in the deep basin. In addition, information has been acquired on suspended particles, as well as dissolved compo-nents, at 2 locations. These data have resulted in the following key observations that
Fig. 9. Basic elements of an Ice-Based Observatory (Ice-Tethered Profiler, ITP; Ice-Mass Balance Buoy, IMB; Arctic Ocean Flux Buoy; O-Buoy which measures three key atmospheric
chemical species, BrO, ozone and CO2 and wind generator left in left bottom panel); ice-beacon buoy, PMEL weather station, U-Tempo buoy, ice dynamics buoys and webcam are not shown. Trajectory of one of IBOs with starting point in 2010 at “Barneo” in the vicinity of the North
Pole is shown. Other trajectories and sites of observations are depicted in legend.

183
Journal of Oceanological Research. 2020. Vol. 48. No. 3. P. 164–198
reveal the unique functionality and provenance of the basin and possible trends related to basin hydrography and ice dynamics: First, with respect to functionality of particle supply to the deep basin, (i) very low particle fluxes relative to other ocean basins are indicative of a weak biological pump (ii) seasonal variations in mass flux, which are dominated (~80%) by lithogenic material, are highest during maximum ice coverage at all locations; (iii) Annual integrated mass fluxes decrease towards the interior of the Basin, while concentrations of POC and PIC increase and Al (lithogenic compo-nent) concentrations decrease; (iv) Other biogeochemical indicators (i.e., POC/PIC, C/N) suggest a consistent functionality of particle processes within the basin. Second, concerning provenance of particles, (v) Nd isotope analyses indicate at least 2 sources of allochthonous lithogenic material detected at all quadrants of the basin and, along with C isotopes provide constraints on particle source; (vi) comparison of carbon iso-topic signatures of sinking and suspended particulate organic carbon with respect to full-water-column isotopic profiles of dissolved organic and inorganic carbon indicate a possible mesopelagic autotrophic processes as a contribution to the particulate organ-ic carbon pool. Finally, with respect to interannual trends in particle fluxes to the deep basin, (vii) a marked increase in mass flux coincident with the 2008 Minimum Ice Con-dition was due to an increase in allochthonous input, and not to an increase in vertical export production; (viii) At the site nearest to the Barrow Canyon (SW quadrant of the Basin), we observed an increase of Al concentrations and a decrease in concentrations of POC and PIC during the 2008 collection period during the 2008 Minimum Ice Con-dition event. The continuation of our research will help to establish a robust foundation against which to detect and assess trends or abrupt changes in deep basin processes.
The particle flux observations obtained on the time-series samples acquired and measured thus far suggest that the marked changes in surface conditions have not – as of yet – propagated to the deep Basin. It is vital to distinguish between and anticipate sce-narios of a perennially weak biological pump, and gradual shift in strength, or an abrupt shift in mode and intensity. In this context, understanding (changes in) Arctic Ocean bio-logical pump processes are crucial for our understanding of large-scale changes in ocean biogeochemistry and their impacts on the global carbon cycle.
Recent acoustics studies
The CANAPE and CAATEX experiments are continuing the earlier Arctic acous-
tics experiments, these in collaboration with scientists from the Scripps Institution of Oceanography and the Nansen Environmental and Remote Sensing Center (Bergen, Nor-way). The Canada Basin Acoustic Propagation Experiment (CANAPE) conducted both deep and shallow water acoustic measurements to understand the effects of changing Arctic conditions on low-frequency propagation and ambient noise. The deep-water com-ponent included a yearlong experiment in the Canada Basin during 2016–2017, prece-ded by a short Pilot Study during July–August 2015. During 2016–2017, a Distributed Vertical Line Array (DVLA) receiver with 60 Hydrophone Modules was moored within

184
Proshutinsky A.Yu. et al.
a six-element acoustic transceiver array (Fig. 2b, pentagon region; details are not shown) with a 150-km radius. Environmental measurements on the DVLA include 28 Sea-Bird MicroCATs and upward- and downward-looking Acoustic Doppler Current Profilers (ADCPs) located below the hydrophone array. The acoustic transceivers had sources at 175-m depth and 15 Hydrophone Modules located above the sources. Environmental measurements on the transceiver moorings include ice-profiling sonars, upward-looking ADCPs on the subsurface floats, and 10 temperature sensors located below the acoustic transceivers. The one-year deployment provided measurements at least partially in open water during summer, in the marginal ice zone (MIZ) as it transitioned across the array during the spring and autumn, and under complete ice cover during winter. Some results of this experiment have already been published and available for analyses (e.g. Worcester et al., 2020). In 2018, MIT and WHOI participated in the U.S. Navy ICEX_18 (Fig. 3a) program run by the Arctic Submarine Laboratory. Signals were transmitted to test the properties of the so called “Beaufort Lens”, a duct created by the Pacific warm water that advects from Bering Strait and Shelf into the Canada Basin.
The Coordinated Arctic Acoustic Thermometry Experiment (CAATEX), focused on acoustic mean ocean temperature observations covering the central Arctic Ocean, star-ted in September 2019 and will end in September 2020. This observing system combines acoustic thermometry measurements with oceanographic point measurements (CTD, cur-rent meters, and upward-looking sonars). The locations of the sources and receivers during CATEEX were chosen to lead to comparison with the TAP data to determine what changes have taken place during the most recent 25 years. CAATEX is a step towards the develop-ment and implementation of a basin wide multipurpose acoustic network for acoustic ther-mometry, underwater geo-positioning and passive acoustics (e.g. Worcester et al., 2020).
Geological cruises
The Gakkel Ridge, which extends from Iceland to Siberia across the Eastern Arc-tic Basin, constitutes the most enigmatic oceanic spreading center on Earth. As the slowest spreading ridge on Earth (full rates of 3–7 mm/yr), the Gakkel Ridge provides a unique opportunity to study how magmatic, tectonic, and hydrothermal processes are accommodated at ultra-slow plate divergence rates. Two major international expedi-tions mounted to study the Gakkel Ridge (AMORE 2001, AGAVE 2007 – both led or co-led by WHOI investigators), have shown that the Gakkel Ridge hosts surprisingly large volcanic centers, some of which are capable of massive explosive eruptions, in-terspersed between magmatically starved regions where cold mantle rocks are exhumed en masse onto the deep seafloor. In addition, the 85°E segment of the ridge generates one of the largest hydrothermal plumes ever discovered in the global ocean. These sorts of puzzling observations highlight the fact that, despite several decades of research, we do not yet understand seafloor spreading processes in places where the spreading rate is lower than ~10 mm/yr, which constitutes more than 30% of the global mid-ocean ridge system by length.

185
Journal of Oceanological Research. 2020. Vol. 48. No. 3. P. 164–198
Greenland ice sheet and glacier-ocean interactions
In addition to loss of Arctic sea ice areal extent and mass in recent decades, north-ern hemisphere land ice in the form of glaciers has also declined. This has been most dramatic for the Greenland ice cap where satellite observations have documented a mean annual melt rate of more than 200 Gt/year since the beginning of the XXIst century (e.g. Sasgen et al., 2020). WHOI researchers have engaged in a variety of investigations of the Greenland ice sheet spanning polar ice sheet mass balance and ice dynamics, exploring the interactions between members of the coupled cryosphere-atmosphere-ocean system, and investigating biogeochemical processes in polar environments. Particular focus ar-eas include the ocean’s role in the decay of marine-terminating glaciers, and the impact of melt water on the regional circulation, water mass transformations and biology. The working environment in the Greenland fiords is particularly difficult due to iceberg calv-ing in addition to cold temperatures. A particular highlight are the observations of warm bottom waters in fiords that appear to persist year round and may contribute to melting at the glacier grounding line (Straneo et al., 2016).
Biological, geochemical observations and ecosystem studies
The Arctic’s extreme environmental conditions have limited opportunities to study its complex food web. Expeditions to the remote Arctic are difficult and expensive and are limited in time due to sea ice conditions. Such gaps in biological and other environ-mental in situ observations have compromised scientists’ ability to understand the food web’s intricacies and vulnerabilities – at a time when the ecosystem appears to be increas-ingly vulnerable. The warming temperatures are affecting the Arctic Ocean, producing changes that may have cascading effects on the Arctic’s interlinked and delicately bal-anced food web. Changes in the food web not only threaten life in the Arctic region, they also could have impacts on Earth’s climate. Populations of Arctic plankton for example, not only provide food at the base of the food web, they also convert carbon dioxide from the atmosphere into organic matter that eventually sinks to the ocean bottom–effectively extracting a heat-trapping greenhouse gas from the atmosphere. Here we briefly describe some additional WHOI studies focusing on investigation of different aspects of Arctic biology, ecosystem and geochemical processes and their changes in time.
In 2005–2015 WHOI biologists explored the Bowhead Whale Hotspot near Pt. Bar-row, Alaska. This eleven-year set of projects was focused on a bowhead whale feeding site that forms each fall near Pt. Barrow AK. The annual migration of bowhead whales (Balaena mysticetus) past Barrow, Alaska, has provided subsistence hunting to lo-cal residents of Alaska for centuries. Bowheads recurrently feed on aggregations of zooplankton prey near Barrow in autumn. The project conducted cross-shelf sampling of hydrography, currents, chlorophyll, nutrients, and zooplankton. The team identified the physical-biological mechanism that predictably and recurrently forms a bowhead whale prey (krill) aggregation on the shelf near Pt. Barrow and documented interannual varia-

186
Proshutinsky A.Yu. et al.
bility in the forcing mechanisms and occurrence of that formation annually from August–September 2005 to August–September 2015 (Ashjian et al., 2010; Okkonen et al., 2018). The mechanisms that form these aggregations, and the associations between whales and oceanography, were investigated using field sampling, retrospective analysis, and traditional knowledge interviews. Multiple water masses were observed, and close coupling between water mass type and biological characteristics was noted. Short-term variability in hydrography was associated with changes in wind speed and direction that profoundly affected plankton taxonomic composition. Aggre-gations of ca. 50–100 bowhead whales were observed in early September at lo-cations consistent with traditional knowledge. Retrospective analyses of records for 1984–2004 also showed that annual aggregations of whales near Barrow were associ-ated with wind speed and direction (Okkonen et al., 2011). Euphausiids and copepods appear to be upwelled onto the Beaufort Sea shelf during E or SE winds. A favorable feeding environment is produced when these plankton are retained and concentrated on the shelf by the prevailing westward Beaufort Sea shelf currents that converge with the Alaska Coastal Current flowing to the northeast along the eastern edge of Barrow Canyon. The impact of Beaufort Sea shelf break upwelling on the prey availability for fish and marine mammals was further explored during two cruises during late summer (2018) and early fall (2017) under varying sea ice conditions.
In order to better understand seasonal changes in biological processes and ecosys-tem seasonal cycle, a WHOI-led six-week cruise using the USCGC Healy explored the early winter physical and biological characteristics of the Chukchi, western Beaufort, and Bering Seas during November and December of 2011. The multidisciplinary team meas-ured water column temperature, salinity, and currents and sampled nutrients, chlorophyll, zooplankton, and sea ice organic carbon.
A relatively new line of Arctic research led by WHOI is investigating toxic and harmful algal blooms (HABs, commonly called “red tides”) along the west coast of Greenland and in the Alaskan Arctic, particularly in the Chukchi Sea. HABs are accu-mulations of algae that adversely affect human, wildlife, and ecosystem health through a variety of mechanisms, the most significant being the production of potent toxins that cause illness and death in humans and marine animals (Anderson et al., 2012).
Two cruises along the west coast of Greenland documented the presence of Alex-andrium catenella, the organism responsible for a widespread HAB human poisoning syndrome called paralytic shellfish poisoning (PSP). In western Greenland, A. catenella cysts were present in bottom sediments at most stations sampled, even those near 76°N, but concentrations were very low (Richlen et al., 2016), as were the counts of vegetative cells in surface waters. The species is thus present, but was not thriving or blooming in large numbers along that coast.
In contrast, multiple surveys in 2018 and 2019 documented a massive accumu-lation of A. catenella cysts in bottom sediments north of the Bering Strait in the Alaskan Arctic, with the largest accumulation in the Chukchi Sea (D.M. Anderson, unpub. data). With summertime bottom temperatures that now support the germination of A. catenella

187
Journal of Oceanological Research. 2020. Vol. 48. No. 3. P. 164–198
cysts and the growth of the vegetative cells, these observations have major implications with respect to climate-related threats to human and ecosystem health in the Alaskan Arctic. For reasons that are not yet clear, a similar expansion of A. catenella populations has not yet been observed along the eastern pathway into the North American Arctic near Greenland.
It is interesting to note that A. catenella cells and cysts are now documented in the Arctic north of Alaska and Canada and along the two entrance pathways to the west and east of North America. Biogeographic studies on this species that demonstrate that the western Pacific and north Atlantic strains of this species are genetically related, but different, and that a parent population may have existed from the Bering Strait to the Labrador Sea back when the Arctic climate was much milder than present. The current geographic distribution suggests that the process may be proceeding in reverse – that strains of A. catenella may be re-entering the North American Arctic along the western and eastern pathways, potentially evolving towards a new pan-Arctic population as the region warms.
Modeling and synthesis of model results and observation
It is difficult to describe, understand, and explain the Arctic system based on obser-vations alone, especially because measurements in the Arctic Ocean are relatively scarce. Modeling is clearly required on many different levels, from simplified and idealized pro-cess models to regional and pan-Arctic models to fully coupled ice-ocean-atmosphere models. The Arctic is particularly challenging to model because processes on very small scales are important for the basin-scale mean circulation. Mesoscale eddies on the order of 10 km radius are commonly found and are known to transport heat and salt anomalies from the shelf region into the basin interior. Fully representing these eddies and their formation mechanisms in numerical models is very challenging. Small-scale turbulent mixing processes (even more difficult to resolve in models) are also essential for the large-scale Arctic circulation and freshwater and heat budgets.
In the 1990s, modeling became an important tool for understanding past conditions and explaining recently observed changes in the Arctic Ocean. Models and simulations comprehensively synthesize observations from numerous disciplines (physics, mathe-matics, and atmospheric, oceanic, cryospheric, and related sciences), enabling hypothesis testing via numerical experiments. Fig. 10 explains this philosophy, where synthesis and integration among basic disciplines allows scientists to formulate a basic model, feed this model with initial and boundary conditions, and force it by assimilating observational data. In 1999, with support from NSF, WHOI in collaboration with the University of Washington, Naval Postgraduate School, Institute of Ocean Sciences (Canada) and the Alfred Wegener Institute (Germany), organized the Arctic Ocean Model Intercomparison Project (AOMIP) to compare models and their outputs and ultimately improve the models.
During the first phase of AOMIP (see JGR-Oceans special issue “Arctic Ocean Model Intercomparison Project” (AOMIP) studies and results; Proshutinsky and

188
Proshutinsky A.Yu. et al.
Kowalik, 2007; https://agupubs.onlinelibrary.wiley.com/doi/toc/10.1002/(ISSN)2169-9291.AOMIP1) striking, previously unknown differences among Arctic models were discovered. Based on model validations against observational data, AOMIP teams led by WHOI identified a set of parameters and processes where physical understanding was lacking, and/or numerical improvements were needed. It was found, for example, that six out of the eight AOMIP coupled ice‐ocean models that participated in the first coordinated experiment exhibited unrealistically large drifts from mean climatological salinity (Steele et al., 2001). Further, it was found that only three of the models realistically captured the cyclonic (counterclockwise) flow of Atlantic Water (AW) around the continental slopes of the Arctic Ocean. The others simulated an exact opposite (anticyclonic) flow. These results only became apparent when all modelers came together and openly compared their results in a workshop setting; following this, several teams met to diagnose differences and develop solutions. It was concluded that the modeling results were sensitive to vertical mixing, and that unrealistic anticyclonic AW flow could be reversed in a model by reducing the intensity of vertical mixing (Zhang and Steele, 2007; Golubeva and Platov, 2007) to levels that were significantly lower than those typically found in the rest of the World Ocean, but were in fact consistent with the limited observational database on Arctic mixing. The reduction of ocean vertical mixing had the further consequence of eliminating the need for unphysical climate restoring, a numerical adjustment that had been required previously to limit unrealistic drift away from climatological observations. These findings have been frequently cited in recent papers focused on the future potential for increased Arctic Ocean mixing in response to decreasing sea ice cover (e.g., Rainville and Woodgate, 2009). In addition, these issues discussed at project meetings led other AOMIP participants to clarify the basic physics of AW circulation (Karcher et al., 2007; Yang, 2005; Karcher et al., 2012). It is important to add that appropriate representation of vertical mixing in numerical models is not settled yet.
In the second phase of AOMIP, several new thrusts were implemented, namely: strengthened collaboration between modelers and observationalists; inclusion of a wid-er representation of Arctic marine interests; and an emphasis on teaching and inclusion of early‐career scientists and researchers new to the area of Arctic research. A special JGR-Oceans special issue “Arctic Ocean Investigation Employing AOMIP‐2 Models” provides a sample of significant AOMIP work during this period; this is in addition to the more than 60 other papers published by AOMIP participants. Data assimilation was an additional new thrust during this period, wherein experts in this field from the Massachu-setts Institute of Technology (MIT), University of Alaska Fairbanks (UAF) and elsewhere contributed several key studies (e.g., Panteleev et al., 2010; Heimbach, 2008; Kauker et al., 2009). The subject of ecosystem modeling was also introduced, involving experts from United Kingdom National Oceanographic Center, UAF, New York University and elsewhere. An example of their results is the finding that modeled surface mixed layers were generally too deep compared to observations, which affects nutrient supply and pri-mary productivity (e.g., Popova et al., 2010, 2012).

189
Journal of Oceanological Research. 2020. Vol. 48. No. 3. P. 164–198
FAMOS (the Forum for Arctic Modeling and Observational Synthesis; https://web.whoi.edu/famos/; from 2012 – present) was the continuation of AOMIP, with an even stronger emphasis on the synthesis of model and observational results. In its first phase, FAMOS–1, six scientific teams were organized for coordinated studies of Atlantic wa-ter circulation, freshwater changes in the Arctic Ocean, sea ice drift, ice ridging, and other ice‐related processes (including fast ice studies), and ecosystem processes using improved models. More than 60 papers were published, including 39 in the JGR-Oceans special issue “Forum for Arctic Modeling and Observational Synthesis (FAMOS): results and synthesis of coordinated experiments” (see preface by Proshutinsky et al., 2016; and section location at https://agupubs.onlinelibrary.wiley.com/doi/toc/10.1002/(ISSN)2169-9291.FAMOS1). This special collection presented a set of project results obtained based on international coordinated observational and numerical experiments associated with: investigation of Pacific and Atlantic water circulation; studies of the processes of fresh-water and heat accumulation in the Arctic Ocean and pathways of freshwater from sourc-es toward the North Atlantic; fate of the Arctic sea ice and methods of sea ice modeling and forecasting; ecosystem modeling including both model development and Arctic eco-system change studies; Investigation of Greenland’s ice melting role in the sea level rise and decadal climate.
Results of FAMOS–2 project (2012–present) we already discussed in section “Beaufort Gyre Observing System”. At this stage of work FAMOS–2 collaborators have been focusing on modeling with high and very high resolution to resolve small scale pro-cesses like eddies, internal waves and specifics of ice dynamics.
Individual based modeling of zooplankton life histories coupled with hydrographic and advective fields has produced new insights into how zooplankton populations are sustained in the Arctic Ocean and the factors determining biogeography. For example,
Fig. 10. Illustration of synthesis and integration employed in AOMIP and FAMOS projects. Modified after (Proshutinsky et al., 2011).

190
Proshutinsky A.Yu. et al.
the subarctic copepod species Calanus finmarchicus and C. marshallae were found to be unable to establish populations in the Arctic because their life histories required a longer productive season than is present. Two Arctic species, C. glacialis and C. hyperboreus, were able to sustain populations with C. glacialis being limited to the slope regions while C. hyperboreus’ range extended further into the Arctic basin. Simulated lengthening of the annual productive season and a 2°C increase in water temperature increased the north-ward range to which both species were able to recruit although C. glacialis was still limited to the southern portions of the Arctic basins and C. hyperboreus was still unable to recruit at the northernmost latitudes, suggesting that their presence there was due to advection (Ji et al., 2012). Subsequent work with C. glacialis incorporating not only modeled physical fields but also food availability revealed that increased availability of algal food under climate change could permit the species to expand its range further north, although still not colonizing the central Arctic basins (Feng et al., 2016, 2017). Retrospective statistical analysis of historic abundance data supported the conclusions that C. hyperboreus has not historically been endemic to the northernmost latitudes of the Arctic Ocean but that recent warming and changes in production may permit northern range expansion by the species (Kvile et al., 2018).
concluding remarks
Below we summarize the experience of WHOI investigators in Arctic observing to lay the groundwork for future research programs to build greater understanding of Arctic processes and changes.
Arctic observing concept
The traditional approach of acquiring observations when and where the Arctic is accessible (e.g. via icebreakers during summer or aircraft in spring) has to be enhanced with multi-faceted measurement systems operating autonomously to provide year-round information in real time. The major goal of such a network of autonomous sensors is to measure and monitor physical, chemical and biological parameters in the atmosphere, sea ice and ocean on at least daily intervals. These observational assets should be config-ured to monitor changes in ocean watermass volume, heat and fresh water content, and observe the heat and fresh water fluxes through ocean straits and openings connecting to the south. Data are also needed on key biological parameters and organisms of interest. In some cases, species-specific measurements are now possible using autonomous observ-ing instruments, such as those producing marine biotoxins that threaten human and eco-system health. That said, data collected by traditional ship-based and airborne expeditions designed for specific process studies will continue to be essential, and should complement the automated observing systems. Combined, these systems will provide year-round ob-servations of key oceanographic, cryospheric and atmospheric processes both through the complementary nature of the platform types and through platform interactions.

191
Journal of Oceanological Research. 2020. Vol. 48. No. 3. P. 164–198
Instrumentation for measuring the Arctic Ocean
The Arctic environment imposes unusual restrictions on instruments and opera-tions. Often, instruments deployed in the Arctic have been designed for use at lower latitudes and adapted for Arctic use. It is necessary to design instruments specifically for: 1) use in ice-covered waters; 2) deployment from Arctic research platforms; and 3) long-term operation in a remote and harsh environment. A major goal is the development and demonstration of new technologies and methods for simultaneously observing the atmosphere, ice pack, and water column. These tools should be capable of measuring the Arctic continuously, unrestricted by surface conditions. In addition to developing new technologies, it is important to assess the effectiveness of fixed and mobile sensor plat-forms envisioned to provide year-round observations in the Arctic. At least four primary components of Arctic instrumentation have to be designed and/or improved:
– Mobile platforms: Autonomous, under-ice vehicles such as AUVs and gliders can be implemented to measure the Arctic in a variety of configurations, from small-scale high-resolution surveys to key transects that augment and expand upon fixed and drifting observations on larger scales. These vehicles should employ modular payload sections so that they can be equipped with a variety of physical, chemical, and biological sensors, with the eventual goal of providing fully autonomous (year-round if necessary) opera-tions in conjunction with the establishment of cabled observatories.
– Moored assets: The small inherent length scales in the Arctic make it necessary to acquire closely-spaced fixed-point observations in order to understand various process-es. Examples include shelf-edge jets, circulation and mixing in canyons, and mid-shelf processes (e.g. polynyas). Of particular value are measurements of the upper water col-umn beneath the ice. Different strategies need to be pursued, and, like the mobile assets, biogeochemical sensors should be incorporated whenever possible. Existing/emerging technologies have already been shown to function well in the Arctic.
– Cabled Observatories: Cabled observatories can support continuous, high band-width (gigabits per second) and high power (tens of kilowatts) observations, as well as docking functionality for AUVs. These provide an effective platform for a variety of re-gional process studies. A specific example might be a cabled observatory for the Beaufort shelf and slope maintained in conjunction with the Barrow Arctic Science Consortium.
– Drifting Buoy Network: Large-scale spatial coverage of the Arctic Basin can be accomplished by installing buoys in the drifting ice pack. These observing nodes (IBOs) should include meteorological, oceanographic, and cryogenic sensor systems, and utilize satellite communications to achieve near real-time data transmission. The multi-purpose platforms can also provide navigational information and possibly docking functionality for autonomous, mobile vehicles. These systems already exist in a simplified version (observing primary oceanic, atmospheric and sea ice parameters).
– One technology which needs a lot attention is active sonar sources. There are two key aspects. The first is the energy needed to use them. In the ocean acoustic tomography experiments such as CANAPE and CAATEX the energy budgets must be carefully calcu-

192
Proshutinsky A.Yu. et al.
lated and the timing to the radiated signals carefully adjusted such that the “receiver aper-tures” are open for recording. Variation in travel time calculations are critical. The second are the marine mammal concerns. The Arctic is filled with many mammalian species in-cluding whales, seals walruses and polar bears. The loud, but compact explosive sources are no longer allowed and the long duration signals needed to keep source levels low are critical. New battery storage capability and recharging concepts are keys to these remote explorations. For details see Baggeoer et al. (2018).
Modeling and model improvements
In order to develop comprehensive Arctic models, it is necessary to collaborative-ly engage modelers and observationalists representing the atmospheric, terrestrial, ice, and ocean disciplines. Presently, there are not sufficient observational data available for model initialization, forcing, validation, and assimilation. A comprehensive Arctic ob-servational network is urgently needed to satisfy the needs of both the observational and modeling communities. Modeling must play a substantial role in AON design and pro-vide a scientifically effective system for the temporal and spatial distribution of observa-tional sites. This is especially important during times of rapid sea ice change that puts in jeopardy traditional ice camp fieldwork. Modeling must also play a key role in furthering our understanding of the dynamics and thermodynamics of the Arctic Ocean, from the mesocale to the basin-scale.
Arctic model development objectives should include: (1) validation of atmospheric reanalysis data used to force coupled ice-ocean and terrestrial models, (2) identification of terrestrial, ice, and ocean model errors due to forcing uncertainties, and (3) improve-ment of the sub-grid scale parameterizations (mixing, boundary layer processes) and ice dynamics. This work has to focus on the extension of reanalysis efforts to sea ice, ocean, hydrology, permafrost, and other disciplines; the continuation of coupled-model data as-similation technique development; the facilitation of immediate data exchange among data holders; and focused process studies that include both models and data.
Finally, we can conclude that with the experience and results demonstrated from 1930 to over the past decades for furthering Arctic research, WHOI scientists are well po-sitioned to continue to explore physics, dynamics and climatologic changes of the Arctic Ocean in the decades ahead.
acknowledgements: Funding for AP, JMT and RAK was provided by the National Science Foundation Office of Polar Programs (NSF-1845877); ABB was funded by the ONR Program offices for the Arctic and Ocean Acoustics. Funding for DMA was provid-ed by the NOAA Arctic Research Program through Cooperative Institute for the North Atlantic Region (CINAR Award NA14OAR4320158, and by the National Science Foun-dation Office of Polar Programs (OPP-1823002). CJA was supported by the National Sci-ence Foundation Office of Polar Programs (OPP-0124766, OPP-0124763, OPP 0909368, OPP-1603941, PLR-1023331, OPP-043613 and OPP-1824447). Work by LF was

193
Journal of Oceanological Research. 2020. Vol. 48. No. 3. P. 164–198
funded by the Office of Naval Research under contracts N00014-12-1-0176 and N00014-16-I-2347. We wish to thank our collaborators Peter Worcester and Matthew Dzieciuch from the Scripps Oceanographic Institution, Hanne Sagen from the Nansen Environment and Remote Center (Norway), and the WHOI arctic research group scientists (Robert Beardsley, Marco Coolen, Sarah Das, Rebecca Gast, Geoffrey Gebbie, Robert Groman, Lloyd Keigwin, Sam Laney, Christopher Linder, Krista Longnecker, Ted Maksym, Ann McNichol, Aran Mooney, Bernhard Peucker-Ehrenbrink, Al Plueddeman, Rob Reves-Sohn, Mindy Richlen, Hyodae Seo, Hanumant Singh, Mike Spall, Rachel Stanley, Robert Weller, Jiayan Yang, Lisan Yu and Weifeng Zhang) for providing their materials, results and recommendations for this paper preparation.
references
Anderson, D.M., A.D. Cembella, and G.M. Hallegraeff. Progress in understanding harmful algal blooms: paradigm shifts and new technologies for research, monitoring, and management. Annual review of marine science, 2012, No. 4, pp. 143–176.
Ashjian, C.J., R.G. Campbell, H.E. Welch, M. Butler, and D. Van Keuren. Annual cycle in abundance, distribution, and size in relation to hydrography of important copepod species in the western Arctic Ocean. Deep Sea Research Part I: Oceanographic Research Papers, 2003, Vol. 50, Issues 10–11, pp. 1235–1261, doi: 10.1016/S0967-0637(03)00129-8.
Ashjian, C.J., S.R. Braund, R.G. Campbell, J.C. George, J. Kruse, W. Maslowski, S.E. Moore, C.R. Nicolson, S.R. Okkonen, B.F. Sherr, E.B. Sherr, and Y. Spitz. Climate variability, oceanography, bowhead whale distribution, and Iñupiat subsistence whaling near Barrow, AK. Arctic, 2010, No. 63, pp. 179–194.
Baggeroer, A.B. and I. Dyer. Fram 2 in the eastern Arctic. Eos Trans. AGU, 1982, Vol. 63, No. 14, pp. 217–222, doi: 10.1029/EO063i014p00217.
Baggeroer, A.B. and R. Falconer. Array refraction profiles and crustal models of the Canada Basin. J. Geophys. Res., 1982, Vol. 87, No. B7, pp. 5461–5476, doi: 10.1029/JB087iB07p05461.
Baggeoer, A.B., B.M. Howe, P.N. Mikhalevsky, J.A. Orcutt, and H. Schmidt. Ocean Observatories: An Engineering Challenge. The Bridge, 2018, Vol. 48, No. 3, pp. 17–34, https://www.nae.edu/195294/Ocean-Observatories-An-Engineering-Challenge.
Belkin, I.M., S. Levitus, J. Antonov, and S.A. Malmberg. “Great Salinity Anomalies” in the North Atlantic. Progress in Oceanography, 1998, Vol. 41, No. 1, pp. 1–68.
Cole, S.T., F.T. Thwaites, R.A. Krishfield, and J.M. Toole. Processing of Velocity Observations from Ice-Tethered Profilers. Proceedings Oceans, 2015, MTS/IEEE: Washington, D.C. Oct. 19–22, http://ieeexplore.ieee.org/xpl/articleDetails.jsp?arnumber=7401887&refinements%3D4224619700%26filter%3DAND%28p_IS_Number%3A7401802%29.
Corlett, W.B. and R.S. Pickart. The Chukchi slope current. Progress in Oceanography, 2017, Vol. 153, pp. 50–56, doi: 10.1016/j.pocean.2017.04.005.
Dickson, R.R., J. Meincke, S.A. Malmberg, and A.J. Lee. The great salinity anomaly in the northern North Atlantic 1968–1982. Progress in Oceanography, 1998, Vol. 20, pp. 103–151.
Duckworth, G.L., A.B. Baggeroer, and H.R. Jackson. Crustal structure measurements near Fram II in the Pole Abyssal Plain. Tectonophysics, 1982, Vol. 89, pp. 182–215.
Duckworth, G.L. and A.B. Baggeroer. Inversion of refraction data from the Fram and Nansen Basins of the Arctic Ocean. Tectonphysics, 1985, Vol. 114, pp. 82–115.

194
Proshutinsky A.Yu. et al.
Dudko, Y., H. Schmidt, von der Heydt K., and Scheer E. Edge wave observation using remote seismo-acoustic sensing of ice events in the Arctic. J. of Geophy. Res., 1998, Vol. 103, No. C10, pp. 21775–21781.
Dyer, I. and A. Baggeroer. Fram 2 in the eastern Arctic Ocean. Eos Trans. AGU, 1980, Vol. 61, No. 4, pp. 34, doi: 10.1029/EO061i004p00034.
Feng, Z., R. Ji, R.G. Campbell, C.J. Ashjian, and J. Zhang. Early ice retreat and ocean warming may induce copepod biogeographic boundary shifts in the Arctic Ocean. J. Geophys. Res., 2016, Vol. 121, doi: 10.1002/2016JC011784.
Feng, Z., R. Ji, C. Ashjian, R. Campbell, J. Zhang. Biogeographic responses of the copepod Calanus glacialis to a changing Arctic marine environment. Global Change Biology, 2017, pp. 1–12, doi: 10.1111/gcb.13890.
Foukal, N.P., R.S. Pickart, G.W.K. Moore, and P. Lin. Shelfbreak downwelling in the Alas-kan Beaufort Sea. Journal of Geophysical Research, 2019, Vol. 124, doi: 10.1029/ 2019JC015520.
Islam, F., M. DeGrandpre, C. Beatty, M.-L. Timmermans, R. Krishfield, J. Toole, and S. Laney. Sea surface pCO2 and O2 dynamics in the partially ice-covered Arctic Ocean. Journal of Geophysical Research, 2016, Vol. 122, doi: 10.1002/2016JC012162.
Ji, R., C.J. Ashjian, R.G. Campbell, C. Chen, G. Gao, C.S. Davis, G.W. Cowles, and R.C. Beardsley. Life history and biogeography of Calanus copepods in the Arctic Ocean: An indivi du al-based modeling study. Progress in Oceanography, 2012, Vol. 96, pp. 40–56.
Heimbach, P. The MITgcm. ECCO adjoint modeling infrastructure. CLIVAR Exchanges, 2008, Vol. 13, No. 1, pp. 13–17.
Honjo, S., T. Takizawa, R. Krishfield, J. Kemp, and K. Hatakeyama. Drifting Buoys Make Discoveries About Interactive Processes in the Arctic Ocean. EOS trans. AGU, 1995, Vol. 76, pp. 209–219.
Horn, D.A. and G.L. Johnson. MIZEX East: Past Operations and Future Plans. Oceanus, 1986, Vol. 29, No. 1, pp. 66–72.
Johnson, G.L. The Fram Expeditions. In: Arctic Ocean studies from floating ice, 1979–1982. Polar Record, 1983, Vol. 21, No. 135, pp. 583–589.
Karcher, M., F. Kauker, R. Gerdes, E. Hunke, and J. Zhang. On the dynamics of Atlantic Water circulation in the Arctic Ocean. J. Geophys. Res., 2007, Vol. 112, pp. C04S02, doi: 10.1029/2006JC003630.
Karcher, M., J.N. Smith, F. Kauker, R. Gerdes, and Jr.W.M. Smethie. Recent changes in Arctic Ocean circulation revealed by iodine-129 observations and modeling. J. Geophys. Res., 2012, Vol. 117, pp. C08007, doi: 10.1029/2011JC007513.
Kauker, F., T. Kaminski, M. Karcher, R. Giering, R. Gerdes, and M. Voßbeck. Adjoint analysis of the 2007 alltime Arctic sea-ice minimum. Geophys. Res. Lett., 2009, Vol. 36, pp. L03707. doi: 10.1029/2008GL036323.
Krishfield, R., K. Doherty, and S. Honjo. Ice-Ocean Environmental Buoys (IOEB); Technology and Deployment in 1991–1992. Woods Hole Oceanographic Institution Technical Report, 1993, WHOI 93–45, 138 pp., Woods Hole, MA.
Krishfield, R.A., A.J. Plueddemann, and S. Honjo. Eddies in the Arctic Ocean from IOEB ADCP data. Woods Hole Oceanographic Institution Tech. Rep., WHOI-2002-09, 2002, 144 pp., Woods Hole, MA.
Krishfield, R., S. Honjo, T. Takizawa, and K. Hatakeyama. IOEB Archived Data Processing and Graphical Results from April 1992 through November 1998. Woods Hole Oceanographic Institution Technical Report, WHOI 99-12, 1999, 88 pp., Woods Hole, MA.

195
Journal of Oceanological Research. 2020. Vol. 48. No. 3. P. 164–198
Krishfield, R., J. Toole, A. Proshutinsky, and M.L. Timmermans. Automated Ice-Tethered Profilers for seawater observations under pack ice in all seasons. Journal of Atmospheric and Oceanic Technology, 2008, Vol. 25, No. 11, pp. 2091–2105.
Kvile, K.O., C. Ashjian, Z. Feng, J. Zhang, and R. Ji. Pushing the limit: Resilience of an Arctic copepod to environmental fluctuations. Global Change Biology, 2018, Vol. 24, pp. 5426–5439, doi: 10.1111/gcb.14419.
Laney, S.R., R.A. Krishfield, J.M. Toole, T.R. Hammar, and C.J. Ashjian. Assessing Phytoplankton Biomass and Bio-optical Distributions in Perennially Ice-Covered Polar Ocean Eco-systems. Polar Science, 2013, doi: 10.1016/j.polar.2013.12.
Li, M., R.S. Pickart, M.A. Spall, T.J. Weingartner, P. Lin, G.W.K. Moore, and Y. Qi. Circulation of the Chukchi shelfbreak and slope from moored timeseries. Progress in Oceanography, 2019, Vol. 172, pp. 14–33.
Lin, P., R.S. Pickart, G.W.K. Moore, M.A. Spall, and J. Hu. Characteristics and dynamics of wind-driven upwelling in the Alaskan Beaufort Sea based on six years of mooring data. Deep-Sea Research II, 2019, Vol. 162, pp. 79–92.
Nikolopoulos, A., R.S. Pickart, P.S. Fratantoni, K. Shimada, D.J. Torres, and E.P. Jones. The western Arctic boundary current at 152°W: Structure, variability, and transport. Deep-Sea Research II, 2009, Vol. 56, pp. 1164–1181.
Miller, B. and H. Schmidt. Observation and inversion of seismoacoustic waves in a complex Arctic ice environment. J. Acoust. Soc. Am., 1991, Vol. 89, pp. 1668–1685.
Okkonen, S.R., C.J. Ashjian, R.G. Campbell, J. Clarke, S.E. Moore, and K.D. Taylor. Satellite observations of circulation features associated with the Barrow area bowhead whale feeding hotspot. Remote Sensing of Environment, 2011, Vol. 115, pp. 2168–2174.
Okkonen, S.R., C.J. Ashjian, R.G. Campbell, and P. Alatalo The encoding of wind forcing into the Pacific-Arctic pressure head, Chukchi Sea ice retreat and late-summer Barrow Canyon wa ter masses. Deep-Sea Research II, 2018, Vol. 162, pp. 22–31, doi: 10.1016/j.dsr2.2018.05.009.
Panteleev, G., D.A. Nechaev, A. Proshutinsky, R. Woodgate, and J. Zhang. Reconstruction and analysis of the Chukchi Sea circulation in 1990–1991. J. Geophys. Res., 2010, Vol. 115, pp. C08023, doi: 10.1029/2009JC005453.
Pickart, R.S., M.A. Spall, and J.T. Mathis. Dynamics of upwelling in the Alaskan Beaufort Sea and associated shelf-basin fluxes. Deep-Sea Research I, 2013, Vol. 76, pp. 35–51.
Plueddemann, A.J., R. Krishfield, T. Takizawa, K. Hatakeyama, and S. Honjo. Upper ocean velocities in the Beaufort Gyre. Geophys. Res. Lett., 1998, Vol. 25, pp. 183–186.
Pritchard, R.S. and CEAREX Drift Group. CEAREX Drift Experiment. EOS, Transactions of the American Geophysical Union, 1990, Vol. 71, No. 40, pp. 1115–1118.
Popov, K.V., N.V. Libina, and M.G. Ushakova. About the drift of Tthe “North Pole-1” Research station. Journal of Oceanological Research, 2019, Vol. 47, No. 4, pp. 222–236, doi: 10.29006/1564–2291.JOR–2019.47(4).16.
Popova, E.E., A. Yool, A.C. Cowar, Y.K. Aksenov, S.G. Alderson, B.A. de Cuevas, and T.R. Anderson. Control of primary production in the Arctic by nutrients and light: insights from a high resolution ocean general circulation model. Biogeosciences Discuss., 2010, Vol. 7, pp. 5557–5620, doi: 10.5194/bgd-7-5557-2010.
Popova, E., A. Yool, A. Coward, F. Dupont, C. Deal, S. Elliot, E. Hunke, M. Jin, M. Steele, and J. Zhang. What controls primary production in the Arctic Ocean Results from an ecosystem model intercomparison. J. Geophys. Res., 2012, Vol. 117, pp. C00D12, doi: 10.1029/2011JC007112.
Proshutinsky, A.Yu. and M.A. Johnson. Two circulation regimes of the wind-driven Arctic Ocean. J. Geophys. Res.: Oceans, 1997, Vol. 102, pp. 12493–12514, doi: 10.1029/97JC00738.

196
Proshutinsky A.Yu. et al.
Proshutinsky, A., R.H. Bourke, and F.A. McLaughlin. The role of the Beaufort Gyre in Arctic climate variability: Seasonal to decadal climate scales. Geophys. Res. Lett., 2002, Vol. 29, No. 23, doi: 10.1029/2002GL015847.
Proshutinsky, A. and Z. Kowalik. Preface to special section on Arctic Ocean Model Intercomparison Project (AOMIP) Studies and Results. J. Geophys. Res., 2007, Vol. 112, pp. C04S01, doi: 10.1029/2006JC004017.
Proshutinsky, A., R. Krishfield, and D. Barber. Preface to special section on Beaufort Gyre Climate System Exploration Studies: Documenting key parameters to understand environmental variability. J. Geophys. Res., 2009a, Vol. 114, pp. C00A08, doi: 10.1029/2008JC005162.
Proshutinsky, A., R. Krishfield, M.-L. Timmermans, J. Toole, E. Carmack, F. McLaughlin, W.J. Williams, S. Zimmermann, M. Itoh, and K. Shimada. Beaufort Gyre freshwater reservoir: State and variability from observations. Journal of Geophysical Research, 2009b, Vol. 114, pp. C00A10, doi: 10.1029/2008JC005104.
Proshutinsky, A., Y. Aksenov, J. Clement Kinney, R. Gerdes, E. Golubeva, D. Holland, G. Holloway, A. Jahn, M. Johnson, E. Popova, M. Steele, and E. Watanabe. Recent advances in Arctic Ocean studies employing models from the Arctic Ocean Model Intercomparison Project. Oceanography, 2011, Vol. 24, No. 3, pp. 102–113, doi: 10.5670/oceanog.2011.61.
Proshutinsky, A., D. Dukhovskoy, M.-L. Timmermans, R. Krishfield, and J. Bamber. Arctic circulation regimes. Philosophical Transactions A of Royal Society. In: Arctic sea ice: the evidence, models and impacts, 2015, doi: 10.1098/rsta.2014.0160.
Proshutinsky, A., R. Krishfield, and M.‐L. Timmermans. Preface to special issue Forum for Arctic Ocean Modeling and Observational Synthesis (FAMOS) 2: Beaufort Gyre phenomenon. Journal of Geophysical Research: Oceans, 2019a, Vol. 124, doi: 10.1029/2019JC015400.
Proshutinsky, A., R. Krishfield, J.M. Toole, M.‐L. Timmermans, W. Williams, and S. Zimmermann et al. Analysis of the Beaufort Gyre freshwater content in 2003–2018. Journal of Geo-physical Research: Oceans, 2019b, Vol. 124, pp. 9658– 9689, doi: 10.1029/2019JC015281.
Richlen, M.L., O. Zielinski, L. Holinde, U. Tillmann, A. Cembella, Y. Lyu, and D.M. Anderson. Distribution of Alexandrium fundyense (Dinophyceae) cysts in Greenland and Iceland, with an emphasis on viability and growth in the Arctic. Marine ecology progress series, 2016, Vol. 547, pp. 33–46.
Sasgen, I., B. Wouters, and A.S. Gardner, et al. Return to rapid ice loss in Greenland and record loss in 2019 detected by the GRACE-FO satellites. Commun Earth Environ, 2020, Vol. 1, No. 8, doi: 10.1038/s43247-020-0010-1.
Schulze, L.M. and R.S. Pickart. Seasonal variation of upwelling in the Alaskan Beaufort Sea. Journal of Geophysical Research, 2012, Vol. 117, pp. C06022, doi: 10.1029/2012JC007985.
Shirshov, P. and E. Fedorov. Scientific work of the drifting north polar station. Nature, 1938, Vol. 141, pp. 629–632, doi: 10.1038/141629a0.
Spall, M.A., R.S. Pickart, M. Li, M. Itoh, P. Lin, T. Kikuchi, and Y. Qi. Transport of Pacific Water into the Canada Basin and Formation of the Chukchi Slope Current. Journal of Geophysi-cal Research, 2018, Vol. 123, pp. 7453–7471, doi: 10.1029/2018JC013825.
Straneo, F., G.S. Hamilton, L.A. Stearns, and D.A. Sutherland. Connecting the Greenland Ice Sheet and the ocean: A case study of Helheim Glacier and Sermilik Fjord. Oceanography, 2016, Vol. 29, No. 4, pp. 34–45, doi: 10.5670/oceanog.2016.97.
Sverdrup, H.U. and F.M. Soule. Scientific results of the ‘‘Nautilus’’ expedition. Pap. Phys. Oceanogr. Meteorol., 1933, Vol. 1, pp. 1–76, https://scholar.google.com/scholar?q=Sverdrup+and+Soule+%5B1933%5D&hl=en&as_sdt=0&as_vis=1&oi=scholart.

197
Океанологические исследования. 2020. Том 48. № 3. С. 164–198
Timmermans, M.L., R. Krishfield, S. Laney, and J. Toole. Ice-Tethered Profiler measurements of dissolved oxygen under permanent ice cover in the Arctic Ocean. Journal of Atmospheric and Oceanic Technology, 2010, doi: 10.1175/2010JTECHO772.1.
Timokhov, L. and F. Tanis (Eds). Environmental Working Group Joint U.S.-Russian Atlas of the Arctic Ocean–Winter Period. Environmental Research Institute of Michigan in association with the National Snow and Ice Data Center, 1997, Arctic Climatology Project, CD-ROM.
Toole, J.M., R.A. Krishfield, M.-L. Timmermans, and A. Proshutinsky. The Ice-Tethered Profiler: Argo of the Arctic. Oceanography, 2011, Vol. 24, No. 3, pp. 126–135, doi: 10.5670/oceanog.2011.64.
Von der Heydt, K. and A. Baggeroer. Fifteen years of Arctic acoustics and ice camps. Oceanus, 1994, Vol. 37. No. 2. pp. 2–6, ISSN 0029-8182.
Worcester, P.F., M.A. Dzieciuch, and H. Sagen. Ocean acoustics in the rapidly changing Arctic. Acoustics Today, 2020, Vol. 16, No. 1, pp. 55–64, doi: 10.1121/AT.2020.16.1.55.
Worthington, L. Oceanographic results of project SKIJUMP I and SKIJUMP II in the Polar Sea, 1951–1952. Eos, Transactions American Geophysical Union, 1953, Vol. 34, No. 4, pp. 543–551.
Yang, J., J. Comiso, D. Walsh, R. Krishfield, and S. Honjo. Storm‐driven mixing and potential impact on the Arctic Ocean. J. Geophys. Res., 2004, Vol. 109, pp. C04008, doi: 10.1029/2001JC001248.
Yang, J. The Arctic and Subarctic-Ocean Flux of Potential Vorticity and the Arctic Ocean circulation. Journal of Physical Oceanography, 2005, Vol. 35, pp. 2387–2407.
90 лет исследований северного ледовитого океана в вудсхольском океанографическом институте
Прошутинский а.Ю.1, тул дж.M.1, кришфилд р.а.1, андерсон д.м.1, ашджиан к.дж.1, Баггероер а.Б.1,2,
фрейтаг л.е.1, Пикарт р.с.1, фон дер хейдт к.1
1Вудсхольский океанографический институт, Вудс-Холл, Массачусетс 02543, США, е-mail: [email protected] 2Массачусетский технологический институт, Кембридж,
Массачусетс 02139, США, е-mail: [email protected] Статья поступила в редакцию 30.08.2020, одобрена к печати 28.10.2020.
В 2020 г. Вудсхольский океанографический институт (WHOI) отмечает 90-летие своего образования, исследований и освоения Мирового океана. Исследование Арктики входило в деятельность WHOI с самого начала. Фактически, первый же технический отчет WHOI касается океанографических данных, полученных во время полярной экспедиции подводной лодки «Наутилус» в 1931 г. В 1951 и 1952 гг. ученые WHOI руководили сбором гидрографических данных во время экспедиций ВМС США SkiJump I и II с использованием самолетов, оборудованных лыжным шасси для посадки на лед в море Бофорта, в результате чего сделали вывод о наличии ячейки циркуляции вод в море Бофорта и существовании срединно-арктического хребта. Несколько позднее персоналом WHOI на дрейфующих ледовых станциях ВМФ и ВВС США были проведены засекреченные исследования, в основном касающиеся подледной акустики. Начиная с 1987 г., когда появилась спутниковая связь, что существенно упростило и передачу информации, и определение местоположения,

198
Прошутинский А.Ю. и др.
океанографы WHOI стали развертывать буи на морском льду для получения временных рядов данных о приповерхностной атмосфере, льде и верхнем слое океана в центральной части Арктики. Из-за технологических ограничений, потребляемой мощности, пропускной способности спутника, а также высоких затрат, наблюдения с использованием первых систем ограничивались лишь дискретным набором глубин. Но, по мере совершенствования технологий, WHOI разработал дрейфующий, предназначенный для установки на лед профилограф, Ice-Tethered Profiler (ITP), для получения несколько раз в день уже вертикально непрерывных данных о верхних слоях океана в покрытых льдом бассейнах с передачей данных в лабораторию почти в режиме реального времени. С 1980-х гг. ученые WHOI также участвовали в геологических, биологических, экологических и геохимических исследованиях арктических вод, как правило, в экспедициях с использованием ледокольных судов, либо с дрейфующих платформ, снабжаемых авиационным транспортом. С 2000-х гг. WHOI устанавливает на постоянной основе океанографические буйковые станции на шельфе моря Бофорта, а также на большей глуби не в Канадском бассейне. Эти станции являются элементами системы наблюдений за круговоротом моря Бофорта (BGOS). BGOS обслуживает эти океанографические станции, используя ледоколы, и каждое лето проводит ежегодные гидрографические и геохимические исследования для документирования области воды пониженной солености в море Бофорта, которая значительно изменилось по сравнению с более ранними исследованиями 1950–1980-х гг. С накопленным опытом и результатами, получен-ными за последние десятилетия продвижения исследований Арктики, ученые WHOI нахо дятся в наилучшем положении для продолжения изучения полярных океанов в предстоящие десятилетия.
ключевые слова: история Северного Ледовитого океана, методы наблюдений, аппаратура, акустика, океанография, морской лед, биология, геология, геохимия, WHOI
Благодарности. Финансирование Прошутинского А.Ю., Тула Дж.M. и Кришфилда Р.А. было предоставлено Управ лением полярных программ Националь-ного научного фонда (NSF-1845877); Компания Баггероера А.Б. финансировалась по программе ONR по акустике Северного Ледовитого океана. Финансирование Андерсона Д.М. было предоставлено Программой исследований в Арк тике NOAA через Объединенный институт Североатлантического региона (CINAR Award NA14OAR4320158) и Управлением полярных программ Национального научного фонда (OPP-1823002). Ашджиан К.Дж. поддерживался Офисом Национального научного фонда Полярные программы (OPP-0124766, OPP-0124763, OPP 0909368, OPP-1603941, PLR-1023331, OPP-043613 и OPP-1824447). Работа Фрейтаг Л.Е. фи-нансировалась Управлением военно-морских исследований по контрактам N00014-12-1-0176 и N00014-16-I-2347. Мы хотели бы поблагодарить наших сотрудников: Питера Вустера и Мэтью Дзиечука из Океанографического института Скриппса, Ханне Саген из Центра окружающей среды и удаленности Нансена (Норвегия) и ученых группы арктических исследований WHOI (Роберт Бердсли, Марко Ку-лен, Сара Дас, Ребекка Гаст, Джеффри Гебби, Роберт Громан, Ллойд Кейгвин, Сэм Лэйни, Кристофер Линдер, Криста Лонгнекер, Тед Максим, Энн МакНикол, Аран Муни, Бернхард Пойкер-Эренбринк, Эл Плюддеман, Роб Ревс-ЗоудманМинди Ричлен, Хёдэ Сео, Ханумант Сингх, Майк Сполл, Рэйчел Стэнли, Роберт Веллер, Цзяян Ян, Лисан Ю и Вэйфэн Чжан) за предоставленные материалы, результаты и рекомендации по подготовке данной статьи.