Embed Size (px)
Citation preview

9th California Unified Program Training ConferenceGarden Grove, California
February 13, 2007 – Green Technology Course
Green Chemistry in California: A Framework for Leadership in Chemicals Policy and Innovation
Michael P. Wilson, Ph.D, MPH
Center for Occupational and Environmental Health
University of California, Berkeley

2
• Toxicology
• Epidemiology
• Industrial hygiene
• Environmental health policy
• Occupational and environmental medicine
• Occupational health nursing
• Ergonomics
• Labor occupational health education
• Continuing professional education
Center for Occupational and Environmental Health
Est. 1978 (AB 3414)
Berkeley, Davis, San Francisco (northern California).
The University of California, Berkeley

3
The challenge of chemicals policy: Hexane/acetone-induced neurological disease in the California vehicle repair industry.
Harrison et al. MMWR, Nov 16, 2001, Vol 50 #5The University of California, Berkeley

4
Ladefoged et al. 1994. Pharm and Tox. 74:294-299.
The University of California, Berkeley

5
8h TWA breathing zone exposure concentration, mg/m3 (n=23)
0 10 20 30 40 50 60 70 80
Hexane
Acetone
TolueneToluene
Hexane
Acetone
The University of California, Berkeley
6
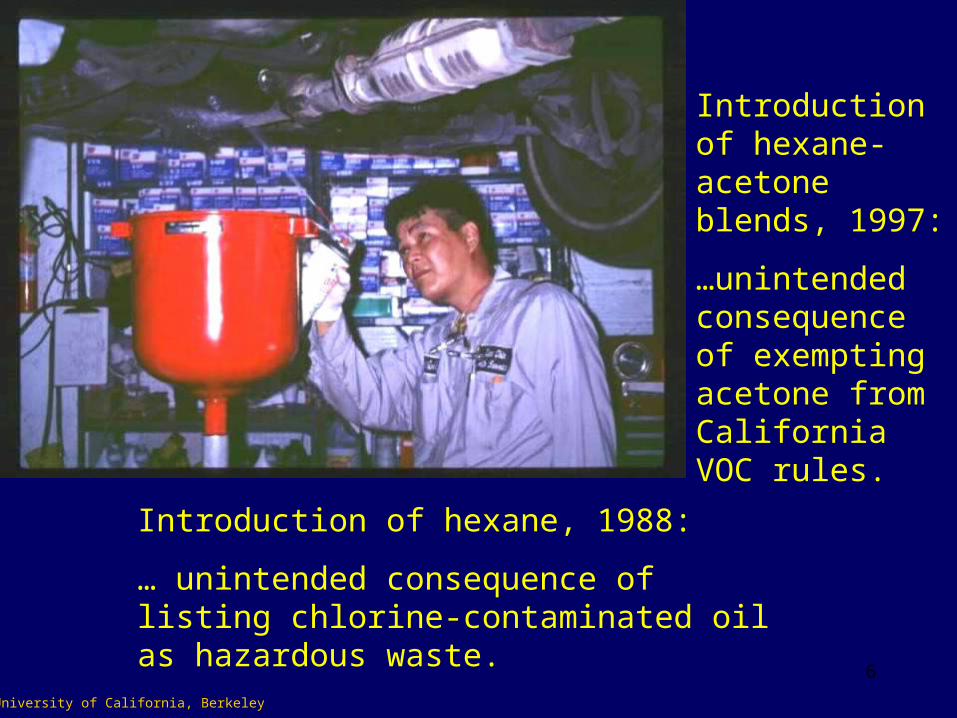
Introduction of hexane, 1988:
… unintended consequence of listing chlorine-contaminated oil as hazardous waste.
The University of California, Berkeley
Introduction of hexane-acetone blends, 1997:
…unintended consequence of exempting acetone from California VOC rules.

7
1970: Stoddard solvent Fire hazard1978: CFCs Ozone depletion1990: Methylene chloride Carcinogen1990: 1,1,1-Trichloroethane Ozone depletion1991: Perchloroethylene and hexane Dioxin emissions1997: Hexane/acetone blends Neurotoxin2003: 1-Bromopropane Repro toxin
Chemical management in the CA vehicle repair industry
The University of California, Berkeley

8
Stage 1: Disposal and dilution
Stage 2: Waste treatment and pollution control
Stage 3: Toxics policy (chemical-by-chemical approaches; e.g. hexane case)
Stage 4: Chemicals policy (transparency, accountability, chemical design, markets, life
cycles)
Chemical management over the last 30 years
The University of California, Berkeley

Commissioned January 2004 by:• Byron Sher (Chair, SEQC) • John Laird (Chair, ACESTM)
UC Chemicals Policy Report• Assesses problems and opportunities in chemicals policy• Proposes broad policy goals
Released to Legislature March 14, 2006 to:• Joseph Simitian (Chair, SEQC)• Ira Ruskin (Chair, ACESTM)
Download etc: http://coeh.berkeley.edu/news/06_wilson_policy.htm
The University of California, Berkeley

10
John R. Balmes, MDSchool of Medicine, UC San Francisco
Carl F. Cranor, PhD Department of Philosophy, UC Riverside S. Katharine Hammond, PhDSchool of Public Health, UC Berkeley
Bill E. Kastenberg, PhDCollege of Engineering, UC Berkeley Ann Keller, PhDSchool of Public Health, UC Berkeley
Amy D. Kyle, PhD, MPHSchool of Public Health, UC Berkeley
Geoff Lomax, DrPHDepartment of Health Services
Timothy Malloy, JD School of Law, UC Los Angeles Thomas E. McKone, PhD Lawrence Berkeley National Laboratory Dara O’Rourke, PhD College of Natural Resources, UC Berkeley Julia Quint, PhDDepartment of Health Services Christine Rosen, PhD Haas School of Business, UC Berkeley David J. Vogel, PhD Haas School of Business, UC Berkeley
Advisory Committee Members
11
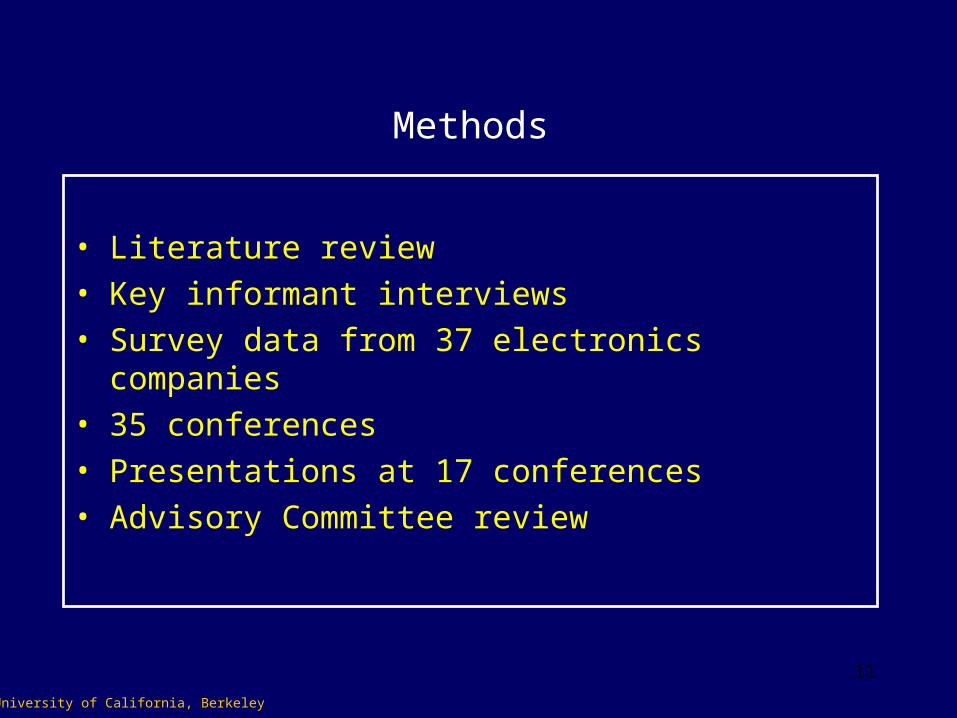
Methods
• Literature review
• Key informant interviews
• Survey data from 37 electronics companies
• 35 conferences
• Presentations at 17 conferences
• Advisory Committee review
The University of California, Berkeley

12
Plastic resins
Organics
Industrial chemicals
Fertilizers
Consumer products
Inorganics
Basic chemicals
Specialty chemicals
Other Inorganics
Alkalies & chlorine
Inorganic pigments
Acids
Coatings
Synthetic materials
Others
Industrial gases
Adhesives & sealants
Pharmaceuticals
Crop protection
Consumer use
Professional & industrial use
Man-made fibers
Synthetic rubber
Petrochemicals & derivatives
Life sciencesSource: American Chemistry Council, Guide to the
Business of Chemistry, 2003
Scope

13
Report’s findings are similar to those of:
• National Academy of Sciences 1984
• U.S. General Accounting Office 1994
• Congressional Office of Technology Assessment 1995
• Environmental Defense 1997
• U.S. EPA 1998
• former EPA officials 2002
• RAND Science and Technology Institute 2003
• U.S. Government Accountability Office 2005
• National Academy of Sciences 2005
The University of California, Berkeley

14
Environmental Policy Developments in the European Union
- Cosmetics Directive: 2004
- Waste in Electrical and Electronic Equipment (WEEE): 2005
- Restriction on Hazardous Substances (RoHS): 2006
- Registration, Evaluation, Authorization of Chemicals (REACH): 2007
The University of California, Berkeley

15Electronic waste recovery workers, Guiyu, China
Courtesy Basel Action NetworkThe University of California, Berkeley

16
Registration: tiered tox and use data
Authorization: for CMR, PBT, vPvB
Evaluation: >100 tons/year
About 30,000 chemicals
Data requirements depend on volume
3, 6, 11-yr phase-in
About 1,400 – 2,000 “chemicals of very high concern” (no 1 ton trigger for these)
De-authorization: inadequate control
Authorization
De-authorization: benefit too small
Chemicals produced or imported at >1
ton/year/producer
E.U. REACH
About 5,000 chemicals

17
AB 121 (Vargas) AB 263 (Chan) AB 289 (Chan) AB 319 (Chan) AB 342 (Baca) AB 597 (Montanez)AB 623 (Aanistad) AB 639 (Aghazarian) AB 752 (Karnette) AB 815 (Lieber) AB 816 (Lieber) AB 848 (Berg)
AB 908 (Chu) AB 912 (Ridley-Thomas) AB 966 (Saldana) AB 985 (Dunn) AB 990 (Lieber) AB 1125 (Pavley) AB 1337 (Ruskin) AB 1342 (Assem ESTM) AB 1344 (Assem ESTM) AB 1354 (Baca) AB 1415 (Pavley) AB 1681 (Pavley)
35 chemically-related bills in California, 2005-2006
SB 419 (Simitian) SB 432 (Simitian) SB 484 (Migden) SB 490 (Lowenthal) SB 600 (Ortiz) SB 838 (Escutia) SB 849 (Escutia) SB 982 (Sen EQ comm) SB 989 (Sen EQ comm.) SB 1067 (Kehoe) SB 1070 (Kehoe)
The University of California, Berkeley

18
20
25
30
35
40
45
50
55
60
1990 2000 2010 2020 2030 2040 2050
Mill
ions
California’s expected population growth, 1990-2050
2006 = 36 million
Source: California Dept of Finance, CA pop. trends, 1990 – 2050 The University of California, Berkeley

19
1) What is the problem?
2) What is the cause of the problem?
3) How can we respond to these problems?
The University of California, Berkeley
Green Chemistry in California: A Framework for Leadership in Chemicals Policy and Innovation.

20
Public environmental
health
Workers
Children
Consumers
Industry & business
Downstream users
The Legislature
Municipal agencies
The University of California, Berkeley
Chemical producers
GovernmentState
agencies
Green chemistry

21
1) What is the problem?
– Data Gap: The market “undervalues” the hazardous properties of chemicals relative to their function, price, and performance.
– Safety Gap: Government is unable to assess chemical hazards and control those of greatest concern.
– Technology Gap: The U.S. private sector is investing minimally in cleaner chemical technologies, such as green chemistry.
The University of California, Berkeley
Green Chemistry in California: A Framework for Leadership in Chemicals Policy and Innovation.

22
2) What is the cause of the problem?
– We have federal statutes…
– that do not require transparency and accountability.
– This has produced a chemicals market…
– that allows potentially hazardous chemicals to remain competitive.
The University of California, Berkeley
Green Chemistry in California: A Framework for Leadership in Chemicals Policy and Innovation.

23
• Data Gap: – TSCA (and FFDCA) do not require producers to generate and
disclose chemical hazard data for government or downstream users.
• Safety Gap:– TSCA (and FFDCA) have constrained government’s ability to
efficiently assess and control chemical hazards.
• Technology Gap:– The resulting chemicals market has dampened private sector interest
in green chemistry, as reflected in R&D funding and in education.
The federal Toxic Substances Control Act of 1979.
The University of California, Berkeley

24
Function
HazardsPerformance
Price
The University of California, Berkeley
Example 1. Data Gap
Downstream users
To make informed decisions about chemicals, buyers need four pieces of information:

25
Function
SafetyPerformance
Price
The University of California, Berkeley
In the present market, hazard information (e.g. toxicity) is largely missing.
26
The University of California, Berkeley
Identity
HazardsUses
Sales volume
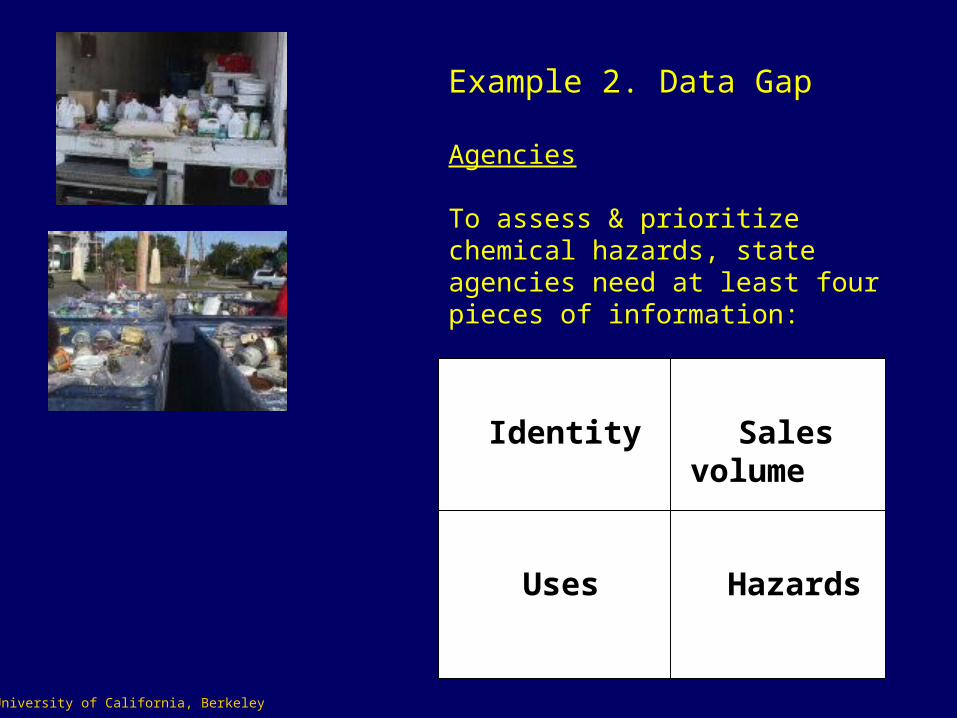
Example 2. Data Gap
Agencies
To assess & prioritize chemical hazards, state agencies need at least four pieces of information:

27
The University of California, Berkeley
This information is unavailable to agencies in California and other states.

28
Scientific suspicion of harm
Reasonable grounds for concern
Balance of evidence
Clear evidence of risk; risks outweigh benefits
The University of California, Berkeley
Example 3. Safety Gap
• Under TSCA (& FFDCA), government carries the burden of proving risk…
• yet producers are under no obligation to provide the information necessary for government to do so…
• which produces a logical paralysis.

29
The University of California, Berkeley
Why? Because university teaching and research in chemistry reflect conditions in the chemicals market.
Example 4. Technology Gap.
With very few exceptions, one can earn a Ph.D in chemistry in the U.S. without demonstrating a basic understanding of toxicology…
…or the principles of green
chemistry. Sather Gate, UC Berkeley

30
• Total daily U.S. chemical production and importation: = 42 billion pounds (623,000 tankers) (TSCA IUR).
• Total daily California sales of chemical products alone: = 644 million pounds (inc. water) (2,700 tankers) (CA ARB).
The University of California, Berkeley

31
The workplace Consumer products Waste streams
Global trade
Ecosystems: air, water, food, soil
The University of California, Berkeley

32
Public health issues related to chemicals
• Hazardous waste: 600 new hazardous waste sites needed each month in U.S. up to 2033 (77,000 today) ($250 billion). CA DTSC: 975 employees working on hazwaste, 25 on poll prevention; emerging “dumping ground” issue.
• Workers: Yearly CA morbidity (23,000) and mortality (6,500). PELS for only 193 of 2,800 HPV chemicals (~7%).
• Bioaccumulative chemicals: 688 found by EPA; CDC; CA SB 1379 (Perata).
• New pediatric morbidity estimates: Asthma (10-35%), certain cancers (2-10%), neurodevelopmental disorders (5-20%) related to chemical exposures.
• Endocrine disruption: Early human evidence, substantive animal evidence.
• Umbilical cord blood: Early studies showing presence of many chemicals.
The University of California, Berkeley

33
Global chemical production is expected to double every 25-years.
0
100
200
300
40019
92
1994
1996
1998
2000
2002
2004
2006
2008
2010
2012
2014
2016
2018
2020
2022
2024
2026
2028
2030
Production index = 131 today, where 1997 = 100
Production index = 231 in 2022, where 1997 = 100
The University of California, Berkeley

34
3) How can we respond to these problems?
– Chemicals policy to re-orient the market to green chemistry.
The University of California, Berkeley
Green Chemistry in California: A Framework for Leadership in Chemicals Policy and Innovation.

35
Will E.U. policies result in E.U. competitive advantage in cleaner technologies, such as green chemistry? Other issues:
- U.S. competitiveness in these areas?
- Potential for U.S. to become “dumping ground?”
- Will E.U. policies create “uneven playing field” among U.S. companies?
- Will states begin to leverage E.U. databases to implement new policy?
- Increased activity by U.S. NGOs for chemicals policy reform?
- How will the chemicals market respond to new hazard information?
- Will pressure increase to reform TSCA, FFDCA?
The University of California, Berkeley
Cosmetics,WEEE, RoHS, REACH, others China RoHS, 2007
Korea RoHS, 2007
Japan RoHS, 2006
CA RoHS, 2007

36
“G.E. Chief Points to ‘Green’ Handicap”
“…the deregulatory agenda favored by the U.S. business community – particularly on environmental issues – is not providing American companies with a competitive advantage over their European
counterparts.”
Financial TimesMay 10, 2005
Stephanie Kirchgaessner in Washington
Jeffrey Immelt, Chairman and CEO (Ecomagination)The University of California, Berkeley

37
0
2,000
4,000
6,000
8,000
10,000
12,000
14,000
1960
1962
1964
1966
1968
1970
1972
1974
1976
1978
1980
1982
1984
1986
1988
1990
1992
1994
1996
1998
2000
2002
2004
United States
California
A systems approach is needed to produce enduring changes in the chemical sector. Example: electricity use.
Total electricity use per capita, kWh, 1960 - 2002
The University of California, BerkeleyCourtesy John Wilson, CA Energy Commission

38
The design of chemical products and processes to reduce and/or eliminate substances hazardous to human health and the environment.
12 principles proposed by Anastas &Warner.
Anastas, P.T. and J. Warner. 1999. Green Chemistry Theory and Practice
The University of California, Berkeley

39
The University of California, Berkeley
• From a policy perspective,
• green chemistry links public & environmental health…
• with new business & investment opportunities.

40
UC chemicals policy analysis
Barriers to green chemistry Drivers of green chemistry
The University of California, Berkeley

41
UC chemicals policy analysis
Barriers to green chemistry Drivers of green chemistry
Data Gap
TSCA, other statutes
Buyers: no haz data Sellers: no case for GC
Safety Gap Tech. Gap
Markets Government
Inability to assess haz Inability to control haz
- Hazard undervalued against price, function - Hazardous chemicals competitive in market - Green chemistry innovation impeded

42
UC chemicals policy analysis
Barriers to green chemistry Drivers of green chemistry
E.U. Directives
Downstream users
Industry leaders
Public opinion
Green chem.
entrepreneurs
California Legislature
Government procurement
NGO activity
Climate change
National Academy
The University of California, Berkeley

43
UC chemicals policy analysis
Policy objectives: Close the Data, Safety & Technology Gaps: * Improve the flow of information in the chemicals market. * Improve government capacity to act. * Implement other incentives for green chemistry.
Issues, models, mechanisms: * Leverage market forces. * Address chemical life cycle. * Place least demands on government. * Motivate technology innovation and diffusion, etc.
Recommendations
Barriers to green chemistry Drivers of green chemistry
The University of California, Berkeley

44
UC chemicals policy analysis
Policy objective
Ideal mechanisms
Recommendations
In choosing not to act: * Existing problems will expand in California. * U.S. & California could become “dumping ground.” * CA will cede leadership in green chemistry.
Drivers of green chemistryBarriers to green chemistry
The University of California, Berkeley
Thank you!
The University of California, Berkeley