Embed Size (px)
Citation preview

Head Office: 1st Floor 159 Coronation Drive Milton QLD 4064 Australia PO Box 1824 Milton BC QLD 4064 Australia
Telephone: + 61 7 3367 7800 | Facsimile: + 61 7 3367 7899 | www.transpacific.com.au
9 October 2013 Company Announcements Office ASX Limited Dear Sirs, Please find attached a presentation to be made by Stewart Cummins, Chief Financial Officer of Transpacific Industries Group Ltd, to the RBS Morgans 2013 Queensland Conference commencing at 4pm today. Yours sincerely Transpacific Industries Group Ltd
Chris Carroll Company Secretary
Transpacific Industries Group Ltd ABN: 74 101 155 220
Level 1, 159 Coronation Drive MILTON QLD 4064 PO Box 1824 MILTON QLD 4064
Phone: + 61 7 3367 7800 Fax: + 61 7 3367 7878
For
per
sona
l use
onl
y

Presentation by
Stewart Cummins
Chief Financial Officer
9 October 2013
RBS Morgans 2013 Queensland Conference
For
per
sona
l use
onl
y

2
Agenda
1. Introduction
2. Divisional Overview
3. Improving Financial Metrics
4. Business and Operational Review
5. FY14 Agenda
For
per
sona
l use
onl
y

3
1. Introduction
Transpacific is Australia and New Zealand’s leading waste management business, operating a national network of unique collection, processing and landfill assets
Over the past three years a number of actions have been taken to strengthen the Company
Our priorities have been: Improving the financial metrics Sell surplus assets and non-core businesses Achieve operational cost savings
These priorities remain but the transformation of Transpacific will be
accelerated via implementation of the recommendations arising from the Business and Operational Review
For
per
sona
l use
onl
y

4
Waste Management Operations
Core segment activities
2. Divisional Overview
Industrials Australia
New Zealand Commercial
Vehicles Manufacturing Cleanaway
Municipal Collections
C&I Collections
Post Collections
Technical Services
Industrial Solutions
Hydrocarbons
Collections and Post Collections
Technical & Industrial Services
Importation & Distribution
Dealership
Dealer Network
Metals Manufacturing
Plastics Manufacturing
Our operating structure has changed since 30 June 2013
Non-core Operations
Non-core segment activities
For
per
sona
l use
onl
y

5
Municipal Collections C&I Collections Post Collections
Councils typically award 5-10 year contracts to collect residential waste
Disposal options are generally mandated by the council, often ending up in their own landfills
174.3 183.6 180.1 199.0
0
100
200
300
400
500
600
FY10 FY11 FY12 FY13
Revenue ($M)
479.1
540.7 570.6 589.9
0
100
200
300
400
500
600
FY10 FY11 FY12 FY13
Revenue ($M)
Customers range from local small businesses to large national corporate accounts across all industries
Contract duration typically ranges from 1-5 years. Route density and close access to competitive disposal costs key to success
Operation of transfer stations, material recycling facilities, advanced resource recovery and landfill for solid waste
Gate fees are highly variable reflecting state government levies and local factors
125.4 136.2 143.1 135.5
0
100
200
300
400
500
600
FY10 FY11 FY12 FY13
Revenue ($M)
Divisional Overview: Cleanaway F
or p
erso
nal u
se o
nly

6
Collection, treatment, recycling and safe disposal of liquid and prescribed waste
Liquid waste is highly variable from low volume, high value hazardous waste to low value, high volume waste such as grease traps and biosolids
158.9 161.8 159.8 162.2
0
50
100
150
200
250
FY10 FY11 FY12 FY13
Revenue ($M) 244.2 247.8 242.0
226.0
0
50
100
150
200
250
FY10 FY11 FY12 FY13
Revenue ($M)
Services include vacuum handling, high pressure water blasting, catalyst services, hydro excavation, industrial cleaning and facility maintenance
Major supplier of emergency response services
Collection, treatment and re-sale of used lubricants and oils
The sales price for processed oil products linked to the international market index ICIS LOR, exchange rates and government subsidies (PSO)
112.0
137.5 141.4 135.4
0
50
100
150
200
250
FY10 FY11 FY12 FY13
Revenue ($M)
Technical Services Industrial Solutions Hydrocarbons
Divisional Overview: Industrials F
or p
erso
nal u
se o
nly

7
Consists of solid waste collection, processing and disposal operations servicing municipal, private residential, commercial and construction customers
Post collection assets located on both the North and South Islands
Consists of businesses serving commercial, industrial and municipal customers and providing:
Collection, treatment and disposal of hazardous liquids
Collection, processing and disposal or sale of black oil and solvents
Services including vacuum handling, high pressure water blasting, emergency spills response, industrial cleaning, facility maintenance and street sweeping
99.1 110.6 101.5 95.7
0
100
200
300
400
FY10 FY11 FY12 FY13
Revenue (NZ$M)
Collections and Post Collections
Technical & Industrial Services
305.7 343.9 332.3 342.2
0
100
200
300
400
FY10 FY11 FY12 FY13
Revenue (NZ$M)
Divisional Overview: New Zealand F
or p
erso
nal u
se o
nly
8
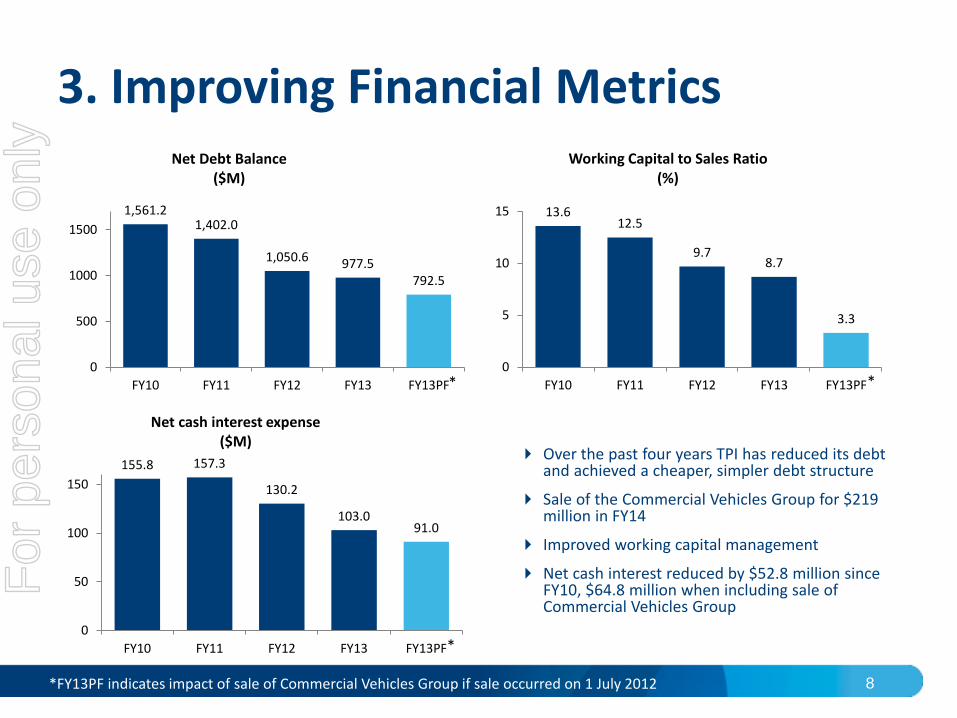
1,561.2 1,402.0
1,050.6 977.5 792.5
0
500
1000
1500
FY10 FY11 FY12 FY13 FY13PF
Net Debt Balance ($M)
13.6 12.5
9.7 8.7
3.3
0
5
10
15
FY10 FY11 FY12 FY13 FY13PF
Working Capital to Sales Ratio (%)
155.8 157.3
130.2
103.0 91.0
0
50
100
150
FY10 FY11 FY12 FY13 FY13PF
Net cash interest expense ($M)
*
Over the past four years TPI has reduced its debt and achieved a cheaper, simpler debt structure
Sale of the Commercial Vehicles Group for $219 million in FY14
Improved working capital management
Net cash interest reduced by $52.8 million since FY10, $64.8 million when including sale of Commercial Vehicles Group
* *
*FY13PF indicates impact of sale of Commercial Vehicles Group if sale occurred on 1 July 2012
3. Improving Financial Metrics F
or p
erso
nal u
se o
nly
9
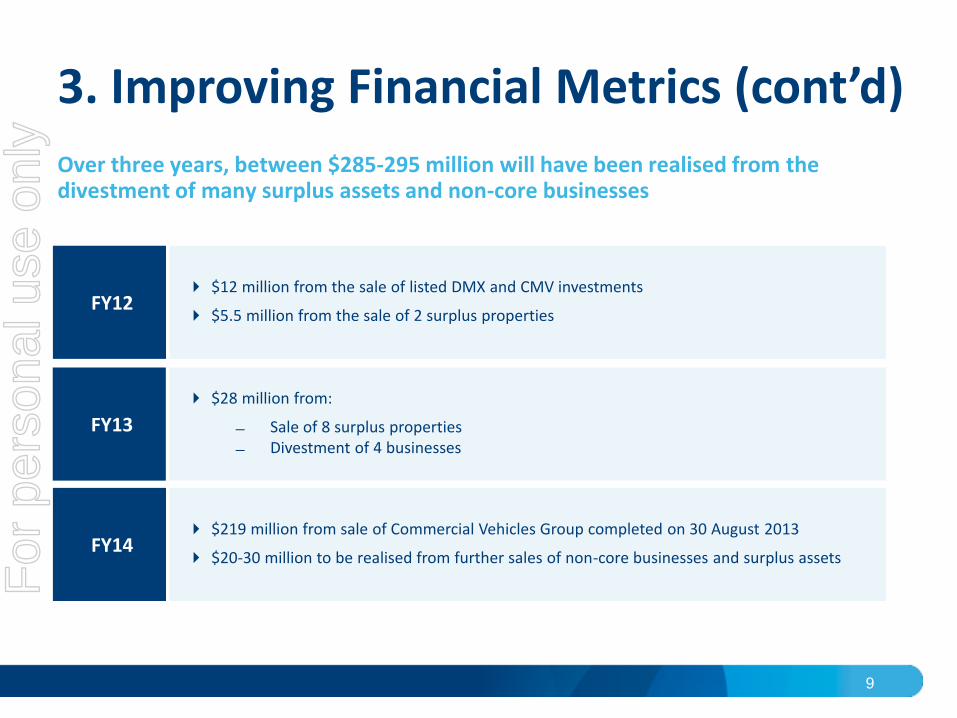
FY12 $12 million from the sale of listed DMX and CMV investments
$5.5 million from the sale of 2 surplus properties
FY13
$28 million from:
Sale of 8 surplus properties Divestment of 4 businesses
FY14 $219 million from sale of Commercial Vehicles Group completed on 30 August 2013
$20-30 million to be realised from further sales of non-core businesses and surplus assets
Over three years, between $285-295 million will have been realised from the divestment of many surplus assets and non-core businesses
3. Improving Financial Metrics (cont’d) F
or p
erso
nal u
se o
nly
10
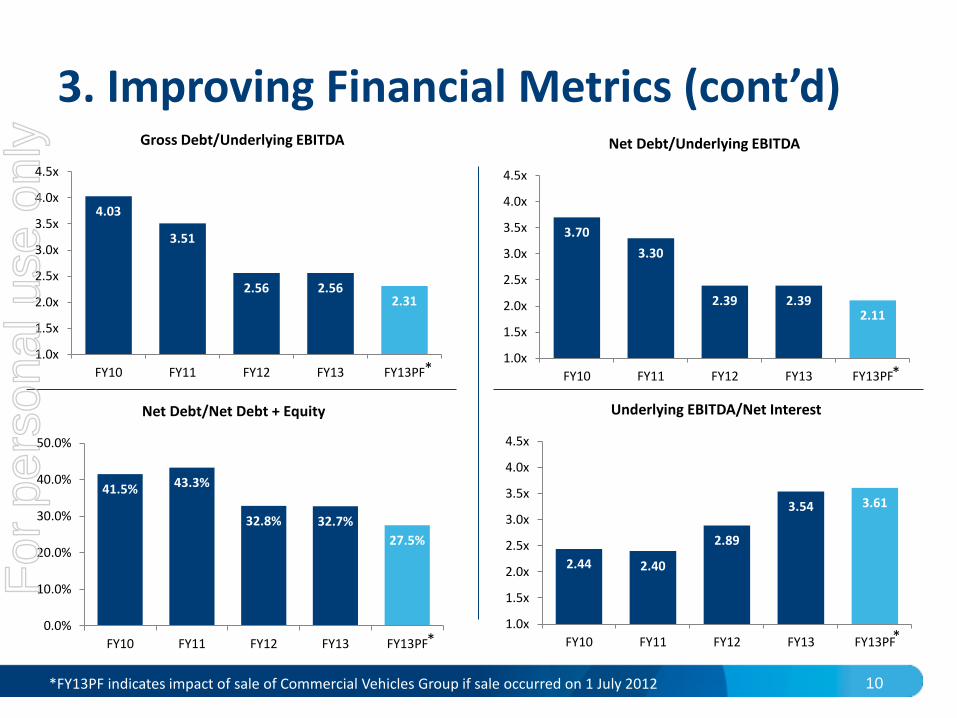
4.03
3.51
2.56 2.56 2.31
1.0x
1.5x
2.0x
2.5x
3.0x
3.5x
4.0x
4.5x
FY10 FY11 FY12 FY13 FY13PF
Gross Debt/Underlying EBITDA
*
3.70
3.30
2.39 2.39 2.11
1.0x
1.5x
2.0x
2.5x
3.0x
3.5x
4.0x
4.5x
FY10 FY11 FY12 FY13 FY13PF
Net Debt/Underlying EBITDA
*
41.5% 43.3%
32.8% 32.7%
27.5%
0.0%
10.0%
20.0%
30.0%
40.0%
50.0%
FY10 FY11 FY12 FY13 FY13PF
Net Debt/Net Debt + Equity
*
2.44 2.40
2.89
3.54 3.61
1.0x
1.5x
2.0x
2.5x
3.0x
3.5x
4.0x
4.5x
FY10 FY11 FY12 FY13 FY13PF
Underlying EBITDA/Net Interest
*
*FY13PF indicates impact of sale of Commercial Vehicles Group if sale occurred on 1 July 2012
3. Improving Financial Metrics (cont’d)
For
per
sona
l use
onl
y

11
Procurement
savings
Productivity
Organisational
structure
Amalgamated sites
Biometric time and attendance system
Fleet management system
Implemented organisational restructure resulting in fewer layers and wider spans of control
Reduction of circa 200 staff
Improved pricing and terms from major suppliers:
Fuel contracts in Australia and New Zealand Temporary labour hire suppliers rationalised from
>450 to 42 in Australia and New Zealand Electricity and gas contracts in Australia
Sustainable EBIT Impact FY13 – FY15
FY13 – $15 million
FY14 – $20 million
FY15 – $15 million
Major Initiatives Areas
Total savings
$50 million
Cost savings and efficiencies that will eventuate from the Business and Operational Review are not included in these targets
3. Improving Financial Metrics (cont’d)
Our aim is to reduce costs and increase operating efficiency
For
per
sona
l use
onl
y

12
Key areas of focus
Portfolio strategy
Performance
improvement
The review identified 42 businesses across Australia and New Zealand which are either non-core or under-performing and are proposed to be sold or closed in FY14
These businesses represent 13% of the Company’s branch network but only generated 7% of waste management revenues and 0% of EBIT in FY13
Proceeds from businesses sold expected to be $20-30 million
Will enhance focus on core waste management businesses and streamline and reduce complexity within the Company
Review focused on improving performance across the Company
Detailed scoping and implementation planning underway
Management and the Board are currently considering these opportunities in more detail
Capital allocation
The review focused on options where the Company should allocate capital to achieve superior returns
Detailed scoping and implementation planning underway
4. Business and Operational Review
The review is being used to accelerate TPI’s transformation program
1
2
3
For
per
sona
l use
onl
y

13
Performance improvement
Delivering on the next phase of the sustainable cost savings targets – a further $20 million of the $50 million indicated in February 2013
Additional performance improvement benefits to flow from implementing the recommendations from the Business and Operational Review
Divestments and asset sales
$20-30 million to be realised from sale of surplus assets and non-core businesses
Debt reduction and interest cost savings
Debt reduction will continue
Approximately $185 million (net) from the sale of Commercial Vehicles Group
Further debt repayment of circa $100 million
Refinancing of November 2014 debt maturities
Reduce total interest costs by $25 million in FY14 by lower debt and termination of certain interest rate hedges
5. FY14 Agenda F
or p
erso
nal u
se o
nly