Embed Size (px)
Citation preview

Journal of Business and Economics, ISSN 2155-7950, USA February 2014, Volume 5, No. 2, pp. 231-244 Academic Star Publishing Company, 2014 http://www.academicstar.us
231
The Development of Decision-support Model for the New Oil Station Based
of Geographical Information System
Hening Widi Oetomo
(School of Economics Indonesia (STIESIA), Surabaya, Indonesia)
Abstract: The purpose of this research is to find out the new location of oil station. The measurement is
conducted by looking at the level of demand and supply at the new location. The level of demand measured by
surrounding activity within the radius of 500 meters from the new location of the oil station. The activity level is
measured by considering the number of trading centers, financial centers and education centers within the radius
of 500 meters from the new location. The supply measurement is done by measuring the level of competitionsata
particular oil station location. The level of supply is measured by counting the number of oil stations within the
radius of 500 meters. The research methodology in order to measure the location feasibility is using index model.
First, it is evaluating the level of relative important in each criteria to other criteria. Second, the data is
standardized on each criteria. Finally, it is counting index value by adding up the multiplication among other
criteria with each criteria standard value. The highest index value is 5 meaning that is highly feasible while the
lowest value is 1 meaning that it is the least feasible.
Key words: oil station; demand supply; index model; GIS
JEL code: M21
1. Introduction
The issuance of business license for foreign oil companies Shell and Petronas cause the national oil company,
PERTAMINA (Indonesia Oil Company), to be more cautious in handling oil stations under their management. If
the investor of oil station finds that managing PERTAMINA’s oil station is become less profitable, then they will
tends to think about moving on another company, in this case, Shell or Petronas, should those companies are
promising a better fortune. It needs to be considered seriously because as new comers, they will set a strategy of
giving a higher incentive rather than PERTAMINA. The investor of these foreign companies then, in the next stage,
will give a better incentive to their customers. It might be in the form of free gifts, price cuts or better services, and
a cozy atmosphere in the oil station complete with convenient store as they had had in Malaysia, their country of
origin. Should this scenario is executed then it will be a threat to be reckon with by PERTAMINA as one of our
national asset. This paper therefore will have its focused on how to determine a more sustainable location for the
new oil station, so it can be beneficial for all parties: PERTAMINA, oil station investor and for the consumers, and
will be able to compete with those foreign companies which have had the business license in Indonesia.
People of Indonesia have an interest in the existence of oil station in order to support their need of
Hening Widi Oetomo, Ph.D., Professor, STIESIA Surabaya; research areas: economic geography. E-mail:[email protected].

The Development of Decision-support Model for the New Oil Station Based of Geographical Information System
232
transportation, either individual or public transportation. However, as we know recently that the oil station is now
over-growing, causing the lack of profit for some of oil station. Society, as a consumer, had suffered for about 43
billion rupiah lost per year due to the fraud committed by oil station (Pikiran Rakyat, July 26th 2006), in form of
dose reduction by using several kind of technology. One of the contributing factor that caused this fraud is
location factor, where if the distance between one oil station with the other is too close, then it will lead to
decreased turnover on each oil station. In Surabaya, for instance, there are two oil stations that are separated by
distance which is less than 500 meter (Jawa Pos, December 4th 2007). This paper is strive to design a
decision-support model for the new oil station based on Geographic Information System (GIS) by considering
economic and geographic factor so that it is possible for the new oil station to avoid this decreased turnover
problem. This economic factor is important because it’s concerned of a long-time prospect, where theoretically,
once a business is established then it is expected to have a long life cycle. Meanwhile, geographic factor is
expected to support this life cycle to stay longer considering the ease of location accessibility and comfort level of
the business. The location selection is a very critical process in every company as this decision determines the
sustainability of the company itself. The fault on choosing a company location cannot be shortly changed because
it involving a huge investment and had an impact on the whole company strategies (Zainab et al., 1996). With the
result of this paper it is expected that the fault of location-choosing is not to be happen again.
The main problem on this paper is how to design Decision Support for the new oil station based of
Geographical Information System.
2. Literature Study
Based on PERTAMINA’s early survey result, the establishment of new oil station is still paying less attention
in location factor, proved by the existing of two oil station that separated by the distance less than 500 meters.
Therefore, by using geographic information technology, a circumstance in particular radius is able to be viewed
visually. Those circumstances may include education center, trade center, and oil station nearby the new location
planning, street direction and traffic condition. The significance of location and the capability of GIS in measuring
and analyze appropriateness of a location will be discussed as follow:
2.1 Location
Location is a critical factor that determine the whether one company will be success or not (Bolen, 1988).
The location selection for a company is an effort in order to get customers. Location is capable to determine
appropriateness and ease of customer to get the products. Location selection is closely related with way of
attracting customers into the company. A correct way of selecting location is therefore become very important,
that is by searching a spot in the area of which the best market prospect after indentifying some particular region
(Hasty & Reardon, 1997).
For common people, the location selection is turns to be something easy and instinctively, that is based only on
Gut Feeling (Bhushan & Tayal, 1979; Berman & Evans, 1992). But for the company, this matter is highly important.
It is because the demand and bargain factor for the product is closely related with location selection.Many of the
researchers assert the significance of location in determining company success, they are Hasty and Reardon (1997),
Birkin et al. (1996), and Berry (1976). Environment plays an important role in determining the success of a good
location searching. This circumstance is including the sector of target customers. If the location is set within the
target customer area, then the maximal profit will be achieved (Berman & Evans, 1992).

The De
Locatio
the circumst
environment
seen as an in
its analyzab
real physica
width, and
physical, in
neighborhoo
decision is to
Locatio
location sea
locations it i
as a standar
make an as
location inv
locations wi
2.2 GIS
Geogra
geographica
with anothe
phenomenon
of a phenom
map and rep
The do
presented a
evelopment of
on searching
tances to dev
tal to create
nseparable en
le advantage
al and analysi
the distance
the other ha
od factor, and
o be made.
on appraisal i
arching will
is necessary t
rd to obtain s
sessment abo
volves severa
ill be evaluate
S
aphic informa
al position (sp
er; second is
n space itself
menon based o
presented by d
ts is used to m
as lines or r
Decision-supp
is a process
velop a comp
the product’s
ntity with the
es and disadv
is physical. R
from the hi
and, is physic
d competitor
is a process o
normally pro
to make asse
strong eviden
out a new lo
al processes t
ed with sever
ation is an i
pace dimensio
s attribute (th
f; third is tim
on the time (
dots, lines or
F
mark or repre
regions, for
port Model for
in searching
pany to new
s attracting a
surrounding
vantages. The
Real physical
ghway comp
cal condition
analysis. Rig
of making a
ovide many
ssment of eac
nce in order t
ocations obta
that is used i
ral established
nformation w
on) which ex
heme dimen
me information
(Ruslan & No
regions as sh
Figure 1 Geog
esent the crite
instance tele
the New Oil S
an appropria
w region. It e
and repellent
factors. Bole
ese factors ca
is a visible c
pany has crit
n obtained fro
ght after the e
valuation ag
locations to
ch location (G
o make a bet
ained from lo
in the curren
d criteria.
which describ
xplain the loc
sion) which
n (time dimen
oresah, 1998)
hown in Figur
graphical Data
eria associate
ephone pole
tation Based o
ate location fo
mphasized p
factors. The
en (1988) stat
an be classifi
condition in r
teria to see t
om physical
entire strengt
gainst a locati
choose from
Ghosh, 1994)
tter choice. L
ocation selec
nt assessment
be the real w
cation of part
explain the
nsion) which
). Geographic
re 1.
a Representatio
ed with one s
, ATM, etc.
of Geographica
for the compa
physical cond
position of l
ted that every
ed into 2 phy
related area su
this real phy
analysis suc
th and weakn
ion to choose
m. So to mak
). Location ap
Location appr
tion. This A
t is by using
world from t
ticular phenom
criteria of
h explain the
cal data usual
on
ingle location
Lines are
al Information
any. It is perf
dition of the
location here
y location in
ysical condit
uch as land c
ysical conditi
ch as populat
ness are colle
e the best on
ke a choice
ppraisal then
raisal here is
Assessment of
g the Index m
three aspects
menon and it
some space
behavior or c
lly presented
n which is to
used to rep
System
233
formed under
location and
e needs to be
the earth had
tion, they are
condition, the
on. Analysis
tion analysis,
ected was the
ne. Sorting of
from several
n will be used
a process to
f the desired
model. Those
s; first is the
ts connection
and not the
characteristic
d in form of a
o small to be
resent linear
3
r
d
e
d
e
e
s
,
e
f
l
d
o
d
e
e
n
e
c
a
e
r
The Development of Decision-support Model for the New Oil Station Based of Geographical Information System
234
characteristic, which theoretically had significance in length but not in width so that it cannot be represented in
form of a region. And the region itself is sort of space with boundaries and is used to represent characteristic that
has both significance length and width such as river, cities, land, etc. These three forms of representation can be
combined to represent some more complex phenomenon like surfaces, series and networks. One advantages of
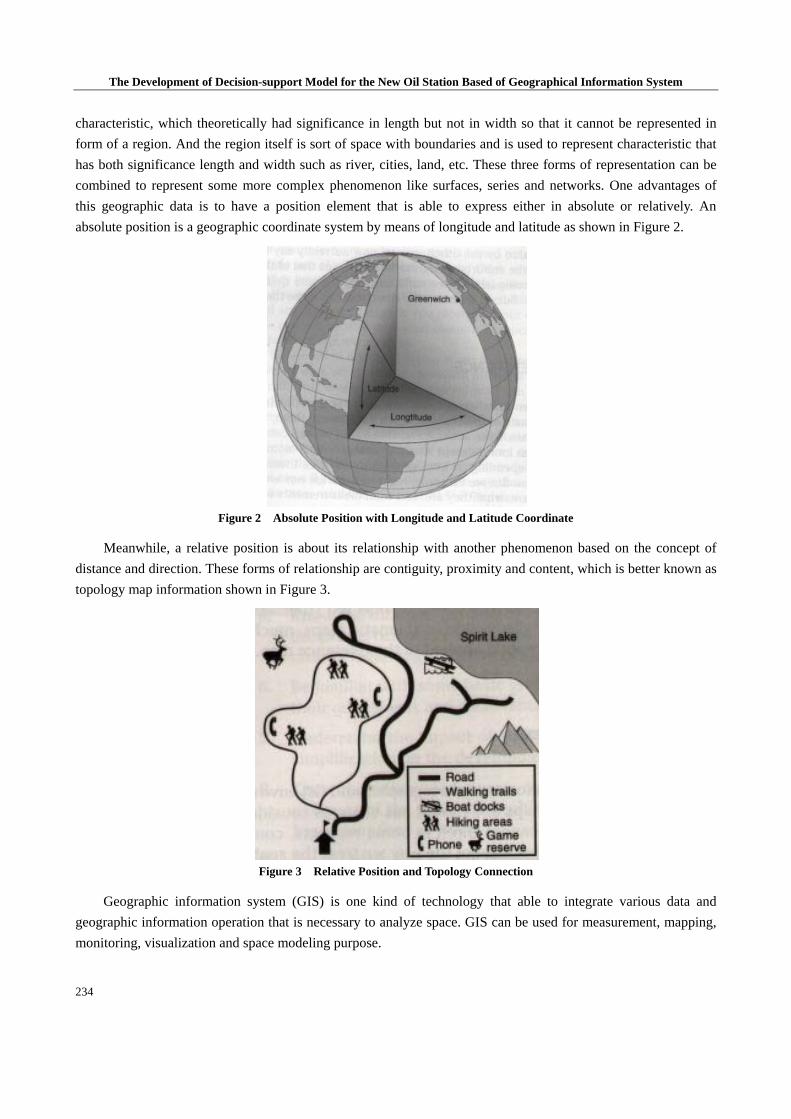
this geographic data is to have a position element that is able to express either in absolute or relatively. An
absolute position is a geographic coordinate system by means of longitude and latitude as shown in Figure 2.
Figure 2 Absolute Position with Longitude and Latitude Coordinate
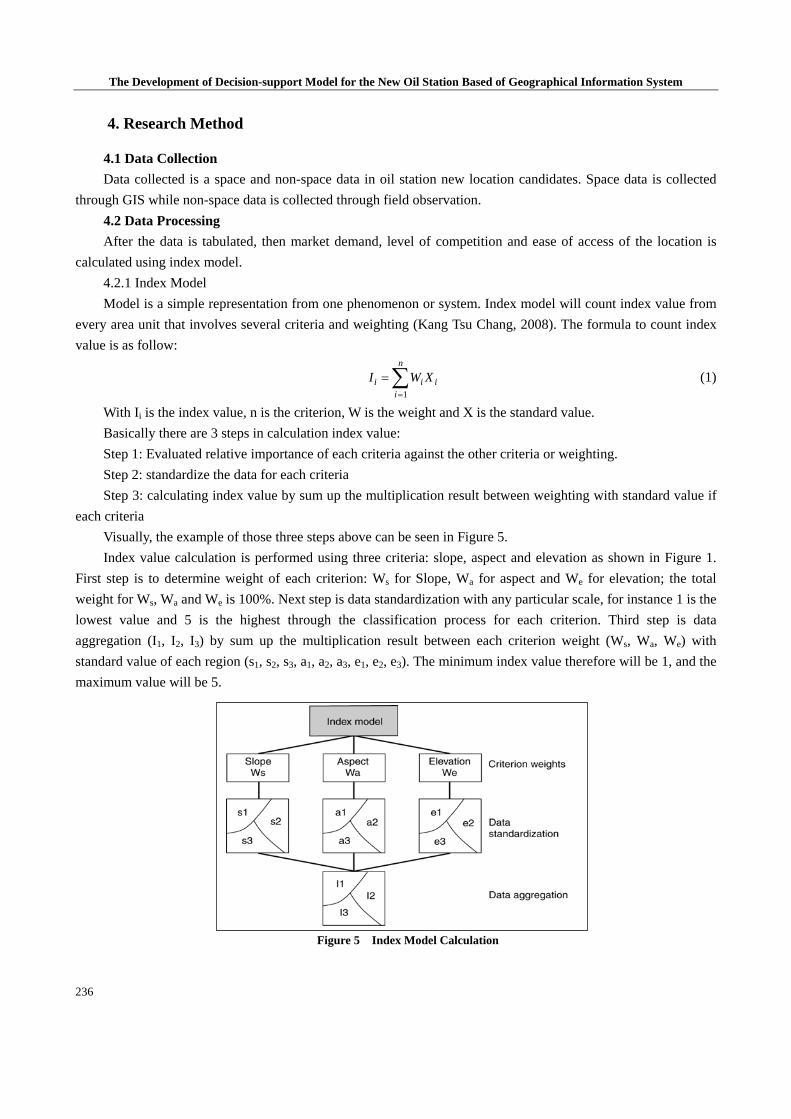
Meanwhile, a relative position is about its relationship with another phenomenon based on the concept of
distance and direction. These forms of relationship are contiguity, proximity and content, which is better known as
topology map information shown in Figure 3.
Figure 3 Relative Position and Topology Connection
Geographic information system (GIS) is one kind of technology that able to integrate various data and
geographic information operation that is necessary to analyze space. GIS can be used for measurement, mapping,
monitoring, visualization and space modeling purpose.

The Development of Decision-support Model for the New Oil Station Based of Geographical Information System
235
2.3 Result of Previous Oil station New Location Searching Model
Previous model to search new location for oil station was design by Nayan (2006) which also called as Oil
Station Location Searching System in Petronas Malaysia is a decision making support application system in space.
The approach used to evaluate location is market and neighborhood analysis. For market analysis, the factors used
are people’s purchasing power, area development and demand in the region. Meanwhile, for neighborhood
analysis factor considered are location front yard, land area, number of vehicle and the distance from oil station to
the highway. The method used here is to assess feasibility here is Multi Criteria Analysis (MCA) and Analytical
Hierarchical Process (AHP).
3. Research Location
The research location is in Gubeng district which consist of 6 sub-district as shown in Table 1.
Table 1 List of Sub-district in the Gubeng District
No. Name of Sub-district Area (km2)
1 Baratajaya 1.26
2 Pucangsewu 0.97
3 Kertajaya 1.14
4 Gubeng 0.88
5 Airlangga 1.19
6 Mojo 2.55
Total 7.99
As for the map location is given in the Figure 4.
Figure 4 Gubeng District Map, Surabaya City
The Development of Decision-support Model for the New Oil Station Based of Geographical Information System
236
4. Research Method
4.1 Data Collection
Data collected is a space and non-space data in oil station new location candidates. Space data is collected
through GIS while non-space data is collected through field observation.
4.2 Data Processing
After the data is tabulated, then market demand, level of competition and ease of access of the location is
calculated using index model.
4.2.1 Index Model
Model is a simple representation from one phenomenon or system. Index model will count index value from
every area unit that involves several criteria and weighting (Kang Tsu Chang, 2008). The formula to count index
value is as follow:
n
iiii XWI
1
(1)
With Ii is the index value, n is the criterion, W is the weight and X is the standard value.
Basically there are 3 steps in calculation index value:
Step 1: Evaluated relative importance of each criteria against the other criteria or weighting.
Step 2: standardize the data for each criteria
Step 3: calculating index value by sum up the multiplication result between weighting with standard value if
each criteria
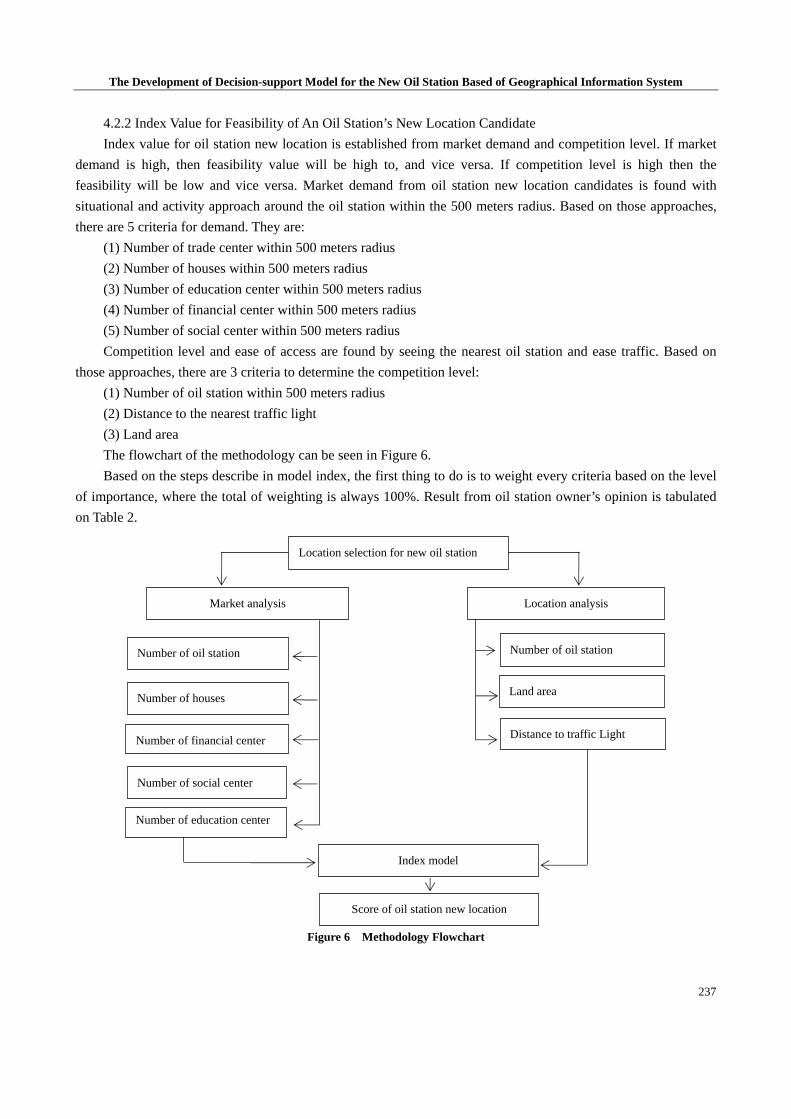
Visually, the example of those three steps above can be seen in Figure 5.
Index value calculation is performed using three criteria: slope, aspect and elevation as shown in Figure 1.
First step is to determine weight of each criterion: Ws for Slope, Wa for aspect and We for elevation; the total
weight for Ws, Wa and We is 100%. Next step is data standardization with any particular scale, for instance 1 is the
lowest value and 5 is the highest through the classification process for each criterion. Third step is data
aggregation (I1, I2, I3) by sum up the multiplication result between each criterion weight (Ws, Wa, We) with
standard value of each region (s1, s2, s3, a1, a2, a3, e1, e2, e3). The minimum index value therefore will be 1, and the
maximum value will be 5.
Figure 5 Index Model Calculation
The Development of Decision-support Model for the New Oil Station Based of Geographical Information System
237
4.2.2 Index Value for Feasibility of An Oil Station’s New Location Candidate
Index value for oil station new location is established from market demand and competition level. If market
demand is high, then feasibility value will be high to, and vice versa. If competition level is high then the
feasibility will be low and vice versa. Market demand from oil station new location candidates is found with
situational and activity approach around the oil station within the 500 meters radius. Based on those approaches,
there are 5 criteria for demand. They are:
(1) Number of trade center within 500 meters radius
(2) Number of houses within 500 meters radius
(3) Number of education center within 500 meters radius
(4) Number of financial center within 500 meters radius
(5) Number of social center within 500 meters radius
Competition level and ease of access are found by seeing the nearest oil station and ease traffic. Based on
those approaches, there are 3 criteria to determine the competition level:
(1) Number of oil station within 500 meters radius
(2) Distance to the nearest traffic light
(3) Land area
The flowchart of the methodology can be seen in Figure 6.
Based on the steps describe in model index, the first thing to do is to weight every criteria based on the level
of importance, where the total of weighting is always 100%. Result from oil station owner’s opinion is tabulated
on Table 2.
Figure 6 Methodology Flowchart
Location selection for new oil station
Land area
Number of oil station
Market analysis Location analysis
Number of houses
Number of financial center
Number of social center
Number of education center
Index model
Score of oil station new location
Number of oil station
Distance to traffic Light

The Development of Decision-support Model for the New Oil Station Based of Geographical Information System
238
Table 2 Weighting of 8 Feasibility Criteria on Oil Station New Location
No Criteria Weight (%)
1 Number of oil station within 500 meter radius 19
2 oil station area 18
3 Distance to the traffic light 16
4 Number of trade center within 500 meters radius 15
5 Number of financial center within 500 meters radius 13
6 Number of education center within 500 meters radius 11
7 Number of social center within 500 meters radius 8
8 Number of houses within 500 meters radius 7
Total 100
Second step is to standardize data with the minimum value of 1 and maximal value on 5, the result is as
follow:
(1) Another oil station Number of oil station within 500 m radius Score Feasibility
>=4 1 Highly unfeasible
3 2 Not feasible
2 3 Fairly feasible
1 4 Feasible
0 5 Highly feasible
(2) Land area Land Area of New oil station (m2) Score Feasibility
700–1160 1 Highly unfeasible
1161–1621 2 Not feasible
1162–2082 3 Fairly feasible
2083–2999 4 Feasible
>=3000 5 Highly feasible
(3) Traffic light
Distance to the nearest traffic light (m) Score Feasibility
1–100 1 Highly unfeasible
101–200 2 Not feasible
201–300 3 Fairly feasible
301–400 4 Feasible
>=401 5 Highly feasible
(4) Trade center
Number of trade center within 500 meters radius Score Feasibility
0–1 1 Highly unfeasible
2–3 2 Not feasible
4–5 3 Fairly feasible
6–7 4 Feasible
>=8 5 Highly feasible

The Development of Decision-support Model for the New Oil Station Based of Geographical Information System
239
(5) Financial center Jumlah Financial center dalam radius 500 m Score Feasibility
1–2 1 Highly unfeasible
3–5 2 Not feasible
6–8 3 Fairly feasible
9–11 4 Feasible
>=12 5 Highly feasible
(6) Education center Number of education center within 500 m radius Score Feasibility
1–3 1 Highly unfeasible
4–7 2 Not feasible
8–11 3 Fairly feasible
12–15 4 Feasible
>=16 5 Highly feasible
(7) Social center Number of social center within 500 m radius Score Feasibility
1–3 1 Highly unfeasible
4–7 2 Not feasible
8–11 3 Fairly feasible
12–16 4 Feasible
>=17 5 Highly feasible
(8) Houses Number of houses within 500 meters radius Score Feasibility
1–680 1 Highly unfeasible
681–1261 2 Not feasible
1262–1842 3 Fairly feasible
1843–2423 4 Feasible
>= 2424 5 Highly feasible
The final step is data aggregation or by sum up the multiplication result between weighting value and
standardization value with formula (1). After all of those three steps is performed, index value will be obtained
with minimal value is 1 and maximal is 5. Interpretation from the result of feasibility index is provided in Table 3.
Table 3 Interpretation of Feasibility Index
Feasibility Index Interpretation
5 Highly feasible
4 Feasible
3 Fairly feasible
2 Not feasible
1 Highly unfeasible
5. Result and Discussion
5.1 Result
Result from this DDS is a software system created by using Arc View, Visual Basic, and Map Object. The
display of the software discussed here is as follow:

The Development of Decision-support Model for the New Oil Station Based of Geographical Information System
240
(1) System display
The main display of the system is the whole based map of assessment are, oil station map, traffic light map,
social center, financial center, and trade center as shown in Figure 7.
Figure 7 Main System Display
Some tools that exist in the main system display is a map display setting such as Zoom in, Zoom out, Pan,
and Info. Moreover, there are several land selection tool, land analyses and region analyses.
(2) System input
There are two kind of system input. First the determination of land location, then the assessment of feasibility
will be conducted towards that selected land. Second is the determination of area and then will provided several
lands that are feasible for oil station establishment. As for the first one, output display is shown in Figure 8.
Figure 8 Input of a Land to be Assessed

The Development of Decision-support Model for the New Oil Station Based of Geographical Information System
241
While the second input is some particular region, which will provide several lands that feasible for new oil
station. This input is shown in Figure 9.
Figure 9 Input of Particular Region to Assess Several Feasible Lands
To perform the second input is by doing pull down menu, with select particular region in the assessment area
in Gubeng district.
(3) System output
There are 2 kinds of output, first is feasibility output from a location as shown in Figure 10.
Figure 10 Feasibility Input of One Location
Location feasibility output from a land will provide several feasible lands for new oil station as shown in
Figure 11.

The Development of Decision-support Model for the New Oil Station Based of Geographical Information System
242
Figure 11 Location Feasibility Output in Baratajaya Sub-district
Baratajaya has 3845 lands lot, and based on the feasibility criteria established of one location for new oil
station, there are 71 location that are feasible for oil station, as shown in Figure 11.
5.2 Discussion
The result of this paper will ease PERTAMINA to approve or reject license application foe new location for
new oil station in Gubeng District. Compare with similar model design by Nayan (2006), the difference lies on its
methodology. The conceptual framework of Decision Support System for Location of New Gas Station in
Seberang Perai, Malaysia by Nayan (2006) shown in Figure 12.
Figure 12 Conceptual Framework of DSS for the New Location of Gas Station in Seberang Perai, Malaysia by Nayan (2006)
Mount of vehicle
Neighborhood Analysis
Lot area
Land use
Width of infront lot
Diistance to road
Lot valuation
MCE AHPLot which fulfill the criteria
Sub-district
Demand analysis
Petrol need
Petrol supply
Buying capacity
Population
Economic growth

The Development of Decision-support Model for the New Oil Station Based of Geographical Information System
243
This paper is using index model, while Nayan’s version was using Multi Criteria Analysis (MCA) combined
with Analytical Hierarchical Process (AHP). Another difference is in this paper there are input of particular
location. This system used combined tools between programming language Visual Basic and Map Object, while
Nayan’s version was using Avenue language in Arc View.
6. Conclusion and Future Recommendation
6.1 Conclusion
The main problem in this paper was how to form Decision Support for the new oil station based of
Geographical Information System. Therefore the conclusion will be the analysis of new location candidate with
the approach of demand and competition which able to create one system for assessment of oil station’s new
location. Decision Support for the new oil station based of Geographical Information System can visualize earth
surface condition in a digital layer. It will ease the users both in deciding the land location that will be analyzed
and to interpret the result because there are only 5 index (Highly unfeasible, not feasible, fairly feasible, feasible
and highly feasible). Based on the result from Decision Support for the new oil station based of Geographical
Information System, PERTAMINA now will able to use the system, to perform a proportional oil distribution
based on demand level so that the competition will be fair in Gubeng district. This model also can be use in the
other region with some modification, especially within the radius of new oil station. Every region will have a
special characteristic, for a region with low people density then radius from oil station location can be enlarged,
and vice versa.
6.2 Future Recommendation
There are several factors that had an impact on demand level, while in this paper there are only five factors
studied which are the number of trade center, houses, education center, financial center and social center within
the 500 meter radius. Another demand factors such as people purchasing level, the products price, the price of
product substitution etc was not being studied in this paper yet, hence in future research the factors that affect
demand level can be expanded. And so about competition level and the ease of location accessibility, there are
more factor that had an impact on those two things while there are only three factors studied here, they are
numbers of oil station within 500 meter radius, distance to nearest traffic light and the area of new oil station
location. Other factors are ratio between the front yard against location’s circumference, another oil station
turnover within 500 meter radius, type of oil offered etc has not been used yet in this paper. Therefore for future
research those factors can be use for competition level and ease of location accessibility variable to for better
research output.
Acknowledgement
The writer expresses his gratitude for the grant received from The Government of Indonesia especially for
The Directorate General of Higher Education, Research Competition Grant, and Indonesia School of Economics
(STIESIA) Surabaya in carrying out of the analysis.
References: Kang Tsu Chang(2008). Introduction to Geographic Information Systems, Singapore: McGraw Hill International Edition.
Ruslan and Noresah (1998). Sistem Maklumat Geografi, Kuala Lumpur: Dewan Bahasa dan Pustaka.

The Development of Decision-support Model for the New Oil Station Based of Geographical Information System
244
Berman B. and Evans J. R. (1992). Retail Management: A Strategic Approach (5th ed.), New York: MacMillan Publishing Company.
Berry B. J. L. (1976). The Geography of Economic Systems, New Jersey: Prentice-Hall.
Bhushan Y. K. and Tayal G. L. (1979). Business Planning, New Delhi: Sultan Chand & Sons.
Birkin M. C., Clarke G. M. and Wilson A. (1996). Intelligent GIS, Location Decisions and Strategic Planning, New York: John Wiley
and Sons.
Bolen H. W. (1988). Contemporary Retailing, New Jersey: Prentice-Hall International, Inc.
Ghosh A. (1994). Retail Management (2nd ed.), Florida: The Dryden Press.
Hasty R. and Reardon J. (1997). Retail Management, Texas: The McGraw-Hill Companies, Inc.
Nayan N. (2006). Sistem Maklumat Geografi: Dalam Perancangan Pembuatak Keputusan Perniagaan, Universiti Pendidikan Sultan
Idris, Perak Darul Ridzwan.


![EDGS WORKING PAPER - edgs.northwestern.edu · Pertamina’s functions were “[T]he collector of oil revenues…the catalyst and financier of major development projects ... J.B Sumarlin’s](https://img.dokumen.tips/doc/110x75/5c8b9ca109d3f2a66a8bc2f6/edgs-working-paper-edgs-pertaminas-functions-were-the-collector-of.jpg)