Embed Size (px)
Citation preview

ENCODE
Department of Biochemistry and Molecular [email protected]
George I. Mias
MMG 835, SPRING 2016 Eukaryotic Molecular Genetics

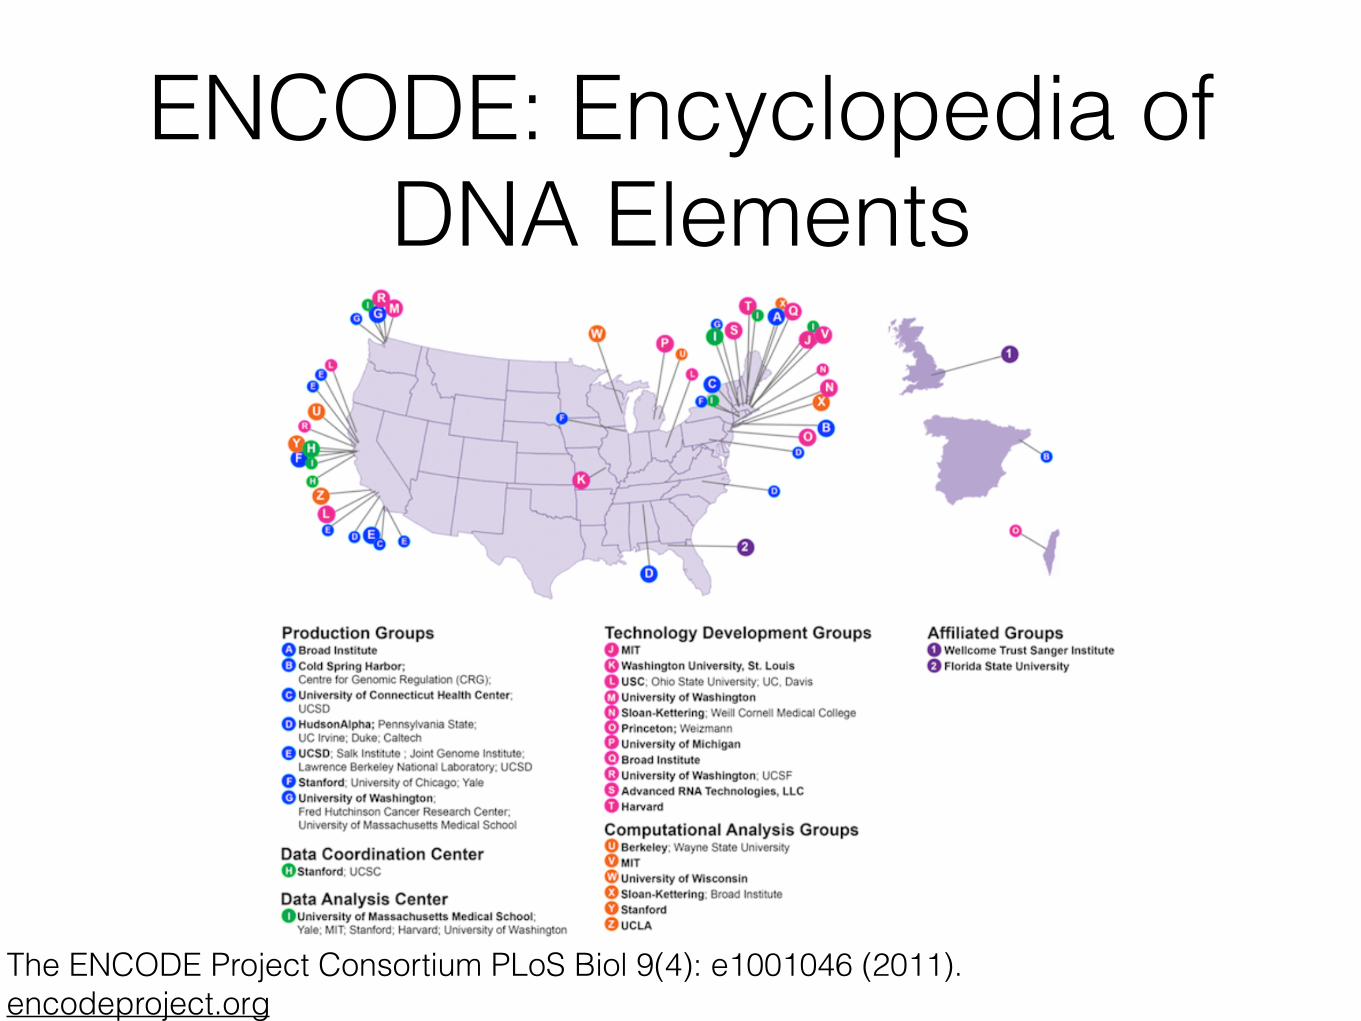
ENCODE: Encyclopedia of DNA Elements
• Identify all functional elements in the genome
‣ Freely available resources
• gene regulation
• gene basis of disease
There is a lot of non-coding sequence (humans & other eukaryotes) - does it do anything?

ENCODE: Encyclopedia of DNA Elements
functional element is used to denote a discrete region of the genome that encodes a defined product (e.g., protein) or a reproducible biochemical signature, such as transcription or a specific chromatin structure.
The ENCODE Project Consortium PLoS Biol 9(4): e1001046 (2011).

ENCODE: Encyclopedia of DNA Elements
The ENCODE Project Consortium PLoS Biol 9(4): e1001046 (2011). encodeproject.org

The National Human Genome Research Institute model organism ENCyclopedia Of
DNA Elements
http://www.modencode.org
modENCODE model organisms, C. elegans and D. melanogaster.

ENCODE: Encyclopedia of DNA Elements
The ENCODE Project Consortium PLoS Biol 9(4): e1001046 (2011). encodeproject.org
Pilot phase• 2003, National Human Genome Research Institute (NHGRI) introduction • targeted 44 regions ~ 1% of human genome • assembling a comprehensive encyclopedia of the functional elements in these regions,
showing their identity and precise location.

Beyond the Sequence
Ecker et al., Nature 489, 52–55 (2012)

Beyond the Sequence
Ecker et al., Nature 489, 52–55 (2012)
• Functional genomic elements that orchestrate the development and function of a human.
• Degree of DNA methylation • Chemical modifications to histones • Long-range chromatin interactions, (e.g. looping) ‣ Alter the relative proximities of different chromosomal regions in 3
dimensions ‣ Affect transcription.
• Binding activity of transcription-factor proteins • Architecture (location & sequence) of gene-regulatory DNA elements ‣ promoter region upstream of the point at which transcription of an RNA
molecule begins ‣ more distant (long-range) regulatory elements.

Beyond the Sequence
Ecker et al., Nature 489, 52–55 (2012)
• Accessibility of the genome to the DNA-cleavage protein DNase I. ‣ DNase I hypersensitive sites
• indicate specific sequences at which the binding of transcription factors and transcription-machinery proteins has caused nucleosome displacement.
• Catalogues the sequences and quantities of RNA transcripts ‣ non-coding regions ‣ protein-coding regions.
ENCODE: Encyclopedia of DNA Elements
The ENCODE Project Consortium PLoS Biol 9(4): e1001046 (2011). encodeproject.org

ENCODE: Encyclopedia of DNA Elements
The ENCODE Project Consortium PLoS Biol 9(4): e1001046 (2011). encodeproject.org
Data Production
Data Storage & Access

Maher, Nature 489, p. 46 (2012).
ENCODEEXPERIMENTAL TARGETS • DNA methylation: regions layered with chemical methyl groups, which regulate
gene expression.
• Open chromatin: areas in which the DNA and proteins that make up chromatin are accessible to regulatory proteins.
• RNA binding: positions where regulatory proteins attach to RNA.
• RNA sequences: regions that are transcribed into RNA.
• ChIP-seq: technique that reveals where proteins bind to DNA.
• Modified histones: histone proteins, which package DNA into chromosomes, modified by chemical marks.
• Transcription factors: proteins that bind to DNA and regulate transcription.

The ENCODE Project Consortium, Nature 489:57-74 (2012)
ENCODE• CELL LINES • Tiers 1 and 2: widely used cell lines prioritized. ‣ Tier 1. Highest-priority. 3 widely studied cell lines:
• K562 erythroleukaemia cells • GM12878, a B-lymphoblastoid cell line (also in1000 Genomes project) • H1 embryonic stem cell (H1 hESC) line.
‣ Tier 2. The second-priority. Include • HeLa-S3 cervical carcinoma cells • HepG2 hepatoblastoma cells • Primary (non-transformed) human umbilical vein endothelial cells (HUVECs).
• Tier 3: all other ENCODE cell types.

ENCODE
Maher, Nature 489, p. 46 (2012).
2012 Publication:
24 experiment types
> 150 cell lines

The ENCODE Project Consortium, Nature 489:57-74 (2012)
ENCODE• RNA-seq. Isolation of RNA sequences, often with different purification techniques to
isolate different fractions of RNA followed by high-throughput sequencing. • CAGE. Cap analysis gene expression. ‣ Capture of the methylated cap at the 5’ end of RNA ‣ High-throughput sequencing of a small tag adjacent to the 5’ methylated caps. ‣ 5’ methylated caps are formed at the initiation of transcription, although other
mechanisms also methylate 5’ ends of RNA. • RNA-PET. RNA-paired end tag (PET). ‣ Simultaneous capture of RNAs with both a 5’ methyl cap and a poly(A) tail,
indicative of a full-length RNA. ‣ High-throughput sequencing a short tag from each end.

The ENCODE Project Consortium, Nature 489:57-74 (2012). Furey, Nature Reviews Genetics 13, 840-852 (2012).
ENCODE• ChIP-seq. Chromatin immunoprecipitation
followed by sequencing. ‣ Specific regions of crosslinked chromatin
(genomic DNA in complex with its bound proteins) selected by antibody to a specific epitope.
‣ High-throughput sequencing enriched sample to determine the regions in the genome most often bound by the protein to which the antibody was directed.
‣ Most often used are antibodies to any chromatin-associated epitope, including • transcription factors • chromatin binding proteins • specific chemical modifications on histone
proteins.

The ENCODE Project Consortium, Nature 489:57-74 (2012). Song, Lingyun & Crawford. Cold Spring Harbor protocols 2010.2 (2010): pdb.prot5384.
• DNase-seq. Adaption of established regulatory sequence assay to modern techniques. ‣ The DNase I enzyme will preferentially
cut live chromatin preparations at sites where nearby there are specific (non- histone) proteins.
‣ Resulting cut points are then sequenced using high-throughput sequencing to determine those sites ‘hypersensitive’ to DNase I, corresponding to open chromatin.
ENCODEENCODE

Song, Lingyun & Crawford. Cold Spring Harbor protocols 2010.2 (2010): pdb.prot5384
ENCODEENCODE• DNase-seq protocol ‣ nuclei are digested with DNase I. ‣ digested DNA embedded in low-melt gel
agarose plugs to reduce additional random shearing
‣ DNA (while still in the plugs) is blunt-ended, extracted, & ligated to biotinylated linker 1 (red).
‣ Excess linker removed by gel purification. ‣ Biotinylated fragments digested with MmeI
and captured by streptavidin-coated Dynal beads (brown balls).
‣ Linker 2 (blue bars) ligated to the 2-base overhang generated by MmeI
‣ Ditagged DNAs amplified by PCR and sequenced

ENCODE• FAIRE-seq. Formaldehyde assisted isolation of regulatory elements. ‣ FAIRE isolates nucleosome-depleted genomic regions by exploiting the
difference in crosslinking efficiency between nucleosomes (high) and sequence-specific regulatory factors (low).
‣ FAIRE consists of crosslinking, phenol extraction, and sequencing the DNA fragments in the aqueous phase.
• RRBS. Reduced representation bisulphite sequencing. ‣ Bisulphite treatment of DNA sequence converts unmethylated cytosines to uracil. ‣ To focus the assay and save costs, specific restriction enzymes that cut around
CpG dinucleotides can reduce the genome to a portion specifically enriched in CpGs.
‣ Enriched sample is then sequenced to determine the methylation status of individual cytosines quantitatively.
The ENCODE Project Consortium, Nature 489:57-74 (2012).

ENCODESummary of Transcription Factor Classes Analyzed
The ENCODE Project Consortium, Nature 489:57-74 (2012).

ENCODEHistone Modifications and Variants
The ENCODE Project Consortium, Nature 489:57-74 (2012).

Harrow et al., Genome Res. 22:1760-1774 (2012)
ENCODEGENCODE: The reference human genome annotation for The ENCODE Project

Harrow et al., Genome Res. 22:1760-1774 (2012)
ENCODEGENCODE: The reference human genome annotation for The ENCODE Project

Harrow et al., Genome Res. 22:1760-1774 (2012)
ENCODEGENCODE: The reference human genome annotation for The ENCODE Project

Harrow et al., Genome Res. 22:1760-1774 (2012)
ENCODEGENCODE: The reference human genome annotation for The ENCODE Project

Harrow et al., Genome Res. 22:1760-1774 (2012)
• Level 3 (automatically annotated)
• Level 2 (manually annotated)
• Level 1 (validated)
ENCODEGENCODE: The reference human genome annotation for The ENCODE Project

ENCODEFindings• Large amount of human genome, 80.4%, is covered by at least one ENCODE-
identified element ‣ Different RNA types, covering 62% of the genome (although the majority is
inside of introns or near genes). ‣ Regions highly enriched for histone modifications (56.1%). ‣ Excluding RNA elements and broad histone elements, 44.2% of the genome is
covered. • Regions of open chromatin (15.2%) • Sites of transcription factor binding (8.1%)
• with 19.4% covered by at least one DHS or transcription factor ChIP-seq peak across all cell lines.
‣ 8.5% of bases are covered by either • a transcription-factor-binding-site motif (4.6%) • or a DHS footprint (5.7%).
The ENCODE Project Consortium, Nature 489:57-74 (2012).

ENCODEFindings
The ENCODE Project Consortium, Nature 489:57-74 (2012).
• ENCODE project did not assay all cell types, or all transcription factors. • It sampled few specialized or developmentally restricted cell lineages. • Are these proportions underestimates of the total amount of functional bases?

ENCODERNA
Djebali et al., Nature 489:101-108 (2012). The ENCODE Project Consortium, Nature 489:57-74 (2012).
• 15 Cell lines ‣ RNA-Seq, RNA-PET, CAGE ‣ polyadenylated RNAs (polyA+) ‣ non-polyadenylated RNAs
(polyA-) • Observed range of gene
expression spans ‣ 6 orders of magnitude for polyA
+ (10-2 -104 reads per kilobase per million reads [r.p.k.m.])
‣ 5 orders of magnitude (from 10-2 - 103 r.p.k.m.) for polyA-

ENCODERNA
Djebali et al., Nature 489:101-108 (2012). The ENCODE Project Consortium, Nature 489:57-74 (2012).
• Average Expression < 1 molecule/cell (assuming 1-4 RPKM approximates to 1 molecule/ cell) for ‣ ~ 25% of protein-coding RNAs
(orange) ‣ ~ 80% of lncRNAs (blue)
• Novel antisense and intergenic genes predicted in this study expression ranging from 10-4 to 10-1 r.p.k.m.

ENCODERNA
Djebali et al., Nature 489:101-108 (2012). The ENCODE Project Consortium, Nature 489:57-74 (2012).
• Lower levels of gene expression in lncRNAs may be due to ‣ consistent low RNA copy
number in all cells within the population interrogated
‣ restricted expression in only a subpopulation of cells.
• In some cell lines, individual lncRNAs can exhibit steady-state expression levels as high as those of protein-coding genes. E.g.: ‣ protein-coding gene actin,
gamma 1 (ACTG1) ‣ non-coding gene, H19.

ENCODERNA
Djebali et al., Nature 489:101-108 (2012). The ENCODE Project Consortium, Nature 489:57-74 (2012).
• Cumulatively detection of 70% of annotated splice junctions, transcripts & genes
• Detected approximately 85% of annotated exons with an average coverage by RNA-seq contigs of 96%.

ENCODERNA
Djebali et al., Nature 489:101-108 (2012). The ENCODE Project Consortium, Nature 489:57-74 (2012).
• Expansion of genic regions ‣ discovery of new isoforms
identification of novel intergenic transcripts
• Increase in the number of intergenic regions (from 32,481 to 60,250) due to ‣ their fragmentation ‣ a decrease in their
lengths (from 14,170 bp to 3,949 bp median length).

ENCODERNA
Djebali et al., Nature 489:101-108 (2012). The ENCODE Project Consortium, Nature 489:57-74 (2012).
Increased overlap of genic regions. • Determination of genic regions currently defined by ‣ Cumulative lengths of the isoforms ‣ Their genetic association to phenotypic characteristics.
• Continued reduction in the lengths of intergenic regions will lead to the overlap of most genes previously assumed to be distinct genetic loci.
• Reconsideration of the definition of a gene. Proposition: ‣ The transcript as the basic atomic unit of inheritance. ‣ Gene to denote a higher-order concept intended to capture all those
transcripts (eventually divorced from their genomic locations) that contribute to a given phenotypic trait.

The ENCODE Project Consortium, Nature 489:57-74 (2012).
ENCODE7 combined
Chromatin States across the Genome

• Distinct core promoter region ‣ TSS (Predicted promoter region containing TSS) ‣ PF (Promoter flanking region)
• Active gene bodies ‣ T, (Predicted transcribed region)
• 3 ‘active’ distal states. Two enhancer states. Occurrence in regions of open chromatin with high H3K4me1 differ in the levels of marks such as H3K27ac, (active vs inactive enhancers).
‣ E (Predicted enhancers) ‣ WE (Predicted weak enhancers) ‣ CTCF-enriched region
• High CTCF binding includes sequences that function as insulators in a transfection assay.
• R, repressed state (R) summarizes sequences split between different classes of actively repressed or inactive, quiescent chromatin.
The ENCODE Project Consortium, Nature 489:57-74 (2012).
ENCODE7 combined
Chromatin States across the Genome

The ENCODE Project Consortium, Nature 489:57-74 (2012).
ENCODE
GM12878 cells example & compressed view of GENCODE annotations.

Thurman et al., Nature 489:75-82 (2012).
ENCODE
2,890,742 DHSs Promoter DHSs defined as the first DHS localizing within 1 kb upstream of a GENCODE TSS.
Distribution of intergenic DHSs relative to Gencode

Thurman et al., Nature 489:75-82 (2012).
• 42 transcription factors mapped by ENCODE ChIP-seq in K562 cells.
• Genome-wide correlation (r=0.7943) between ChIP-seq and DNase I tag densities (log10).
ENCODE

Thurman et al., Nature 489:75-82 (2012).
94.4% of combined 1,108,081 ChIP-seq peaks from all transcription factors assayed in K562 cells fall within accessible chromatin regions (grey). [median factor 98.2% of its binding sites]
Small number of TF in this bottom paradigm, eg. known chromatin repressors, e.g. KRAB-associated factors
ENCODE
Thurman et al., Nature 489:75-82 (2012).
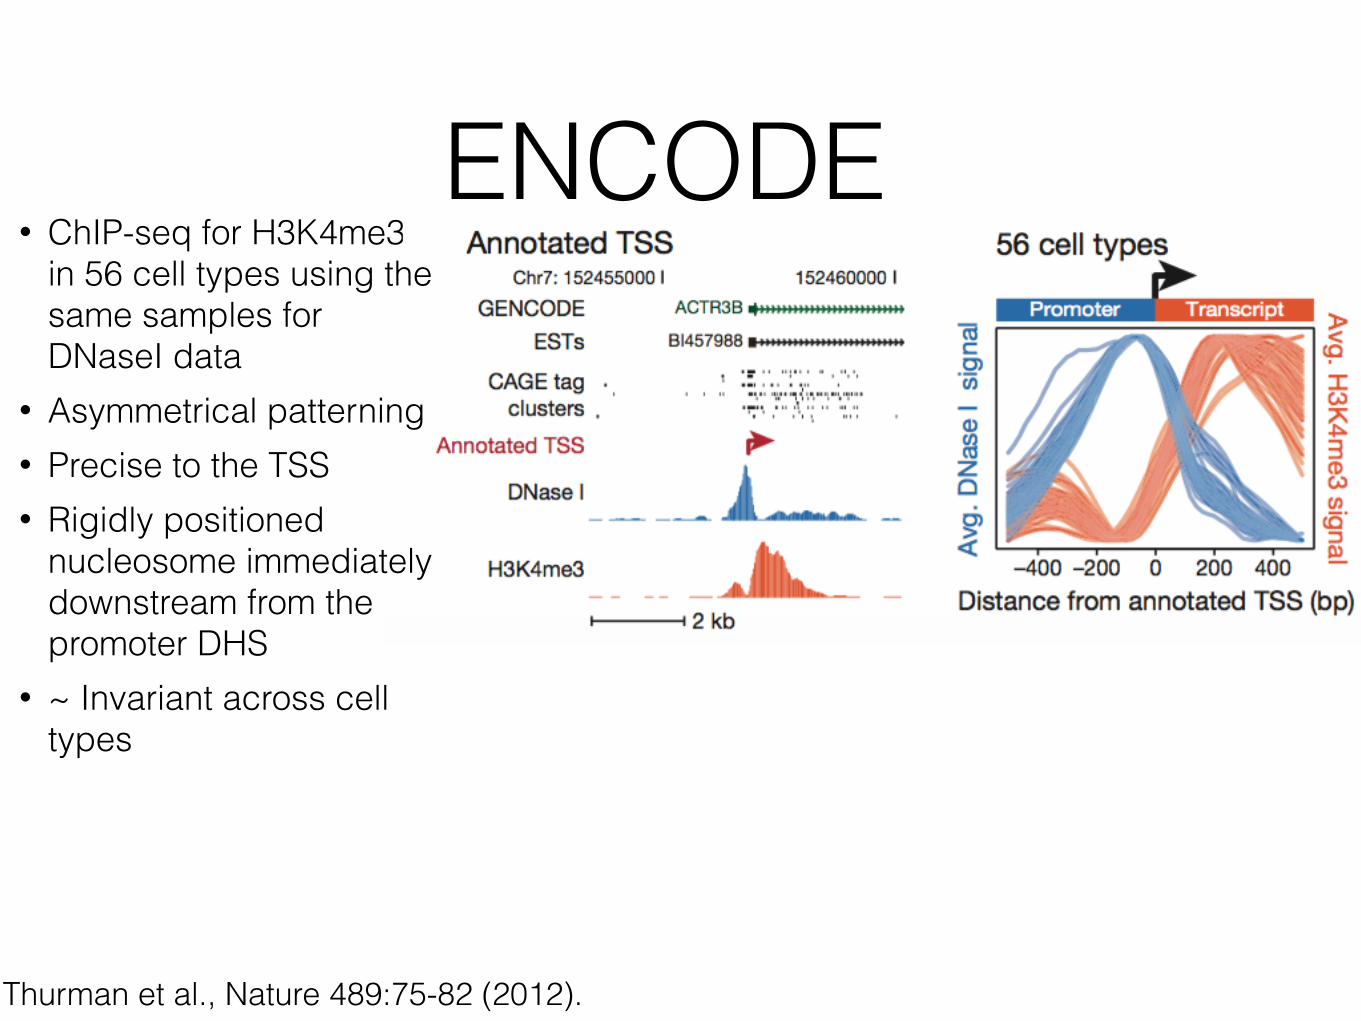
• ChIP-seq for H3K4me3 in 56 cell types using the same samples for DNaseI data
• Asymmetrical patterning • Precise to the TSS • Rigidly positioned
nucleosome immediately downstream from the promoter DHS
• ~ Invariant across cell types
ENCODE

ENCODE
Thurman et al., Nature 489:75-82 (2012).
• Use pattern to predict and validate novel TSSs
ESTs, spliced expressed sequence tags CAGE, cap analysis of gene expression

Conservation
The ENCODE Project Consortium, Nature 489:57-74 (2012).
ENCODE
24 mammals, Average Genomic Evolutionary Rate Profiling (GERP)
Diversity, a measure of negative selection in the human population (mean expected heterozygosity, (inverted scale)
• Point: average for a single data set. • Filled Square: Coding (C), UTR (U),
genomic (G), intergenic (IG) & intronic (IN) average

Conservation
The ENCODE Project Consortium, Nature 489:57-74 (2012).
ENCODE

ENCODE
The ENCODE Project Consortium, Nature 489:57-74 (2012).
• Multiple Variants identified • Individual basis considerations

ENCODE
The ENCODE Project Consortium, Nature 489:57-74 (2012).
• GWAS comparisons • Disease associations

encodeproject.org
ENCODEGround level annotations are typically derived directly from the experimental data.
Gene expression (RNA-seq) The expression levels of genes annotated by GENCODE 19 in ~60 human cell types
BRCA1 Gene Expression

encodeproject.org
ENCODEGround level annotations are typically derived directly from the experimental data.
Gene expression (RNA-seq) The expression levels of genes annotated by GENCODE 19 in ~60 human cell types
Active Transcription Start Site (RAMPAGE) Active transcription start sites (TSSs) determined using RAMPAGE assays in 38 cell types
Transcription Factor Binding (TF ChIP-seq) Peaks (enriched genomic regions) of TFs computed from ~900 human and mouse ChIP-seq experiments.
BRCA1 Gene Expression
CTCF Motif from Factorbook

encodeproject.org
ENCODEGround level annotations are typically derived directly from the experimental data.
Gene expression (RNA-seq) The expression levels of genes annotated by GENCODE 19 in ~60 human cell types
Active Transcription Start Site (RAMPAGE) Active transcription start sites (TSSs) determined using RAMPAGE assays in 38 cell types
Transcription Factor Binding (TF ChIP-seq) Peaks (enriched genomic regions) of TFs computed from ~900 human and mouse ChIP-seq experiments.
Histone Mark Enrichment (ChIP-seq) Peaks of a variety of histone marks computed from ~600 ChIP-seq experiments.
BRCA1 Gene Expression
CTCF Motif from Factorbook
H3K27ac from e11.5 Neural Tube

encodeproject.org
ENCODEGround level annotations are typically derived directly from the experimental data.
Gene expression (RNA-seq) The expression levels of genes annotated by GENCODE 19 in ~60 human cell types
Active Transcription Start Site (RAMPAGE) Active transcription start sites (TSSs) determined using RAMPAGE assays in 38 cell types
Transcription Factor Binding (TF ChIP-seq) Peaks (enriched genomic regions) of TFs computed from ~900 human and mouse ChIP-seq experiments.
Histone Mark Enrichment (ChIP-seq) Peaks of a variety of histone marks computed from ~600 ChIP-seq experiments.
Open Chromatin (DNase-seq) DNase I hypersensitive sites (also known as DNase-seq peaks) computed from ~300 human and mouse experiments.
BRCA1 Gene Expression
CTCF Motif from Factorbook
H3K27ac from e11.5 Neural Tube
CTCF DHS Profile

encodeproject.org
ENCODEGround level annotations are typically derived directly from the experimental data.
Gene expression (RNA-seq) The expression levels of genes annotated by GENCODE 19 in ~60 human cell types
Active Transcription Start Site (RAMPAGE) Active transcription start sites (TSSs) determined using RAMPAGE assays in 38 cell types
Transcription Factor Binding (TF ChIP-seq) Peaks (enriched genomic regions) of TFs computed from ~900 human and mouse ChIP-seq experiments.
Histone Mark Enrichment (ChIP-seq) Peaks of a variety of histone marks computed from ~600 ChIP-seq experiments.
Open Chromatin (DNase-seq) DNase I hypersensitive sites (also known as DNase-seq peaks) computed from ~300 human and mouse experiments.
Topologically associating domains (TADs) and Compartments (Hi-C) TADs and A and B compartments computed from 12 human cell lines.
K562 Interaction Matrix
Promoter-enhancer links (ChIA-PET) Links between promoters and distal regulatory elements such as enhancers computed from 8 ChIA-PET experiments.
BRCA1 Gene Expression
CTCF Motif from Factorbook
H3K27ac from e11.5 Neural Tube
CTCF DHS Profile
ChIA-PET interactions

encodeproject.org
ENCODEGround level annotations are typically derived directly from the experimental data.
Gene expression (RNA-seq) The expression levels of genes annotated by GENCODE 19 in ~60 human cell types
Active Transcription Start Site (RAMPAGE) Active transcription start sites (TSSs) determined using RAMPAGE assays in 38 cell types
Transcription Factor Binding (TF ChIP-seq) Peaks (enriched genomic regions) of TFs computed from ~900 human and mouse ChIP-seq experiments.
Histone Mark Enrichment (ChIP-seq) Peaks of a variety of histone marks computed from ~600 ChIP-seq experiments.
Open Chromatin (DNase-seq) DNase I hypersensitive sites (also known as DNase-seq peaks) computed from ~300 human and mouse experiments.
Topologically associating domains (TADs) and Compartments (Hi-C) TADs and A and B compartments computed from 12 human cell lines.
K562 Interaction Matrix
Promoter-enhancer links (ChIA-PET) Links between promoters and distal regulatory elements such as enhancers computed from 8 ChIA-PET experiments.
RNA Binding Protein Occupancy (eCLIP-seq) Peaks computed from eCLIP-seq data in human cell lines K562 and HepG2 for a large number of RNA Binding Proteins (RBPs).
BRCA1 Gene Expression
CTCF Motif from Factorbook
H3K27ac from e11.5 Neural Tube
CTCF DHS Profile
ChIA-PET interactions
RBFOX2 read density

encodeproject.org
ENCODEPromoter-like regions
Middle level annotations integrate multiple types of experimental data and multiple ground level annotations.
• DNase hypersensitivity and histone modification H3K4me3 are well-known indicators of active and poised promoters.
• Developed an unsupervised method that combines DNase and H3K4me3 signals in the same cell type to predict promoter-like genomic regions.

encodeproject.org
ENCODEPromoter-like regions
Enhancer-like regions
Middle level annotations integrate multiple types of experimental data and multiple ground level annotations.
• DNase hypersensitivity and histone modification H3K4me3 are well-known indicators of active and poised promoters.
• Developed an unsupervised method that combines DNase and H3K4me3 signals in the same cell type to predict promoter-like genomic regions.
• DNase hypersensitivity and histone modification H3K27ac are well-known indicators of active enhancers.
• Developed an unsupervised method that combines DNase and H3K27ac signals in the same cell type to predict enhancer-like genomic regions.
• Applied method to 52 human cell types and 20 mouse cell types with both DNase and H3K27ac data generated by the ENCODE and Roadmap Epigenomic consortia.

encodeproject.org
ENCODEChromatin states
Top level annotations integrate a broad range of experimental data and ground and middle level annotations.
• Semi-automated genomic annotation methods such as ChromHMM and Segway‣ Take as input a panel of epigenomic data
(including histone mark ChIP-seq and DNase-seq) in a particular cell type
‣ Use machine learning methods to simultaneously partition the genome into segments and assign chromatin states to these segments
‣ States are assigned such that two segments with the same state exhibit similar epigenomic patterns.
‣ The procedure is "semi-automated" because states are then manually compared with known biological information in order to designate each state as an enhancer-like, promoter-like, gene body, etc.


![[Team MIAS] Initial Presentation](https://img.dokumen.tips/doc/110x75/58aa04d21a28abec248b6927/team-mias-initial-presentation.jpg)


![Incertidumbre[1] diapositivas mias](https://img.dokumen.tips/doc/110x75/55873dabd8b42a86098b46ca/incertidumbre1-diapositivas-mias.jpg)


