Embed Size (px)
Citation preview
8th meeting of the TFEIP’s projections expert panel, 15th May 2012 Bern, Switzerland.
Emissions projections reported under the LRTAP convention and EEA countries visibility in global emission scenario studies.
John van Aardenne (EEA).
Acknowledgements:
LRTAP: Elisabeth Kampel and Melanie Tista (UBA-Vienna), Martin Adams (EEA)
ETC-ACM scenario study: A. Colette, S. Schucht, J.-C. Péré, B. Bessagnet, L. Rouïl: Institut National de l’Environnement Industriel et des Risques (INERIS), France and R. Koelemeijer, H. Eerens, K. Van Velze: Planbureau voor de Leefomgeving (PBL), the Netherlands and G. Mellios: EMISIA, Greece

Overview
A. Emission projections in the draft EU LRTAP emission inventory report 1990-2010• Reporting requirements on projections• Projections in the 2012 EU LRTAP emission inventory report• Overview on trends, gaps• Future role of projections expert panel
B. Brief presentation of the ETC-ACM technical report ”Cobenefits of climate and air pollution regulations” that includes an evaluation of representation/visibility of EU-EEA countries in global emission scenarios. (as presented in 7th meeting of projections expert panel)
Acknowledgements:
LRTAP: Elisabeth Kampel and Melanie Tista (UBA-Vienna), Martin Adams (EEA)
ETC-ACM scenario study: A. Colette, S. Schucht, J.-C. Péré, B. Bessagnet, L. Rouïl: (INERIS), and R. Koelemeijer, H. Eerens, K. Van Velze (PBL), and G. Mellios: EMISIA
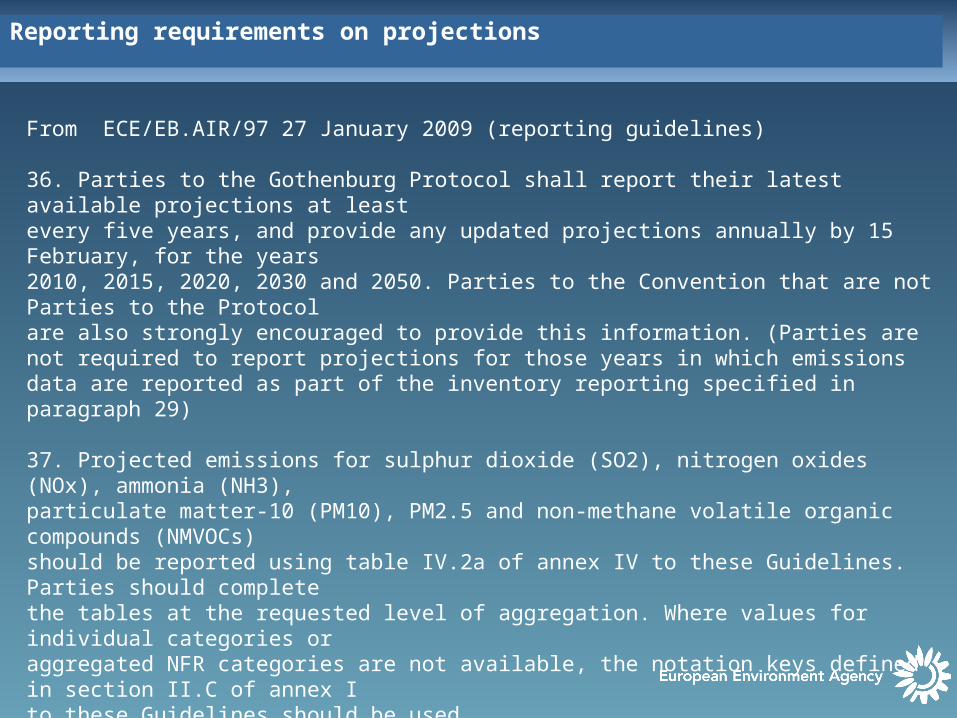
Reporting requirements on projections
From ECE/EB.AIR/97 27 January 2009 (reporting guidelines)
36. Parties to the Gothenburg Protocol shall report their latest available projections at leastevery five years, and provide any updated projections annually by 15 February, for the years2010, 2015, 2020, 2030 and 2050. Parties to the Convention that are not Parties to the Protocolare also strongly encouraged to provide this information. (Parties are not required to report projections for those years in which emissions data are reported as part of the inventory reporting specified in paragraph 29)
37. Projected emissions for sulphur dioxide (SO2), nitrogen oxides (NOx), ammonia (NH3),particulate matter-10 (PM10), PM2.5 and non-methane volatile organic compounds (NMVOCs)should be reported using table IV.2a of annex IV to these Guidelines. Parties should completethe tables at the requested level of aggregation. Where values for individual categories oraggregated NFR categories are not available, the notation keys defined in section II.C of annex Ito these Guidelines should be used.
38. Quantitative information on parameters underlying emission projections should bereported using the templates set out in table IV.2b of annex IV to these Guidelines. Theseparameters should be reported for the projection target year and the historic year chosen as thestarting year for the projections.

Projections in the 2012 EU LRTAP emission inventory report
Information from:Draft European Union emission inventory report 1990–2010 under the UNECE Convention on Long-range Transboundary Air Pollution (LRTAP) as submitted for EIONET review.
“Under the reporting process to the LRTAP Convention, some Member States have submitted emission projections for the year 2015 and up to 2050 in some cases. Submitted data are available in Annex E to this report. This report does not provide further detailed analysis of projections reported by the countries in relation to the emission ceilings for 2010 in the Gothenburg Protocol to the LRTAP Convention”
The next slides present an overview and short analysis of the available projections data.......
Please note:• Numbers reflect data available until March 09, 2012• Presentation´s aim is to inform, learn and discuss not to ”judge”

NOx projections submitted by Member States (status March 2012)
NOx (Gg) Gothenburg Ceiling Emissions 2010
WM
2010 2015 2020 2030 2050
Austria 107 189 199 160 130 122 0
Belgium 181 221 0 202 173 0 0
Bulgaria 266 115 0 247 247 0 0
Cyprus 23 18 18 17 13 0 0
Czech Republic 286 251 0 0 0 0 0
Denmark 127 129 129 105 85 70 0
Estonia 37 39 36 0 0 0
Finland 170 172 0 0 121 0 101
France 860 1 080 1 080 848 620 0 0
Germany 1081 1 323 1 326 1 182 1 013 0 0
Greece 344 322 0 338 290 0 0
Hungary 198 162 0 172 173 192 0
Ireland 65 76 0 0 0 0 0
Italy 1000 963 0 0 0 0 0
Latvia 84 34 0 45 46 0 0
Lithuania 110 58 0 34 23 0 0
Luxembourg 11 21 0 0 0 0 0
Malta 8 0 0 0 0 0
Netherlands 266 276 264 230 185 161 0
Poland 879 867 827 0 0 0 0
Portugal 260 180 0 0 0 0 0
Romania 437 272 236 198 170 371 0
Slovakia 130 89 89 83 71 79 84
Slovenia 45 45 49 46 35 25 0
Spain 847 974 0 930 848 0 0
Sweden 148 161 0 118 92 82 0
United Kingdom 1181 1 106 1 106 935 731 0 0
One or more years in projections are based on 2010 submitted data
One or more years in projections are based on 2011 submitted data

NMVOC projections submitted by Member States (status March 2012)
NMVOC (Gg) Gothenburg Ceiling Emissions 2010
WM
2010 2015 2020 2030 2050
Austria 159 133 159 164 172 189 0
Belgium 144 105 0 110 112 0 0
Bulgaria 185 91 0 175 175 0 0
Cyprus 14 11 11 10 8 0 0
Czech Republic 220 148 0 0 0 0 0
Denmark 85 86 86 76 70 64 0
Estonia 38 41 42 0 0 0
Finland 130 117 0 0 82 0 74
France 1100 852 852 643 594 0 0
Germany 995 1 053 1 052 1 092 1 073 0 0
Greece 261 184 0 0 103 0 0
Hungary 137 109 0 133 137 157 0
Ireland 55 45 0 0 0 0 0
Italy 1159 1 080 0 0 0 0 0
Latvia 136 65 0 53 51 0 0
Lithuania 92 69 0 49 29 0 0
Luxembourg 9 9 0 0 0 0 0
Malta 3 0 0 0 0 0
Netherlands 191 151 144 146 149 162 0
Poland 800 662 603 0 0 0 0
Portugal 202 174 0 0 0 0 0
Romania 523 444 414 372 339 362 0
Slovakia 140 62 62 75 76 77 78
Slovenia 40 35 29 28 28 27 0
Spain 669 695 0 676 663 0 0
Sweden 241 197 0 153 139 128 0
United Kingdom 1200 789 789 776 729 0 0
One or more years in projections are based on 2010 submitted data
One or more years in projections are based on 2011 submitted data

SOx projections submitted by Member States (status March 2012)
SOx (Gg) Gothenburg Ceiling Emissions 2010
WM
2010 2015 2020 2030 2050
Austria 39 19 21 21 21 22 0
Belgium 106 67 0 72 73 0 0
Bulgaria 856 387 0 836 836 0 0
Cyprus 39 22 22 20 7 0 0
Czech Republic 283 173 0 0 0 0 0
Denmark 55 14 14 15 15 16 0
Estonia 83 80 43 0 0 0
Finland 116 68 0 0 76 0 65
France 400 262 262 251 195 0 0
Germany 550 449 451 449 402 0 0
Greece 546 264 0 0 137 0 0
Hungary 550 32 0 61 59 59 0
Ireland 42 26 0 0 0 0 0
Italy 500 210 0 0 0 0 0
Latvia 107 3 0 6 6 0 0
Lithuania 145 38 0 37 20 0 0
Luxembourg 4 2 0 0 0 0 0
Malta 8 0 0 0 0 0
Netherlands 50 34 42 45 46 45 0
Poland 1397 974 994 0 0 0 0
Portugal 170 68 0 0 0 0 0
Romania 918 372 415 161 149 830 0
Slovakia 110 69 69 61 29 30 31
Slovenia 27 10 13 11 11 9 0
Spain 774 483 0 439 436 0 0
Sweden 67 34 0 29 28 29 0
United Kingdom 625 406 406 371 292 0 0
One or more years in projections are based on 2010 submitted data
One or more years in projections are based on 2011 submitted data

NH3 projections submitted by Member States (status March 2012)
NH3 (Gg) Gothenburg Ceiling Emissions 2010
WM
2010 2015 2020 2030 2050
Austria 66 62 61 62 62 62 0
Belgium 74 69 0 67 67 0 0
Bulgaria 108 51 0 108 108 0 0
Cyprus 9 5 5 5 5 0 0
Czech Republic 101 69 0 0 0 0 0
Denmark 69 75 75 63 58 55 0
Estonia 10 9 7 0 0 0
Finland 31 37 0 0 36 37 38
France 780 645 645 542 463 0 0
Germany 550 548 548 547 550 0 0
Greece 73 64 0 0 63 0 0
Hungary 90 65 0 83 80 74 0
Ireland 116 106 0 0 0 0 0
Italy 419 379 0 0 0 0 0
Latvia 44 17 0 14 14 0 0
Lithuania 84 30 0 38 23 0 0
Luxembourg 7 4 0 0 0 0 0
Malta 2 0 0 0 0 0
Netherlands 128 122 131 122 118 119 0
Poland 468 271 284 0 0 0 0
Portugal 108 48 0 0 0 0 0
Romania 210 161 184 179 173 218 0
Slovakia 39 24 24 25 24 23 23
Slovenia 20 17 18 18 18 19 0
Spain 353 371 0 331 321 0 0
Sweden 57 52 0 44 41 42 0
United Kingdom 297 284 284 272 285 0 0
One or more years in projections are based on 2010 submitted data
One or more years in projections are based on 2011 submitted data

PM10 projections submitted by Member States (status March 2012)
PM10 (Gg) Emissions 2010
WM
2010 2015 2020 2030 2050
Austria 35 0 0 0 0 0
Belgium 24 0 0 0 0 0
Bulgaria 41 0 0 0 0 0
Cyprus 3 3 3 3 0 0
Czech Republic 37 0 0 0 0 0
Denmark 32 32 26 23 20 0
Estonia 32 17 17 0 0 0
Finland 55 0 0 32 0 30
France 367 0 0 0 0 0
Germany 193 193 182 171 0 0
Greece 0 0 0 0 0 0
Hungary 46 0 35 35 37 0
Ireland 13 0 0 0 0 0
Italy 202 0 0 0 0 0
Latvia 33 0 0 0 0 0
Lithuania 13 0 14 13 0 0
Luxembourg NE 0 0 0 0 0
Malta 1 0 0 0 0 0
Netherlands 29 30 30 29 29 0
Poland 279 0 0 0 0 0
Portugal 70 0 0 0 0 0
Romania 135 0 0 0 0 0
Slovakia 30 30 33 34 38 38
Slovenia 20 13 12 11 10 0
Spain 112 0 115 118 0 0
Sweden 44 0 38 35 35 0
United Kingdom 114 114 106 104 0 0
One or more years in projections are based on 2010 submitted data
One or more years in projections are based on 2011 submitted data

PM2.5 projections submitted by Member States (status March 2012)
PM2.5 (Gg) Emissions 2010
WM
2010 2015 2020 2030 2050
Austria 0 0 0 0 0 0
Belgium 0 0 0 0 0 0
Bulgaria 0 0 0 0 0 0
Cyprus 2 2 2 0 0 0
Czech Republic 0 0 0 0 0 0
Denmark 26 20 17 14 0 0
Estonia 15 15 0 0 0 0
Finland 0 0 23 0 21 0
France 255 232 210 0 0 0
Germany 111 100 90 0 0 0
Greece 0 0 0 0 0 0
Hungary 0 0 0 0 0 0
Ireland 0 0 0 0 0 0
Italy 0 0 0 0 0 0
Latvia 0 13 12 0 0 0
Lithuania 0 10 10 0 0 0
Luxembourg 0 0 0 0 0 0
Malta 0 0 0 0 0 0
Netherlands 15 14 13 13 0 0
Poland 0 0 0 0 0 0
Portugal 0 0 0 0 0 0
Romania 0 0 0 0 0 0
Slovakia 27 28 29 32 32 27
Slovenia 10 9 8 6 0 10
Spain 0 82 83 0 0 0
Sweden 0 26 24 23 0 0
United Kingdom 67 59 57 0 0 0
One or more years in projections are based on 2010 submitted data
One or more years in projections are based on 2011 submitted data

Some reflections on these projections
• Many gaps......
• Insufficient information to combine projections and perform analysis at the EU27 level
• Sometimes 2010 inventory data <> 2010 data in Table 2A_WM (projections)
• Ceilings not met in 2010 sometimes also not met in future years
• Ceilings met in 2010 sometimes exceeded after 2010
• etc....
• How to reflect and (if needed) how to act under the TFEIP’s projections expert panel to support countries and improve their projections.

Evaluation of low carbon scenarios and inclusion of air pollutant emissions

Comparison of GHG emissions

Comparison of GHG emissions

Comparison of GHG emissions

Comparison of air pollutant emissions