Embed Size (px)
Citation preview

1
28 August 2013
888 Holdings Public Limited Company (“888” or the “Group”)
Half Yearly Report for the six months ended 30 June 2013
888, one of the world’s most popular online gaming entertainment and solutions providers, announces its half yearly results for the six months ended 30 June 2013. Financial Highlights
• Revenue increased 7% to US$200.1m (H1 2012: US$186.4m) • B2C Revenue increased 8% to US$177.0m (H1 2012: US$163.6m) • Adjusted EBITDA* increased 7% to US$38.6m (H1 2012: US$36.0m) • Adjusted EBITDA* margin maintained at 19.3% (H1 2012: 19.3%) • PAT increased 205% to US$32.1m (H1 2012: US$15.7m) • Adjusted EPS increased 37% to 9.9 cents per share (H1 2012: 7.2 cents) • Interim dividend of 3.0 cents per ordinary share (H1 2012: 2.5 cents)
Operational Highlights
• Strong performance driven by Casino and Poker: o Poker up to number four in global PokerScout rankings o Excellent Casino performance driven by CRM activity
• Agreement with Kambi Sports Solutions to develop 888sport • Mobile now fastest growing channel across all products representing 17% of UK revenue • Excellent success in Spain and Italy with further growth opportunities • JV agreement signed in March with Avenue Capital Group creating the All American Poker Network (AAPN) to launch
comprehensive B2C gaming offering in US market upon regulation • Approval as Interactive Gaming Service provider by the Nevada Gaming Commission
Recent Developments
• Agreement signed in August with Caesars Interactive Entertainment (CIE) through the Group's All American Poker Network (AAPN) joint venture with Avenue Capital allowing 888 to offer own-branded Poker and Casino products in New Jersey, subject to required regulatory approvals
Brian Mattingley, CEO of 888, commented: “I am delighted to report another set of excellent results. Record revenue for the first half has been driven by the continued strength of our core Casino and Poker products and our ability to maximize revenue through our exceptional platforms and best-in-class marketing systems. We are making good progress in new markets with tremendous success in Spain and Italy where we see further opportunities for growth. These experiences have given us further confidence in our ability to capitalize on the exciting US opportunity which continues to develop and we believe our strategy and partnerships ensure that we are well positioned to maximize market share as that market becomes regulated.” * As defined in the table below
2
Financial Summary
Six months ended 30 June 20131
$ million
Six months ended 30 June 20121
$ million
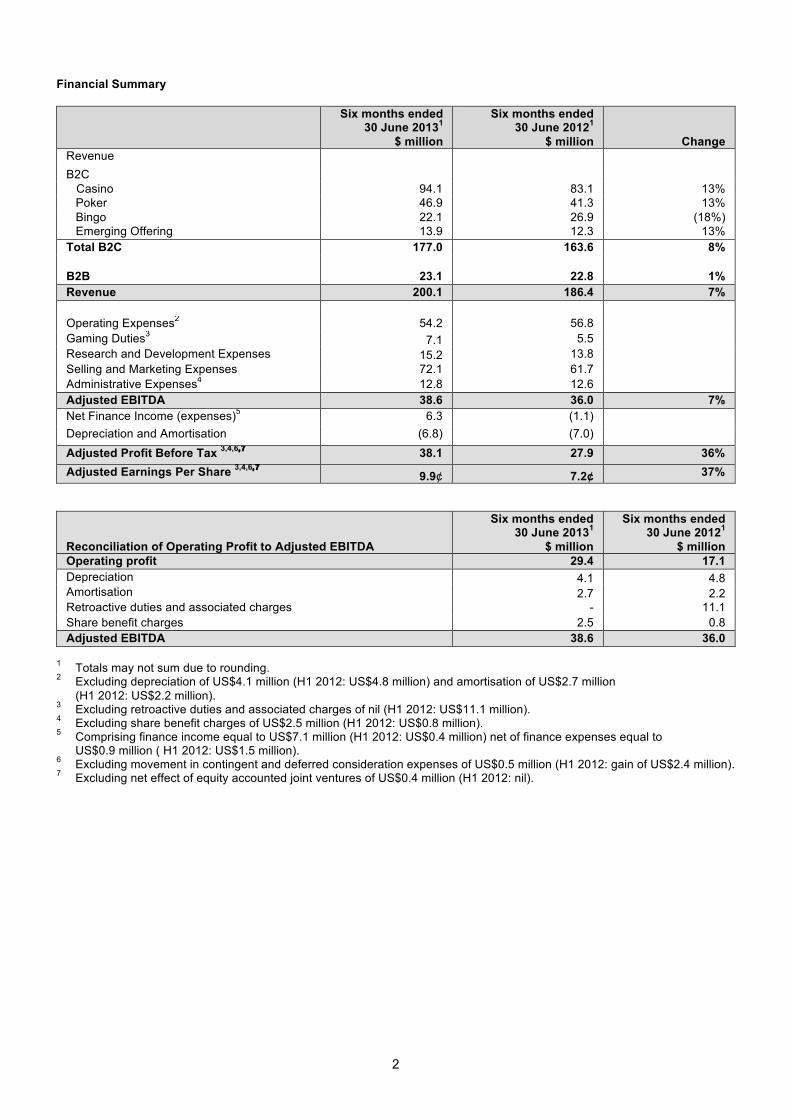
Change Revenue B2C Casino 94.1 83.1 13%
Poker 46.9 41.3 13% Bingo 22.1 26.9 (18%) Emerging Offering 13.9 12.3 13%
Total B2C 177.0 163.6 8% B2B 23.1 22.8 1% Revenue 200.1 186.4 7% Operating Expenses2 54.2 56.8 Gaming Duties3 7.1 5.5 Research and Development Expenses 15.2 13.8 Selling and Marketing Expenses 72.1 61.7 Administrative Expenses4 12.8 12.6 Adjusted EBITDA 38.6 36.0 7% Net Finance Income (expenses)5 6.3 (1.1) Depreciation and Amortisation (6.8) (7.0) Adjusted Profit Before Tax 3,4,6,7 38.1 27.9 36% Adjusted Earnings Per Share 3,4,6,7 9.9¢ 7.2¢ 37%
Reconciliation of Operating Profit to Adjusted EBITDA
Six months ended 30 June 20131
$ million
Six months ended 30 June 20121
$ million Operating profit 29.4 17.1 Depreciation 4.1 4.8 Amortisation 2.7 2.2 Retroactive duties and associated charges - 11.1 Share benefit charges 2.5 0.8 Adjusted EBITDA 38.6 36.0
1 Totals may not sum due to rounding. 2 Excluding depreciation of US$4.1 million (H1 2012: US$4.8 million) and amortisation of US$2.7 million
(H1 2012: US$2.2 million). 3 Excluding retroactive duties and associated charges of nil (H1 2012: US$11.1 million). 4 Excluding share benefit charges of US$2.5 million (H1 2012: US$0.8 million). 5 Comprising finance income equal to US$7.1 million (H1 2012: US$0.4 million) net of finance expenses equal to
US$0.9 million ( H1 2012: US$1.5 million). 6 Excluding movement in contingent and deferred consideration expenses of US$0.5 million (H1 2012: gain of US$2.4 million). 7 Excluding net effect of equity accounted joint ventures of US$0.4 million (H1 2012: nil).

3
Analyst Presentation Brian Mattingley, Chief Executive Officer, Aviad Kobrine, Chief Financial Officer, and Itai Frieberger, Chief Operating Officer, will be hosting a presentation for analysts today at 11:00 (BST) at Investec, 2 Gresham Street, London, EC2V 7QN. The presentation will be available from the investor relations section of 888's website (http://www.888holdingsplc.com) this morning. Contacts and enquiries 888 Holdings Plc Brian Mattingley, Chief Executive Officer +350 200 49 800 Aviad Kobrine, Chief Financial Officer +350 200 49 800 Hudson Sandler Kate Hoare Alex Brennan Andrew Hayes
+44(0) 207 796 4133
This announcement includes statements that are, or may be deemed to be, "forward-looking statements". By their nature, forward-looking statements involve risk and uncertainty since they relate to future events and circumstances. Forward-looking statements may and often do differ materially from actual results. Any forward-looking statements in this announcement reflect 888’s view with respect to future events as at the date of this announcement. Save as required by law or by the Listing Rules of the UK Listing Authority, 888 undertakes no obligation publicly to release the results of any revisions to any forward-looking statements in this announcement that may occur due to any change in its expectations or to reflect events or circumstances after the date of this announcement.

4
Chief Executive's Review
Introduction It is a pleasure for me to report another set of excellent results, led once again by the continued strength of our core Poker and Casino products. The results are a testament to the exceptional platforms built by our hugely talented staff, and our market leading, targeted marketing systems that help to maximise the player numbers and customer spend on our sites. We could not achieve these results without the continuous efforts of our employees, and I would like to thank them for their hard work. Results Group revenue in the first half was a record US$200.1 million (H1 2012: US$186.4 million), an increase of 7%, driven by B2C Casino and Poker. Adjusted EBITDA increased 7.2% to US$38.6 million (H1 2012: US$36.0 million) and profit after tax more than doubled to US$32.1 million (H1 2012: US$15.7 million). Given our continued strong performance the Board has decided to declare an interim dividend of 3.0 cents per share in accordance with our stated dividend policy set out at the time of our 2005 initial public offering. These are a strong set of results across all key metrics. Our excellent product offering, supported by constantly innovative marketing and CRM capabilities, has helped us to deliver consistent growth and has positioned us well to take advantage of positive regulatory developments globally. Our performance continues to be led by our successful Casino and Poker products with B2C revenue up 8% to US$177.0 million (H1 2012: US$163.6 million) and during the first half of 2013 we continued to experience increases in customer deposits, bets and first time depositors. B2C Review Our strong first half performance has been driven by Casino and Poker, with revenue for each business up 13% year on year. As anticipated, the astonishing growth that the launch of Poker6 brought is now inevitably slowing however 888poker is still performing well and in line with the general industry trend. The fact that our Poker offering has now risen to number four on the global PokerScout rankings reinforces the excellent performance of the product. Casino has enjoyed somewhat of a renaissance in the first half of the year gaining market share, particularly in Italy, and maintaining its leading position in Spain, a significant achievement in what is a mature product category. The new Casino50 platform has now fully bedded down and customers are finding the offer exciting and enjoyable to play. We have continued to refresh the games by launching four further slot games all designed by our in-house team. The progress in the platform has been well supported by strong marketing campaigns that have boosted first time depositors and shown a significant return on investment. Having long been at the forefront of online gaming, with best in class Casino and Poker products, we had always been aware of the need to upgrade our sports betting offering to align it with our other products. In May, an agreement was reached with Kambi Sports Solutions, a leading sportsbook supplier, to deliver a fully managed sportsbook solution to 888 under the 888sport brand. The agreement has allowed us to offer a broader range of betting markets and products, for the UK and other markets, through both online and mobile channels. Bringing our back office and marketing expertise to the re-launch of 888sport, we are aiming to enhance player value through more efficient engagement. Early results have been encouraging. It is important however to remember that this product group still remains a relatively small part of overall revenue. It does however represent a further exciting growth opportunity. Bingo has been disappointing with B2C revenues down 18% in this highly competitive, mature market. As with 888sport, we have undertaken a strategic review of this segment and carried out extensive market research. We have restructured the department and it is currently in the process of becoming a fully integrated vertical to replicate the approach adopted with Casino and Poker. Operational and technical improvements are being made to the bingo platform and we are confident of arresting the decline.

5
Mobile is becoming the fastest growing channel across all product categories and continues to be a key focus for 888. In the UK market across Casino, Poker and Sport 17% of total revenue is now transacted via smartphones and tablets. First time depositors in H1 2013 in the UK via mobile/touch have more than doubled compared to the preceding half. We have channelled resource and development in mobile but this is an immature channel for the industry and we know that there is still more to do in understanding and developing our CRM systems and we will evolve our offering accordingly. New Markets Following the tremendous success of our launches in Italy and Spain, as would be expected we have spent considerable time and effort ensuring that we are as strongly positioned as possible to replicate this success in the United States. We can now say with certainty that we will shortly be operational in the US, once platform compliance has been granted by the regulators. While it will be a slow and resource intensive process, the region clearly has the potential to bring significant future revenues to the company. The final strand of our US strategy was completed in May 2013 with the joint venture agreement with global investment firm Avenue Capital Group to launch and operate a comprehensive B2C gaming offering in the US market upon regulation. The newly formed company – the All American Poker Network (AAPN) which is incorporated in Delaware, will launch 888's brands into the US market. Importantly, the agreement with a substantial financial partner provides the firepower that we need to take advantage of the significant opportunities that will be provided by a regulated US gaming market. At the same time, we announced an agreement with Treasure Island, one of the most prestigious and well renowned Las Vegas operators, for the launch of online Poker in Nevada through AAPN. This deal follows our partnerships with Caesars Interactive Entertainment and WMS, signed last year. As announced on 7th March 2013, 888 became the first non-US operator to be recommended by the Nevada Gaming Control Board to the Nevada Gaming Commission for the approval of licensing as an Interactive Gaming Service Provider. This licence will allow AAPN to launch the real money 888poker brand in Nevada, expected in the third quarter of this year, once we receive final sign-off by the gaming control board on the certification of our software platform. There have also been positive developments in New Jersey during the period, where an agreement was signed with Caesars Interactive Entertainment (CIE) through AAPN allowing 888 to offer own-branded Poker and Casino products, again subject to required regulatory approvals. Current Trading and Outlook Current trading is in line with the Board’s expectations for the full year. Overall average daily revenue during Q3 so far is comparable to the same period last year and is led by Casino and Poker. The potential of the US market is generating excitement in the industry although we remain realistic about potential time frames. However, we are confident that 888 has the right strategy, partnerships and expertise to take advantage of the opportunity and maximize market share as regulation takes place. In tandem with our efforts in the US we still have opportunities in other regulated markets including slots in Spain, sport in various markets and the development of mobile in Spain and Italy. We are focused on ensuring we capitalise on these opportunities with increased investment in the remainder of the year and beyond to deliver on our objectives and continue to innovate and grow the Group. Brian Mattingley Chief Executive Officer 28 August 2013

6
Condensed Consolidated Income Statement For the six months ended 30 June 2013 Six months
ended 30 June
Six months ended
30 June
Year ended
31 December 2013 2012 2012 US $ million US $ million US $ million Note (unaudited) (audited) Revenue 2 200.1 186.4 375.8 Operating expenses 61.0 63.8 128.3 Gaming duties 7.1 16.6 22.6 Research and development expenses 15.2 13.8 27.2 Selling and marketing expenses 72.1 61.7 131.2 Administrative expenses 15.3 13.4 29.6 Operating profit before impairment charges, retroactive duties and associated charges and share benefit charges
31.9 29.0 51.9
Impairment charges - - (2.2) Retroactive duties and associated charges - (11.1) (11.1) Share benefit charges (2.5) (0.8) (1.7) Operating profit 3 29.4 17.1 36.9 Finance income 7.1 0.4 4.6 Finance expenses (0.9) (1.5) (2.7) Movement in contingent and deferred consideration (0.5) 2.4 2.0 Share of post-tax loss of equity accounted joint ventures 7 (1.5) - - Profit on acquisition of equity accounted joint venture 7 1.9 - - Profit before tax 35.5 18.4 40.8 Taxation 3.4 2.7 5.4 Profit after tax for the period attributable to equity holders of the parent
32.1 15.7 35.4
Earnings per share
4
Basic 9.2¢ 4.5¢ 10.2¢ Diluted 9.0¢ 4.4¢ 10.1¢

7
Condensed Consolidated Statement of Comprehensive Income For the six months ended 30 June 2013 Six months
ended 30 June
Six months ended
30 June
Year ended
31 December 2013 2012 2012 US $ million US $ million US $ million (unaudited) (audited) Profit for the period 32.1 15.7 35.4 Actuarial losses on defined benefit pension plan - - (0.7) Total comprehensive income for the period attributable to equity holders of the parent 32.1 15.7 34.7

8
Condensed Consolidated Balance Sheet At 30 June 2013
30 June 30 June 31 December 2013 2012 2012 US $ million US $ million US $ million Note (unaudited) (audited) Assets Non-current assets Intangible assets 149.8 145.3 147.7 Property, plant and equipment 17.3 18.2 18.3 Investment in equity accounted joint venture 7 0.4 1.2 - Available for sale investment 0.2 0.2 0.2 Deferred taxes - 0.2 0.4 167.7 165.1 166.6 Current assets Cash and cash equivalents 89.3 68.3 81.5 Short term investments 3.6 0.9 3.5 Trade and other receivables 30.8 21.8 33.0 123.7 91.0 118.0 Total assets 291.4 256.1 284.6 Equity and liabilities Equity attributable to equity holders of the parent
Share capital 3.2 3.2 3.2 Share premium 0.8 0.1 0.1 Retained earnings 155.8 134.5 144.9 Total equity attributable to equity holders of the parent 159.8 137.8 148.2 Liabilities
Current liabilities Trade and other payables 80.1 71.4 85.4 Customer deposits 49.3 46.2 49.5 Contingent and deferred consideration 0.6 0.7 0.7 130.0 118.3 135.6 Non-current liabilities Share benefit charges - cash settled 1.6 - 0.8 Total liabilities 131.6 118.3 136.4 Total equity and liabilities 291.4 256.1 284.6
The condensed financial statements on pages 6 to 19 were approved and authorised for issue by the Board of Directors on 28 August 2013 and were signed on its behalf by: __________________ __________________ Brian Mattingley Aviad Kobrine Chief Executive Officer Chief Financial Officer

9
Condensed Consolidated Statement of Changes in Equity For the six months ended 30 June 2013 Share Share Retained capital premium earnings Total US $ million US $ million US $ million US $ million
Balance at 1 January 2012 (audited) 3.2 0.1 118.0 121.3 Equity settled share benefit charges - - 0.8 0.8 Issue of shares - - - - Profit after tax for the period attributable to equity holders of the parent - - 15.7 15.7 Balance at 30 June 2012 (unaudited) 3.2 0.1 134.5 137.8 Dividend paid - - (8.7) (8.7) Equity settled share benefit charges - - 0.1 0.1 Issue of shares - - - - Profit after tax for the period attributable to equity holders of the parent - - 19.7 19.7 Other comprehensive loss for the year - - (0.7) (0.7) Balance at 1 January 2013 (audited) 3.2 0.1 144.9 148.2 Dividend paid - - (22.8) (22.8) Equity settled share benefit charges - - 1.6 1.6 Issue of shares - 0.7 - 0.7 Profit after tax for the period attributable to equity holders of the parent - - 32.1 32.1 Balance at 30 June 2013 (unaudited) 3.2 0.8 155.8 159.8
The following describes the nature and purpose of each reserve within equity. Share capital — represents the nominal value of shares allotted, called-up and fully paid. Share premium — represents the amount subscribed for share capital in excess of nominal value. Retained earnings — represents the cumulative net gains and losses recognised in the consolidated statement of comprehensive income.

10
Condensed Consolidated Statement of Cash Flows For the six months ended 30 June 2013 Six months
ended 30 June
Six months ended
30 June
Year ended
31 December 2013 2012 2012 US $ million US $ million US $ million (unaudited) (audited) Cash flows from operating activities Profit before income tax 35.5 18.4 40.8 Adjustments for: Impairment charges - - 2.2 Depreciation 4.1 4.8 9.2 Amortisation 2.7 2.2 5.6 Interest received (0.1) (0.4) (0.3) Interest expense - 1.0 1.1 Foreign exchange differences on deferred consideration - 0.6 0.5 Fair value movements on Foreign exchange derivatives (2.4) 1.1 (3.3) Movement in contingent and deferred consideration 0.5 (2.4) (2.0) Profit on acquisition of equity accounted joint venture (1.9) - - Share of post-tax profit of equity accounted joint ventures 1.5 - - Share benefit charges 2.5 0.8 1.7 42.4 26.1 55.5 Decrease (increase) in trade receivables 3.5 3.8 (2.9) Decrease (increase) in other accounts receivables 1.0 0.9 (0.4) Increase (decrease) in customer deposits (0.2) 1.3 4.6 Increase (decrease) in trade and other payables (6.5) 4.5 18.9 Cash generated from operations 40.2 36.6 75.7 Income tax paid (1.9) (2.3) (5.0) Net cash generated from operating activities 38.3 34.3 70.7 Cash flows from investing activities
Consideration paid on acquisitions (0.6) (36.4) (36.7)
Purchase of property, plant and equipment (3.0) (6.0) (10.6) Decrease (increase) in short term investments (0.1) 5.1 2.5 Interest received 0.1 0.4 0.3 Acquisition of intangible assets (0.1) (0.2) (0.3) Internally generated intangible assets (4.7) (3.8) (10.5) Net cash used in investing activities (8.4) (40.9) (55.3) Cash flows from financing activities Interest paid - (1.0) (1.1) Issue of shares 0.7 - - Dividends paid (22.8) - (8.7) Net cash used in financing activities (22.1) (1.0) (9.8) Net increase (decrease) in cash and cash equivalents 7.8 (7.6) 5.6 Cash and cash equivalents at the beginning of the period 81.5 75.9 75.9 Cash and cash equivalents at the end of the period (note 1) 89.3 68.3 81.5

11
Notes to the Condensed Consolidated Financial Statements
1 Basis of preparation The condensed consolidated half-yearly financial information of the Group has been prepared in accordance with International Financial Reporting Standards, including International Accounting Standards (‘IAS’) and Interpretations (collectively ‘IFRS’), adopted by the International Accounting Standards Board (‘IASB’) and endorsed for use by companies listed on an EU regulated market. The half-yearly report has been prepared in accordance with the Disclosure and Transparency Rules of the Financial Services Authority. These results have been prepared on the basis of accounting policies expected to be adopted in the Group’s full financial statements for the year ending 31 December 2013 which are not expected to be significantly different to those set out in note 2 to the Group’s audited financial statements for the year ended 31 December 2012 with the exception of the new standards adopted during 2013 as shown below. The new standards adopted during 2013 are:
IFRS7 (amended) - Offsetting Financial assets and Financial Liabilities IFRS13- Fair Value Measurement IAS1 (amended) - Presentation of items of other comprehensive income IAS12 (amended) - Deferred tax-Recovery of Underlying assets; and IAS19 (revised) - Employee benefits
These have no material impact on the financial statements. The adoption if IFRS13 has given rise to additional disclosures in these interim statements. The Group's forecasts and projections show that the Group should be able to continue its ordinary course of business within its available financial resources. The Group complies with IAS 34 in the presentation of the half-yearly financial statements. The financial information is presented in US Dollars (US$ million) because that is the currency the Group primarily operates in. The comparatives for the year ended 31 December 2012 are not the Group’s full statutory accounts for that year. A copy of the statutory accounts for that year has been delivered to the Registrar of Companies in Gibraltar and is also available from the Company’s website. The auditors' report on those accounts was unqualified and did not contain statements under Section 10(2) of the Gibraltar Companies Accounts Act 1999 or Section 182(1)(a) of the Gibraltar Companies Act. The condensed consolidated set of financial statements included in this half-yearly financial report is unaudited and does not constitute statutory accounts. The risks and uncertainties and significant estimates and judgements faced by the Group have not changed significantly since the 2012 Annual Report was published and are not expected to change significantly during the remaining six months of the financial year. Presentation of half year comparatives Following the changes to presentation of the consolidated balance sheet made at the 2012 year end and followed in this statement, comparative figures for the six months ended 30 June 2012 have been amended accordingly. The amendment is as follows: Cash deposits in accounts with restricted access, primarily in respect of regulated market requirements, have been included as short terms investments and the comparatives adjusted accordingly. The effect on the comparative cash flow for the six months ended 30 June 2012 has been to increase the cash used in investing activities by US$5.1 million, and therefore reduce the decrease in cash and cash equivalents for the period by the same amount. The new presentation has no effect on net assets nor on the reported profit and loss.

12
2 Segment information
Six months ended 30 June 2013 B2C B2B Consolidated Emerging
Casino Poker Bingo offerings Total B2C US $ million US $ million (unaudited) Revenue 94.1 46.9 22.1 13.9 177.0 23.1 200.1 Result Segment result 82.9 13.4 96.3 Unallocated corporate expenses1
66.9
Operating Profit 29.4 Financial income 7.1 Financial expenses (0.9) Movement in contingent and deferred consideration
(0.5)
Share of post-tax profit of equity accounted joint ventures
(1.5) Profit on acquisition of equity accounted joint venture
1.9 Taxation (3.4) Profit for the period 32.1 Assets Unallocated corporate assets
291.4
Total assets 291.4 Liabilities Segment liabilities 47.2 2.1 49.3 Unallocated corporate liabilities
82.3
Total liabilities 131.6
1 Including share benefit charges of US$ 2.5 million charged to administrative expenses.

13
Notes to the Condensed Consolidated Financial Statements
2 Segment information (continued)
Six months ended 30 June 2012 B2C B2B Consolidated Emerging
Casino Poker Bingo offerings Total B2C US $ million US $ million (unaudited) Revenue 83.1 41.3 26.9 12.3 163.6 22.8 186.4 Result Segment result 80.6 13.0 93.6 Unallocated corporate expenses1
76.5
Operating Profit 17.1 Financial income 0.4 Financial expenses (1.5) Movement in contingent and deferred consideration
2.4
Share of post-tax profit of equity accounted joint ventures
- Taxation (2.7) Profit for the period 15.7 Assets Unallocated corporate assets
256.1
Total assets 256.1 Liabilities Segment liabilities 44.0 2.3 46.3 Unallocated corporate liabilities
72.0
Total liabilities 118.3
1 Including share benefit charges of US$ 0.8 million charged to administrative expenses.

14
2 Segment information (continued)
Year ended 31 December 2012 B2C B2B Consolidated Emerging
Casino Poker Bingo offerings Total B2C US $ million US $ million (audited) Revenues 165.5 87.5 51.8 25.0 329.8 46.0 375.8 Result Segment result before impairments
157.3 26.7 184.0
Impairments (0.6) (1.6) (2.2) Segment result 156.7 25.1 181.8 Unallocated corporate expenses1
144.9
Operating profit 36.9 Financial income 4.6 Financial expenses (2.7) Movement in contingent and deferred consideration
2.0
Share of post-tax profit of equity accounted joint ventures
- Taxation (5.4) Profit for the year 35.4 Assets Unallocated corporate assets
284.6
Total assets 284.6 Liabilities Segment liabilities 46.5 3.0 49.5 Unallocated corporate liabilities
86.9
Total liabilities 136.4
1 Including share benefit charges of US$1.7 million charged to administrative expenses.
Other than where amounts are allocated specifically to the B2C and B2B segments above, the expenses, assets and liabilities relate jointly to all segments. These amounts are not discretely analysed between the two operating segments as any allocation would be arbitrary. Geographical information The Group’s performance can also be reviewed by considering the geographical markets and geographical locations within which the Group operates. This information is outlined below:
Six months
ended 30 June
Six months ended
30 June
Year ended
31 December 2013 2012 2012 US $ million US $ million US $ million (unaudited) (audited)
Revenue by geographical market UK 82.6 80.1 161.8 Europe (excluding UK) 80.1 71.0 142.1 Americas 22.0 19.4 38.2 Rest of World 15.4 15.9 33.7 Total operating income 200.1 186.4 375.8
Notes to the Condensed Consolidated Financial Statements

15
3 Operating profit
Six months ended
30 June
Six months ended
30 June
Year ended
31 December 2013 2012 2012 US $ million US $ million US $ million (unaudited) (audited)
Operating profit is stated after charging: Staff costs 38.8 38.4 80.8 Audit fees to BDO LLP 0.2 0.2 0.3 Audit fees to BDO Limited - - 0.1 Other fees paid to BDO LLP- other assurance related matters 0.1 - 0.1 Depreciation (within operating expenses) 4.1 4.8 9.2 Amortization (within operating expenses) 2.7 2.2 5.6 Chargebacks 1.6 1.7 3.3 Payment service providers’ commissions 10.8 11.2 21.7 Retroactive taxes and associated charges - 11.1 11.1 Impairment costs (within administrative expenses) - - 2.2

16
4 Earnings per share
Basic earnings per share Basic earnings per share have been calculated by dividing the profit attributable to ordinary shareholders by the weighted average number of shares in issue during the period. Diluted earnings per share In accordance with IAS 33, ‘Earnings per share’, the weighted average number of shares for diluted earnings per share takes into account all potentially dilutive shares and share options granted, which are not included in the number of shares for basic earnings per share. Certain equity instruments have been excluded from the calculation of diluted EPS as their performance conditions of being issued were not deemed to be satisfied at the end of the performance period or it would not be advantageous for holders to exercise their options. The number of equity instruments excluded from the diluted EPS calculation is 1,414,708 (2012: Half year - 3,205,587, Full year – 6,363,756).
Six months
ended 30 June
Six months ended
30 June
Year ended
31 December 2013 2012 2012 US $ million US $ million US $ million (unaudited) (audited) Profit for the period attributable to equity holders of the parent (US$ million) 32.1 15.7
35.4
Weighted average number of Ordinary Shares in issue 350,240,227 348,179,269 348,880,677 Effect of dilutive Ordinary Shares and Share options 6,342,081 3,402,203 2,665,293 Weighted average number of dilutive Ordinary Shares 356,582,308 351,581,472 351,545,970 Basic 9.2¢ 4.5¢ 10.2¢ Diluted 9.0¢ 4.4¢ 10.1¢
Adjusted earnings per share The Directors believe that EPS excluding impairment charges, restructuring costs, retroactive taxes and associated charges, impairment charges and movement in contingent and deferred consideration better reflects the underlying performance of the business and assists in providing a clearer view of the performance of the Group. Reconciliation of profit to profit excluding share benefit charges, retroactive taxes and associated charges, movement in contingent and deferred consideration, impairment charges, share of post-tax loss of equity accounted joint ventures and profit on acquisition of equity accounted joint venture: Six months
ended 30 June
Six months ended
30 June
Year ended
31 December 2013 2012 2012 US $ million US $ million US $ million (unaudited) (audited) Profit from continuing operations attributable to ordinary shareholders 32.1 15.7 35.4 Share benefit charges 2.5 0.8 1.7 Retroactive taxes and associated charges - 11.1 11.1 Movement in contingent and deferred consideration 0.5 (2.4) (2.0) Impairment charges - - 2.2 Share of post-tax loss of equity accounted joint ventures 1.5 - - Profit on acquisition of equity accounted joint venture (1.9) - - Profit excluding share benefit charges, retroactive taxes and associated charges, movement in contingent and deferred consideration, impairment charges, share of post-tax loss of equity accounted joint ventures and profit on acquisition of equity accounted joint venture 34.7 25.2 48.4 Weighted average number of Ordinary Shares in issue 350,240,227 348,179,269 348,880,677 Weighted average number of dilutive Ordinary Shares 357,063,642 351,581,472 351,545,970 Adjusted basic earnings per share 9.9¢ 7.2¢ 13.9¢ Adjusted diluted earnings per share 9.7¢ 7.2¢ 13.8¢

17
Notes to the Condensed Consolidated Financial Statements
5 Contingent liabilities and regulatory issues (a) As part of the Board’s ongoing regulatory compliance and operational risk assessment process, the Board
continues to monitor legal and regulatory developments, and their potential impact on the business, and continues to take appropriate advice in respect of these developments.
(b) Given the nature of the legal and regulatory landscape of the industry, from time to time the Group has received
notices, communications and legal actions from a small number of regulatory authorities and other parties in respect of its activities. The Group has taken legal advice as to the manner in which it should respond and the likelihood of success of such actions. Based on this advice and the nature of the actions, the Board is unable to quantify reliably any material outflow of funds that may result, if any. Accordingly, no provisions have been made.
(c) The Group operates in numerous jurisdictions. Accordingly, the Group is filing tax returns, providing for and paying
all taxes and duties it believes are due based on local tax laws, transfer pricing agreements and tax advice obtained. The Group is periodically subject to audits and assessments by local taxing authorities. The Board is unable to quantify reliably any exposure for additional taxes, if any, that may arise from the final settlement of such assessments. Accordingly, no additional provisions have been made.
6 Related party transactions
The aggregate amounts payable to the directors as well as share-based charges are set out below: Six months
ended 30 June
Six months ended
30 June Year ended
31 December 2013 2012 2012 US $ million US $ million US $ million (unaudited) (audited)
Short term benefits 0.9 0.9 3.0 Share benefit charges – equity settled 0.7 0.2 0.3 Share benefit charges – cash settled 0.9 - 0.8
2.5 1.1 4.1
7 Investment in equity accounted joint ventures The following entities meet the definition of Jointly Controlled Entities and have been equity accounted in the consolidated financial statements:
Country of
Percentage of equity interest
30 June 2013
Percentage of equity interest
30 June 2012
Percentage of equity interest
31 December 2012
Name incorporation % % %
AAPN Holdings LLC USA 47% - -
AGN LLC USA 100% - -
Technology Solutions (Gibraltar) Limited
Gibraltar 50% 50% 50%
18
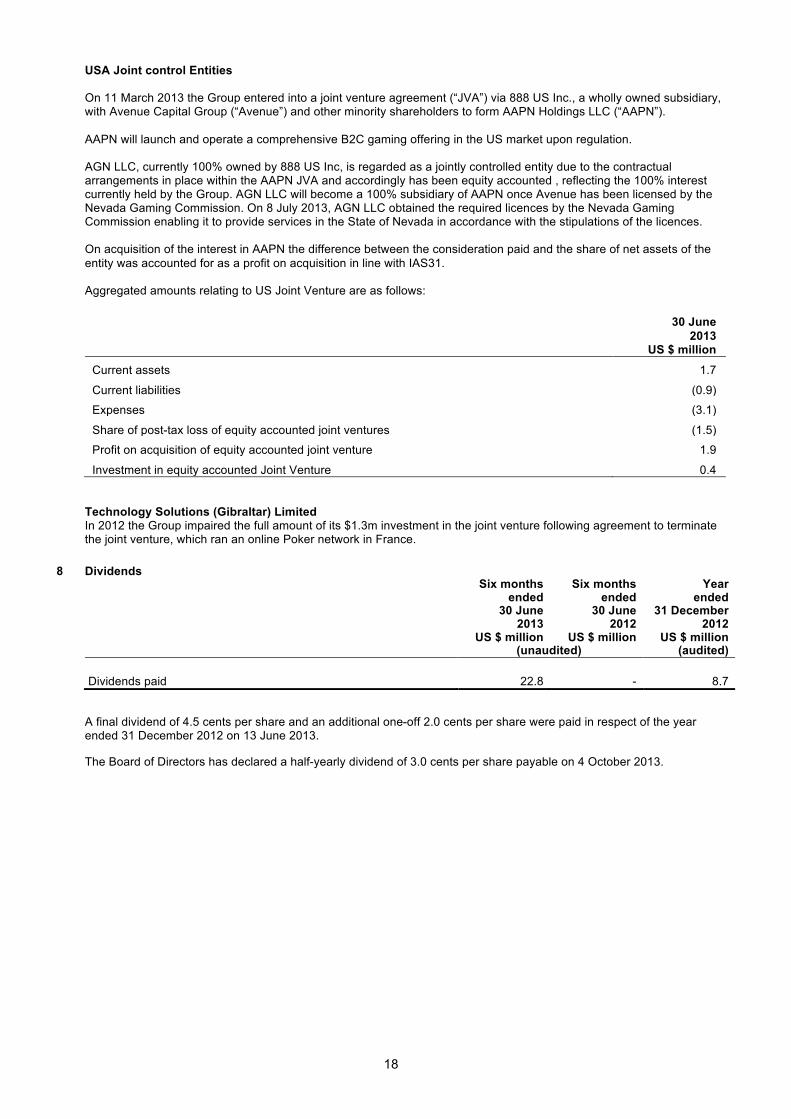
USA Joint control Entities On 11 March 2013 the Group entered into a joint venture agreement (“JVA”) via 888 US Inc., a wholly owned subsidiary, with Avenue Capital Group (“Avenue”) and other minority shareholders to form AAPN Holdings LLC (“AAPN”). AAPN will launch and operate a comprehensive B2C gaming offering in the US market upon regulation. AGN LLC, currently 100% owned by 888 US Inc, is regarded as a jointly controlled entity due to the contractual arrangements in place within the AAPN JVA and accordingly has been equity accounted , reflecting the 100% interest currently held by the Group. AGN LLC will become a 100% subsidiary of AAPN once Avenue has been licensed by the Nevada Gaming Commission. On 8 July 2013, AGN LLC obtained the required licences by the Nevada Gaming Commission enabling it to provide services in the State of Nevada in accordance with the stipulations of the licences. On acquisition of the interest in AAPN the difference between the consideration paid and the share of net assets of the entity was accounted for as a profit on acquisition in line with IAS31. Aggregated amounts relating to US Joint Venture are as follows:
30 June 2013
US $ million
Current assets 1.7
Current liabilities (0.9)
Expenses (3.1)
Share of post-tax loss of equity accounted joint ventures (1.5)
Profit on acquisition of equity accounted joint venture 1.9
Investment in equity accounted Joint Venture 0.4
Technology Solutions (Gibraltar) Limited In 2012 the Group impaired the full amount of its $1.3m investment in the joint venture following agreement to terminate the joint venture, which ran an online Poker network in France.
8 Dividends
Six months ended
30 June
Six months ended
30 June
Year ended
31 December 2013 2012 2012 US $ million US $ million US $ million (unaudited) (audited)
Dividends paid 22.8 - 8.7
A final dividend of 4.5 cents per share and an additional one-off 2.0 cents per share were paid in respect of the year ended 31 December 2012 on 13 June 2013. The Board of Directors has declared a half-yearly dividend of 3.0 cents per share payable on 4 October 2013.

19
9 Financial assets and liabilities
Materially all the Group’s financial instruments carried at fair value are in respect of derivative foreign exchange contracts. The carrying value of these was an asset of $5.7m at 30 June 2013. ($3.3m at 31 December 2012). These comprise level 2 fair value measurement instruments, valued using forward exchange rates that are quoted in an active market. Other financial instruments carried at fair value are not considered material. There were no changes in valuation techniques or transfers between categories in the period. The fair value of the following financial assets and liabilities approximate to their carrying amount:
Trade and other receivables Other current financial assets Cash and cash equivalents Trade and other payables Customer deposits

20
Statement of Directors’ Responsibilities The Directors confirm, to the best of their knowledge, that this condensed set of unaudited financial statements has been prepared in accordance with IAS 34 as adopted by the European Union, and that the half-yearly management report includes a fair review of the information required by DTR 4.2.7R and DTR 4.2.8R of the Disclosure and Transparency Rules of the UK Financial Services Authority. A list of the current Directors is maintained on the 888 Holdings Public Limited Company Website: www.888holdingsplc.com. By order of the Board Brian Mattingley Aviad Kobrine Chief Executive Officer Chief Financial Officer

21
Independent Review Report to 888 Holdings Public Limited Company
Introduction We have been engaged by the Company to review the condensed set of financial statements in the half-yearly financial report for the six months ended 30 June 2013 which comprises the Consolidated Income Statement, the Consolidated Statement of Comprehensive Income, the Consolidated Balance Sheet, the Consolidated Statement of Changes in Equity, the Consolidated Cash Flow Statement, and related explanatory notes 1 to 9. We have read the other information contained in the half-yearly financial report and considered whether it contains any apparent misstatements or material inconsistencies with the information in the condensed set of financial statements. Directors’ responsibilities The half-yearly financial report is the responsibility of and has been approved by the Directors. The Directors are responsible for preparing the half-yearly financial report in accordance with the Disclosure and Transparency Rules of the United Kingdom’s Financial Services Authority. As disclosed in note 1, the annual financial statements of the Group are prepared in accordance with International Financial Reporting Standards (IFRSs) as adopted by the European Union. The condensed set of financial statements included in this half-yearly financial report has been prepared in accordance with International Accounting Standard 34, ‘Half-Yearly Financial reporting’, as adopted by the European Union. Our responsibility Our responsibility is to express to the Company a conclusion on the condensed set of financial statements in the half-yearly financial report based on our review. Our report has been prepared in accordance with the terms of our engagement to assist the Company in meeting the requirements in respect to half-yearly financial reporting in accordance with the Disclosure and Transparency Rules of the United Kingdom’s Financial Services Authority and for no other purpose. No person is entitled to rely on this report unless such a person is a person entitled to rely upon this report by virtue of and for the purpose of our terms of engagement or has been expressly authorised to do so by our prior written consent. Save as above, we do not accept responsibility for this report to any other person or for any other purpose and we hereby expressly disclaim any and all such liability. Scope of review We conducted our review in accordance with International Standard on Review Engagements (UK and Ireland) 2410, ‘Review of Half-Yearly Financial Information Performed by the Independent Auditor of the Entity’, issued by the Auditing Practices Board for use in the United Kingdom. A review of half-yearly financial information consists of making enquiries, primarily of persons responsible for financial and accounting matters, and applying analytical and other review procedures. A review is substantially less in scope than an audit conducted in accordance with International Standards on Auditing (UK and Ireland) and consequently does not enable us to obtain assurance that we would become aware of all significant matters that might be identified in an audit. Accordingly, we do not express an audit opinion. Conclusion Based on our review, nothing has come to our attention that causes us to believe that the condensed set of financial statements in the half-yearly financial report for the six months ended 30 June 2013 is not prepared, in all material aspects, in accordance with International Accounting Standard 34, as adopted by the European Union, and the Disclosure and Transparency Rules of the United Kingdom’s Financial Services Authority. BDO LLP Chartered Accountants and Registered Auditors 55 Baker Street London W1U 7EU United Kingdom 28 August 2013