Embed Size (px)
Citation preview

NEW ISSUE/BOOK-ENTRY RATINGS: 2017C Infrastructure Revenue Bonds: Aaa (Moody’s), AAA (S&P)2017C Moral Obligation Bonds: Aa2 (Moody’s), AA (S&P)
(See “Ratings” herein)
In the opinion of Bond Counsel, under current law and subject to the conditions described in “TAX MATTERS” herein, interest on the 2017C Bonds (a) is excludable from gross income for federal income tax purposes under Section 103 of the Internal Revenue Code of 1986, as amended (the “Code”), and (b) is not treated as a preference item in calculating the alternative minimum tax imposed under the Code on individuals and corporations. However, interest on the 2017C Bonds must be included in the calculation of a corporation’s federal alternative minimum tax. Bond Counsel is further of the opinion that interest on the 2017C Bonds is exempt from income taxation by the Commonwealth of Virginia (the “Commonwealth”). See “TAX MATTERS” herein regarding certain other tax considerations.
$86,945,000 Infrastructure and State Moral Obligation Revenue Bonds(Virginia Pooled Financing Program) Series 2017C
consisting of
$56,630,000 Infrastructure Revenue Bonds
$30,315,000 State Moral Obligation Revenue BondsDated: Date of Delivery Due: November 1, as shown on the inside cover page
This Official Statement has been prepared by the Virginia Resources Authority (“VRA”) to provide information on the above-referenced bonds (collectively, the “2017C Bonds”). Selected information is presented on this cover page for the convenience of the user. To make an informed decision regarding the 2017C Bonds, a prospective investor should read this Official Statement in its entirety. Unless otherwise defined, all capitalized terms used on this cover page have the meanings assigned to them herein.
Security The 2017C Bonds are limited obligations of VRA, payable from (a) the payments under the Local Obligations, (b) the amounts held in certain funds and accounts and (c) the earnings, if any, derived from the investment of such funds and accounts, all as more fully described herein. The pledge and grant of payments under the Local Obligations securing the 2017C Moral Obligation Bonds is in all respects junior and subordinate to the pledge and grant securing the 2017C Infrastructure Revenue Bonds.
Neither the Commonwealth nor any political subdivision thereof, including VRA, will be obligated to pay the principal of, premium, if any, or interest on the 2017C Bonds or other costs incident thereto except from the revenues, money or property of VRA pledged for such purpose. Neither the faith and credit nor the taxing power of the Commonwealth or any political subdivision thereof is pledged to the payment of the principal of, premium, if any, or interest on the 2017C Bonds. VRA has no taxing power.
Purpose The net 2017C Bond proceeds will be used to purchase or acquire the 2017C Local Obligations issued by the 2017C Local Governments to finance or refinance Qualified Projects.
Issued Pursuant to Master Indenture of Trust dated as of December 1, 2003, as previously supplemented and amended and as further supplemented by a Fortieth Supplemental Series Indenture of Trust dated as of November 1, 2017, between VRA and U.S. Bank National Association, as successor trustee.
Interest Rates/Yields See inside cover pages.
Redemption See inside cover pages.
Interest Payment Dates May 1 and November 1, commencing May 1, 2018.
Interest Computation 360-day year comprised of 12 months of 30 days each.
Denomination $5,000 or integral multiples thereof.
Regular Record Date The 15th day of the month preceding each payment date.
Registration Book-entry only through the facilities of The Depository Trust Company.
Trustee U.S. Bank National Association, Richmond, Virginia.
Bond Counsel McGuireWoods LLP, Richmond, Virginia.
General Counsel Christian & Barton, L.L.P., Richmond, Virginia
Underwriters’ Counsel Troutman Sanders LLP, Richmond, Virginia
Financial Advisor Davenport & Company LLC, Richmond, Virginia.
Conditions Affecting Issuance The 2017C Bonds are offered when, as and if issued, subject to, among other conditions, the approving legal opinion of McGuireWoods LLP, Bond Counsel.
Closing/Delivery Date On or about November 15, 2017.
Underwriters for 2017C Infrastructure Revenue Bonds:
Raymond James Loop Capital Markets
Citigroup JefferiesWinning Bidder for the 2017C Moral Obligation Bonds:
Robert W. Baird & Co., Inc.Dated: November 1, 2017

(i)
VIRGINIA RESOURCES AUTHORITY $56,630,000 Infrastructure Revenue Bonds
(Virginia Pooled Financing Program), Series 2017C (Base CUSIP: 92818M)∗∗ $51,620,000 Serial Bonds
Maturity November 1
Principal Amount
Interest Rate
Yield
Price
CUSIP∗∗
Suffix
2018 $2,795,000 3.000% 1.010% 101.898% RE2 2019 1,295,000 5.000 1.140 107.464 RF9 2020 1,655,000 3.000 1.230 105.131 RG7 2021 2,395,000 5.000 1.360 113.990 RH5 2022 2,420,000 4.000 1.500 111.909 RJ1 2023 2,075,000 5.000 1.650 118.944 RK8 2023 500,000 2.000 1.650 101.979 TE0 2024 2,650,000 5.000 1.780 120.993 RL6 2025 2,775,000 5.000 1.920 122.636 RM4 2026 2,875,000 5.000 2.020 124.313 RN2 2027 3,000,000 5.000 2.120 125.738 RP7 2028 2,980,000 5.000 2.250 124.417* RQ5 2029 3,085,000 5.000 2.330 123.612* RR3 2030 3,205,000 5.000 2.390 123.012* RS1 2031 3,440,000 5.000 2.430 122.615* RT9 2032 3,565,000 5.000 2.480 122.119* RU6 2033 2,410,000 4.000 2.810 110.275* RV4 2034 2,130,000 4.000 2.890 109.547* RW2 2035 2,195,000 3.000 3.150 97.953 RX0 2036 2,235,000 3.125 3.220 98.658 RY8 2037 1,940,000 3.125 3.270 97.885 RZ5
$5,010,000 4.000% 2017C Infrastructure Revenue Term Bonds due November 1, 2044, Priced at
106.600%* to Yield 3.220% CUSIP** Suffix SA9
∗ Priced to November 1, 2027 call date. ∗∗ See the paragraph titled "Use of CUSIP Numbers in this Official Statement" in Section One - Summary of the 2017C Bonds and the
Virginia Pooled Financing Program, regarding the use of CUSIP numbers in this Official Statement.

(ii)
VIRGINIA RESOURCES AUTHORITY
$30,315,000 State Moral Obligation Revenue Bonds (Virginia Pooled Financing Program), Series 2017C
(Base CUSIP: 92818M) ∗∗
Maturity November 1
Principal Amount
Interest Rate
Yield
Price
CUSIP∗∗ Suffix
2018 $1,520,000 2.000% 1.080% 100.877 SB7 2019 530,000 2.000 1.120 101.702 SC5 2020 740,000 5.000 1.220 110.959 SD3 2021 975,000 5.000 1.350 114.031 SE1 2022 1,065,000 5.000 1.550 116.412 SF8 2023 1,050,000 5.000 1.650 118.944 SG6 2024 1,100,000 5.000 1.800 120.847 SH4 2025 1,130,000 5.000 1.950 122.388 SJ0 2026 1,360,000 5.000 2.050 124.036 SK7 2027 2,495,000 5.000 2.150 125.431 SL5 2028 1,245,000 4.000 2.350 114.577* SM3 2029 1,300,000 4.000 2.440 113.720* SN1 2030 1,895,000 4.000 2.500 113.153* SP6 2031 1,565,000 4.000 2.570 112.496* SQ4 2032 2,300,000 4.000 2.640 111.843* SR2 2033 1,025,000 3.000 3.000 100.000 SS0 2034 895,000 3.000 3.080 98.948 ST8 2035 2,105,000 3.000 3.130 98.223 SU5 2036 1,360,000 3.000 3.180 97.450 SV3 2037 2,305,000 3.125 3.230 98.463 SW1 2038 360,000 3.125 3.250 98.109 SX9 2039 385,000 3.125 3.270 97.739 SY7 2040 390,000 3.125 3.280 97.512 SZ4 2041 230,000 3.125 3.300 97.116 TA8 2042 230,000 3.250 3.320 98.817 TB6 2043 245,000 3.250 3.340 98.444 TC4 2044 515,000 3.250 3.360 98.058 TD2
∗ Priced to November 1, 2017 call date. ∗∗ See the paragraph titled "Use of CUSIP Numbers in this Official Statement" in Section One - Summary of the 2017C Bonds and the Virginia Pooled Financing Program, regarding the use of CUSIP numbers in this Official Statement.

(iii)
Redemption Provisions
Optional Redemption of 2017C Bonds. The 2017C Bonds maturing on or after November 1, 2028, may be redeemed prior to their respective maturities, at the option of VRA, from any moneys that may be made available for such purpose, either in whole or in part (in $5,000 increments), on any date and in such order as VRA may determine on and after November 1, 2027, at a redemption price equal to 100% of the principal amount of such 2017C Bonds to be redeemed together with the unpaid interest accrued thereon to the date fixed for redemption.
Mandatory Sinking Fund Redemption for the 2017C Infrastructure Revenue Bonds. The 2017C Infrastructure Revenue Bonds maturing on November 1, 2044, are subject to mandatory sinking fund redemption in part, on November 1 in the years and in the amounts set forth below, at a redemption price equal to 100% of the principal amount of such 2017C Infrastructure Revenue Bonds to be redeemed plus the unpaid interest accrued thereon to the date fixed for redemption, all in the manner provided in the Indenture:
Year Amount 2038 $860,000 2039 890,000 2040 935,000 2041 545,000 2042 575,000 2043 590,000 2044 (final maturity) 615,000
The 2017C Bonds are being issued under exemptions from any registration requirements under
the Securities Act of 1933, as amended, and any registration requirements under the securities laws of the Commonwealth.
No dealer, broker, salesman or other person has been authorized by VRA to give any information
or to make any representations other than those contained in this Official Statement, and, if given or made, such other information or representations must not be relied upon as having been authorized by VRA. This Official Statement does not constitute an offer to sell or the solicitation of an offer to buy, nor shall there be any sale of the 2017C Bonds by any person in any jurisdiction in which it is unlawful for such person to make an offer, solicitation or sale. This Official Statement is not to be construed as a contract or agreement between VRA and the purchasers or owners of any of the 2017C Bonds. The information and expressions of opinion herein are subject to change without notice, and neither the delivery of this Official Statement nor any sale made hereunder shall under any circumstances create any implication that there has been no change in affairs of VRA or in any other matters described herein since the date hereof or, as in the case of certain information incorporated herein to certain publicly available documents, since the date of such documents.
The information set forth herein has been obtained from VRA and other sources which are
believed to be reliable, but such information is not guaranteed as to accuracy or completeness and is not to be construed as a representation by any of such sources as to information provided by any other source. All quotations from, and summaries and explanations of, provisions of law and documents herein do not purport to be complete and reference is made to such laws and documents for full and complete statements of their provisions. Any statements made in this Official Statement involving estimates or matters of opinion, whether or not expressly so stated, are intended merely as estimates or opinions and not as representations of fact.
This Official Statement contains statements which, to the extent they are not recitations of
historical fact, constitute "forward-looking statements." In this respect, the words, "estimate," "project,"

(iv)
"anticipate," "expect," "intend," "believe," and similar expressions identify forward-looking statements. A number of factors affecting VRA and its financial results could cause actual results to differ materially from those stated in the forward-looking statements.
The Underwriters, as hereinafter defined in the subsection "UNDERWRITING OF CERTAIN
2017C BONDS" in Section Four, and the Winning Bidder as hereinafter defined in the subsection "SALE OF 2017C MORAL OBLIGATION BONDS BY COMPETITIVE BIDDING" in Section Four, may engage in transactions that stabilize, maintain or otherwise affect the price of the 2017C Bonds, including transactions to (i) over allot in arranging the sales of the 2017C Bonds and (ii) make purchases in sales of 2017C Bonds, for long or short accounts, on a when-issued basis or otherwise, at such prices, in such amounts and in such manner as the Underwriters or the Winning Bidder may determine. Such stabilization, if commenced, may be discontinued at any time.
The Underwriters have provided the following sentence for inclusion in the Official Statement.
The Underwriters have reviewed the information in this Official Statement in accordance with, and as part of, their responsibility to investors under federal securities laws as applied to the facts and circumstances of this transaction, but the Underwriters do not guarantee the accuracy or completeness of such information.
References to web site addresses presented herein are for informational purposes only and may be
in the form of a hyperlink solely for the reader's convenience. Unless specified otherwise, such web sites and the information or links contained therein are not incorporated into, and are not part of, this Official Statement for purposes of, and which has the same meaning as "final official statement" in SEC rule 15c2-12.

(v)
TABLE OF CONTENTS Page
SECTION ONE: INTRODUCTION .......................................................................................................... 1
General ............................................................................................................................................ 1 Summary of the 2017C Bonds and the Virginia Pooled Financing Program ................................. 2
SECTION TWO: THE 2017C BONDS ...................................................................................................... 6
AUTHORITY FOR ISSUANCE OF THE 2017C BONDS ........................................................... 6 PLAN OF FINANCE AND REFUNDING .................................................................................... 6 DESCRIPTION OF THE 2017C BONDS...................................................................................... 7
General ............................................................................................................................... 7 Redemption ........................................................................................................................ 8
SOURCES AND USES OF FUNDS .............................................................................................. 9 SECURITY AND SOURCES OF PAYMENT FOR THE 2017C BONDS .................................. 9
Limited Obligations ........................................................................................................... 9 Infrastructure Revenue Bonds.......................................................................................... 10 Moral Obligation Bonds .................................................................................................. 10 Debt Service Requirements for Bonds ............................................................................. 12 Parity Status ..................................................................................................................... 13 Flow of Funds .................................................................................................................. 13
ADDITIONAL INDEBTEDNESS ............................................................................................... 15 PRIOR SERIES OF BONDS ........................................................................................................ 17 SECURITY FOR THE LOCAL OBLIGATIONS ....................................................................... 18
General ............................................................................................................................. 18 Local Bonds ..................................................................................................................... 19 Financing Leases .............................................................................................................. 21 Commonwealth Aid Intercept Provision ......................................................................... 22
VRA LICENSE ............................................................................................................................. 24 PROJECTED CASH FLOWS ...................................................................................................... 24 INVESTMENT CONSIDERATIONS ......................................................................................... 26
Limited Obligations of VRA ........................................................................................... 26 Contractual Remedies of VRA Upon Default of Local Bonds ........................................ 26 Credit Concerns Regarding Particular Local Governments ............................................. 26 Local Support Agreements and Special Fund Local Bonds ............................................ 28 Events of Non-Appropriation and Defaults Under Financing Leases ............................. 29 Investment of Certain Funds ............................................................................................ 29 No Acceleration Upon Default of Bonds ......................................................................... 30 Additional Risks of Moral Obligation Bonds .................................................................. 30 Capital Reserve Fund Replenishment .............................................................................. 30 Unknown Future Participants and Credit Standard Changes ........................................... 31 No Requirement to Maintain Historical Debt Service Coverage Percentages ................. 31 Closing of Sale of 2017C Bonds Dependent on a Successful Closing of the
Bonds Sold By Negotiated Sale and Competitive Bid .............................................. 31
SECTION THREE: PROGRAM PARTICIPANTS ................................................................................. 31
VIRGINIA RESOURCES AUTHORITY .................................................................................... 31

(vi)
Members of the Board ..................................................................................................... 32 VRA Staff ........................................................................................................................ 33
THE VIRGINIA POOLED FINANCING PROGRAM ............................................................... 33
Background ...................................................................................................................... 33 Structure ........................................................................................................................... 35
SELECTED INFORMATION ON VIRGINIA LOCAL GOVERNMENTS .............................. 35
Powers .............................................................................................................................. 35 Sources of Revenue ......................................................................................................... 35 Incurrence of Debt ........................................................................................................... 36 Leasing Powers ................................................................................................................ 37 Certain Economic Information ........................................................................................ 37
THE 2017C LOCAL GOVERNMENTS AND THE OTHER PARTICIPATING LOCAL GOVERNMENTS .................................................................................................................. 38
SECTION FOUR: MISCELLANEOUS ................................................................................................... 44
LITIGATION ................................................................................................................................ 44 LEGAL MATTERS ...................................................................................................................... 44 TAX MATTERS ........................................................................................................................... 45
Federal Income Tax Status of Interest on the 2017C Bonds ............................................ 45 Reliance and Assumptions; Effect of Certain Changes ................................................... 45 Certain Collateral Federal Tax Consequences ................................................................. 46 Original Issue Discount ................................................................................................... 46 Bond Premium ................................................................................................................. 47 Effects of Future Enforcement, Regulatory and Legislative Actions .............................. 47 State Tax Treatment of the 2017C Bonds ........................................................................ 48
RELATIONSHIP OF PARTIES ................................................................................................... 48 LEGALITY FOR INVESTMENT ............................................................................................... 49 UNDERWRITING OF THE 2017C INFRASTRUCTURE REVENUE BONDS ....................... 49 SALE OF 2017C MORAL OBLIGATION BONDS BY COMPETITIVE BIDDING ............... 50 CERTIFICATE CONCERNING OFFICIAL STATEMENT FOR WINNING BIDDER ........... 50 VERIFICATION OF MATHEMATICAL COMPUTATIONS ................................................... 51 RATINGS ..................................................................................................................................... 51 FINANCIAL ADVISOR .............................................................................................................. 51 CONTINUING DISCLOSURE UNDER RULE 15c2-12 ............................................................ 52 APPROVAL OF OFFICIAL STATEMENT ................................................................................ 53
(vii)
APPENDICES: A – DEFINITIONS AND SUMMARY OF CERTAIN PROVISIONS OF THE INDENTURE B – COMMONWEALTH OF VIRGINIA FINANCIAL AND OTHER INFORMATION C – COMMONWEALTH OF VIRGINIA DEMOGRAPHIC AND ECONOMIC INFORMATION D – COMMONWEALTH OF VIRGINIA AUDITED FINANCIAL STATEMENTS FOR THE
YEAR ENDED JUNE 30, 2016 E – BOOK-ENTRY ONLY SYSTEM F – PROPOSED FORM OF BOND COUNSEL OPINION LETTER G – FORM OF CONTINUING DISCLOSURE AGREEMENT OF THE COMMONWEALTH OF
VIRGINIA H – SUMMARY OF CONTINUING DISCLOSURE UNDERTAKINGS BY VIRGINIA
RESOURCES AUTHORITY I – SUMMARY OF CONTINUING DISCLOSURE UNDERTAKINGS BY LOCAL
GOVERNMENTS J – REFUNDED BONDS

OFFICIAL STATEMENT of the
VIRGINIA RESOURCES AUTHORITY
$56,630,000 Infrastructure Revenue Bonds
(Virginia Pooled Financing Program), Series 2017C
$30,315,000 State Moral Obligation Revenue Bonds (Virginia Pooled Financing Program),
Series 2017C
SECTION ONE: INTRODUCTION
The following introductory information is furnished solely to provide limited introductory information regarding the 2017C Bonds and the Virginia Pooled Financing Program and does not purport to be comprehensive. All such information is qualified in its entirety by reference to the more detailed descriptions appearing in this Official Statement, including the appendices hereto. All capitalized terms not otherwise defined shall have the meanings assigned to them as set forth in Appendix A.
General
This Official Statement (including the cover page, the inside cover page and the appendices hereto) is furnished to provide information concerning the above-referenced bonds (respectively, the "2017C Infrastructure Revenue Bonds") and the "2017C Moral Obligation Bonds" and, together with the 2017C Infrastructure Revenue Bonds, the "2017C Bonds"). The above-referenced tax-exempt bonds will be referred to collectively as the "2017C Bonds." The Virginia Resources Authority ("VRA") is issuing the 2017C Bonds to provide funding in connection with VRA's Virginia Pooled Financing Program. VRA has approved and authorized the use of this Official Statement in connection with the sale of the 2017C Bonds. The information speaks as of its date and is not intended to indicate future or continuing trends in the financial position of VRA, the Commonwealth of Virginia (the "Commonwealth") or any of the Local Governments, as hereinafter defined.
VRA's Board of Directors authorized the issuance of the 2017C Bonds pursuant to resolutions adopted on June 13, 2017 (collectively, the "2017C Resolution"). The 2017C Bonds are being issued pursuant to the Virginia Resources Authority Act (the "Act"), Chapter 21, Title 62.1 of the Code of Virginia of 1950, as amended (the "Virginia Code"), and a Master Indenture of Trust dated as of December 1, 2003, as previously supplemented and amended (the "Master Indenture"), between VRA and U.S. Bank National Association, as successor trustee (the "Trustee"), and as further supplemented by a Fortieth Supplemental Series Indenture of Trust dated as of November 1, 2017 (the "Fortieth Supplemental Series Indenture"), between VRA and the Trustee. The Master Indenture and the Fortieth Supplemental Series Indenture are sometimes referred to collectively herein as the "Indenture."
"Moral Obligation," as used in the preceding paragraphs and throughout this Official Statement, refers to the non-legally-binding "moral" obligation of the Commonwealth to maintain the required balance in the Capital Reserve Fund securing the 2017C Moral Obligation Bonds and all other Moral

-2-
Obligation Bonds issued under the Indenture as described under the heading "Capital Reserve Fund" in the subsection "SECURITY AND SOURCES OF PAYMENT FOR THE 2017C BONDS – Moral Obligation Bonds" in Section Two.
Summary of the 2017C Bonds and the Virginia Pooled Financing Program
The Issuer VRA, which was created by the Act and is organized and exists as a public body corporate and a political subdivision of the Commonwealth.
Principal Payments November 1, as set forth on the inside cover pages.
Interest Payments May 1 and November 1, commencing May 1, 2018.
Interest Calculation 360-day year comprised of 12 months of 30 days each.
Regular Record Date The 15th day of the month preceding each payment date.
Authorized Denominations $5,000 and integral multiples thereof.
Registration Book-entry only through the facilities of The Depository Trust Company, New York, New York ("DTC").
Settlement Same-day funds through DTC.
Closing/Delivery Date On or about November 15, 2017.
Ratings 2017C Infrastructure Revenue Bonds:
Aaa (Moody's), AAA (S&P)
2017C Moral Obligation Bonds:
Aa2 (Moody's), AA (S&P)
A more complete description of the ratings is provided in the subsection "RATINGS" in Section Four.
Optional Redemption The 2017C Bonds maturing on or after November 1, 2028, are subject to optional redemption on and after November 1, 2027, at a redemption price equal to 100% of the principal amount of such 2017C Bonds to be redeemed together with the unpaid interest accrued thereon to the date fixed for redemption.
See the heading "Redemption" in the subsection "DESCRIPTION OF THE 2017C BONDS" in Section Two.
Mandatory Sinking Fund Redemption
See the inside cover pages of this Official Statement and under the heading "Redemption" in the subsection "DESCRIPTION OF THE 2017C BONDS" in Section Two for a description of the mandatory sinking fund redemption provisions applicable to the 2017C Bonds.
Use of Proceeds VRA will use the net proceeds of the 2017C Bonds (a) to purchase or acquire local bonds and financing leases (collectively, the "2017C Local Obligations") issued or entered into by certain Local Governments, as hereinafter defined (collectively, the "2017C Local Governments"), to finance or refinance Qualified Projects (as hereinafter defined), (b) to

-3-
provide for a deposit to the Capital Reserve Fund, as hereinafter defined, and (c) to pay costs of issuance related to the 2017C Bonds. Certain proceeds will also be applied to refund bonds VRA previously issued to finance deposits to the Capital Reserve Fund. See the subsection "PLAN OF FINANCE AND REFUNDING" in Section Two.
Virginia Pooled Financing Program
The Virginia Pooled Financing Program enables Virginia counties, cities, towns and other local authorities (as more particularly defined in Appendix A, each a "Local Government"), to finance or refinance infrastructure and other projects specified under the Act (as more particularly defined in the subsection "VIRGINIA POOLED FINANCING PROGRAM" in Section Three, each a "Qualified Project"). See the subsection "VIRGINIA POOLED FINANCING PROGRAM" in Section Three.
Categories of Virginia Pooled Financing Program Bonds
VRA issues two categories of Virginia Pooled Financing Program Bonds under the Master Indenture: Infrastructure Revenue Bonds (the "Infrastructure Revenue Bonds") and State Moral Obligation Revenue Bonds (the "Moral Obligation Bonds"). Infrastructure Revenue Bonds and Moral Obligation Bonds are referred to collectively as the "Bonds."
Payment of the Bonds The primary source of payment on the 2017C Bonds is the payments that VRA receives on Local Obligations.
VRA expects to structure the specific amounts payable under the Local Obligations to be sufficient in timing and amount, when combined with the investment earnings and balances expected to be transferred from the Capital Reserve Fund and certain other funds and accounts described herein, to provide for the full and timely payment of the debt service on the Bonds and VRA's annual administrative fees and charges when due (the "Administrative Charges"). See the subsection "VIRGINIA POOLED FINANCING PROGRAM" in Section Three.
Infrastructure Revenue Bond Security
The 2017C Infrastructure Revenue Bonds and all other Infrastructure Revenue Bonds are limited obligations of VRA secured by a senior lien on all Local Obligation payments. Infrastructure Revenue Bonds are also secured by an Operating Reserve Fund, which was valued at approximately $7,760,000 as of September 30, 2017. See the subsection "SECURITY AND SOURCES OF PAYMENT FOR THE 2017C BONDS" in Section Two.
Operating Reserve Fund The Operating Reserve Fund is available to the Trustee in the event that there are insufficient funds available to pay debt service on the Infrastructure Revenue Bonds. See the subsection "SECURITY AND SOURCES OF PAYMENT FOR THE 2017C BONDS" in Section Two.
Moral Obligation Bond Security
The 2017C Moral Obligation Bonds and all other Moral Obligation Bonds are limited obligations of VRA secured by a junior lien on all Local Obligation payments. Moral Obligation Bonds are also secured by the Capital Reserve Fund. See the subsection "SECURITY AND SOURCES OF PAYMENT FOR THE 2017C BONDS" in Section Two.
Capital Reserve Fund The Capital Reserve Fund is funded in an amount at least equal to the maximum annual debt service on the Moral Obligation Bonds and is available to the Trustee in the event that there are insufficient funds
-4-
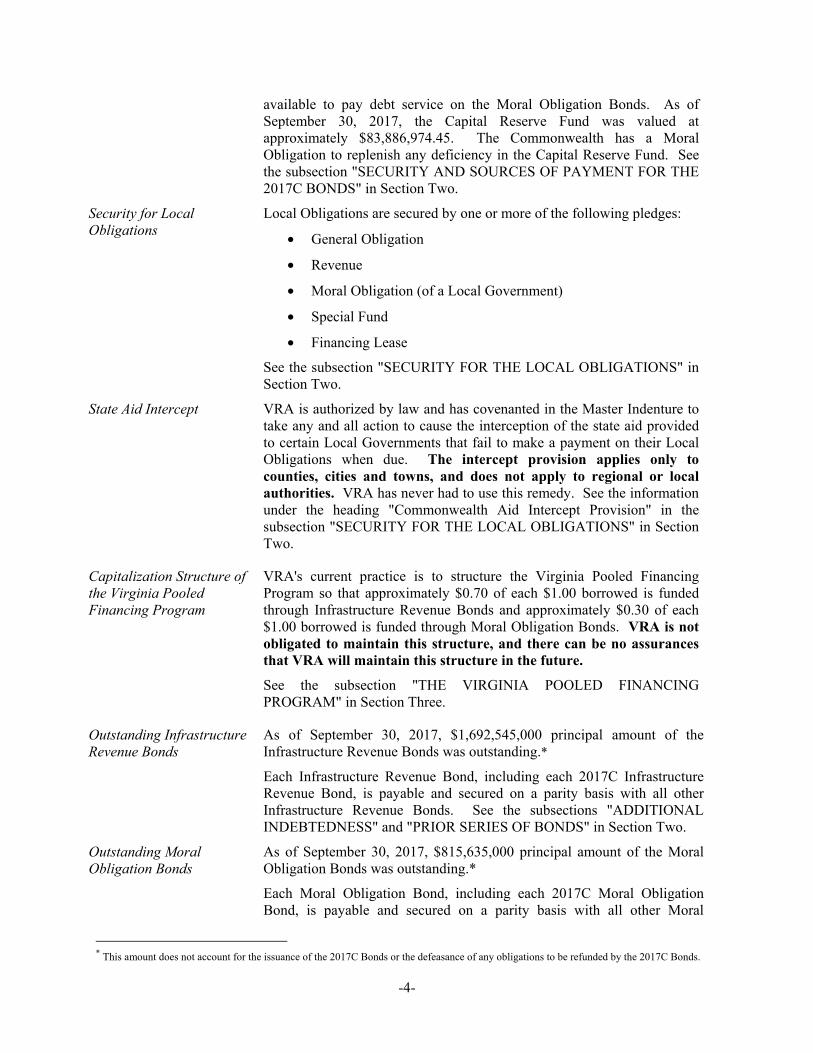
available to pay debt service on the Moral Obligation Bonds. As of September 30, 2017, the Capital Reserve Fund was valued at approximately $83,886,974.45. The Commonwealth has a Moral Obligation to replenish any deficiency in the Capital Reserve Fund. See the subsection "SECURITY AND SOURCES OF PAYMENT FOR THE 2017C BONDS" in Section Two.
Security for Local Obligations
Local Obligations are secured by one or more of the following pledges:
• General Obligation
• Revenue
• Moral Obligation (of a Local Government)
• Special Fund
• Financing Lease
See the subsection "SECURITY FOR THE LOCAL OBLIGATIONS" in Section Two.
State Aid Intercept VRA is authorized by law and has covenanted in the Master Indenture to take any and all action to cause the interception of the state aid provided to certain Local Governments that fail to make a payment on their Local Obligations when due. The intercept provision applies only to counties, cities and towns, and does not apply to regional or local authorities. VRA has never had to use this remedy. See the information under the heading "Commonwealth Aid Intercept Provision" in the subsection "SECURITY FOR THE LOCAL OBLIGATIONS" in Section Two.
Capitalization Structure of the Virginia Pooled Financing Program
VRA's current practice is to structure the Virginia Pooled Financing Program so that approximately $0.70 of each $1.00 borrowed is funded through Infrastructure Revenue Bonds and approximately $0.30 of each $1.00 borrowed is funded through Moral Obligation Bonds. VRA is not obligated to maintain this structure, and there can be no assurances that VRA will maintain this structure in the future. See the subsection "THE VIRGINIA POOLED FINANCING PROGRAM" in Section Three.
Outstanding Infrastructure Revenue Bonds
As of September 30, 2017, $1,692,545,000 principal amount of the Infrastructure Revenue Bonds was outstanding.*
Each Infrastructure Revenue Bond, including each 2017C Infrastructure Revenue Bond, is payable and secured on a parity basis with all other Infrastructure Revenue Bonds. See the subsections "ADDITIONAL INDEBTEDNESS" and "PRIOR SERIES OF BONDS" in Section Two.
Outstanding Moral Obligation Bonds
As of September 30, 2017, $815,635,000 principal amount of the Moral Obligation Bonds was outstanding.*
Each Moral Obligation Bond, including each 2017C Moral Obligation Bond, is payable and secured on a parity basis with all other Moral
* This amount does not account for the issuance of the 2017C Bonds or the defeasance of any obligations to be refunded by the 2017C Bonds.

-5-
Obligation Bonds. See the subsections "ADDITIONAL INDEBTEDNESS" and "PRIOR SERIES OF BONDS" in Section Two.
Investment Considerations Prospective purchasers of the 2017C Bonds should be aware that investment in the 2017C Bonds entails some degree of risk and uncertainty, and all of the information presented in this Official Statement should be considered carefully before making a decision to invest in the 2017C Bonds. See the subsection "INVESTMENT CONSIDERATIONS" in Section Two.
Continuing Disclosure Each of (a) VRA, (b) the Commonwealth and (c) any Local Government that becomes a "Material Local Government" will undertake to provide certain limited information at specified times under certain conditions to assist the Underwriters and the Winning Bidder in complying with the provisions of Rule 15c2-12. As of the date hereof, no Local Government qualifies as a Material Local Government, and no Local Government has qualified as a Material Local Government within the past five years. Within the past five years, neither VRA nor the Commonwealth has complied in all respects with its respective prior continuing disclosure undertakings. See the subsection "CONTINUING DISCLOSURE UNDER RULE 15c2-12" in Section Four.
Additional Information Any question concerning the content of this Official Statement should be directed to Jean Bass, Acting Executive Director, Virginia Resources Authority, 1111 East Main Street, Suite 1920, Richmond, Virginia 23219 (804-644-3100) or Ty Wellford, Davenport & Company LLC, 901 East Cary Street, 14th Floor, Richmond, Virginia 23219 (804-697-2915).
Use of CUSIP Numbers in this Official Statement
The CUSIP (Committee on Uniform Securities Identification Procedures) numbers shown in this Official Statement are assigned by an organization not affiliated with VRA, and VRA is not responsible for the selection or use of the CUSIP numbers. The CUSIP numbers are included solely as a convenience to bondholders, and VRA makes no representation as to the correctness of such CUSIP numbers. CUSIP numbers assigned to securities may be changed at any time based on a number of factors. VRA has not agreed to, and there is no duty or obligation to, update this Official Statement to reflect any change or correction in the CUSIP numbers shown herein.
[REMAINDER OF PAGE INTENTIONALLY LEFT BLANK]
-6-
SECTION TWO: THE 2017C BONDS
AUTHORITY FOR ISSUANCE OF THE 2017C BONDS
The 2017C Bonds were authorized by the 2017C Resolution and are being issued pursuant to the Act and the Indenture. See Appendix A for a summary of certain provisions of the Indenture.
PLAN OF FINANCE AND REFUNDING
VRA will apply the proceeds of the 2017C Bonds, along with other available funds, to (a) purchase or acquire the 2017C Local Obligations issued or entered into by the 2017C Local Governments to finance or refinance Qualified Projects, (b) provide for a deposit to the Capital Reserve Fund, and (c) pay costs of issuance. Certain proceeds of the 2017C Bonds will also be applied to refund bonds VRA previously issued to finance deposits to the Capital Reserve Fund. The 2017C Local Obligations will be structured to provide for payments of debt service or rentals at levels that, when combined with the investment earnings and balances expected to be transferred from the Capital Reserve Fund and certain other funds and accounts described below, are sufficient in the aggregate to provide for the payment of the 2017C Bonds and VRA's Administrative Charges.
VRA and certain 2017C Local Governments will effect the refinancing of Qualified Projects by refunding and defeasing publicly-sold bonds of VRA or bonds and other obligations of the 2017C Local Governments (collectively, the "Refunded Bonds"). The 2017C Local Governments referred to above in this paragraph will be referred to collectively below as the "Refunding 2017C Local Governments."
The Refunded Bonds include all or a portion of the outstanding principal amount of certain maturities of the bond issues listed in Appendix J.
VRA and the Refunding 2017C Local Governments will cause a portion of the proceeds of the 2017C Bonds, along with other available funds, if any, to be deposited under Escrow Agreements dated as of the date of delivery of the 2017C Bonds (the "Escrow Agreements"), with U.S. Bank National Association as escrow agent (the "Escrow Agent"). The Escrow Agreements will provide for the establishment of initial cash balances and the investment of the remaining deposits in direct, non-callable obligations of or guaranteed by the United States Department of the Treasury (the "Escrowed Securities"). Based on the report of Bingham Arbitrage Rebate Services, Inc., Richmond, Virginia (the "Verification Agent"), the initial cash balances and the maturing principal of and interest on the Escrowed Securities will be sufficient without reinvestment to pay the principal of and premium, if any, and interest on the Refunded Bonds through the earlier of their respective maturity or redemption dates, except in the case of the Refunded Bonds of Isle of Wight County, Virginia ("IOW"), which is one of the Refunding 2017C Local Governments. See the subsection "VERIFICATION OF MATHEMATICAL COMPUTATIONS" in Section Four.
The structure for refunding IOW's Refunded Bonds is commonly referred to as a "crossover" refunding. The Escrow Agreement will provide for a separate escrow fund (the "IOW Escrow Fund") into which a portion of the 2017C Bonds will be deposited and invested. The IOW Escrow Fund will provide for the payment of the interest accruing on the 2017C Bonds allocable to IOW from the delivery date through March 1, 2020, which is the redemption date of the IOW Refunded Bonds. On the redemption date the Escrow Agent will apply the balance in the IOW Escrow Fund to redeem the IOW Refunded Bonds. IOW will continue to pay the interest on the IOW Refunded Bonds from the delivery date of the 2017C Bonds until the redemption date of the IOW Refunded Bonds, on which date IOW's 2017C Local Obligation will "cross over" and thereafter provide for the payment of the principal of and interest on the allocable 2017C Bonds. For a description of the treatment of the transfers from the IOW

-7-
Escrow Fund to pay the interest on the 2017C Bonds allocable to IOW, see the subsection "ADDITIONAL INDEBTEDNESS" in this Section Two.
DESCRIPTION OF THE 2017C BONDS
General
The 2017C Bonds will be dated and will bear interest from their date of delivery, payable on May 1 and November 1 of each year, commencing May 1, 2018, and will mature on November 1 in the years and in the principal amounts set forth on the inside cover pages hereof. The principal of and premium, if any, and interest on the 2017C Bonds will be payable at the corporate trust office of the Trustee in Richmond, Virginia, or at the office designated for such payment by the Trustee or any successor Trustee. Interest on the 2017C Bonds will be payable to the person appearing in the registration books of the Trustee as the registered owner thereof on the Record Date (as hereinafter defined) by check or draft mailed on the interest payment date to the registered owner or, following appropriate notice to the Trustee, by wire transfer on the interest payment date to any owner of at least $1,000,000 in aggregate principal amount of the 2017C Bonds. For so long as the 2017C Bonds are registered in book-entry-only form, principal and interest will be payable solely to Cede & Co., the nominee for DTC, as the sole registered owner of the 2017C Bonds, or any qualified securities depository selected by VRA to succeed DTC.
The term "qualified securities depository" means an entity that is registered as a clearing agency under Section 17A of the Securities Exchange Act of 1934 or whose business is confined to the performance of the functions of a clearing agency with respect to exempted securities, as defined in Section 3(a)(12) of such Act for the purposes of Section 17C thereof.
The Fortieth Supplemental Series Indenture establishes the 15th day of the month preceding each interest payment date as the record date (the "Record Date") for the 2017C Bonds and establishes that interest on the 2017C Bonds shall be computed on the basis of a year of 360 days and twelve 30-day months.
The 2017C Bonds are issuable as fully registered Bonds in denominations of $5,000 and integral multiples of $5,000 not exceeding the aggregate principal amount of the 2017C Bonds. The 2017C Bonds may be transferred or exchanged, upon presentation or surrender, as the case may be, at the corporate trust office of the Trustee in Richmond, Virginia, as provided in the Master Indenture, or at such other office designated for such payment by the Trustee or any successor Trustee. Any 2017C Bonds, upon surrender thereof at said corporate trust office of the Trustee, with a written instrument of transfer satisfactory to the Trustee, duly executed in writing, may, at the option of the registered owner thereof, be exchanged for an equal aggregate principal amount of 2017C Bonds of the same Series, maturity and interest rate of any other authorized denominations. For every exchange or transfer of 2017C Bonds, VRA or the Trustee may make a charge sufficient to reimburse it for any tax, fee or other government charge required to be paid with respect to such exchange or transfer.
One fully registered 2017C Bond encompassing all of the maturities of each Series, in the applicable aggregate principal amount of such Series, will be registered in the name of Cede & Co. and deposited through the facilities of DTC, in accordance with the Fortieth Supplemental Series Indenture. So long as 2017C Bonds are required to be registered in the name of Cede & Co., as nominee for DTC, or a successor qualified securities depository or a nominee therefor, transfers of ownership interests in the 2017C Bonds will be settled through the book-entry-only system of DTC or such successor qualified securities depository, if any. For a description of DTC and its book-entry-only system, see Appendix E.

-8-
Redemption
Optional Redemption of 2017C Bonds. The 2017C Bonds maturing on or after November 1, 2028, may be redeemed prior to their respective maturities, at the option of VRA, from any moneys that may be made available for such purpose, either in whole or in part (in $5,000 increments), on any date and in such order as VRA may determine on and after November 1, 2027, at a redemption price equal to 100% of the principal amount of such 2017C Bonds to be redeemed together with the unpaid interest accrued thereon to the date fixed for redemption.
Mandatory Sinking Fund Redemption for the 2017C Infrastructure Revenue Bonds. The 2017C Infrastructure Revenue Bonds maturing on November 1, 2044, are subject to mandatory sinking fund redemption in part, on November 1 in the years and in the amounts set forth below, at a redemption price equal to 100% of the principal amount of such 2017C Infrastructure Revenue Bonds to be redeemed plus the unpaid interest accrued thereon to the date fixed for redemption, all in the manner provided in the Indenture:
Year Amount 2038 $860,000 2039 890,000 2040 935,000 2041 545,000 2042 575,000 2043 590,000 2044 (final maturity) 615,000
Manner and Notice of Redemption. The maturities of the 2017C Bonds to be redeemed by
optional redemption will be selected by VRA in its discretion. If less than all of the 2017C Bonds of a particular maturity are redeemed, the 2017C Bonds of such maturity to be redeemed will be selected by DTC in accordance with its procedures or if the book entry system has been discontinued, by the Trustee (in its capacity as paying agent) by lot in such manner as the Trustee shall determine.
Each increment of $5,000 of principal amount will be counted as one 2017C Bond for purposes of selecting 2017C Bonds for partial redemption. If a 2017C Bond is called for partial redemption, a new 2017C Bond representing any unredeemed balance will be issued to the holder.
Notice of redemption of the 2017C Bonds will be mailed by registered or certified mail, postage prepaid, not less than 30 nor more than 60 days prior to the date fixed for redemption, to the registered owners of the 2017C Bonds, or portions thereof, so called, but the failure to so mail such notice with respect to any particular 2017C Bonds will not affect the validity of such call for redemption of any 2017C Bonds with respect to which no such failure has occurred. Such notice may state that the redemption of the 2017C Bonds to be redeemed is conditioned upon the occurrence of certain future events, including, without limitation, the deposit of moneys, in an amount sufficient to effect the redemption, with the Trustee on or before the date fixed for redemption. All 2017C Bonds called for redemption will cease to bear interest on the specified redemption date, provided funds sufficient for the redemption of such 2017C Bonds in accordance with the Master Indenture are on deposit with the Trustee. If such moneys are not available on the redemption date, such 2017C Bonds or portions thereof will continue to bear interest until paid at the same rate they would have borne had they not been called for redemption. On presentation and surrender of the 2017C Bonds called for redemption at the place or places of payment, such 2017C Bonds will be paid and redeemed provided sufficient funds are on deposit with the Trustee.
-9-
So long as DTC or its nominee, Cede & Co., is the registered owner of the 2017C Bonds, any such notices of redemption will be mailed solely to DTC and distribution of such notices to Direct Participants and Indirect Participants (each as defined in Appendix E) will be the sole responsibility of DTC, and distribution of such notices to Beneficial Owners (as defined in Appendix E) will be the sole responsibility of the Direct Participants and Indirect Participants.
SOURCES AND USES OF FUNDS
The proceeds of the 2017C Bonds and other available funds will be used as follows:
Par Amount of the 2017C Bonds $86,945,000.00 Net Original Issue Premium 11,311,617.65 Total Sources of Funds $98,256,617.65 Project Fund Deposits $54,318,443.48 Deposit to Refunding Escrows 40,594,977.49 Deposit to Capital Reserve Fund 1 1,931,584.35 VRA Cost of Issuance 473,302.00 Local Cost of Issuance 427,500.00 Underwriters' Discount 2 471,163.29 Additional Proceeds 39,647.04 Total Uses of Funds $98,256,617.65
______________________ 1 Amounts deposited in the Capital Reserve Fund secure the Moral Obligation Bonds; they do not secure the Infrastructure
Revenue Bonds. 2 Provided to the Underwriters and the Winning Bidder, as applicable. See the subsections "UNDERWRITING OF THE 2017C
INFRASTRUCTURE REVENUE BONDS" and "SALE OF 2017C MORAL OBLIGATION BONDS BY COMPETITIVE BIDDING" each in Section Four.
SECURITY AND SOURCES OF PAYMENT FOR THE 2017C BONDS
Limited Obligations
The 2017C Bonds are limited obligations of VRA. The principal of, premium, if any, and interest on the 2017C Bonds do not constitute a debt of the Commonwealth or any of its political subdivisions other than VRA. Neither the Commonwealth nor any political subdivision thereof, including VRA, will be obligated to pay the principal of, premium, if any, or interest on the 2017C Bonds or other costs incident thereto except from the revenues, money or property of VRA pledged for such purposes. Neither the faith and credit nor the taxing power of the Commonwealth or any political subdivision thereof is pledged to the payment of the principal of or premium, if any, or interest on the 2017C Bonds. VRA has no taxing power.

-10-
Infrastructure Revenue Bonds
Sources of Payment. The 2017C Infrastructure Revenue Bonds and the other Infrastructure Revenue Bonds are payable solely from (a) the debt service and rental payments on the Local Obligations, (b) amounts on deposit in certain funds and accounts created under the Indenture, including the Infrastructure Revenue Debt Service Fund and the Operating Reserve Fund, and (c) the earnings, if any, derived from the investment of such funds and accounts. VRA has pledged such amounts for such purpose. See information under the headings "Establishment of Trusts" and "Establishment of Funds and Accounts" in Appendix A.
Operating Reserve Fund. The Indenture establishes an Operating Reserve Fund as security for the Infrastructure Revenue Bonds. As of September 30, 2017, the Operating Reserve Fund was valued at approximately $7,760,000. No additional amounts are expected to be deposited in the Operating Reserve Fund in connection with the issuance of the 2017C Infrastructure Revenue Bonds. No Moral Obligation Bonds are, or will be, secured by the Operating Reserve Fund.
On each payment date, any amount on deposit in the Operating Reserve Fund will be transferred to the Infrastructure Revenue Debt Service Fund if and to the extent, after transfers from the Revenue Fund, amounts on deposit in the Infrastructure Revenue Debt Service Fund are insufficient to pay the principal and interest due on the Infrastructure Revenue Bonds on such date. There is no minimum balance for the Operating Reserve Fund; amounts drawn from the Operating Reserve Fund, if any, to pay debt service on the Infrastructure Revenue Bonds will be replenished from payments made by the Local Governments on their Local Obligations or from other funds available to VRA, but only to the extent required to meet the coverage tests set forth in the following paragraph.
Any amount on deposit in the Operating Reserve Fund (including accumulated investment earnings) which is not required to produce in the then-current and all future Bond Years (a) Revenue Coverage equal to the Required Revenue Coverage, (b) Infrastructure Revenue Bond Debt Service Coverage equal to the Required Infrastructure Revenue Bond Debt Service Coverage, and (c) Infrastructure Revenue Bond Revenue Coverage equal to the Required Infrastructure Revenue Bond Revenue Coverage may be transferred to VRA upon VRA's filing with the Trustee a Projected Revenue Certificate. See the definitions of such terms in Appendix A and information included under the headings "Operation of Revenue and Pledged Funds – Operating Reserve Fund" and "Fortieth Supplemental Series Indenture – Restrictions on Withdrawal from Operating Reserve Fund" in Appendix A.
On December 6, 2016, VRA filed the Projected Revenue Certificate and took the other steps necessary for the Trustee to transfer to VRA the interest earned on the investments in the Operating Reserve Fund. VRA may use such interest for any purpose permitted under the Act.
Moral Obligation Bonds
Sources of Payment. The 2017C Moral Obligation Bonds and the other Moral Obligation Bonds are payable solely from (a) the debt service and rental payments under the Local Obligations, (b) amounts on deposit in certain funds and accounts created under the Indenture, including the Moral Obligation Debt Service Fund and the Capital Reserve Fund and (c) the earnings, if any, derived from the investment of such funds and accounts. VRA has pledged such amounts for such purpose. See information under the headings "Establishment of Trusts" and "Establishment of Funds and Accounts" in Appendix A.
The Indenture provides that the pledge of the Revenues securing the 2017C Moral Obligation Bonds and the other Moral Obligation Bonds is in all respects junior and subordinate to the pledge of

-11-
such Revenues securing the 2017C Infrastructure Revenue Bonds and the other Infrastructure Revenue Bonds.
Capital Reserve Fund. The Indenture establishes a Capital Reserve Fund as security for the Moral Obligation Bonds issued under the Indenture. The Indenture also establishes a minimum amount required to be maintained in the Capital Reserve Fund (the "CRF Reserve Requirement"). For so long as any of the 2017C Moral Obligation Bonds remains Outstanding, the CRF Reserve Requirement will be not less than an amount equal to the maximum Principal and Interest Requirements on the Moral Obligation Bonds Outstanding in the then-current or any future Bond Year. As of September 30, 2017, the Capital Reserve Fund was valued at approximately $83,886,974.45. On the date of delivery of the 2017C Bonds, the Capital Reserve Fund will contain an amount of not less than the CRF Reserve Requirement, which has been derived from deposits of certain proceeds of the 2017C Bonds and previous Series of Bonds issued by VRA under the Virginia Pooled Financing Program (the "Program"). No Infrastructure Revenue Bonds are, or will be, secured by the Capital Reserve Fund. See information included under the heading "Operation of Revenue Fund and Pledged Funds – Capital Reserve Fund" in Appendix A.
The amounts on deposit in the Capital Reserve Fund will be used solely to cure any deficiencies in the amount on deposit in the Moral Obligation Debt Service Fund to pay the principal of and interest on the Moral Obligation Bonds when due.
On the tenth day after each interest payment date and any other Reserve Determination Date, the Trustee is required to determine whether amounts on deposit in or credited to the Capital Reserve Fund are at least equal to the CRF Reserve Requirement.
The Act and the Indenture also provide that to maintain the Capital Reserve Fund at the CRF Reserve Requirement, the Chairman of VRA, on or before December 1 of each year, must deliver to the Governor of the Commonwealth (the "Governor") and the Secretary of Administration of the Commonwealth a certificate setting forth the amount, if any, required to restore the Capital Reserve Fund to the CRF Reserve Requirement. For this purpose, the Chairman will disregard any deficiency resulting solely from the valuation of investments in the Capital Reserve Fund (as opposed to a transfer therefrom to pay debt service on the Moral Obligation Bonds due to a default on a Local Obligation).
Within five days after the beginning of each session of the General Assembly, the Governor is required to submit to the presiding officer of each house of the General Assembly a budget including, as an agency request for informational purposes only, the amount required, if any, to restore the Capital Reserve Fund to the CRF Reserve Requirement. The General Assembly may, but is not legally obligated to, appropriate to VRA such amount. Any amounts so appropriated and paid shall be delivered by VRA to the Trustee for deposit in the Capital Reserve Fund. As of the date hereof, amounts on deposit in the Capital Reserve Fund have not fallen below the CRF Reserve Requirement and, therefore, the General Assembly has not heretofore been called upon to appropriate funds for replenishment of the Capital Reserve Fund. Neither this nor any other provision of the Act or the Indenture creates a debt or liability or pledges the faith and credit of the Commonwealth to make any appropriation or payments to VRA for this or any other purpose.
The General Assembly meets in each even numbered year to establish, among other things, a budget and make appropriations for the ensuing biennial period beginning on the first day of July of such year. The General Assembly also meets in each odd numbered year when amendments to the appropriations act enacted in the previous year and supplemental appropriations may be made.
-12-
Certain financial, economic and demographic information about the Commonwealth, including a discussion of certain economic outlook and revenue forecasts, has been incorporated in this Official Statement. See Appendices B, C and D.
Any interest earned from the investment of money in the Capital Reserve Fund will be transferred immediately upon receipt to the Revenue Fund or the Rebate Funds to the extent that such transfers will not cause the Capital Reserve Fund to contain less than the CRF Reserve Requirement. The Indenture provides that if the balance on deposit in the Capital Reserve Fund otherwise exceeds the CRF Reserve Requirement, the Trustee will transfer the surplus to the Revenue Fund or the Rebate Funds or otherwise as specified by VRA pursuant to the Indenture.
The Act provides that any subsequent amendment thereof shall not limit the rights vested in VRA with respect to any agreements made with, or remedies available to, the Owners until the principal of and interest on the 2017C Bonds are paid in full.
Investments in Capital Reserve Fund. The Fortieth Supplemental Series Indenture provides that, as long as any of the 2017C Moral Obligation Bonds remains Outstanding, each investment or the provider of each investment purchased with amounts in the Capital Reserve Fund must have a rating at least equal to the then-current rating assigned by each Rating Agency to the Moral Obligation Bonds Outstanding. The Capital Reserve Fund is currently invested primarily in United States Department of the Treasury (the "Treasury") obligations.
Reduction or Elimination of Moral Obligation to Fund CRF Reserve Requirement. The Indenture permits VRA, by resolution of its Board of Directors and without obtaining the consent of the Trustee or any Owners of the Bonds, to reduce or eliminate the Commonwealth's Moral Obligation Commitment to fund or replenish the Capital Reserve Fund. Such action requires VRA to satisfy the following two conditions: (a) the resolution must contain a finding by VRA's Board of Directors that such action is not reasonably expected to affect adversely VRA's ability to pay debt service on the Moral Obligation Bonds and (b) VRA must file with the Trustee written confirmation from each Rating Agency providing a rating on any Moral Obligation Bonds that such agency's then-current rating on the Moral Obligation Bonds will not be withdrawn or downgraded as a result of such action.
Debt Service Requirements for Bonds
VRA has required and will continue to require the Local Governments to establish the scheduled debt service or rental payment dates and amounts under their Local Obligations to provide for, when combined with the estimated investment earnings and the balances scheduled to be released from the Capital Reserve Fund and certain other funds and accounts described herein, the full and timely payment of the principal of, and premium, if any, and interest on the 2017C Bonds, all other Bonds, and VRA's Administrative Charges when due. See the subsection "PROJECTED CASH FLOWS" in this Section Two.

-13-
Parity Status
Each Infrastructure Revenue Bond, including each 2017C Infrastructure Revenue Bond, is payable and secured as described in this subsection on a parity basis with all other Infrastructure Revenue Bonds. Each Moral Obligation Bond, including each 2017C Moral Obligation Bond, is also payable and secured as described in this subsection on a parity basis with all other Moral Obligation Bonds. This means, for example, that a default in the payment of a Local Obligation, even if the Local Obligation is not one of the 2017C Local Obligations, may result in a shortfall of Revenues available to pay the scheduled debt service payments on the 2017C Moral Obligation Bonds, as well as all of the other Moral Obligation Bonds then Outstanding. Additionally, in the event of defaults on multiple Local Obligations, Revenues may not be sufficient to pay scheduled debt service on the 2017C Infrastructure Revenue Bonds, as well as the other Infrastructure Revenue Bonds then Outstanding. See the subsections "ADDITIONAL INDEBTEDNESS" and "PRIOR SERIES OF BONDS" in this Section Two.
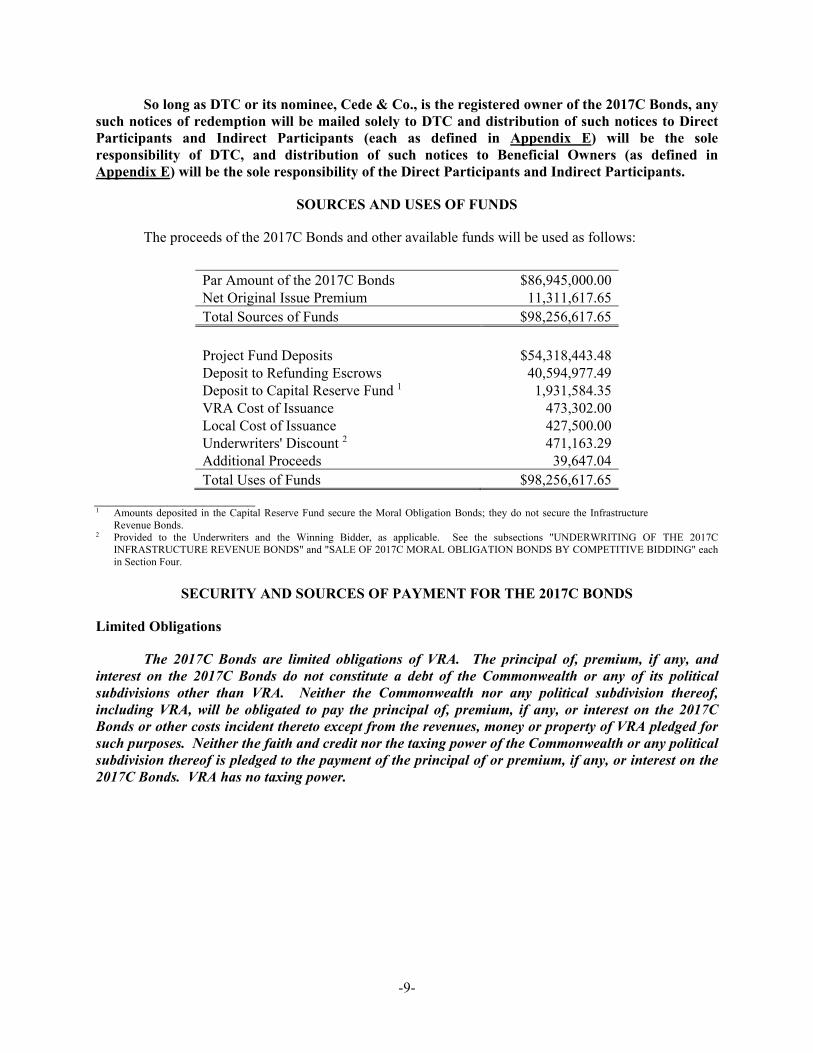
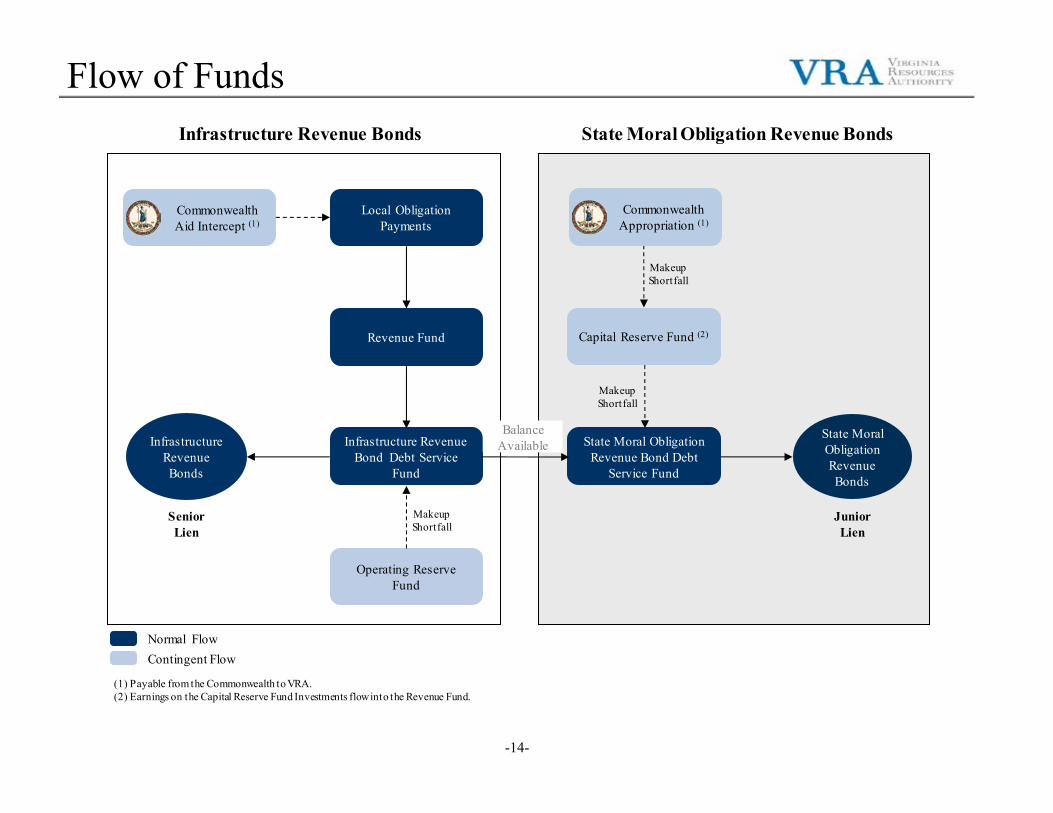
Flow of Funds
The chart on the following page presents the flow of funds through the funds and accounts established under the Indenture.
[REMAINDER OF PAGE INTENTIONALLY LEFT BLANK]
Flow of Funds
-14-
Infrastructure Revenue Bond Debt Service
Fund
Local Obligation Payments
Infrastructure Revenue Bonds
Revenue Fund
Operating Reserve Fund
State Moral Obligation Revenue Bonds
Capital Reserve Fund (2)
Infrastructure Revenue Bonds State Moral Obligation Revenue Bonds
Commonwealth Aid Intercept (1)
Makeup Shortfall
Makeup Shortfall
Makeup Shortfall
State Moral Obligation Revenue Bond Debt
Service Fund
(1) Payable from the Commonwealth to VRA.(2) Earnings on the Capital Reserve Fund Investments flow into the Revenue Fund.
Commonwealth Appropriation (1)
Normal FlowContingent Flow
Balance Available
Senior Lien
Junior Lien

-15-
ADDITIONAL INDEBTEDNESS
VRA may issue additional Series of Bonds (including either Infrastructure Revenue Bonds or Moral Obligation Bonds) under the Master Indenture subject to certain conditions and limitations set forth in the Master Indenture, including the provision of a Projected Revenue Certificate to the Trustee, which will, giving effect to the issuance of such Series of Bonds, show for each Bond Year (a) Revenue Coverage equal to at least the Required Revenue Coverage, (b) Infrastructure Revenue Bond Debt Service Coverage equal to at least the Required Infrastructure Revenue Bond Debt Service Coverage and (c) Infrastructure Revenue Bond Revenue Coverage equal to at least the Required Infrastructure Revenue Bond Revenue Coverage. The Projected Revenue Certificate will set forth the following:
(1) A schedule of estimated amounts of the following types of Revenues to be available in the then-current and each future Bond Year for the payment of the Principal and Interest Requirements of all of the Bonds and the Administration Charges: (i) scheduled Local Obligation Payments, except on Defaulted Local Obligations, (ii) income receivable from the investment of amounts from time to time held in the Infrastructure Revenue Debt Service Reserve Fund (not currently required to be funded) and the Capital Reserve Fund, (iii) amounts scheduled to be released from the Infrastructure Revenue Debt Service Reserve Fund or the Capital Reserve Fund as a result of the payment at maturity or pursuant to the Amortization Requirements of the Bonds Outstanding and, if applicable, then to be issued, and (iv) any other amounts identified as Revenues in the Projected Revenue Certificate and in a Supplemental Indenture, if there is filed with the Trustee written confirmation from each Rating Agency that the inclusion thereof will not result in the withdrawal or reduction of its then-current rating on any of the Bonds Outstanding.
(2) A schedule of estimated amounts of the following sources to be available in the then-current and each future Bond Year for the payment of the Principal and Interest Requirements of the Infrastructure Revenue Bonds: (i) investment earnings on amounts in the Operating Reserve Fund, (ii) amounts, if any, which are or will be on deposit in the Operating Reserve Fund, and (iii) any other revenues or amounts identified in the Projected Revenue Certificate and in a Supplemental Indenture as Infrastructure Revenue Bond Revenues or Fund balances available for the payment of the Principal and Interest Requirements of the Infrastructure Revenue Bonds, if there is filed with the Trustee written confirmation from each Rating Agency that the inclusion thereof will not result in the withdrawal or reduction of its then-current rating on any of the Infrastructure Revenue Bonds Outstanding.
(3) A schedule of the Principal and Interest Requirements and all Administrative Charges scheduled to become due and payable on each Payment Date in the then-current and each future Bond Year with respect to all Bonds Outstanding and, if applicable, then to be issued.
(4) A schedule of the Principal and Interest Requirements scheduled to become due and payable on each Payment Date in the then-current and each future Bond Year with respect to all Infrastructure Revenue Bonds Outstanding and, if applicable, then to be issued.
(5) The percentage obtained by dividing the sum of estimated Revenues and Infrastructure Revenue Bond Revenues set forth in paragraphs (1) and (2)(i) and (iii) for each of the then-current and future Bond Years by the scheduled Principal and Interest Requirements and Administrative Charges set forth in paragraph (3) for the same Bond Year ("Revenue Coverage").
(6) The percentage obtained by dividing the sum of estimated Revenues and Infrastructure Revenue Bond Revenues set forth in paragraphs (1) and (2)(i) and (iii) for each of the then-current and future Bond Years by the scheduled Principal and Interest Requirements set forth in paragraph (4) for the same Bond Year ("Infrastructure Revenue Bond Revenue Coverage").

-16-
(7) The percentage obtained by dividing the sum of estimated Revenues and Infrastructure Revenue Bond Revenues set forth in paragraphs (1) and (2)(i) and (iii) and the Fund balances set forth in paragraph (2)(ii) and (iii) for each of the then-current and future Bond Years by the scheduled Principal and Interest Requirements set forth in paragraph (4) for the same Bond Year ("Infrastructure Revenue Bond Debt Service Coverage").
In projecting the foregoing, VRA will make the following assumptions: (a) Revenues set forth in paragraph (1) that are scheduled to be retained in the Revenue Fund pursuant to the Indenture will be reflected as Revenues only with respect to the Payment Dates on which the Trustee is to be directed to apply such retained amounts, (b) invested funds will yield an investment return equal to the actual return on such investments at the time of the projection net of any Rebate Amounts to be paid therefrom and will be invested until such time as they are to be applied to the purpose for which they are accumulated; (c) no Local Obligations will be acquired by VRA after the date of the Projected Revenue Certificate; and (d) Administrative Charges will be collected for the remaining term of each Local Obligation at the rate or rates in effect at the time of the calculation.
So long as any 2017C Bonds remain Outstanding, Required Infrastructure Revenue Bond Revenue Coverage means 120% for purposes of any Projected Revenue Certificate delivered in connection with the issuance of additional Infrastructure Revenue Bonds. Both Required Revenue Coverage and Required Infrastructure Revenue Bond Debt Service Coverage mean 100%.
In both the Projected Revenue Certificate provided as a condition to the issuance of the 2017C Bonds and in Fortieth Supplemental Series Indenture, VRA has identified as Revenues (a) the transfers from the IOW Escrow Fund to be used to pay the interest on the 2017C Bonds allocable to IOW accrued from the delivery date of the 2017C Bonds to the redemption date of the IOW Refunded Bonds and (b) the interest earnings on and the maturing amounts of certain investments that would be made from the proposed sale by the BVU Authority ("BVUA") of certain assets financed through the Program. The Trustee has received written confirmation from each Rating Agency that the inclusion of such amounts as Revenues will not result in the withdrawal or reduction of its then-current rating on any of the Bonds Outstanding. For more information regarding the IOW Escrow Fund, see the subsection "PLAN OF FINANCE AND REFUNDING" in this Section Two. For more information regarding BVUA and its proposed asset sale, see the information under the heading "Credit Concerns Regarding Particular Local Governments" in the subsection "INVESTMENT CONSIDERATIONS" in this Section Two.
See information included under the heading "Issuance of Bonds" in Appendix A for more information regarding the conditions for issuing additional Bonds.
[REMAINDER OF PAGE INTENTIONALLY LEFT BLANK]

-17-
PRIOR SERIES OF BONDS Of the prior Series of Bonds, $1,692,545,000 principal amount of the Infrastructure Revenue
Bonds and $815,635,000 principal amount of the Moral Obligation Bonds were outstanding as of September 30, 2017. These amounts do not account for the issuance of the 2017C Bonds or the defeasance of any bonds to be refunded by the 2017C Bonds. The prior Series of Bonds were issued on the dates and in the original principal amounts as set forth in the following chart:
Issue Date
Original Principal Amount of Infrastructure
Revenue Bonds Issued 1
Original Principal Amount of Moral Obligation
Bonds Issued 2 December 4, 20033 $ 65,655,000 $ 37,590,000 June 30, 20043 60,630,000 33,875,000 November 17, 2004 39,265,000 18,705,000 March 2, 20053 18,115,000 8,190,000 June 8, 2005 22,055,000 9,485,000 December 7, 2005 42,755,000 18,960,000 June 8, 2006 61,550,000 31,160,000 August 31, 2006 17,270,000 8,005,000 December 14, 2006 45,935,000 22,860,000 June 7, 2007 29,790,000 14,465,000 December 13, 2007 46,000,000 21,655,000 June 19, 2008 48,890,000 22,450,000 December 10, 2008 147,495,000 67,945,000 June 17, 2009 170,205,000 83,665,000 November 19, 2009 127,355,000 58,975,000 June 16, 2010 50,470,000 23,170,000 August 18, 2010 28,320,000 12,910,000 November 23, 2010 114,375,000 52,315,000 June 2, 2011 57,250,000 24,265,000 November 16, 2011 157,410,000 68,570,000 June 13, 2012 237,110,000 107,100,000 August 2, 2012 54,080,000 24,975,000 December 6, 2012 36,930,000 16,840,000 June 5, 2013 92,810,000 42,135,000 August 14, 2013 46,410,000 20,080,000 November 20, 2013 17,150,000 7,950,000 May 21, 2014 66,290,000 29,870,000 August 13, 2014 92,405,000 42,085,000 November 19, 2014 107,635,000 47,600,000 December 17, 2014 27,465,000 12,835,000 May 28, 2015 94,885,000 40,450,000 August 19, 2015 48,560,000 21,510,000 October 14, 2015 21,910,000 9,850,000 November 18, 2015 112,235,000 54,745,000 May 25, 2016 89,580,000 47,040,000 August 10, 2016 34,975,000 17,560,000 November 16, 2016 146,095,000 66,820,000 May 24, 2017 42,965,000 19,130,000 August 16, 2017 30,330,000 8,835,000 TOTAL $2,750,610,000 4 $1,276,625,000 4
1 Prior Series of Bonds issued on or before June 17, 2009 were issued with the designation "Senior Series." 2 Prior Series of Bonds issued on or before June 17, 2009 were issued with the designation "Subordinate Series." 3 The Bonds of this Series have matured or been redeemed prior to maturity and are no longer Outstanding under the Master Indenture. 4 As of September 30, 2017, $1,692,545,000 principal amount of the Infrastructure Revenue Bonds and $815,635,000 principal amount of the
Moral Obligation Bonds were outstanding. These amounts do not account for the issuance of the 2017C Bonds or the defeasance of any bonds to be refunded by the 2017C Bonds.

-18-
SECURITY FOR THE LOCAL OBLIGATIONS
General
VRA's ability to make full and timely payments of the debt service on the 2017C Bonds is dependent in part on Local Governments making full and timely payments on their respective Local Obligations. It is possible that one or more Local Governments will be unable to make a full or timely payment on their Local Obligations. The Bonds Outstanding, including the 2017C Bonds, have been structured so as to minimize the risk that a default or event of non-appropriation by one or more Local Governments on their Local Obligations will cause a default on the Bonds. Payment of debt service on each Local Obligation will be due at least 30 days prior to the corresponding payment dates of the Bonds.
Under the Indenture, VRA has pledged all of its right, title and interest in and to the Local Obligations (except for the remedies related to the Commonwealth Aid Intercept Provision discussed below) and the payments thereunder to the Trustee for the benefit of the owners from time to time of the Bonds, provided that VRA has reserved the right and license to enjoy and enforce VRA's rights under the Local Obligations so long as no Event of Default with respect to the Bonds shall have occurred and be continuing. Set forth below are descriptions of certain matters relating to the security for the payment of the Local Obligations. As described above, the Local Obligations consist of Local Bonds and Financing Leases.
The Local Governments providing the Local Obligations are expected to consist mainly of Virginia counties, cities and towns with a wide range of governmental powers (individually, each a "Locality" and collectively, "Localities") and regional authorities, service authorities, sanitation districts and sanitary districts and similar entities in the Commonwealth that have been granted limited powers to provide certain services, such as water, wastewater, solid waste disposal, public safety or transportation services (collectively, "Limited Purpose Local Governments" and together with Localities, constituting "Local Governments").
The security and sources of payment for each Local Obligation constituting a Local Bond will vary and may consist of (a) a pledge of the full faith and credit of the Local Government to secure the Local Bond (a "General Obligation Local Bond"), (b) a pledge of certain revenues of a revenue-producing undertaking of the Local Government and funds and accounts established under the applicable bond resolution or indenture under and pursuant to which the Local Bond is issued (a "Revenue Local Bond"), which pledge may be on a parity with or subordinate to the pledge of such revenues applicable to other bonds of such Local Government, (c) a combination of (a) and (b) (a "Double-Barrel Local Bond"), or (d) a pledge of amounts annually appropriated at the discretion of the governing body of the Local Government and deposited into a special fund established by the Local Government (a "Special Fund Local Bond").
In certain cases, VRA may require that a Revenue Local Bond be additionally secured and credit enhanced by a subject-to-appropriation, "moral obligation" support agreement provided by a Locality (a "Local Support Agreement") as described in the heading "Local Bonds" below. In some instances, the Local Support Agreement may be issued by the same Locality issuing the Revenue Local Bond; in other instances, the Local Support Agreement may be issued by one or more Localities that are member jurisdictions of a Limited Purpose Local Government. Under no circumstances will a Local Support Agreement constitute a debt of a Locality or a pledge of the faith and credit or taxing power of a Locality.
The security and sources of payment for each Local Obligation constituting a Financing Lease will be subject to annual appropriation by the governing body of the Local Government, which will be under no legal obligation to make such appropriation. Under no circumstances will a Financing Lease constitute a debt of a Local Government or a pledge of the faith and credit or taxing power of a Local Government.

-19-
Local Bonds
Each Local Obligation constituting a Local Bond will evidence the obligation of the Local Government issuing such bond to repay the principal amount thereof, together with interest on the unpaid principal amount. Local Bonds may be issued and secured as General Obligation Local Bonds, Revenue Local Bonds, Double-Barrel Local Bonds or Special Fund Local Bonds, and VRA will purchase each Local Bond pursuant to an agreement with the respective Local Government (individually, each an "Agreement" and collectively, the "Agreements").
General Obligation Local Bond. Only Localities may issue General Obligation Local Bonds. Limited Purpose Local Governments may not issue General Obligation Local Bonds. A Locality issuing a General Obligation Local Bond will pledge its full faith and credit to secure the payment of the principal of, premium, if any, and interest on such Local Bond. The Locality will agree to levy an annual tax upon all property subject to local taxation sufficient to pay the principal of, premium, if any, and interest on its General Obligation Local Bond to the extent other funds of such Locality are not lawfully available and appropriated for such purpose.
Revenue Local Bond. A Local Government issuing a Revenue Local Bond pledges the revenues from the ownership or operation or lease of one or more of its water supply, wastewater collection and/or treatment, solid waste disposal, public safety, transportation or other revenue producing facilities, as the case may be (each a "System"), and, to the extent necessary, other appropriated funds to the payment of principal of, premium, if any, and interest on its Revenue Local Bond and its payment obligations under the Agreement, subject to the Local Government's right to apply revenues to the payment of certain operating, maintenance and replacement expenses and, in some cases, senior and parity indebtedness.
As shown in the subsection "THE 2017C LOCAL GOVERNMENTS AND THE OTHER PARTICIPATING LOCAL GOVERNMENTS" in Section Three, VRA has required certain Local Governments to obtain or provide additional security and credit enhancement for their Revenue Local Bonds in the form of subject-to-appropriation or "moral obligation" Local Support Agreements. The affected Local Governments are denoted by the term "MO" in the "Type of Security" columns.
Local Support Agreements include agreements to consider appropriations to replenish a debt service reserve fund securing a Revenue Local Bond or to provide working capital to a Local Government to pay operating costs and the debt service on its Revenue Local Bond. All Local Support Agreements contain or constitute a non-binding, legally unenforceable pledge by the governing body of a Locality to consider making the requested appropriations from the lawfully available funds of the Locality to support a Revenue Local Bond (issued by that Locality or a Limited Purpose Local Government) or the operations of a Local Government issuing a Revenue Local Bond. The constitutionality of "moral obligation" or "subject to appropriation" support agreements, such as Local Support Agreements, was upheld by the Virginia Supreme Court in Dykes v. Northern Virginia Transp. Dist. Com'n., 411 S.E. 2d 1, 242 Va. 357 (Va. 1991) ("Dykes"). Under no circumstances will a Local Support Agreement constitute a debt of the applicable Locality or a pledge of the faith and credit or taxing power of such Locality. See the heading "Local Support Agreements and Special Fund Local Bonds" in the subsection "INVESTMENT CONSIDERATIONS" in this Section Two. For the applicability of the Commonwealth Aid Intercept Provision to Local Support Agreements, see the heading "Commonwealth Aid Intercept Provision" in this subsection.
Double-Barrel Local Bond. Certain Localities may pledge both the revenues of their Systems and their full faith and credit to secure their Double-Barrel Local Bonds. Limited Purpose Local Governments are not empowered to issue Double-Barrel Local Bonds.
Special Fund Local Bond. Under VRA policies, only Localities with long-term credit ratings in the highest categories of the Rating Agencies are eligible to issue Special Fund Local Bonds to VRA. A

-20-
Special Fund Local Bond is payable solely from amounts deposited into a special fund established by the Locality, which amounts will be pledged to secure the Special Fund Local Bond. The obligation of the Locality to deposit amounts into the special fund will be subject to annual appropriation by the governing body of the Locality, and the governing body will be under no legal obligation to make such appropriation. Under no circumstances will a Special Fund Local Bond constitute a debt of the applicable Locality or a pledge of the faith and credit or taxing power of such Locality. See the heading "Local Support Agreements and Special Fund Local Bonds" in the subsection "INVESTMENT CONSIDERATIONS" in this Section Two. For the applicability of the Commonwealth Aid Intercept Provision to Local Bonds, including Special Fund Local Bonds, see the heading "Commonwealth Aid Intercept Provision" in this subsection.
Terms of the Agreements. Pursuant to the Agreements, VRA will agree to purchase the Local Bonds and each Local Government will agree to pay amounts due on its Local Bond to the Trustee, as assignee of VRA, including any amounts required to replenish amounts withdrawn from and foregone investment earnings on the Infrastructure Revenue Debt Service Reserve Fund (not currently required to be funded), the Operating Reserve Fund and the Capital Reserve Fund, as applicable, due to a failure by the Local Government to make a payment due under its Local Bond. The Agreements will contain, among other things, certain covenants relating to the preservation of the tax status of the corresponding Series of Bonds and the provision of annual audited financial statements of the Local Governments.
Local Governments issuing Revenue Local Bonds will covenant under their Agreements to charge rates or fees for the use of and the services provided by the financed System sufficient at all times to produce net revenues to pay debt service on all bonds payable therefrom, including the Local Bonds. Such Local Governments may also be required to establish reserve accounts in connection with their Local Bonds.
Localities issuing General Obligation Local Bonds and Double-Barrel Local Bonds will covenant that ad valorem taxes will be levied upon all property subject to taxation in amounts sufficient to pay debt service on their Local Bonds. Such Localities will agree to fulfill certain other payment obligations under the Agreements (such as payments for annual fees and expenses of the Trustee, rebate and certain costs and expenses incurred by VRA in connection with an event of default, any amendment or other discretionary action undertaken at the request of the Localities) only from legally available and appropriated funds.
Each Agreement will require that the Local Government apply the proceeds from the sale of its Local Bond to finance or refinance the costs of its Qualified Project. In the case of a new construction financing, VRA will cause the Trustee to disburse money from the Acquisition Fund from time to time to or for the account of the Local Government upon the receipt of a written requisition in the form prescribed by the Agreement.
Each Local Government issuing a Revenue Local Bond, a Double-Barrel Local Bond or a Special Fund Local Bond will agree to maintain its Qualified Project, to procure insurance with respect thereto and to collect revenues or lease payments therefrom, where applicable.
Except as otherwise agreed by VRA or provided in the Agreement, the bond resolution or indenture of a Local Government issuing a Revenue Local Bond or a Double-Barrel Local Bond, such Local Government will agree not to incur any indebtedness or issue any bonds, notices or other evidences of indebtedness secured by a pledge of project or System revenues, except subordinate bonds and parity bonds and those only within certain limitations.
Each Agreement will provide that if (a) a Local Government fails to pay when due any amount required to be paid under its Local Bond or the Agreement, (b) a Local Government fails to perform or observe the covenants, agreements or conditions of the Agreement (after receipt of notice of such failure

-21-
from VRA and continuation of such failure for 60 days after receipt of such notice), (c) any of the Local Government's warranties, representations or other statements contained in the Agreement or any instrument furnished in connection with the issuance and sale of its Local Bond is false or misleading or (d) there shall occur certain events of insolvency or events affecting creditor's rights, then such events will constitute events of default under the Agreement; provided that a failure of the governing body of a Locality issuing a Special Fund Local Bond to appropriate amounts necessary to pay the debt service on such Local Bond will not constitute an event of default.
Upon the occurrence of an event of default under an Agreement, VRA has the contractual right to take any action permitted by the Agreement or the bond resolution or indenture of the Local Government or to take any other legal or equitable action, including the appointment of a receiver, necessary or desirable to collect any amounts due and to enforce any duty, covenant or agreement of the Local Government.
Financing Leases
Certain Local Governments enter into Financing Leases with VRA (each a "Financing Lease Local Government") to lease one or more Qualified Projects from VRA. In certain instances, such as joint ownership of a Qualified Project in which a Local Government is unable to lease its interest, VRA may accept substitute real property as security under the Financing Lease. The term of the Financing Lease commences on the date of issuance and delivery of the related Series of Bonds and terminates upon payment of all rentals owed by the Financing Lease Local Government under the Financing Lease. The lease arrangement may involve an original prime lease of the Qualified Project or substitute real property from such Local Government to VRA and the leaseback of such property to such Local Government pursuant to the Financing Lease.
Each Financing Lease will contain, among other things, certain covenants relating to the preservation of the tax status of the corresponding Series of Bonds and the provision of annual audited financial statements of the Financing Lease Local Government.
Each Financing Lease will require that the Financing Lease Local Government apply the proceeds of the Financing Lease to finance or refinance the costs of the Qualified Project.
The Financing Lease Local Government will agree to maintain or cause to be maintained the Qualified Project or substitute real property and to procure insurance with respect thereto.
Each Financing Lease will provide that no part of the Qualified Project or substitute real property shall be sold, exchanged, leased, subleased, mortgaged, encumbered or otherwise disposed of except with the written consent of VRA.
In a Financing Lease, the rental payments are structured in amounts expected to be sufficient to pay the Financing Lease Local Government's proportionate share of debt service payments on the related Series of Bonds. The Financing Lease also provides for additional rental payments for items including deficiencies in the Operating Reserve Fund or the Capital Reserve Fund, as applicable, caused by a payment default, rebate amounts, late payment penalties, and certain Trustee fees and costs and expenses of VRA.
Pursuant to a Financing Lease, the Financing Lease Local Government will direct the officer charged with the responsibility of preparing such Local Government's budget to include in the budget for each fiscal year during the term of the Financing Lease a request that the governing body of such Local Government appropriate in the fiscal year all rental payments and other payments due under the Financing Lease during such fiscal year.

-22-
The undertaking of the Financing Lease Local Government to make payments under the Financing Lease is limited to amounts lawfully available and appropriated by the governing body thereof for such purpose. Under no circumstances will the payments under a Financing Lease constitute a debt of the applicable Locality within the meaning of any constitutional or statutory limitation or a pledge of the faith or credit or the taxing power of such Locality. Such Locality will not be liable for any such payments under the Financing Lease unless and until funds have been appropriated by its governing body for payment and then only to the extent of such appropriations.
If the governing body of the Financing Lease Local Government fails to appropriate funds for amounts due under the Financing Lease or such Local Government cannot observe and perform any covenant or agreement as a result of such non-appropriation, VRA or the Trustee on behalf of VRA, may then exclude such Local Government from possession of its Qualified Project or substitute real property (subject to certain public policy concerns and legal restrictions discussed below), with or without terminating the Financing Lease, and re-let all or any portion of the Qualified Project or substitute real property, applying the proceeds in accordance with the Indenture. The Financing Lease Local Government may reinstate the Financing Lease upon satisfaction of certain conditions. In most lease arrangements, VRA holds only a leasehold interest in the Qualified Project or substitute real property and thus, in exercising its rights upon an event of default or an event of non-appropriation by the Financing Lease Local Government, VRA may not sell the Qualified Project or substitute real property but may only re-let its interests in the Qualified Project or substitute real property to a third party. In addition, the ability of VRA to exclude a Financing Lease Local Government from possession of a Qualified Project or substitute real property may be limited by certain imposed public policy concerns or legal restrictions and may require judicial action, which is often subject to discretion and delay. For example, in the case of Qualified Projects for public roads, such concerns and restrictions relate to the rights of the Virginia Department of Transportation, adjacent landowners and the traveling public and, in the case of Qualified Projects or substitute real property for courthouses and other public safety facilities, such concerns and restrictions relate to the power of judges to control their courthouses and statutory requirements to provide adequate facilities for courts, Commonwealth's Attorneys and other constitutional officers. The foregoing factors may limit VRA's ability to re-let the Qualified Project or substitute real property upon an event of default or non-appropriation by the respective Financing Lease Local Government or to re-let the Qualified Project or substitute real property on terms as favorable as those in the Financing Lease.
Commonwealth Aid Intercept Provision
Historically, the Local Obligations of Localities (but not those of Limited Purpose Local Governments) have been further secured by the "Commonwealth Aid Intercept Provision" under Section 62.1-216.1 of the Act.
The 2011 Virginia General Assembly enacted SB1309 to amend Section 62.1-216.1. The amendments, which became effective July 1, 2011, extend the Commonwealth Aid Intercept Provision to encompass all Local Bonds, Local Support Agreements and Financing Leases, regardless of the security therefor.
Section 62.1-216.1 provides that, among other things, if it is established to the satisfaction of the Governor after submission of an affidavit by VRA and a summary investigation by the Governor of the facts set forth in the affidavit that a Locality has failed to make a payment on its Local Obligation or Local Support Agreement, then the Governor shall (a) issue an order directing the Comptroller of the Commonwealth to withhold all further payments to such Locality of all or any portion of the funds appropriated and payable by the Commonwealth to such Locality for any and all purposes until such nonpayment is cured, and (b) while such nonpayment continues, direct the payment of all funds so withheld, or so much of them as shall be necessary, to VRA so as to cover, or cover insofar as possible, the nonpayment on such Local Obligation or Local Support Agreement.

-23-
In addition, General Obligation Local Bonds and Double-Barrel Local Bonds are secured under Section 15.2-2659 of the Public Finance Act (the "General Obligation Intercept Provision"). The General Obligation Intercept Provision is similar in operation and effect to the Commonwealth Aid Intercept Provision but applies only as a remedy for a default in the payment of principal of, premium, if any, or interest on general obligation bonds. The General Obligation Intercept Provision covers all of the general obligation bonds issued by a Locality and not only those acquired by VRA.
Under either intercept provision, neither the Comptroller nor the Commonwealth has any legal obligation to make any payment on behalf of the nonpaying Locality other than from the funds appropriated and payable to the nonpaying Locality. Commonwealth aid that is payable to Localities and that is subject to interception is derived primarily from the Commonwealth's General Fund, with the remaining aid being payable from the Highway Maintenance and Construction Fund of the Virginia Department of Transportation and certain other funds. The primary sources of revenue for the Commonwealth's General Fund are individual and corporate income tax revenues, sales and use tax revenues, other tax revenues, interest, dividends and rents.
Neither the Virginia Supreme Court nor the Attorney General of Virginia has reviewed the validity of the Commonwealth Aid Intercept Provision, and there can be no assurance that such provision would be upheld if challenged. Further, the General Obligation Intercept Provision as embodied in either Section 15.2-2659 or its predecessor provisions (Sections 15.1-225 and 15.1-227.61) has not been reviewed by the Virginia Supreme Court. However, in 1973 the Attorney General of Virginia opined that funds appropriated and payable by the Commonwealth to local governments for any and all purposes may be withheld pursuant to the General Obligation Intercept Provision (set forth in Section 15.1-225 at that time) as a remedy for payment defaults under general obligation bonds.
To date, no order has been issued to withhold funds pursuant to either the Commonwealth Aid Intercept Provision or the General Obligation Intercept Provision. The General Obligation Intercept Provision has been successfully tested in a hypothetical default of a Locality with respect to bonds issued to the Virginia Public School Authority. Based on the results of that test, it is expected that the intercepted funds would be available within 30 days of the date of nonpayment. There can be no assurance that the benefits of the provisions available to VRA could be realized in the event of a nonpayment by a Local Government.
VRA is not the only entity with the power to enforce an intercept provision. The Board of Trustees of the Virginia Retirement System, under Section 51.1-146, has the discretion to cause the deduction "from any nonearmarked moneys distributable to a local government by any department or agency of the Commonwealth" of amounts equal to any delinquent contributions or insurance premiums owed by the local government to the Virginia Retirement System. There can be no assurance that the benefits of the provisions available to VRA will not be diminished by other intercept provisions or by other parties enforcing the General Obligation Intercept Provision.
The amount of aid appropriated by the Commonwealth to a Local Government varies from year to year and may not in a particular year equal or exceed all of the defaulted payment obligations of the Locality subject to the Commonwealth Aid Intercept Provision, the General Obligation Intercept Provision and any other similar intercept provisions. No guidance exists for determining the priority of the various intercept provisions in the event the amount of appropriated aid is insufficient to cover all of the applicable defaulted payment obligations.
VRA has covenanted in the Master Indenture to take any and all actions available to it under the laws of the Commonwealth (including the Commonwealth Aid Intercept Provision) to obtain Local Obligation Payments if a Local Government fails to make such payments when the same become due and payable. The Trustee, on behalf of the Bondholders, may request that VRA take such actions, but the Trustee has not been assigned the right to exercise unilaterally without the cooperation of VRA the

-24-
remedies granted to VRA under the Commonwealth Aid Intercept Provision. The General Assembly has the right to modify the Commonwealth Aid Intercept Provision in the future, which modifications may adversely affect the rights of VRA under such Provision. VRA is not aware of any proposal to make any such modification and as of the date hereof does not expect any to be enacted.
VRA LICENSE
All of the property pledged to the Trustee will be held in trust by the Trustee for the equal and proportionate benefit of the Owners from time to time of the 2017C Bonds and all other Bonds Outstanding under the Indenture. However, VRA has reserved the right and license to enjoy and enforce its rights with respect to the Local Obligations so long as no Event of Default with respect to the Bonds has occurred. This means, among other things, that, so long as no Event of Default has occurred, VRA may agree to amend the Local Obligations and related Agreements without the consent of the Trustee or the Owners of the Bonds. However, if an Event of Default with respect to the Bonds shall have occurred and be continuing, the Trustee will instead have such rights.
PROJECTED CASH FLOWS
The following projected cash flow schedule illustrates on an annual basis the projected amounts of Revenues and the debt service requirements on the 2017C Bonds and the other Bonds Outstanding on the date of delivery of the 2017C Bonds and the scheduled Administrative Charges. All of the projections of Revenues are estimates, and are based upon the timely payment of amounts due under all of the Local Obligations and the investments held in the Capital Reserve Fund.
[REMAINDER OF PAGE INTENTIONALLY LEFT BLANK]

-25-
Projected Cash Flow for the Virginia Pooled Financing Program
Infrastructure Bond Annual Anticipated CRF Moral Obligation Moral Obligation Total Annual Infrastructure Bond Debt Service Remaining Investment Bond D.S. Debt Service
Date Receipts1 Debt Service3 Coverage Receipts Receipts2 Plus Admin Fee3 Coverage
$3,523,760,961 $2,460,166,289 $1,063,594,672 $111,816,090 $1,175,410,762
11/1/2018 $227,447,058 $159,024,198 1.43x $68,422,860 $3,704,354 $72,127,214 1.00x 11/1/2019 221,607,450 154,746,313 1.43x 66,861,137 3,631,847 70,492,984 1.00x 11/1/2020 218,813,430 152,753,947 1.43x 66,059,483 4,769,197 70,828,680 1.00x 11/1/2021 214,498,962 150,026,709 1.43x 64,472,253 3,193,297 67,665,550 1.00x 11/1/2022 208,372,589 145,693,309 1.43x 62,679,281 4,464,297 67,143,577 1.00x 11/1/2023 201,904,324 141,185,608 1.43x 60,718,716 2,479,547 63,198,263 1.00x 11/1/2024 199,747,485 139,659,661 1.43x 60,087,824 3,049,547 63,137,370 1.00x 11/1/2025 195,603,197 136,835,035 1.43x 58,768,162 4,716,747 63,484,909 1.00x 11/1/2026 187,284,458 131,132,233 1.43x 56,152,225 3,493,014 59,645,239 1.00x 11/1/2027 178,955,700 125,119,872 1.43x 53,835,827 4,251,294 58,087,121 1.00x 11/1/2028 170,969,530 119,461,089 1.43x 51,508,440 7,707,994 59,216,434 1.00x 11/1/2029 154,121,493 107,463,379 1.43x 46,658,114 3,346,007 50,004,121 1.00x 11/1/2030 145,891,964 101,694,759 1.43x 44,197,205 5,540,350 49,737,555 1.00x 11/1/2031 139,238,656 97,001,629 1.44x 42,237,027 3,636,788 45,873,815 1.00x 11/1/2032 131,959,576 92,033,833 1.43x 39,925,743 3,699,069 43,624,812 1.00x 11/1/2033 122,180,117 85,314,918 1.43x 36,865,198 4,865,300 41,730,498 1.00x 11/1/2034 107,371,893 74,816,904 1.44x 32,554,989 8,319,758 40,874,747 1.00x 11/1/2035 84,108,214 58,544,866 1.44x 25,563,347 4,812,496 30,375,843 1.00x 11/1/2036 73,481,624 51,115,263 1.44x 22,366,361 2,816,358 25,182,719 1.00x 11/1/2037 67,492,092 47,038,795 1.43x 20,453,297 3,377,465 23,830,762 1.00x 11/1/2038 65,499,628 45,578,309 1.44x 19,921,320 4,987,958 24,909,278 1.00x 11/1/2039 52,046,623 36,073,739 1.44x 15,972,884 1,204,290 17,177,174 1.00x 11/1/2040 51,699,841 35,898,577 1.44x 15,801,264 7,018,790 22,820,054 1.00x 11/1/2041 32,173,101 22,417,349 1.44x 9,755,753 2,490,400 12,246,152 1.00x 11/1/2042 25,822,531 17,988,531 1.44x 7,834,000 3,316,956 11,150,956 1.00x 11/1/2043 16,382,494 11,363,088 1.44x 5,019,406 821,000 5,840,406 1.00x 11/1/2044 15,046,000 10,456,731 1.44x 4,589,269 927,813 5,517,081 1.00x 11/1/2045 12,615,719 8,742,494 1.44x 3,873,225 2,840,563 6,713,788 1.00x 11/1/2046 1,425,213 985,150 1.45x 440,063 2,333,600 2,773,663 1.00x
_________________________ 1 Projection assumes full amount of debt service is paid by all Local Governments on their related Local Bonds and Financing Leases. A number of factors may influence VRA's actual receipts. See the
following subsection, "INVESTMENT CONSIDERATIONS."
2 Assumes the timely receipt of all payments of principal and interest on investments held in the Capital Reserve Fund. 3 These amounts include the estimated debt service for the 2017C Bonds and the anticipated debt service after the defeasance of any bonds to be refunded by the 2017C Bonds.

-26-
INVESTMENT CONSIDERATIONS
Prospective purchasers of the 2017C Bonds should be aware that investment in the 2017C Bonds entails some degree of risk and uncertainty. Each prospective investor in the 2017C Bonds should read this Official Statement in its entirety. Particular attention should be given to the factors described below which, among others, could affect the payment of the debt service on the 2017C Bonds and which could also affect the market price of the 2017C Bonds to an extent that cannot be determined. This discussion of investment considerations is not, and is not intended to be, exhaustive.
Limited Obligations of VRA
The 2017C Bonds and all other Bonds heretofore or hereafter issued under the Indenture are limited obligations of VRA payable only from the Revenues and funds and accounts specifically pledged thereto. VRA has no taxing power. Accordingly, investors should consider only the sources of payment and security described under the subsection "SECURITY AND SOURCES OF PAYMENT FOR THE 2017C BONDS" in this Section Two.
Contractual Remedies of VRA Upon Default of Local Bonds
The ability of the Local Governments to make full and timely payments of debt service due on their respective Local Bonds will depend on various economic and financial circumstances. Although VRA does not expect any material nonpayments of debt service due on any Local Bonds, there can be no assurance that this will not occur in the future.
Upon the occurrence of a nonpayment on a Local Bond or any other event of default under any
Agreement, VRA has the contractual right to take any action permitted by the Agreement or the bond resolution of each Local Government or to take any other legal or equitable action, including the appointment of a receiver, necessary or desirable to collect any amounts due and to enforce any duty, covenant or agreement of the Local Government (including, for example with respect to a Revenue Local Bond, the covenant to set rates, fees and charges sufficient to pay debt service ). Notwithstanding VRA's contractual remedies, there can be no assurance that the remedies will be effective or produce amounts sufficient to pay debt service on the Local Bonds. All remedies are subject to bankruptcy, insolvency and other similar state and federal laws. However, under present law, Virginia Local Governments are not authorized to file for bankruptcy protection. See the subsection "SECURITY FOR THE LOCAL OBLIGATIONS" in this Section Two.
To date, there have been no nonpayments on any Local Bonds that have required VRA to make any transfers from any reserve fund or intercept any Commonwealth aid or have caused any payment default on bonds of VRA.
Credit Concerns Regarding Particular Local Governments
Pursuant to its post-issuance credit compliance procedures, VRA is closely monitoring two Local Governments with outstanding Local Bonds in the Program--the City of Petersburg, Virginia ("Petersburg") and the BVU Authority ("BVUA"). To date, neither Petersburg nor BVUA has missed or been late on any payment obligation to VRA. Neither Petersburg nor BVUA is a Material Local Government as described in the subsection "CONTINUING DISCLOSURE UNDER RULE 15c2-12" in Section Four.
Petersburg has three outstanding Local Bonds in the Program, two General Obligation Local Bonds and one water and sewer Revenue Local Bond (collectively, the "Petersburg Local Bonds"). As

-27-
described in the subsection "THE 2017C LOCAL GOVERNMENTS AND THE OTHER PARTICIPATING LOCAL GOVERNMENTS" in Section Three, the outstanding amount of the Petersburg Local Bonds is $19,225,000, which constitutes 0.8% of the outstanding aggregate principal amount of all outstanding Local Obligations in the Program as of the date hereof. According to news reports, since FY2016 Petersburg has faced severe financial difficulties stemming from years of structurally unbalanced budgets and a breakdown in utility and revenue billing and collection processes. These difficulties have resulted in Petersburg having problems funding its public schools and making timely payments to regional authorities of which Petersburg is a member and to the Virginia Retirement System. The problems have been exacerbated by considerable turnover at the highest level of Petersburg's leadership team. At Petersburg's request, the Commonwealth has provided administrative support to Petersburg and, in October 2016, Petersburg retained The Robert Bobb Group LLC (the "Bobb Group") to provide turnaround consulting and advisory services.
Petersburg has now recruited permanent staff to serve in the roles of City Manager, City Attorney, Director of Finance and Director of Public Works. The Bobb Group provided support to the new leadership team and otherwise served Petersburg through September 2017. The Bobb Group's efforts to stabilize the financial condition of Petersburg included development of a structurally balanced FY2018 operating and capital budget and the implementation of new procedures to track cash, revenues, expenditures, and grant funding. Additionally, Petersburg successfully restructured a portion of its long-term debt in August 2017 to provide near-term cash flow relief, and recent press indicates that Petersburg has secured a revenue anticipation note to provide for working capital needs during the remainder of FY2018. While VRA will continue to closely monitor the financial progress of Petersburg, the preliminary and final official statements for future series of VRA's Bonds may only include additional updates on Petersburg in the event of material deterioration in Petersburg's financial condition. VRA does not currently anticipate any interruption in the payments due under the Petersburg Local Bonds, given Petersburg's payment history, recent stabilization efforts, and the security associated with the Petersburg Local Bonds, which are further enhanced by the Commonwealth Aid Intercept Provision.
The Commonwealth Aid Intercept Provision applies to all of the Petersburg Local Bonds. In FY2016, revenues from the Commonwealth exceeded debt service subject to the Commonwealth Aid Intercept Provision by approximately 10 times on both (i) the Petersburg Local Bonds and (ii) the other Petersburg general obligation bonds not held by VRA that are subject to the General Obligation Intercept Provision. The maintenance of or any change to this level of Commonwealth aid is subject to appropriation by the General Assembly. In addition, one of the Petersburg Local Bonds is also secured by a local debt service reserve fund held by VRA's Trustee. This local debt service reserve fund holds an amount equal to maximum annual debt service on the Petersburg Local Bond it secures.
BVUA provides water, sewer, and electric services to its customers in its service area in southwestern Virginia, and provides telephone, internet, and cable television service through its OptiNet division. BVUA has one outstanding Revenue Local Bond in the Program (the "BVUA Local Bond"). The BVUA Local Bond is not subject to the Commonwealth Aid Intercept Provision. As described in the subsection "THE 2017C LOCAL GOVERNMENTS AND THE OTHER PARTICIPATING LOCAL GOVERNMENTS" in Section Three, the outstanding amount of the BVUA Local Bond is $35,275,000, which constitutes 1.5% of the outstanding aggregate principal amount of all Local Obligations in the Program as of the date hereof.
VRA has increased its monitoring of BVUA following news that since 2013 nine former executives, board members, and contractors of BVUA have been found guilty on multiple felony charges, including, but not limited to, falsified invoices, kickbacks, bribes, tax evasion, false income tax filings, wire fraud, mail fraud, and perjury. BVUA has new leadership in place, and the prior criminal activity

-28-
does not appear to have had a material impact on BVUA's financial results based on audited financials received by VRA.
VRA has also been monitoring a special audit of BVUA by the Commonwealth's Auditor of Public Accounts (the "APA"). The APA performed the audit as directed by legislation enacted in the 2016 General Assembly session and presented the results of the audit to the BVUA Board on September 15, 2016. The APA's principal finding was that the BVUA Board and management created the opportunity for fraud to occur by not developing, implementing, and enforcing good internal controls. The APA made a number of recommendations to improve BVUA's internal control policies and procedures.
The APA also noted that BVUA's OptiNet Division has a potential going concern issue, as it appears that BVUA does not have the resources to continue operating certain services within OptiNet without cross-subsidization, which the Code of Virginia prohibits. The APA found that BVUA has cross-subsidized services within OptiNet over the years by not properly allocating interest and principal debt payments across OptiNet services, by improperly writing off $13.7 million of interfund debt between OptiNet and the electric division, and by not paying OptiNet's share of pole attachment fees. Based on information provided by BVUA, VRA has determined that the revenues allocable to the internet and telephone services are sufficient to cover the allocable debt service and other cash expenses (disregarding non-cash items such as depreciation), but that the cable service continues to operate at a deficit. Approximately 13% of the BVUA Local Bond is allocable to the cable service.
In the BVUA Local Bond financing documents, BVUA has covenanted to set rates and otherwise operate the cable system so as to generate annual net cable system revenues sufficient to cover annual cable system debt service at least 1.0 times. BVUA has represented to VRA that it has already implemented processes to grow revenue, reduce expenses, improve business structure and mitigate risk associated with the cable service. Salary expenses have decreased significantly because several high-salaried BVUA employees have departed. A new management structure has been implemented to streamline procedures and ensure internal controls. Further, BVUA plans to focus on cash management, control capital expenses, implement payroll controls, restructure cable TV program offerings to correlate viewership to programming costs and reduce expenses from outside vendors. On the revenue side, BVUA plans to implement cable rate increases, normalize rates that had previously been discounted, adhere to a BVUA board-approved price schedule, expand broadband dark fiber sales, as well as adhere to the collection of installation and early termination fees.
BVUA has entered into a contract for the sale of the assets of all three OptiNet Division systems to a private party. However, the contract contains a number of conditions and VRA cannot reliably predict whether a sale will occur though it is currently expected to close before the end of calendar year 2017. If the sale does occur, a portion of the sale proceeds will be applied to purchase investments to legally defease or otherwise provide for the payment of (that is, economically defease) all or part of VRA's Bonds related to the BVUA Local Bond. The interest and maturing amounts of the investments purchased to economically defease such Bonds have been identified as Revenues by VRA as described in the subsection "ADDITIONAL INDEBTEDNESS" in this Section Two. Local Support Agreements and Special Fund Local Bonds
A Local Support Agreement contains or constitutes a non-binding, non-legally enforceable pledge of the governing body of a Locality to consider making the requested appropriations from the general funds of the Locality to support a Revenue Local Bond (issued by that Locality or a Limited Purpose Local Government) or the operations of a Local Government issuing a Revenue Local Bond. A Special Fund Local Bond contains a similar non-binding, non-legally enforceable pledge of the governing body of

-29-
a Locality to appropriate amounts into a sinking fund to pay the debt service on the Special Fund Local Bond. The governing body cannot be compelled to make the appropriations requested under a Local Support Agreement or with respect to a Special Fund Local Bond. However, the failure of the governing body to make such an appropriation would likely impair the credit standing of the Locality and would trigger the Commonwealth Aid Intercept Provision of Section 62.1-216.1 of the Act. See the heading "Commonwealth Aid Intercept Provision" in the subsection "SECURITY FOR THE LOCAL OBLIGATIONS" in this Section Two.
To date, no Locality has failed to make any required payments or timely appropriate funds under a Local Support Agreement.
Events of Non-Appropriation and Defaults Under Financing Leases
The undertaking of the Financing Lease Local Governments to make payments under their respective Financing Leases is subject to and dependent upon amounts being lawfully available and appropriated from time to time by the governing body of such Local Government. The governing body cannot be compelled to make the appropriations. The undertaking of a Financing Lease Local Government to make payments under its Financing Lease is not a debt of such Local Government within the meaning of any constitutional or statutory limitation or a pledge of the faith and credit or the taxing power of such Local Government.
Pursuant to the Financing Leases, if sufficient funds are not budgeted and appropriated by the governing body of the Financing Lease Local Government for the payment of amounts due under the Financing Lease and such Local Government defaults or fails to make payments under the Financing Lease, VRA may terminate the Financing Lease without penalty and may take possession of and re-lease the Qualified Project or substitute real property. Since the re-leasing of a Qualified Project or substitute real property may not be possible on terms as favorable as those of the Financing Lease there can be no assurance that the Rental Payments on the Financing Lease expected to be received will in fact be received. In addition, the ability of VRA to exclude a Financing Lease Local Government from possession in order to exercise VRA's remedy to re-lease a Qualified Project or substitute real property to a third-party may be limited by certain imposed public policy concerns or legal restrictions and may require judicial action, which is often subject to discretion and delay.
Moreover, if VRA exercises its rights to re-lease its interest in a Qualified Project or substitute real property, depending on the new user, interest paid on the Financing Lease may not be excludable from gross income for federal income tax purposes, which, in turn, may adversely affect the tax-exempt status of any Bonds the interest on which was intended to be excludable from gross income for federal income tax purposes.
To date, no Financing Lease Local Government has failed to make any required payments or timely appropriate funds.
Investment of Certain Funds
Amounts on deposit in the funds and accounts under the Indenture may be invested in various permitted investments. See information included under the heading "Restrictions on Permitted Investments" in Appendix A.

-30-
No Acceleration Upon Default of Bonds
The principal of, premium, if any, and interest on the Bonds is not subject to acceleration upon the occurrence and continuation of an Event of Default. Owners of Bonds will therefore be required to collect debt service payments on the Bonds due after an Event of Default based on the Bonds' scheduled payment dates from the Revenues and other property pledged under the Indenture which may not be sufficient to make such payments.
Additional Risks of Moral Obligation Bonds
Payment of debt service on VRA's Moral Obligation Bonds is subordinate to certain payment priorities, including payment of debt service on Infrastructure Revenue Bonds. See information included under the heading "Flow of Funds" in the subsection "SECURITY AND SOURCES OF PAYMENT FOR THE 2017C BONDS" in this Section Two. Timely payment of debt service on the Moral Obligation Bonds is dependent upon Revenues being available in sufficient amounts to satisfy all claims on such Revenues that are payable prior to payment of debt service on the Moral Obligation Bonds, including debt service on the Infrastructure Revenue Bonds. Moreover, VRA may issue additional Infrastructure Revenue Bonds in the future without the consent of the Owners of the Moral Obligation Bonds. See the subsection "ADDITIONAL INDEBTEDNESS" in this Section Two.
The failure to pay any amount related to the Moral Obligation Bonds will not constitute an Event of Default on the Infrastructure Revenue Bonds. So long as any Infrastructure Revenue Bonds are Outstanding, the Owners of such Bonds will control and direct all actions of the Trustee in exercising remedies upon an Event of Default, and no Owner of any Moral Obligation Bond may control or direct the exercise of such remedies.
Capital Reserve Fund Replenishment
The Act and the Indenture provide for the Governor to submit to the presiding officer of each house of the General Assembly a budget including, as an agency request for informational purposes only, the amount, if any, required to restore the Capital Reserve Fund to the CRF Reserve Requirement. The General Assembly may, but is not legally obligated to, appropriate to VRA such amount. Amounts on deposit in the Capital Reserve Fund have not fallen below the CRF Reserve Requirement and, therefore, the General Assembly has not to date been called upon to appropriate funds for replenishment of the Capital Reserve Fund. Neither this nor any other provision of the Act or the Indenture creates a debt or liability or pledges the faith and credit of the Commonwealth to make any appropriation or payments to VRA for this or any other purpose. The Capital Reserve Fund secures only the Moral Obligation Bonds. Under certain circumstances, VRA may reduce or eliminate the Commonwealth's Moral Obligation commitment to replenish the Capital Reserve Fund as described under the heading "Moral Obligation Bonds" in the subsection "SECURITY AND SOURCES OF PAYMENT FOR THE 2017C BONDS" in this Section Two.

-31-
Unknown Future Participants and Credit Standard Changes
The Master Indenture is an "open indenture" which authorizes the issuance of additional Series of Bonds and lending the proceeds thereof and other funds to Local Governments to be identified in the future. VRA expects regularly each year to acquire additional Local Obligations in amounts and at interest rates which have not yet been determined. Thus, the credit quality of the Local Obligations cannot be evaluated only on the basis of the Local Obligations already held or proposed to be acquired with the net proceeds of the 2017C Bonds. Although additional Series of Bonds are authorized only if sufficient Local Governments meet the credit standards, the credit standards may be changed or waived at the discretion of VRA. For a description of VRA's credit standards, see the subsection "THE VIRGINIA POOLED FINANCING PROGRAM" in Section Three.
No Requirement to Maintain Historical Debt Service Coverage Percentages
VRA's informal policy of acquiring or purchasing Local Obligations with a 70/30 proportion of Infrastructure Revenue Bonds and Moral Obligation Bonds is expected to produce an Infrastructure Revenue Bond Debt Service Coverage Ratio of approximately 1.40. However, VRA is not obligated to maintain this level of Infrastructure Revenue Bond Debt Service Coverage Ratio. Under the Indenture, VRA must show Required Revenue Coverage and Infrastructure Revenue Bond Debt Service Coverage of 100% in order to issue additional Infrastructure Revenue Bonds or Moral Obligation Bonds, or both. Further, for so long as any of the 2017C Bonds are outstanding VRA must show required Infrastructure Revenue Bond Revenue Coverage of 120% in order to issue additional Infrastructure Revenue Bonds or Moral Obligation Bonds, or both. There can be no assurances that VRA will maintain the informal policies concerning the issuance of Bonds or the projected Infrastructure Revenue Bond Debt Service Coverage Ratio set forth in the subsection "PROJECTED CASH FLOWS" in this Section Two.
Closing of Sale of 2017C Bonds Dependent on a Successful Closing of the Bonds Sold By Negotiated Sale and Competitive Bid
The 2017C Bonds are being issued to provide funding requested by the 2017C Local Governments for Qualified Projects. The 2017C Infrastructure Revenue Bonds are being offered by a negotiated sale with the Underwriters. The 2017C Moral Obligation Bonds are being offered for sale by competitive bid on the same day as the 2017C Infrastructure Revenue Bonds, and the closing of all of the 2017C Bonds is expected to occur on the same day. In the unlikely event that the sale of any of the series of 2017C Bonds does not close, VRA will not sell any of the series as the sale of all are required to fund the Qualified Projects of the 2017C Local Governments. See the subsections "UNDERWRITING OF CERTAIN 2017C BONDS" and "SALE OF 2017C MORAL OBLIGATION BONDS BY COMPETITIVE BIDDING" each in Section Four.
SECTION THREE: PROGRAM PARTICIPANTS
VIRGINIA RESOURCES AUTHORITY
VRA, created by the Act in July 1984, is organized and exists as a public body corporate and a political subdivision of the Commonwealth. VRA was created to assist in financing the present and future needs of the Commonwealth for, among other things, the costs of Qualified Projects, and to encourage the investment of both public and private funds to make loans and grants available to Local Governments for Qualified Projects.
VRA is authorized to issue its bonds to provide funds to carry out its purposes and powers. To date, VRA has issued bonds backed by the moral obligation of the Commonwealth in the original

-32-
aggregate principal amount of $2,459,074,229,* of which $928,948,162∗ was outstanding as of September 30, 2017. These amounts include the original and outstanding principal amounts of the Moral Obligation Bonds set forth in the subsection "PRIOR SERIES OF BONDS" in Section Two and bonds from other VRA programs. VRA is authorized to have outstanding bonds backed by the moral obligation of the Commonwealth of no more than $1.5 billion; however, this limit can be changed at any time by the General Assembly.
In addition, VRA has issued bonds that are not backed by the moral obligation of the Commonwealth in the original aggregate principal amount of $4,554,746,032,* of which $2,430,747,145* was outstanding as of September 30, 2017. These amounts include the original and outstanding principal amounts of the Infrastructure Revenue Bonds set forth in the subsection "PRIOR SERIES OF BONDS" in Section Two and bonds from other VRA programs.
Members of the Board
The Board of Directors of VRA consists of seven members appointed by the Governor and confirmed by the General Assembly for four-year staggered terms and four ex-officio members: the State Treasurer, the State Health Commissioner, the Director of the Department of Environmental Quality and the Director of the Department of Aviation. The Chairman of the Board of Directors is designated by the Governor and is the chief executive officer of VRA. The members of the Board of Directors are as follows:
Thomas L. Hasty, III of Chesapeake, Virginia. Director and Chairman. Term expires June 30, 2018. Mr. Hasty is Senior Executive Vice President of Towne Bank, Portsmouth, Virginia.
Cecil R. Harris, Jr. of Rockville, Virginia. Director and Vice Chairman. Term expires June 30, 2020. Mr. Harris is the County Administrator of the County of Hanover, Virginia.
Jennifer Bowles of Martinsville, Virginia. Director.** Term expires June 30, 2020. Ms. Bowles serves as a member of the Council of the City of Martinsville, Virginia.
David Branscome of Manassas, Virginia. Director. Term expires June 30, 2019. Mr. Branscome is Vice President of Branscome Paving Company, Manassas, Virginia.
Mary B. Bunting of Hampton, Virginia. Director. Term expires June 30, 2020. Ms. Bunting is the City Manager of the City of Hampton, Virginia.
Barbara McCarthy Donnellan of Clifton, Virginia. Director.** Term expires June 30, 2021. Ms. Donnellan served the Arlington County community for over 30 years and is the retired County Manager for Arlington County, a position she held between 2010 and 2015.
Reginald E. Gordon of Richmond, Virginia. Director. Term expires June 30, 2020. Mr. Gordon is the Director of the Office of Community Wealth Building for the City of Richmond, Virginia.
Randall P Burdette of Stafford County, Virginia. Director Ex-Officio. Mr. Burdette serves as Director of the Department of Aviation. He was appointed to this position on August 11, 2004. Previously, he served as Program Manager for the Defense Department's Technology Initiative.
∗ This amount does not account for the issuance of the 2017C Bonds or the defeasance of any bonds to be refunded by the 2017C Bonds. ** Subject to General Assembly confirmation
-33-
Manju Ganeriwala of Henrico County, Virginia. Director Ex-Officio. Ms. Ganeriwala serves as State Treasurer of Virginia. She was reappointed to this post by Governor Terence R. McAuliffe, effective January 2014. Prior to her initial appointment as State Treasurer in 2009, Ms. Ganeriwala served as Deputy Secretary of Finance beginning in January 2006.
Marissa Levine, MD, MPH of Richmond, Virginia. Director Ex-Officio. As of February 1, 2014, Dr. Levine serves as Health Commissioner. Prior to her appointment, Dr. Levine served as Interim Health Commissioner.
David K. Paylor of Richmond, Virginia. Director Ex-Officio. Mr. Paylor serves as the Director of the Department of Environmental Quality. Prior to his appointment, Mr. Paylor served as Deputy Secretary of Natural Resources for Governor Mark Warner.
VRA Staff
The Executive Director of VRA is appointed by the Governor. The Executive Director reports to, but is not a member of, the Board of Directors, and administers, manages and directs the affairs and activities of VRA in accordance with the policies, and under the control and direction, of the Board of Directors. Selected members of the staff include the following:
Jean Bass, Acting Executive Director. Ms. Bass has been designated Acting Executive Director of the Virginia Resources Authority (VRA) by the Office of the Governor. Ms. Bass served as VRA's Policy Director from 2009-2017 and its Director of Program Management from 2007-2009. Prior to her service with VRA, Ms. Bass served as a Special Assistant to former Governor Mark Warner, Vice President for Research & Development with Virginia State University, and Director of the Virginia Department of Minority Business Enterprise. A career public employee, Ms. Bass also directed the Virginia Office of Consumer Affairs and the Virginia Housing Study Commission.
Shawn Crumlish, Director of Financial Services. Mr. Crumlish joined VRA in 2005. Prior to VRA, his work experience included financial research and analysis and business development for several manufacturers. He holds a Bachelor's degree in Marketing from James Madison University and a Master's degree in Finance from Virginia Commonwealth University.
Peter D'Alema, Director of Program Management. Mr. D'Alema currently serves as the Director of Program Management for VRA. His previous experience includes serving as Financial Manager for VRA and Senior Commercial Underwriter for Bank of America, N.A. He holds a Bachelor's degree in Marketing Management from Virginia Polytechnic Institute and State University (Virginia Tech) and a Master's degree in Finance from Virginia Commonwealth University.
THE VIRGINIA POOLED FINANCING PROGRAM
Background
Under the Program, VRA uses the net proceeds of the Bonds to purchase or acquire Local Obligations from Local Governments to finance or refinance Qualified Projects. Qualified Project costs that may be financed by VRA are those incurred by a Local Government as reasonable and necessary for the carrying out of all work and undertakings necessary or incident to any Qualified Project. A "Qualified Project" is any project or facility related to water supply, wastewater treatment, solid waste management, recycling, resource recovery, energy conservation and efficiency, transportation, public safety, land conservation and preservation, parks and recreation, professional sports facilities (if designated by the General Assembly as eligible for assistance from VRA), federal facilities (and former federal facilities),
-34-
brownfield remediation and redevelopment, local government buildings, broadband, governmental airports, flood prevention or dam safety, together with related equipment, office, administrative, storage, and maintenance facilities, as well as interests in land related thereto.
To qualify under the Program, a Local Government must submit to VRA an application or other materials containing a description of its Qualified Project and a summary of the estimated costs necessary to complete the Qualified Project. In addition, the Local Government must submit a description of all sources of funds available to pay for the Qualified Project, including funds required from sources other than VRA. A Local Government (issuing a Revenue Local Bond or a Double-Barrel Local Bond) or a Financing Lease Local Government must submit a description of the revenues or lease payments to be derived from the Qualified Project which are to be pledged to the payment of the Local Obligation and a projection of revenues or lease payments and expenses for the Qualified Project over the life of the Local Obligation. When projections indicate a potential future need for revenues outside of those specifically pledged to support the debt service of a given Qualified Project, VRA may require a Local Support Agreement as an additional credit enhancement from one or more Local Governments before authorizing a loan. See the subsection "SECURITY FOR THE LOCAL OBLIGATIONS" in Section Two for additional information on Local Support Agreements. In addition, any Locality (issuing a General Obligation Local Bond, a Double-Barrel Local Bond, or a Special Fund Local Bond) or a Financing Lease Local Government must submit data with respect to assessed valuation of real estate, tax rates and receivables and outstanding and projected indebtedness. A Local Government must submit information with respect to population trends and general economic outlook of the community. Except in the cases of loans secured by Local Obligations that constitute General Obligation Local Bonds, Special Fund Local Bonds, refinancings or Financing Leases, a Local Government must submit a certificate, prepared by an independent consulting engineer, independent certified public accountant or other consultant acceptable to VRA, certifying as to, among other things, the sufficiency of the rates, fees and other charges established by the Local Government to meet its rate covenant contained in its Agreement. Each Local Government must submit audited financial statements in a form acceptable to VRA. Additionally, VRA may in its discretion require a Local Government to obtain an underlying rating from a rating agency at least equal to the rating level established by VRA.
The acquisition of a Local Obligation by VRA under the Program is determined by VRA generally on the basis of the economic feasibility of the Qualified Project to be financed by the Local Obligation and the financial viability of the Local Government. In assessing economic feasibility, VRA considers, among other things, prevailing economic conditions, population growth and trends, employment levels, the Local Government's administrative capabilities, the financial performance of the Local Government's water, sewer and/or solid waste system, public safety facility, or other revenue generating Qualified Projects, and the present rate structure. In addition, the Local Government issuing a Revenue Local Bond or a Double-Barrel Local Bond must demonstrate its ability to fix rates, fees and other charges at times and in amounts necessary to produce sufficient revenues to pay the operating and maintenance expenses of the Qualified Project, debt service on all outstanding prior or parity indebtedness against the Qualified Project and debt service on the Local Obligations issued in connection with the Qualified Project. In the case of Local Obligations constituting general obligations and Financing Leases, VRA considers, among other things, the tax base of the Local Government and its existing tax rate structure and the historical performance of the Local Government's general fund.
Certain information regarding the performance of the Program for the fiscal year ended June 30, 2017, is available in the Comprehensive Annual Report of the Virginia Resources Authority, and which is incorporated herein by reference. Such report has been filed with and is available from the Municipal Securities Rulemaking Board's Electronic Municipal Market Access Website.

-35-
Structure
The Local Obligations will be structured to provide for payments of debt service or rentals in amounts and at times that, together with the expected investment earnings and the balances scheduled to be released from the Capital Reserve Fund and certain other funds and accounts described herein, are expected to be adequate to pay the principal of, premium, if any, and interest on the Bonds (including the 2017C Bonds) through maturity or upon their earlier redemption. See the subsection "SECURITY AND SOURCES OF PAYMENT FOR THE 2017C BONDS" in Section Two.
VRA's current practice is to structure the Program so that for every $1.00 of Bond proceeds used to purchase or acquire Local Obligations, approximately $0.70 is provided from the proceeds of Infrastructure Revenue Bonds and approximately $0.30 is provided from the proceeds of Moral Obligation Bonds. However, VRA may change this structure at any time, subject to the limitations related to the issuance of additional Bonds. For instance, so long as any 2017C Bonds remain Outstanding, as a condition of issuing additional Bonds under the Indenture, VRA must show Required Infrastructure Revenue Bond Revenue Coverage of 120% for any additional Infrastructure Revenue Bonds and 100% for any additional Moral Obligation Bonds, but VRA is not required to issue Infrastructure Revenue Bonds and Moral Obligation Bonds in the same proportions as it has previously. See the subsection "ADDITIONAL INDEBTEDNESS" in Section Two.
SELECTED INFORMATION ON VIRGINIA LOCAL GOVERNMENTS
The information set forth below includes brief summaries of state law concerning the operation of, and certain legal restrictions applicable to, the Local Governments that have issued or will issue or enter into Local Obligations to be acquired by VRA from proceeds of the various Series of Bonds that have been or will be issued under the Indenture. Local Governments are expected to consist mainly of counties, cities, towns, regional authorities, service authorities, sanitation districts and sanitary districts in the Commonwealth. Nothing contained in the summaries set forth in this subsection should be construed as a representation or warranty of the financial condition of any specific Local Government.
Powers
Localities (i.e., counties, cities and towns) conduct their respective governmental activities pursuant to the provisions of the Constitution of Virginia (the "Constitution") and general and special laws of the Commonwealth. Localities generally have been granted powers to contract, sue and be sued, assess, levy and collect taxes, issue bonds, own, lease (as lessor and lessee) and take real or personal property, regulate nuisances, ensure public health and safety and take actions to protect the environment. Localities have also been granted powers to provide certain services, including without limitation police, fire, entertainment, rescue squad, street lighting, water, wastewater and solid waste disposal services.
Limited Purpose Local Governments (e.g., service authorities) are authorized to provide such services as are enumerated in their respective enabling legislation, which may include without limitation one or more of the following: water supply, wastewater treatment and disposal, stormwater and refuse collection and disposal services, public safety and transportation services.
Sources of Revenue
Localities. Revenues of Localities are derived principally from:

-36-
(1) General Property Taxes – Localities are authorized by the Constitution to levy an annual ad valorem tax on the assessed value of real and personal property located within their jurisdictions. The timing of such taxes and the rate of such taxes varies among Localities.
(2) Other Local Taxes – Localities may also levy various other local taxes including a sales and use tax, business, professional and occupational license taxes, a motor vehicle license tax, a meals tax, a recordation tax and a tax on consumer telephone bills.
(3) Intergovernmental Revenue – Localities may receive revenue from the Commonwealth for a portion of shared categorical expenses including certain expenditures for social services and the operation of constitutional offices. Cities and counties also receive a significant amount of aid from the Commonwealth in support of the public school system; however, such revenues are credited directly to the school system and are not reflected in the general funds of cities and counties. The Commonwealth is not obligated to maintain or continue such financial assistance, which is provided subject to appropriation by the General Assembly of the Commonwealth.
(4) Other Revenues – Other sources of revenue for a Locality may include permits, privilege fees and regulatory licenses, fines and forfeitures, interest on general fund investments, transfers from a utility fund, certain charges for services rendered, various recovered costs, and miscellaneous other revenues.
Limited Purpose Local Governments. Revenues of Limited Purpose Local Governments are derived principally from the payment of rates, fees and charges derived from the operation and use of the Systems of such Limited Purpose Local Governments.
Incurrence of Debt
Localities. Pursuant to the Constitution and the Public Finance Act of 1991 (Chapter 26, Title 15.2 of the Virginia Code), a Locality in the Commonwealth is authorized to issue bonds and notes secured by (a) a pledge of its full faith and credit and unlimited taxing power ("General Obligation Debt"), (b) a pledge of revenues from the ownership or operation or lease of a revenue producing enterprise, such as a water supply, wastewater treatment, solid waste disposal system or transportation project, and certain other funds ("Revenue Debt") and (c) a pledge combining (a) and (b) ("Double-Barrel Debt"). The Constitution and the Public Finance Act of 1991 limit the amount of such General Obligation Debt or Double-Barrel Debt (except Double-Barrel Debt that has been authorized by referendum to finance a project that is producing sufficient revenue to pay debt service on such Debt) which may be incurred by cities and towns (and counties that have elected to be treated as a city for purposes of the incurrence of debt) to 10% of the assessed valuation of real estate subject to local taxation. Some city or town charters may further limit the amount of debt that may be incurred within a fiscal year or that may be incurred without a referendum. Counties may not issue General Obligation Debt or Double-Barrel Debt without a referendum, except for refunding bonds and bonds issued for capital projects for school purposes and sold to the Literary Loan Fund, the Virginia Retirement System or other Commonwealth agency prescribed by law. The Constitution and the Public Finance Act of 1991 do not contain restrictions on the amount of Revenue Debt that may be incurred by a Locality. The bond resolution, trust indenture or other agreement providing for the issuance of Revenue Debt may, however, contain certain rate covenants and additional bonds tests that must be satisfied prior to the issuance of additional Revenue Debt.
The authorization for a Locality to issue a Special Fund Local Bond to VRA is found in Section 62.1-216 of the Act, which among other things provides for the creation and maintenance of special funds

-37-
for the payment of debt service on Local Bonds and the appropriation of funds of the Locality to make deposits into a special fund.
Limited Purpose Local Governments. Subject to the provisions of its respective enabling legislation, most Limited Purpose Local Governments are authorized to issue Revenue Debt only. The bond resolution, trust agreement or other agreement providing for the issuance of debt may contain certain rate covenants and additional bonds tests that must be satisfied prior to the issuance of additional Revenue Debt. Sanitary districts are authorized to issue Revenue Debt and, subject to certain limitations, may levy an annual tax upon on all property in the district subject to local taxation to pay debt service on such debt.
Leasing Powers
Most Local Governments are authorized to lease property as lessor and as lessee under the Virginia Code. In general, as described above, a county may not issue General Obligation Debt without a referendum. Counties sometimes choose to finance non-revenue-producing projects by entering into long-term leases under which the obligation to pay rentals is subject to annual appropriations by the governing body of the county. Based on a number of opinions of the Attorney General of Virginia, and the decision of the Supreme Court of Virginia in Dykes (as referenced under the heading "Local Bonds" in the subsection "SECURITY FOR THE LOCAL OBLIGATIONS" in Section Two), to the effect that "subject-to-appropriation" financings do not constitute General Obligation Debt, there is no legally enforceable duty or liability on the county to make the appropriation. The rentals are often pledged to secure bonds issued by Limited Purpose Local Governments to finance the project leased to the county.
Certain Economic Information
The economy of the Commonwealth and its Local Governments is affected to a significant degree by manufacturing, the government sector (including defense and other federal government operations), agriculture, mining and tourism. Defense installations are concentrated in (i) Northern Virginia, the location of the Pentagon, and (ii) the Hampton Roads area, including the Cities of Newport News, Hampton, Norfolk and Virginia Beach (Southeastern Virginia), the locations of, among other installations, the Joint Base Langley-Eustis (the combination of Langley Air Force Base and Fort Eustis), Norfolk Naval Station and the Oceana Naval Air Station, respectively. Any substantial reductions in defense spending generally or in particular areas, including base closings, could adversely affect the economies of the Commonwealth and its political subdivisions. Certain financial, economic and demographic information about the Commonwealth, including a discussion of certain economic outlook and revenue forecasts, has been incorporated in this Official Statement. See Appendices B, C and D.
[REMAINDER OF PAGE INTENTIONALLY LEFT BLANK]

-38-
THE 2017C LOCAL GOVERNMENTS AND THE OTHER PARTICIPATING LOCAL GOVERNMENTS
Set forth in the table below are the 2017C Local Governments and the features of their respective 2017C Local Obligations. The 2017C Local Obligations are expected to be delivered contemporaneously with the delivery of the 2017C Bonds.
2017C Local Governments
Local Government
Principal Amount of 2017C Local
Obligation
Purpose Type of Security2Term
(years)
Percentage of all
Outstanding Local
Obligations Buckingham County, Virginia
$4,890,000
Local Government Building, Refunding
Lease Revenue
16
0.21%
Caroline County, Virginia
7,580,000
Water, Wastewater, Refunding
Revenue, MO
23
0.32%
Chesterfield County, Virginia (Sportsplex and Rogers Building Project)
7,185,000
Local Government Building, Parks and
Recreation
Special Fund Revenue
19
0.30%
Chesterfield County, Virginia (Center for the Arts Project)
2,675,000
Local Government Building, Parks and
Recreation
Special Fund Revenue
19
0.11%
Hanover County, Virginia
1,285,000
Local Government Building, Refunding
Lease Revenue
13
0.05%
Isle of Wight, County
9,260,000
Public safety, Local Government Buildings,
Water, Wastewater; Site Acquisition and Development for Economic Development,
Refunding
Lease Revenue
15
0.39%

-39-
Roanoke County, Virginia
6,440,000
Parks and Recreation, Public Safety, Local
Government Building
Lease Revenue
20
0.27%
Rockingham County, Virginia
3,695,000
Water
Revenue
20
0.16%
Stafford County, Virginia
9,975,000
Public Safety, Local Government Building,
Refunding
Lease Revenue
20
0.42%
The City of Staunton, Virginia
3,940,000
Water, Wastewater, Refunding
GO
13
0.17%
The City of Suffolk, Virginia
14,355,000
Water, Wastewater
Revenue
27
0.61%
Western Virginia Water Authority
9,040,000
Water
Revenue
20
0.38%
Totals $80,320,0001 1 Total is less than aggregate par amount of the 2017C Bonds because total does not include bonds sold to fund the Capital Reserve Fund and to refund certain Capital Reserve Fund Bonds. 2 For an explanation of the types of security for the 2017C Local Obligations, see the subsection "SECURITY FOR THE LOCAL OBLIGATIONS" in Section Two.

-40-
Set forth in the table below is the aggregate participation in the Program of the 2017C Local Governments and all of the other Local Governments that have currently outstanding Local Obligations acquired with proceeds of the Bonds Outstanding. There are currently 142 Local Governments who participate in the Program including the 2017C Local Governments.
Aggregate Participation in the Virginia Pooled Financing Program
Local Government
Outstanding Principal Amount
% of all Local Obligations
Type of Security
Accomack County 3,465,000 0.15% Lease Revenue Alexandria Renew Enterprises 42,685,000 1.80% Revenue Amelia County 355,000 0.02% Revenue, MO Amherst County Service Authority 3,095,000 0.13% Revenue, MO Appomattox River Water Authority 7,725,000 0.33% Revenue Augusta County 4,905,000 0.21% Lease Revenue Bedford Regional Water Authority 10,680,000 0.45% Revenue, MO Bedford Regional Water Authority 30,685,000 1.30% Revenue Bland County 2,160,000 0.09% Lease Revenue Blue Ridge Regional Jail Authority 43,185,000 1.82% Revenue Botetourt County 12,435,000 0.53% Lease Revenue Bristol Virginia Utilities 35,275,000 1.49% Revenue Bristol, City of 2,845,000 0.12% GO Broadway, Town of 8,050,000 0.34% GO, Revenue Brunswick County 4,565,000 0.19% Lease Revenue Buchanan Public Service Authority 500,000 0.02% Revenue, MO Buckingham County 5,700,000 0.24% Lease Revenue Caroline County 36,270,000 1.53% Revenue, MO Caroline County 5,405,000 0.23% Lease Revenue Charlotte County 11,395,000 0.48% Lease Revenue Chesterfield County 35,185,000 1.49% Special Fund Revenue Chilhowie, Town of 3,935,000 0.17% GO Clarksville, Town of 3,660,000 0.15% GO, Revenue Clifton Forge, Town of 740,000 0.03% GO, Revenue Clifton Forge, Town of 250,000 0.01% GO Covington, City of 4,870,000 0.21% Revenue Craig-New Castle Public Service Authority 450,000 0.02% Revenue Culpeper County 2,720,000 0.11% Lease Revenue Dickenson County 370,000 0.02% Lease Revenue Dinwiddie County 49,580,000 2.10% Lease Revenue Dinwiddie County Water Authority 1,590,000 0.07% Revenue, MO Dumfries, Town of 1,380,000 0.06% GO Essex County 3,750,000 0.16% Lease Revenue Fairfax County 8,870,000 0.37% Special Fund Revenue Fairfax County Park Authority 2,220,000 0.09% Revenue Fairfax, City of 27,075,000 1.14% Lease Revenue Fairfax, City of 21,985,000 0.93% Revenue Falls Church, City of 540,000 0.02% GO Farmville, Town of 12,390,000 0.52% GO Fauquier County 11,775,000 0.50% Lease Revenue
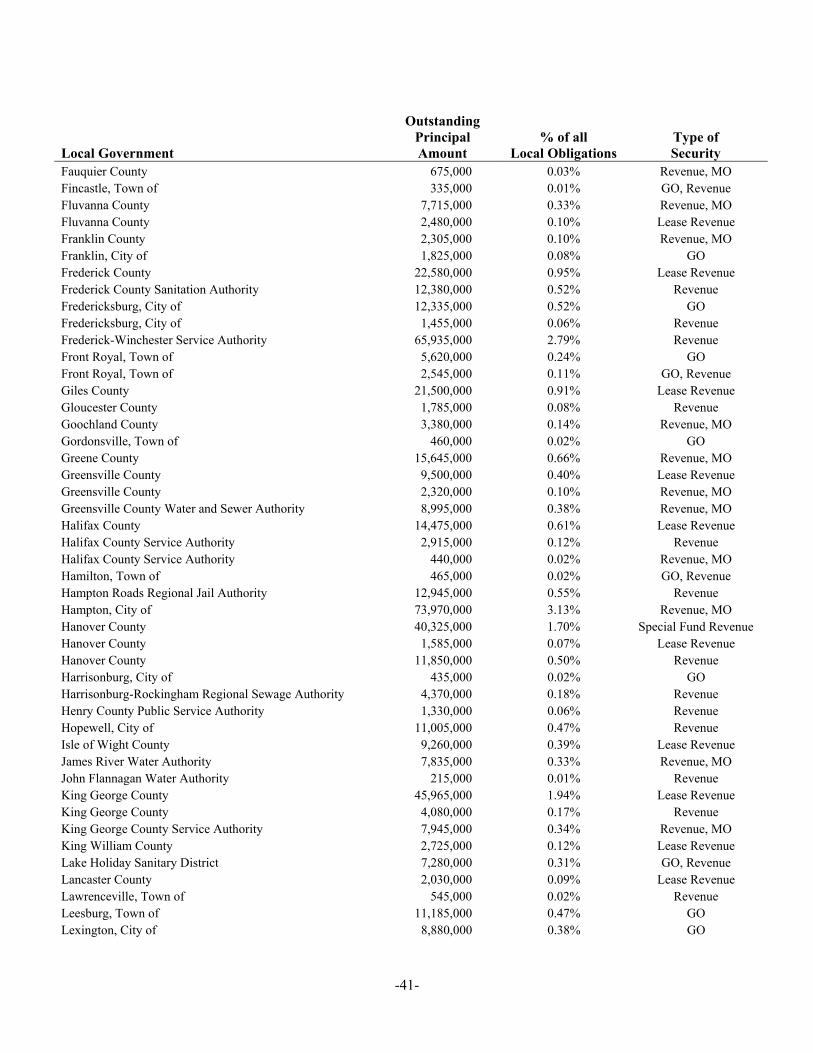
-41-
Local Government
Outstanding Principal Amount
% of all Local Obligations
Type of Security
Fauquier County 675,000 0.03% Revenue, MO Fincastle, Town of 335,000 0.01% GO, Revenue Fluvanna County 7,715,000 0.33% Revenue, MO Fluvanna County 2,480,000 0.10% Lease Revenue Franklin County 2,305,000 0.10% Revenue, MO Franklin, City of 1,825,000 0.08% GO Frederick County 22,580,000 0.95% Lease Revenue Frederick County Sanitation Authority 12,380,000 0.52% Revenue Fredericksburg, City of 12,335,000 0.52% GO Fredericksburg, City of 1,455,000 0.06% Revenue Frederick-Winchester Service Authority 65,935,000 2.79% Revenue Front Royal, Town of 5,620,000 0.24% GO Front Royal, Town of 2,545,000 0.11% GO, Revenue Giles County 21,500,000 0.91% Lease Revenue Gloucester County 1,785,000 0.08% Revenue Goochland County 3,380,000 0.14% Revenue, MO Gordonsville, Town of 460,000 0.02% GO Greene County 15,645,000 0.66% Revenue, MO Greensville County 9,500,000 0.40% Lease Revenue Greensville County 2,320,000 0.10% Revenue, MO Greensville County Water and Sewer Authority 8,995,000 0.38% Revenue, MO Halifax County 14,475,000 0.61% Lease Revenue Halifax County Service Authority 2,915,000 0.12% Revenue Halifax County Service Authority 440,000 0.02% Revenue, MO Hamilton, Town of 465,000 0.02% GO, Revenue Hampton Roads Regional Jail Authority 12,945,000 0.55% Revenue Hampton, City of 73,970,000 3.13% Revenue, MO Hanover County 40,325,000 1.70% Special Fund Revenue Hanover County 1,585,000 0.07% Lease Revenue Hanover County 11,850,000 0.50% Revenue Harrisonburg, City of 435,000 0.02% GO Harrisonburg-Rockingham Regional Sewage Authority 4,370,000 0.18% Revenue Henry County Public Service Authority 1,330,000 0.06% Revenue Hopewell, City of 11,005,000 0.47% Revenue Isle of Wight County 9,260,000 0.39% Lease Revenue James River Water Authority 7,835,000 0.33% Revenue, MO John Flannagan Water Authority 215,000 0.01% Revenue King George County 45,965,000 1.94% Lease Revenue King George County 4,080,000 0.17% Revenue King George County Service Authority 7,945,000 0.34% Revenue, MO King William County 2,725,000 0.12% Lease Revenue Lake Holiday Sanitary District 7,280,000 0.31% GO, Revenue Lancaster County 2,030,000 0.09% Lease Revenue Lawrenceville, Town of 545,000 0.02% Revenue Leesburg, Town of 11,185,000 0.47% GO Lexington, City of 8,880,000 0.38% GO

-42-
Local Government
Outstanding Principal Amount
% of all Local Obligations
Type of Security
Lexington, City of 2,115,000 0.09% Revenue Loudoun County 9,525,000 0.40% Lease Revenue Loudoun County 4,620,000 0.20% Revenue, MO Louisa County 36,480,000 1.54% Lease Revenue Lovettsville, Town of 2,005,000 0.08% GO, Revenue Luray, Town of 1,205,000 0.05% GO Luray, Town of 1,160,000 0.05% GO, Revenue Manassas Park, City of 23,850,000 1.01% GO Manassas Park, City of 8,805,000 0.37% GO, Revenue Manassas, City of 775,000 0.03% GO Mathews County 2,690,000 0.11% Lease Revenue Maury Service Authority 530,000 0.02% Revenue Meherrin Regional Jail Authority 36,760,000 1.55% Revenue, MO Middle River Regional Jail Authority 21,080,000 0.89% Revenue, MO Middleburg, Town of 1,615,000 0.07% GO Middlesex County 430,000 0.02% Lease Revenue Nelson County 8,645,000 0.37% Lease Revenue New Kent County 32,600,000 1.38% Lease Revenue New Kent County 12,660,000 0.53% Revenue, MO New Market, Town of 1,525,000 0.06% GO New River Regional Water Authority 12,050,000 0.51% Revenue, MO Northampton County 18,300,000 0.77% Lease Revenue Northern Virginia Regional Park Authority 13,800,000 0.58% Revenue Northwestern Regional Jail Authority 2,360,000 0.10% Revenue, MO Norton, City of 1,415,000 0.06% GO, Revenue NRV Regional Water Authority 5,495,000 0.23% Revenue Patrick County 5,345,000 0.23% Lease Revenue Petersburg, City of 12,175,000 0.51% GO Petersburg, City of 7,050,000 0.30% Revenue Pittsylvania County 1,155,000 0.05% Lease Revenue Pocahontas, Town of 780,000 0.03% GO Poquoson, City of 305,000 0.01% GO, Revenue Potomac Rappahannock Transportation Commission 1,295,000 0.05% Revenue, MO Powhatan County 3,940,000 0.17% Lease Revenue Powhatan County 16,350,000 0.69% Revenue, MO Prince Edward County 5,880,000 0.25% Lease Revenue Prince Edward County 290,000 0.01% GO Prince William County 57,525,000 2.43% Lease Revenue Purcellville, Town of 430,000 0.02% GO, Revenue Radford, City of 8,190,000 0.35% GO Rapidan Service Authority 10,575,000 0.45% Revenue Rappahannock Regional Jail Authority 4,325,000 0.18% Revenue Richmond County 755,000 0.03% Lease Revenue Richmond Metropolitan Transportation Authority 78,140,000 3.30% Revenue Rivanna Water and Sewer Authority 60,940,000 2.58% Revenue Roanoke County 29,890,000 1.26% Lease Revenue
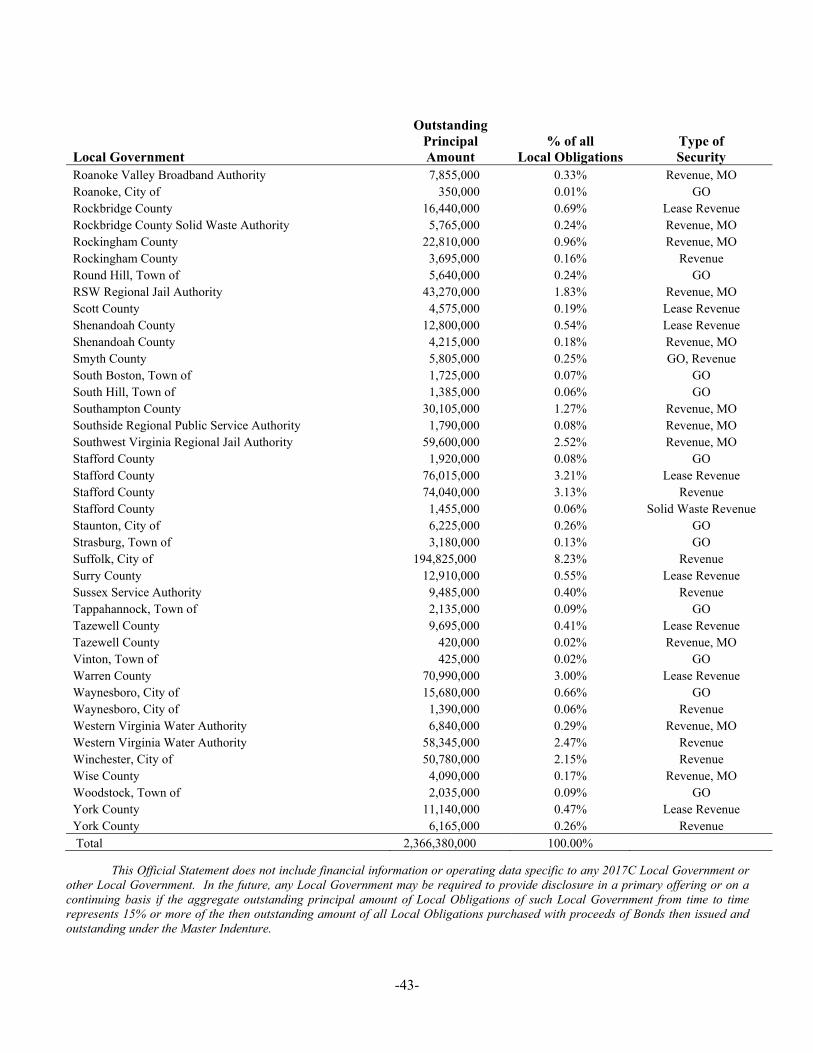
-43-
Local Government
Outstanding Principal Amount
% of all Local Obligations
Type of Security
Roanoke Valley Broadband Authority 7,855,000 0.33% Revenue, MO Roanoke, City of 350,000 0.01% GO Rockbridge County 16,440,000 0.69% Lease Revenue Rockbridge County Solid Waste Authority 5,765,000 0.24% Revenue, MO Rockingham County 22,810,000 0.96% Revenue, MO Rockingham County 3,695,000 0.16% Revenue Round Hill, Town of 5,640,000 0.24% GO RSW Regional Jail Authority 43,270,000 1.83% Revenue, MO Scott County 4,575,000 0.19% Lease Revenue Shenandoah County 12,800,000 0.54% Lease Revenue Shenandoah County 4,215,000 0.18% Revenue, MO Smyth County 5,805,000 0.25% GO, Revenue South Boston, Town of 1,725,000 0.07% GO South Hill, Town of 1,385,000 0.06% GO Southampton County 30,105,000 1.27% Revenue, MO Southside Regional Public Service Authority 1,790,000 0.08% Revenue, MO Southwest Virginia Regional Jail Authority 59,600,000 2.52% Revenue, MO Stafford County 1,920,000 0.08% GO Stafford County 76,015,000 3.21% Lease Revenue Stafford County 74,040,000 3.13% Revenue Stafford County 1,455,000 0.06% Solid Waste Revenue Staunton, City of 6,225,000 0.26% GO Strasburg, Town of 3,180,000 0.13% GO Suffolk, City of 194,825,000 8.23% Revenue Surry County 12,910,000 0.55% Lease Revenue Sussex Service Authority 9,485,000 0.40% Revenue Tappahannock, Town of 2,135,000 0.09% GO Tazewell County 9,695,000 0.41% Lease Revenue Tazewell County 420,000 0.02% Revenue, MO Vinton, Town of 425,000 0.02% GO Warren County 70,990,000 3.00% Lease Revenue Waynesboro, City of 15,680,000 0.66% GO Waynesboro, City of 1,390,000 0.06% Revenue Western Virginia Water Authority 6,840,000 0.29% Revenue, MO Western Virginia Water Authority 58,345,000 2.47% Revenue Winchester, City of 50,780,000 2.15% Revenue Wise County 4,090,000 0.17% Revenue, MO Woodstock, Town of 2,035,000 0.09% GO York County 11,140,000 0.47% Lease Revenue York County 6,165,000 0.26% Revenue Total 2,366,380,000 100.00%
This Official Statement does not include financial information or operating data specific to any 2017C Local Government or
other Local Government. In the future, any Local Government may be required to provide disclosure in a primary offering or on a continuing basis if the aggregate outstanding principal amount of Local Obligations of such Local Government from time to time represents 15% or more of the then outstanding amount of all Local Obligations purchased with proceeds of Bonds then issued and outstanding under the Master Indenture.

-44-
SECTION FOUR: MISCELLANEOUS
LITIGATION
There is not now pending or, to the knowledge of VRA, threatened against VRA any litigation restraining or enjoining the issuance or delivery of the 2017C Bonds or questioning or affecting the validity of the 2017C Bonds or the proceedings and authority under which the 2017C Bonds are to be issued, or the pledge or application of any moneys or the security provided for the payment of the 2017C Bonds (except as described below), or the existence or powers of VRA, or restraining or enjoining the execution, delivery or performance of the 2017C Bonds or the Indenture or questioning or affecting the validity of the 2017C Bonds or the Indenture.
Each Local Government will be expected to represent in its respective Agreement that there is no action or suit pending or, to the knowledge of the Local Government, threatened against the Local Government (a) affecting the creation, organization or existence of the Local Government or the title of its officers to their respective offices, (b) seeking to prohibit, restrain or enjoin the execution of the related Agreement or the issuance or delivery of its Local Obligation, or (c) in any way contesting or affecting the validity or enforceability of such Local Obligation or Agreement or any agreement or instrument relating to any of the foregoing or the undertaking of the Qualified Project. If a Local Government is unable to make such representation, VRA may in its discretion purchase or decline to purchase its Local Obligation.
From time to time, VRA, some Local Governments and other Virginia issuers are targets of legal proceedings challenging the validity of bonds and requesting associated relief. Such proceedings are frequently in the form of validation suits and "whistleblower" actions under the Federal False Claims Act and the Virginia Fraud Against Taxpayers Act. The plaintiffs or complainants often seek the reversal of long-settled legal precedents, most importantly the Virginia Supreme Court's holding in Dykes. See "Local Bonds" in the subsection "SECURITY FOR THE LOCAL OBLIGATIONS" in Section Two. These proceedings tend to be both protracted and highly publicized but to date have generally been found to be without legal merit. If VRA were to become a party to, or become aware of, any such proceeding that would have a material effect on the security for the 2017C Bonds, VRA would be obligated to make an "event disclosure" as described in the subsection "CONTINUING DISCLOSURE UNDER RULE 15c2-12" in this Section and in Appendix H.
LEGAL MATTERS
Certain legal matters relating to the authorization and validity of the 2017C Bonds are subject to the approving opinions of McGuireWoods LLP, Richmond, Virginia, Bond Counsel, which shall be in substantially in the forms set forth in the letter attached as Appendix F. Such opinion letter will be furnished at the expense of VRA upon delivery of the 2017C Bonds. Bond Counsel has not verified the accuracy, completeness or fairness of this Official Statement, and such opinion letter will make no statement of any kind as to this Official Statement. Bond Counsel's opinions will be limited to matters relating to (a) the authorization and validity of the 2017C Bonds, (b) the tax status of interest on the 2017C Bonds under current federal income tax laws, and (c) the tax status of interest on the 2017C Bonds under current Virginia income tax laws.
Certain legal matters will be passed on for VRA by its General Counsel, Christian & Barton, L.L.P., Richmond, Virginia, and for the Underwriters by their counsel, Troutman Sanders LLP, Richmond, Virginia. In connection with the execution and delivery of the Agreements, certain legal matters will be passed on for the 2017C Local Governments by their respective bond counsel and general counsel.
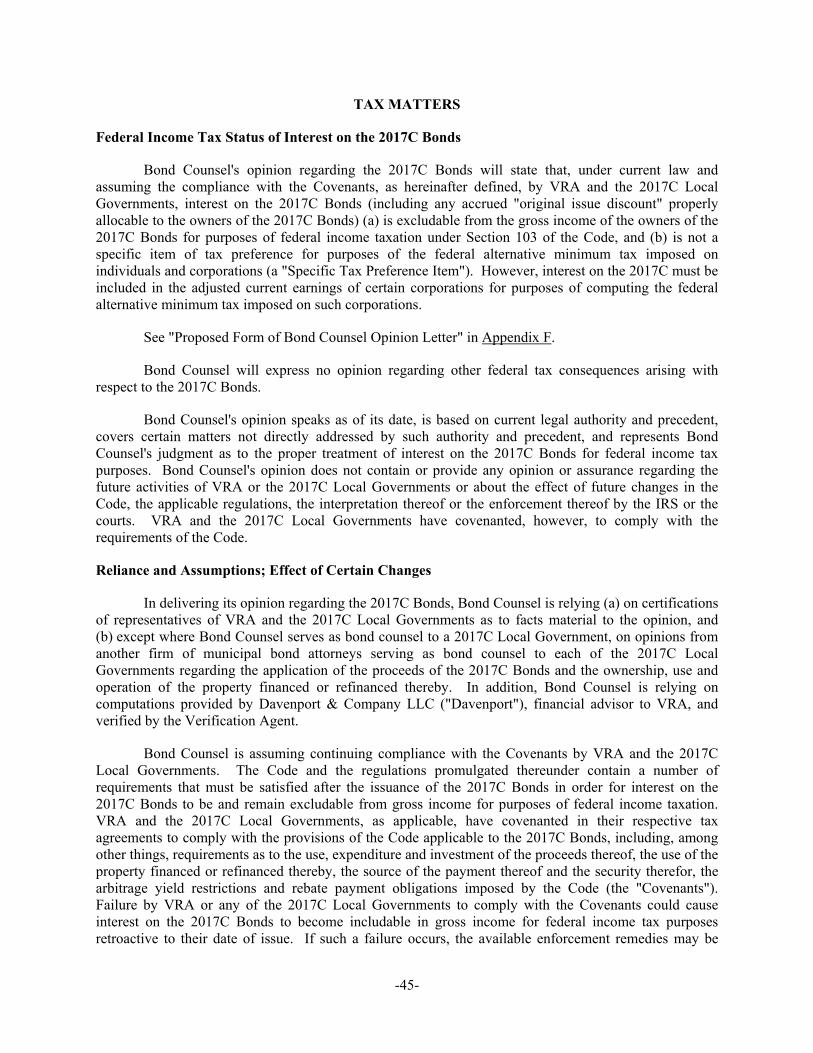
-45-
TAX MATTERS
Federal Income Tax Status of Interest on the 2017C Bonds
Bond Counsel's opinion regarding the 2017C Bonds will state that, under current law and assuming the compliance with the Covenants, as hereinafter defined, by VRA and the 2017C Local Governments, interest on the 2017C Bonds (including any accrued "original issue discount" properly allocable to the owners of the 2017C Bonds) (a) is excludable from the gross income of the owners of the 2017C Bonds for purposes of federal income taxation under Section 103 of the Code, and (b) is not a specific item of tax preference for purposes of the federal alternative minimum tax imposed on individuals and corporations (a "Specific Tax Preference Item"). However, interest on the 2017C must be included in the adjusted current earnings of certain corporations for purposes of computing the federal alternative minimum tax imposed on such corporations.
See "Proposed Form of Bond Counsel Opinion Letter" in Appendix F.
Bond Counsel will express no opinion regarding other federal tax consequences arising with respect to the 2017C Bonds.
Bond Counsel's opinion speaks as of its date, is based on current legal authority and precedent, covers certain matters not directly addressed by such authority and precedent, and represents Bond Counsel's judgment as to the proper treatment of interest on the 2017C Bonds for federal income tax purposes. Bond Counsel's opinion does not contain or provide any opinion or assurance regarding the future activities of VRA or the 2017C Local Governments or about the effect of future changes in the Code, the applicable regulations, the interpretation thereof or the enforcement thereof by the IRS or the courts. VRA and the 2017C Local Governments have covenanted, however, to comply with the requirements of the Code.
Reliance and Assumptions; Effect of Certain Changes
In delivering its opinion regarding the 2017C Bonds, Bond Counsel is relying (a) on certifications of representatives of VRA and the 2017C Local Governments as to facts material to the opinion, and (b) except where Bond Counsel serves as bond counsel to a 2017C Local Government, on opinions from another firm of municipal bond attorneys serving as bond counsel to each of the 2017C Local Governments regarding the application of the proceeds of the 2017C Bonds and the ownership, use and operation of the property financed or refinanced thereby. In addition, Bond Counsel is relying on computations provided by Davenport & Company LLC ("Davenport"), financial advisor to VRA, and verified by the Verification Agent.
Bond Counsel is assuming continuing compliance with the Covenants by VRA and the 2017C Local Governments. The Code and the regulations promulgated thereunder contain a number of requirements that must be satisfied after the issuance of the 2017C Bonds in order for interest on the 2017C Bonds to be and remain excludable from gross income for purposes of federal income taxation. VRA and the 2017C Local Governments, as applicable, have covenanted in their respective tax agreements to comply with the provisions of the Code applicable to the 2017C Bonds, including, among other things, requirements as to the use, expenditure and investment of the proceeds thereof, the use of the property financed or refinanced thereby, the source of the payment thereof and the security therefor, the arbitrage yield restrictions and rebate payment obligations imposed by the Code (the "Covenants"). Failure by VRA or any of the 2017C Local Governments to comply with the Covenants could cause interest on the 2017C Bonds to become includable in gross income for federal income tax purposes retroactive to their date of issue. If such a failure occurs, the available enforcement remedies may be

-46-
limited by applicable provisions of law and, therefore, may not be adequate to prevent the adverse tax consequences.
Bond Counsel has no responsibility to monitor compliance with the Covenants after the date of issue of the 2017C Bonds.
Certain requirements and procedures contained, incorporated or referred to in the tax agreements, including the Covenants, may be changed and certain actions may be taken or omitted under the circumstances and subject to the terms and conditions set forth in such document. Bond Counsel expresses no opinion concerning any effect on the excludability of interest on the 2017C Bonds from gross income for federal income tax purposes of any such subsequent change or action that may be made, taken or omitted upon the advice or approval of counsel other than Bond Counsel.
Certain Collateral Federal Tax Consequences
The following is a brief discussion of certain collateral federal income tax matters with respect to the 2017C Bonds. It does not purport to address all aspects of federal taxation that may be relevant to a particular owner thereof. Prospective purchasers of such 2017C Bonds, particularly those who may be subject to special rules, are advised to consult their own tax advisors regarding the federal tax consequences of owning or disposing of the 2017C Bonds.
Prospective purchasers of the 2017C Bonds should be aware that the ownership of tax-exempt obligations may result in collateral federal income tax consequences to certain taxpayers including, without limitation, financial institutions, certain insurance companies, certain corporations (including S corporations and foreign corporations), certain foreign corporations subject to the "branch profits tax," individual recipients of Social Security or Railroad Retirement benefits, taxpayers who may be deemed to have incurred or continued indebtedness to purchase or carry tax-exempt obligations and taxpayers attempting to qualify for the earned income tax credit.
In addition, prospective purchasers should be aware that the interest paid on, and the proceeds of the sale of, tax-exempt obligations, including the 2017C Bonds, are in many cases required to be reported to the IRS in a manner similar to interest paid on taxable obligations. Additionally, backup withholding may apply to any such payments made to any 2017C Bond owner who fails to provide an accurate Form W-9 Request for Taxpayer Identification Number and Certification, or a substantially identical form, or to any 2017C Bond owner who is notified by the IRS of a failure to report all interest and dividends required to be shown on federal income tax returns. The reporting and withholding requirements do not in and of themselves affect the excludability of such interest from gross income for federal income tax purposes or any other federal tax consequence of purchasing, holding or selling tax-exempt obligations.
Original Issue Discount
The "original issue discount" ("OID") on any 2017C Bond is the excess of such bond's stated redemption price at maturity (excluding certain "qualified stated interest" that is unconditionally payable at least annually at prescribed rates) over the issue price of such bond. The "issue price" of a 2017C Bond is the initial offering price to the public at which price a substantial amount of such bonds of the same maturity was sold. The issue price for each maturity of the 2017C Bonds is expected to be the initial public offering price set forth on the inside cover page of this Official Statement (or, in the case of 2017C Bonds sold on a yield basis, the initial offering price derived from such yield), but is subject to change based on actual sales. Accrued OID on the 2017C Bonds with OID (the "OID Bonds") is treated as interest that is excludable from gross income for purposes of federal and Virginia income taxation. However, the portion of the OID that is deemed to have accrued to the owner of an OID Bond in each

-47-
year may be included in determining the alternative minimum tax and the distribution requirements of certain investment companies and may result in some of the collateral federal income tax consequences mentioned in the preceding subsection. Therefore, owners of OID Bonds should be aware that the accrual of OID in each year may result in alternative minimum tax liability, additional distribution requirements or other collateral federal and Virginia income tax consequences although the owner may not have received cash in such year.
Interest in the form of OID is treated under Section 1288 of the Code as accruing under a constant yield method that takes into account compounding on a semiannual or more frequent basis. If an OID Bond is sold or otherwise disposed of between semiannual compounding dates, then the OID which would have accrued for that semiannual compounding period for federal income tax purposes is to be apportioned in equal amounts among the days in such compounding period.
In the case of an original owner of an OID Bond, the amount of OID that is treated as having accrued on such OID Bond is added to the owner's cost basis in determining, for federal income tax purposes, gain or loss upon its disposition (including its sale, redemption or payment at maturity). The amounts received upon such disposition that are attributable to accrued OID will be excluded from the gross income of the recipients for federal income tax purposes. The accrual of OID and its effect on the redemption, sale or other disposition of OID Bonds that are not purchased in the initial offering at the initial offering price may be determined according to rules that differ from those described above.
Prospective purchasers of OID Bonds should consult their own tax advisors with respect to the precise determination for federal income tax purposes of the OID accrued upon sale or redemption of such OID Bonds and with respect to state and local tax consequences of owning OID Bonds.
Bond Premium
In general, if an owner acquires a bond for a purchase price (excluding accrued interest) or otherwise at a tax basis that reflects a premium over the sum of all amounts payable on the bond after the acquisition date (excluding certain "qualified stated interest" that is unconditionally payable at least annually at prescribed rates), that premium constitutes "bond premium" on that bond (a "Premium Bond"). In general, under Section 171 of the Code, an owner of a Premium Bond must amortize the bond premium over the remaining term of the Premium Bond, based on the owner's yield over the remaining term of the Premium Bond, determined based on constant yield principles. An owner of a Premium Bond must amortize the bond premium by offsetting the qualified stated interest allocable to each interest accrual period under the owner's regular method of accounting against the bond premium allocable to that period. In the case of a tax-exempt Premium Bond, if the bond premium allocable to an accrual period exceeds the qualified stated interest allocable to that accrual period, the excess is a nondeductible loss. Under certain circumstances, the owner of a Premium Bond may realize a taxable gain upon disposition of the Premium Bond even though it is sold or redeemed for an amount less than or equal to the owner's original acquisition cost. Prospective purchasers of any Premium Bond should consult their own tax advisors regarding the treatment of bond premium for federal income tax purposes, including various special rules relating thereto, and state and local tax consequences, in connection with the acquisition, ownership, amortization of bond premium on, sale, exchange, or other disposition of such Premium Bond.
Effects of Future Enforcement, Regulatory and Legislative Actions
The IRS has established a program to audit tax-exempt obligations to determine whether the interest thereon is includible in gross income for federal income tax purposes. If the IRS does audit the 2017C Bonds, the IRS will, under its current procedures, treat VRA as the taxpayer. As such, the beneficial owners of the 2017C Bonds will have only limited rights, if any, to participate in the audit or

-48-
any administrative or judicial review or appeal thereof. Any action of the IRS, including but not limited to the selection of the 2017C Bonds for audit, or the course or result of such audit, or an audit of other obligations presenting similar tax issues, may affect the marketability or market value of the 2017C Bonds.
Legislation affecting tax-exempt obligations is regularly considered by the U.S. Congress and various state legislatures. Such legislation may effect changes in federal or state income tax rates and the application of federal or state income tax laws (including the substitution of another type of tax), or may repeal or reduce the benefit of the excludability of interest on the tax-exempt obligations from gross income for federal or state income tax purposes. The Treasury and the IRS are continuously drafting regulations to interpret and apply the provisions of the Code and court proceedings may be filed the outcome of which could modify the federal or state tax treatment of tax-exempt obligations. There can be no assurance that legislation proposed or enacted after the date of issue of the 2017C Bonds, regulatory interpretation of the Code or actions by a court involving either the 2017C Bonds or other tax-exempt obligations will not have an adverse effect on the 2017C Bonds' federal or state tax status, marketability or market price or on the economic value of the tax-exempt status of the interest on the 2017C Bonds.
Prospective purchasers of the 2017C Bonds should consult their own tax advisors regarding the potential consequences of any such pending or proposed federal or state tax legislation, regulations or litigation, as to which Bond Counsel expresses no opinion.
State Tax Treatment of the 2017C Bonds
Bond Counsel's opinion also will state that, under current law, interest on the 2017C Bonds is excludable from the gross income of the owners thereof for purposes of income taxation by the Commonwealth. Bond Counsel will express no opinion regarding (a) other tax consequences arising with respect to the 2017C Bonds under the laws of the Commonwealth or (b) any consequences arising with respect to the 2017C Bonds under the tax laws of any state or local jurisdiction other than the Commonwealth. Prospective purchasers of the 2017C Bonds should consult their own tax advisors regarding the tax status of interest on the 2017C Bonds in a particular state or local jurisdiction other than the Commonwealth.
RELATIONSHIP OF PARTIES
Davenport, financial advisor to VRA, also serves as financial advisor to the City of Suffolk, Virginia ("Suffolk"), the County of Caroline, Virginia, IOW, and the County of Chesterfield, Virginia, for the 2017C financing.
Raymond James & Associates, Inc. ("Raymond James") serves as financial advisor to the County of Hanover, Virginia ("Hanover") and the County of Roanoke, Virginia ("Roanoke").
McGuireWoods LLP, Richmond, Virginia, Bond Counsel, serves as bond counsel to Suffolk, the County of Stafford, Virginia, Roanoke, and the County of Buckingham, Virginia.
McGuireWoods LLP, Richmond, Virginia, Bond Counsel, represents Davenport, the Trustee and each Underwriter from time to time, in matters unrelated to the 2017C Bonds.
Troutman Sanders LLP, Richmond, Virginia, counsel to the Underwriters, serves as bond counsel to Hanover and also serves as counsel to the Trustee.
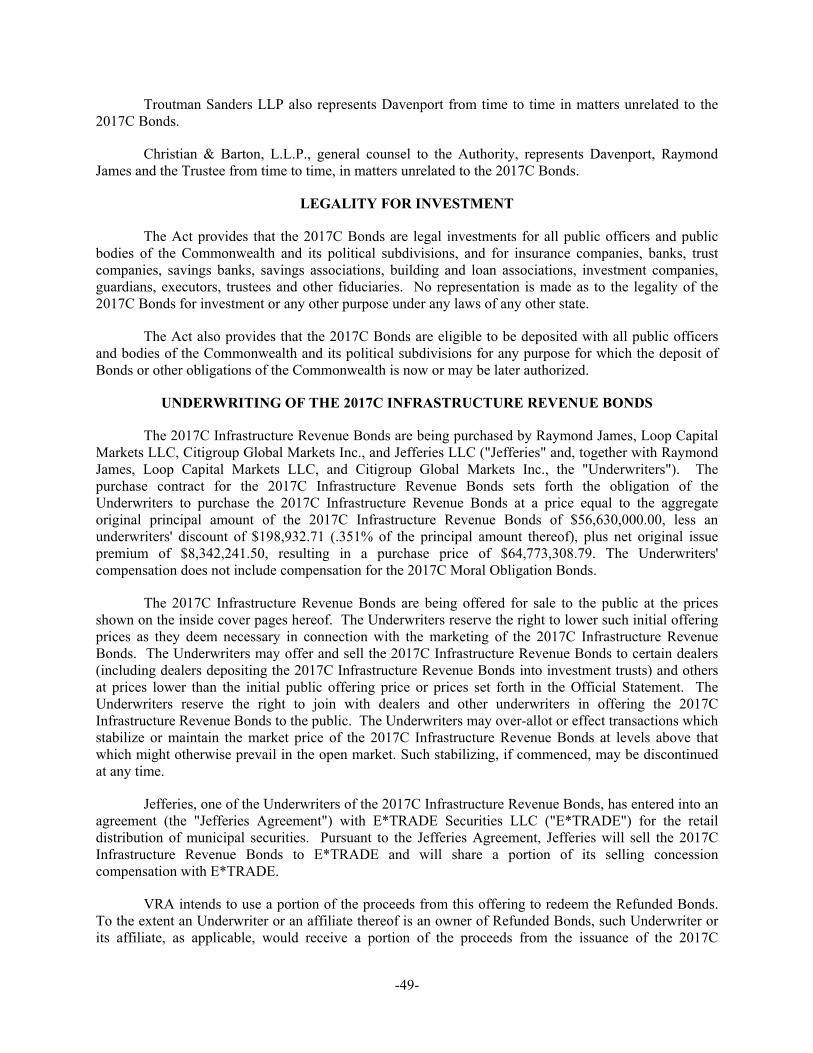
-49-
Troutman Sanders LLP also represents Davenport from time to time in matters unrelated to the 2017C Bonds.
Christian & Barton, L.L.P., general counsel to the Authority, represents Davenport, Raymond James and the Trustee from time to time, in matters unrelated to the 2017C Bonds.
LEGALITY FOR INVESTMENT
The Act provides that the 2017C Bonds are legal investments for all public officers and public bodies of the Commonwealth and its political subdivisions, and for insurance companies, banks, trust companies, savings banks, savings associations, building and loan associations, investment companies, guardians, executors, trustees and other fiduciaries. No representation is made as to the legality of the 2017C Bonds for investment or any other purpose under any laws of any other state.
The Act also provides that the 2017C Bonds are eligible to be deposited with all public officers and bodies of the Commonwealth and its political subdivisions for any purpose for which the deposit of Bonds or other obligations of the Commonwealth is now or may be later authorized.
UNDERWRITING OF THE 2017C INFRASTRUCTURE REVENUE BONDS
The 2017C Infrastructure Revenue Bonds are being purchased by Raymond James, Loop Capital Markets LLC, Citigroup Global Markets Inc., and Jefferies LLC ("Jefferies" and, together with Raymond James, Loop Capital Markets LLC, and Citigroup Global Markets Inc., the "Underwriters"). The purchase contract for the 2017C Infrastructure Revenue Bonds sets forth the obligation of the Underwriters to purchase the 2017C Infrastructure Revenue Bonds at a price equal to the aggregate original principal amount of the 2017C Infrastructure Revenue Bonds of $56,630,000.00, less an underwriters' discount of $198,932.71 (.351% of the principal amount thereof), plus net original issue premium of $8,342,241.50, resulting in a purchase price of $64,773,308.79. The Underwriters' compensation does not include compensation for the 2017C Moral Obligation Bonds.
The 2017C Infrastructure Revenue Bonds are being offered for sale to the public at the prices shown on the inside cover pages hereof. The Underwriters reserve the right to lower such initial offering prices as they deem necessary in connection with the marketing of the 2017C Infrastructure Revenue Bonds. The Underwriters may offer and sell the 2017C Infrastructure Revenue Bonds to certain dealers (including dealers depositing the 2017C Infrastructure Revenue Bonds into investment trusts) and others at prices lower than the initial public offering price or prices set forth in the Official Statement. The Underwriters reserve the right to join with dealers and other underwriters in offering the 2017C Infrastructure Revenue Bonds to the public. The Underwriters may over-allot or effect transactions which stabilize or maintain the market price of the 2017C Infrastructure Revenue Bonds at levels above that which might otherwise prevail in the open market. Such stabilizing, if commenced, may be discontinued at any time.
Jefferies, one of the Underwriters of the 2017C Infrastructure Revenue Bonds, has entered into an agreement (the "Jefferies Agreement") with E*TRADE Securities LLC ("E*TRADE") for the retail distribution of municipal securities. Pursuant to the Jefferies Agreement, Jefferies will sell the 2017C Infrastructure Revenue Bonds to E*TRADE and will share a portion of its selling concession compensation with E*TRADE.
VRA intends to use a portion of the proceeds from this offering to redeem the Refunded Bonds. To the extent an Underwriter or an affiliate thereof is an owner of Refunded Bonds, such Underwriter or its affiliate, as applicable, would receive a portion of the proceeds from the issuance of the 2017C

-50-
Infrastructure Revenue Bonds contemplated herein in connection with such Refunded Bonds being redeemed by VRA.
The Underwriters and their respective affiliates are full service financial institutions engaged in
various activities, which may include sales and trading, commercial and investment banking, advisory, investment management, investment research, principal investment, hedging, market making, brokerage and other financial and non-financial activities and services. Under certain circumstances, the Underwriters and their respective affiliates may have certain creditor and/or other rights against VRA in connection with such activities. In the various courses of their various business activities, the Underwriters and their respective affiliates, officers, directors and employees may purchase, sell or hold a broad array of investments and actively trade securities (both debt and equity), derivatives, loans, commodities, currencies, credit default swaps, interest rate swaps and other financial instruments for their own account and for the accounts of their customers, and such investment and trading activities may involve or relate to assets, securities and/or instruments of VRA (directly, as collateral securing other obligations or otherwise) and/or persons and entities with relationships with VRA. The Underwriters and their respective affiliates may also communicate independent investment recommendations, market color or trading ideas and/or publish or express independent research views in respect of such assets, securities or instruments and may at any time hold, or recommend to clients that they should acquire, long and/or short positions in such assets, securities and instruments.
In the ordinary course of their business activities, the Underwriters and their respective affiliates
have engaged, and may in the future engage, in transactions with, and perform services for, VRA for which they receive or will receive customary fees and expenses.
SALE OF 2017C MORAL OBLIGATION BONDS BY COMPETITIVE BIDDING
The 2017C Moral Obligation Bonds were offered for sale at competitive bidding on November 1, 2017, and were awarded to Robert W. Baird & Co., Inc. (the "Winning Bidder"). The Winning Bidder supplied the information as to the initial offering prices of the 2017C Moral Obligation Bonds as set forth on page (ii) of this Official Statement. The Winning Bidder will be purchasing the 2017C Moral Obligation Bonds at a purchase price equal to the aggregate original principal amount of the 2017C Moral Obligation Bonds of $30,315,000.00, less an underwriter's discount of $272,230.58 (0.898% of the principal amount thereof), plus net original issue premium of $2,969,376.15, resulting in a purchase price of $33,012,145.57.
CERTIFICATE CONCERNING OFFICIAL STATEMENT FOR WINNING BIDDER
Concurrently with the delivery of the 2017C Moral Obligation Bonds, officials who signed the 2017C Moral Obligation Bonds will certify that, to the best of their knowledge (a) the Official Statement did not as of its date, and does not as of the date of delivery of the 2017C Moral Obligation Bonds, contain any untrue statement of a material fact or omit to state a material fact which should be included therein for the purpose for which the Official Statement is to be used, or which is necessary in order to make the statements contained therein, in the light of the circumstances under which they were made, not misleading and (b) that no litigation is pending or threatened against VRA (i) to restrain or enjoin the issuance or delivery of any of the 2017C Bonds or VRA's collection and application of revenues and assets pledged under the Indenture, (ii) in any way contesting or affecting any authority for the issuance or validity of the 2017C Bonds, the execution and delivery by VRA of the Fortieth Supplemental Indenture or the validity of the Indenture, or (iii) in any way contesting the existence or powers of VRA. Such certificate will also state, however, that such officials did not independently verify the information in the Official Statement from sources other than VRA, but that they have no reason to believe that such

-51-
information contains any untrue statement of a material fact or omits to state a material fact which should be included therein for the purpose for which the Official Statement is to be used, or which is necessary in order to make the statements contained therein, in the light of the circumstances under which they were made, not misleading. However, no such certification shall be made regarding the information contained in the subsection "UNDERWRITING OF THE 2017C INFRASTRUCTURE REVENUE BONDS" in this Section Four.
VERIFICATION OF MATHEMATICAL COMPUTATIONS
The arithmetical accuracy of certain computations included in the schedules provided by Davenport on behalf of VRA relating to forecasted payments of principal and interest to redeem the Refunded Bonds was examined by Bingham Arbitrage Rebate Services, Inc., Richmond, Virginia, as Verification Agent. Such computations were based solely upon assumptions and information supplied by Davenport on behalf of VRA. The Verification Agent has restricted its procedures to examining the arithmetical accuracy of certain computations and has not made any study or evaluation of the assumptions and information upon which the computations are based and, accordingly, has not expressed an opinion on the data used, the reasonableness of the assumptions, or the achievability of the forecasted outcome.
RATINGS
As noted on the cover of this Official Statement, Moody's Investors Services, Inc. and S&P Global Ratings have assigned ratings of "Aaa" and "AAA", respectively, to the 2017C Infrastructure Revenue Bonds and "Aa2" and "AA", respectively, to the 2017C Moral Obligation Bonds.
The ratings reflect only the views of the respective rating agencies. Reference should be made to the respective rating agency for a full explanation of the significance of the assigned ratings. VRA furnished to such rating agencies certain information regarding its policies, practices and finances, including information that is not included in this Official Statement. The ratings are not a recommendation to buy, sell or hold the 2017C Bonds and should be evaluated independently. There is no assurance that the ratings will be maintained for any period of time or that the ratings may not be revised downward, suspended or withdrawn entirely by a rating agency if, in its judgment, circumstances so warrant. Any such downward revision, suspension or withdrawal of the ratings could have an adverse effect on the market price of the 2017C Bonds. Due to the ongoing uncertainty regarding the economy of the United States, including, without limitation, matters such as the future political uncertainty regarding the United States debt limit, obligations issued by state and local governments and political subdivisions of local governments, such as the 2017C Bonds, could be subject to a rating downgrade. Additionally, if a significant default or other financial crisis should occur in the affairs of the United States or of any of its agencies or political subdivisions, then such event could also adversely affect the market for and ratings, liquidity, and market value of outstanding debt obligations, including the 2017C Bonds.
FINANCIAL ADVISOR
Davenport is employed as a financial advisor to the VRA in connection with the issuance of the 2017C Bonds. The financial advisor's fee for services rendered with respect to the sale of the 2017C Bonds is contingent upon the issuance and delivery of the 2017C Bonds. Davenport, in its capacity as financial advisor, does not assume any responsibility for the information, covenants and representations contained in any of the legal documents provided, agreed to or made by others with respect to the federal income tax status of the 2017C Bonds, or the possible impact of any present, pending or future actions taken by any legislative or judicial bodies.

-52-
Davenport, as the financial advisor to the VRA, has provided the following sentence for inclusion in this Official Statement. Although Davenport has assisted in the preparation of this Official Statement, Davenport is not obligated to undertake, and has not undertaken to make, an independent verification or to assume responsibility for the accuracy, completeness or fairness of the information contained in this Official Statement.
CONTINUING DISCLOSURE UNDER RULE 15c2-12
This offering is subject to the continuing disclosure requirements of Rule 15c2-12 promulgated by the Securities and Exchange Commission (the "Rule"). Pursuant to a written agreement entered into for the benefit of the holders of the 2017C Bonds, each of (a) the Commonwealth, (b) VRA and (c) any Local Government that later becomes a Material Local Government will undertake to provide, directly or through an intermediary, specified annual financial information and notice of the events listed in the Rule to the Municipal Securities Rulemaking Board ("MSRB").
Commonwealth Continuing Disclosure. Under a Continuing Disclosure Agreement, the form of which is attached as Appendix G, the Treasurer's Office of the Commonwealth will undertake to provide in the manner indicated above information regarding the Commonwealth. In making timely filings of its Annual Reports for fiscal years 2010-2013, the CUSIP information necessary to link such filings to each series of VRA's Infrastructure Revenue Bonds and Moral Obligation Bonds was inadvertently omitted from such filings for fiscal years 2010-2013. Such filings were otherwise available from the MSRB with respect to other Commonwealth undertakings. The Commonwealth has taken steps to ensure future compliance with its undertakings regarding the Rule.
VRA Continuing Disclosure. As summarized in Appendix H, VRA will undertake in the Fortieth Supplemental Series Indenture to provide, in the manner indicated above, information regarding VRA.
VRA is aware that it has not complied with certain of its prior continuing disclosure undertakings as described in the following sentence. The operating data for fiscal years 2012, 2013 and 2015 were inadvertently not linked to CUSIPs for the Water and Sewer System Revenue Bonds, Refunding Series 2012 (Goochland County – Tuckahoe Creek Service District Project) and the Infrastructure and State Moral Obligation Revenue Bonds (Virginia Pooled Financing Program), Series 2013C and Series 2015D. In each case, promptly upon discovery of the omission, VRA undertook remedial action to link such operating data.
Local Government Continuing Disclosure. As summarized in Appendix I, each Local Government will undertake to provide, in the manner indicated above, information regarding such Local Government, but only upon notification by VRA that as of June 30 of any year, such Local Government met the objective criteria set forth in its undertaking to be a Material Local Government. A Local Government constitutes a "Material Local Government" if the aggregate principal amount of the Local Obligations previously issued and outstanding and to be issued by such Local Government is equal to or greater than 15% of the aggregate principal amount of all Local Obligations purchased with the proceeds of the Bonds. As of the date hereof, no Local Government qualifies as a Material Local Government, and no Local Government has qualified as a Material Local Government within the past five years.
The right of the Trustee and the holders to enforce the undertakings described in this subsection is limited to the right to compel performance of the respective obligations of the Commonwealth, VRA and any Material Local Government. Any failure of the Commonwealth, VRA or any Material Local Government to comply with its respective obligations will not give rise to an Event of Default under the Master Indenture, the Agreements or the Financing Leases, respectively.

-53-
The obligations of the Commonwealth, VRA and any Material Local Government to provide continuing disclosure are limited to providing specified information at specific times, which may not provide all information material to an evaluation of such entity's financial condition or other matters affecting an investment in the 2017C Bonds.
The Commonwealth, VRA and any Material Local Government may from time to time disclose certain information and data in addition to that required by the Rule. If the Commonwealth, VRA and any Material Local Government choose to provide such additional information or data, they shall have no obligation to continue to update such information or data or to include it in any future disclosure filing.
APPROVAL OF OFFICIAL STATEMENT
VRA has furnished all information in this Official Statement relating to VRA and has duly authorized the distribution of this Official Statement.
Certain financial information of the Commonwealth is on file with the MSRB and included in this Official Statement, all as more fully described in Appendices B, C and D.
Any statements in this Official Statement involving matters of opinion or of estimates, regardless of whether expressly so stated, are intended as such and not as representations of fact, and no representation is made that any of the estimates will be realized. VRA has deemed this Official Statement final as of its date within the meaning of the Rule.
VIRGINIA RESOURCES AUTHORITY By: /s/ Jean Bass
Jean Bass, Acting Executive Director

[THIS PAGE INTENTIONALLY LEFT BLANK]

A-1
APPENDIX A DEFINITIONS AND SUMMARY OF CERTAIN PROVISIONS OF THE INDENTURE
The following contains certain definitions and a brief summary of certain provisions contained in the Master Indenture and the Fortieth Supplemental Series Indenture of Trust and does not purport to be a complete statement of all of the provisions of those documents. Reference is made to the Master Indenture and the First through Fortieth Supplemental Series Indentures in their entirety for complete information on their terms and on the terms of the Infrastructure Revenue Bonds and Moral Obligation Bonds, the applicable security provisions and the application of pledged revenues.
Definitions of Certain Terms
Unless defined above in this Official Statement, all capitalized terms used in this Appendix have the meanings set forth below.
"Account" means any account established pursuant to the terms of the Master Indenture or any Supplemental Series Indenture.
"Acquisition Fund" means the Acquisition Fund for a Series of Bonds to be established by the Related Supplemental Series Indenture.
"Act" means the Virginia Resources Authority Act, Chapter 21, Title 62.1 of the Virginia Code.
"Administrative Charge" means any fees or charges established by VRA pursuant to Section 62.1-203(17) of the Act with respect to a Local Obligation, as the same may be revised from time to time and as the same shall be set forth in the Related Supplemental Series Indenture.
"Agreement," when used with respect to any Series of Bonds, means the loan, financing lease, sale-leaseback, lease-leaseback or similar agreement between a Local Government and VRA, as modified, altered, amended and supplemented from time to time in accordance with its terms and the terms of the Master Indenture, which agreement will govern the acquisition by VRA of the Related Local Obligation, among other things.
"Amortization Requirement," as applied to any Term Bonds of any maturity for any Bond Year, means the principal amount or amounts fixed by, or computed in accordance with the terms of, the Related Supplemental Series Indenture for the retirement of such Term Bonds by mandatory purchase or redemption on the Principal Payment Date or Dates established by such Supplemental Series Indenture.
"Bond" or "Bonds" means any or all of the Infrastructure Revenue Bonds and Moral Obligation Bonds of VRA issued pursuant to Article V of the Master Indenture, but excludes Junior Subordinate Debt.
"Bond Counsel" means counsel selected by VRA which is nationally recognized as experienced in matters relating to obligations issued or incurred by states and their political subdivisions.
"Bond Credit Facility" means a line of credit, letter of credit, standby bond purchase agreement, municipal bond insurance or similar credit enhancement or liquidity facility established to provide credit or liquidity support for all or any portion of a Series of Bonds as provided in the Related Supplemental Series Indenture.
A-2
"Bond Credit Provider" means, as to all or any portion of a Series of Bonds, the Person providing a Bond Credit Facility, as designated in the Related Supplemental Series Indenture in respect of such Bonds.
"Bond Year" means the 12 month period commencing on the second day of November of any calendar year and ending on the first day of November of the next ensuing calendar year, or such other twelve-month period commencing and ending on the dates specified with respect to a Series of Bonds in the Related Supplemental Series Indenture. The first and last Bond Years with respect to any Series of Bonds may be short periods.
"Business Day" means any Monday, Tuesday, Wednesday, Thursday or Friday on which commercial banking institutions generally are open for business in New York and Virginia.
"Capital Appreciation Bonds" means Bonds the interest on which is compounded and accumulated at the rates and on the dates set forth in the Related Supplemental Series Indenture and is payable upon redemption or on the maturity date of such Bonds or on the date, if any, upon which such Bonds become Current Interest Bonds.
"Capital Reserve Fund" means the Capital Reserve Fund established pursuant to the Master Indenture.
"Code" means the Internal Revenue Code of 1986, as amended, as in effect upon the issuance of and thereafter applicable to any Series of Bonds and the regulations of the United States Department of the Treasury promulgated thereunder as in effect upon the issuance of and thereafter applicable to any Series of Bonds.
"Commonwealth" means the Commonwealth of Virginia.
"Cost of Issuance Fund" means the Cost of Issuance Fund for a Series of Bonds to be established by the Related Supplemental Series Indenture.
"CRF Credit Facility" means a letter of credit, surety bond or similar credit enhancement facility acquired by VRA to substitute for cash or investments required to be held in the Capital Reserve Fund.
"CRF Credit Provider" means the Person providing a CRF Credit Facility.
"CRF Reserve Requirement" means an amount equal to the maximum Principal and Interest Requirements on the Moral Obligation Bonds Outstanding in the then current or any future Bond Year or such larger amount as may be specified in a Supplemental Series Indenture. For purposes of establishing the size of the CRF Reserve Requirement, the Principal and Interest Requirements on Moral Obligation Bonds which are Optional Tender Bonds and/or Variable Rate Bonds shall be determined or adjusted as set forth in the section titled "Modification of Certain Definitions" in the Master Indenture.
"Current Interest Bonds" means Bonds the interest on which is payable currently on the Interest Payment Dates provided therefor in the Related Supplemental Series Indenture.
"Custodian" means a bank or trust company that is (i) organized and existing under the laws of the United States or any of its states and (ii) acceptable to the Trustee.

A-3
"Defaulted Local Obligations" means any Local Obligations in default of payment of debt service at the time in question.
"Defeasance Obligations" means noncallable (i) Government Obligations, (ii) Government Certificates, (iii) Defeased Municipal Obligations, and (iv) Defeased Municipal Obligation Certificates.
"Defeased Municipal Obligation Certificate" means evidence of ownership of a proportionate interest in specified Defeased Municipal Obligations, which Defeased Municipal Obligations are held by a Custodian.
"Defeased Municipal Obligations" means obligations of the Commonwealth or any county, city, town, district, authority, agency, political subdivision or other public body of the Commonwealth, which are rated in the highest rating category by any Rating Agency, provision for the payment of the principal of and interest on which has been made by the deposit with a trustee or escrow agent of Government Obligations or Government Certificates, the maturing principal of and interest on which, when due and payable, will provide sufficient money to pay the principal of, redemption premium, if any, and interest on such obligations.
"Escrow Fund" means an escrow fund relating to a Series of Refunding Bonds that may be established pursuant to the Related Supplemental Series Indenture.
"Event of Default" means any of the events enumerated in the section titled "Events of Default" in the Master Indenture.
"Fund" means any fund established pursuant to the terms of the Master Indenture or any Supplemental Series Indenture.
"Government Certificates" mean certificates representing ownership of United States Department of the Treasury bond principal at maturity or interest coupons for accrued periods, which bonds or coupons are held in the capacity of custodian by a Custodian that is independent of the seller of such certificates.
"Government Obligations" mean direct obligations of, or obligations the payment of the principal of and interest on which is unconditionally guaranteed by, the United States.
"Infrastructure Revenue Bond Debt Service Coverage" shall have the meaning assigned to it in the definition of Projected Revenue Certificate.
"Infrastructure Revenue Bond Revenue Coverage" shall have the meaning assigned to it in the definition of Projected Revenue Certificate.
"Infrastructure Revenue Bond Revenues" means, collectively, the ORF Revenues, the Administrative Charges and the Rebate Amounts.
"Infrastructure Revenue Bonds" means any VRA Debt issued by VRA pursuant to Article V of the Master Indenture and identified as "Infrastructure Revenue Bonds" in the Related Supplemental Series Indenture. Infrastructure Revenue Bonds are secured by a pledge of and lien on (i) the Revenues senior and superior to the pledge of and lien on the Revenues securing the Moral Obligation Bonds and (ii) Infrastructure Revenue Bond Revenues. Infrastructure Revenue Bonds are not secured by the Capital Reserve Fund.

A-4
"Infrastructure Revenue Debt Service Fund" means the Infrastructure Revenue Debt Service Fund established pursuant to the Master Indenture.
"Infrastructure Revenue Debt Service Reserve Fund" means the Infrastructure Revenue Debt Service Reserve Fund established pursuant to the Master Indenture.
"Infrastructure Revenue DSRF Credit Facility" means a letter of credit, surety bond or similar credit enhancement facility acquired by VRA to substitute for cash or investments required to be held in the Infrastructure Revenue Debt Service Reserve Fund.
"Infrastructure Revenue DSRF Credit Provider" means the Person providing an Infrastructure Revenue DSRF Credit Facility.
"Infrastructure Revenue DSRF Requirement" means $0 or such larger amount as may be specified in a Supplemental Series Indenture.
"Interest Payment Date" means a November 1 or May 1, as the case may be; provided, however, that "Interest Payment Date" may mean, if so provided in a Supplemental Series Indenture, such other date or dates provided therein or permitted thereby.
"Interest Requirement" for any Interest Payment Date, as applied to all of the Current Interest Bonds or a portion thereof, means the total of the interest regularly scheduled to become due on such Bonds on such Interest Payment Date. Interest expense shall be excluded from the definition of Interest Requirement to the extent that proceeds of any Bonds are held by the Trustee to pay such interest. Unless VRA shall otherwise provide in a Supplemental Indenture, interest expense on Bond Credit Facilities drawn upon to purchase but not to retire Bonds, to the extent such interest exceeds the interest otherwise payable on such Bonds, shall not be included in the determination of an Interest Requirement.
"Junior Subordinate Debt" means VRA Debt that is secured by a pledge of revenues, money and other property of VRA expressly made subordinate to the pledge of the Revenues, Infrastructure Revenue Bond Revenues, Funds and Accounts and other property securing the Bonds of all Series set forth in the article titled "Establishment of Trust" in the Master Indenture.
"Local Account" means any Account established pursuant to a Supplemental Series Indenture in a Fund or Account with respect to a Local Government.
"Local Government(s)" means any "local government" (as defined in Section 62.1-199 of the Act) entering into an Agreement and its permitted successors and assigns under such Agreement.
"Local Obligation Payments" means the amounts payable by each Local Government pursuant to the terms of its Local Obligation or Obligations.
"Local Obligation(s)" means the "local obligation" (within the meaning of Section 62.1-199 of the Act) issued or entered into by a Local Government and acquired by the VRA or the Trustee pursuant to the Related Agreement and financed with the proceeds of a Series of Bonds and/or other amounts on deposit in the Related Acquisition Fund.
"Majority Owners" means the Owners of at least 51% of the aggregate principal amount of the Infrastructure Revenue Bonds or the Moral Obligation Bonds Outstanding, as applicable.
A-5
"Master Indenture" means the Master Indenture of Trust dated as of December 1, 2003, between VRA and the Trustee, as the same may be modified, altered, amended and supplemented in accordance with its terms by one or more Supplemental Series Indentures and other Supplemental Indentures.
"Minimum Balance" means the minimum amount, which, if applied as the clause (b)(2) amount in the definition of Projected Revenue Certificate, assuming all other amounts are fixed, would result in Infrastructure Revenue Bond Debt Service Coverage equal to at least the Required Infrastructure Revenue Bond Debt Service Coverage.
"Minimum CRF Reserve Requirement" means an amount equal to the CRF Reserve Requirement or such lesser amount as may be established by VRA pursuant to the Master Indenture.
"Moral Obligation Bonds" means any VRA Debt issued by VRA pursuant to the Master Indenture and identified as "Moral Obligation Bonds" in the Related Supplemental Series Indenture. Moral Obligation Bonds are secured by a pledge of and lien on the Revenues junior and subordinate to the pledge and lien securing the Infrastructure Revenue Bonds. Moral Obligation Bonds are secured by the Capital Reserve Fund.
"Moral Obligation Debt Service Fund" means the Moral Obligation Debt Service Fund established pursuant to the Master Indenture.
"Officer's Certificate" means a certificate signed by a VRA Representative and filed with the Trustee.
"Operating Reserve Fund" means the Operating Reserve Fund established pursuant to the Master Indenture.
"Opinion" or "Opinion of Counsel" means a written opinion of any attorney or firm of attorneys, who or which may be Bond Counsel or counsel for VRA or the Trustee.
"Optional Tender Bonds" means any Bonds issued under the Master Indenture a feature of which is an option on the part of the Owners of such Bonds to tender to VRA, or to the Trustee, any Paying Agent or other fiduciary for such Owners, or to an agent of any of the foregoing, all or a portion of such Bonds for payment or purchase.
"ORF Revenues" means investment earnings on amounts in the Operating Reserve Fund.
"Outstanding," when used in reference to the Bonds and as of a particular date, means all Bonds authenticated and delivered under the Master Indenture except:
(a) Any Bond canceled or required to be canceled by the Trustee at or before such date;
(b) Any Bond in lieu of or in substitution for which another Bond shall have been authenticated and delivered under the Master Indenture;
(c) Any Bond deemed paid under Article XII of the Master Indenture except that any such Bond shall be considered Outstanding until its maturity or redemption date only for the purpose of actually being paid and for purposes of Articles III and IV and Section 6.1 in the Master Indenture (or the corresponding provisions of the Related Supplemental Series Indenture, as the case may be); and

A-6
(d) Any Bond not deemed Outstanding under, but only to the extent provided for in the section titled "Supplemental Indentures Requiring Consent" in the Master Indenture.
"Owner" means the registered owner of any Bond.
"Paying Agent or Paying Agents" means any paying agent(s) for the Bonds (which may include the Trustee) and any successor or successors as paying agent(s) appointed pursuant to the Master Indenture or the provisions of any Supplemental Series Indenture. Unless otherwise provided in a Supplemental Series Indenture, the Trustee shall be the Paying Agent.
"Payment Date" means a date that is an Interest Payment Date or a Principal Payment Date or both.
"Person" means an individual, a corporation, a partnership, an association, a joint stock company, a trust, any unincorporated organization or a government or political subdivision thereof.
"Principal" means (i) with respect to a Capital Appreciation Bond, the Accreted Amount thereof (the difference between the stated amount to be paid at maturity and the Accreted Amount being deemed unearned interest) except when used in connection with the authorization and issuance of Bonds and with the order of priority of payments of Bonds after an Event of Default in which case "principal" means the initial public offering price of the Capital Appreciation Bond (the difference between the Accreted Amount and the initial public offering price being deemed interest) and (ii) with respect to the principal amount of any Current Interest Bond, the principal amount of such Bond payable in satisfaction of an Amortization Requirement, if applicable, or at maturity.
"Principal and Interest Requirements" for any Payment Date or for any period means the sum of the Principal Requirements and the Interest Requirements for such date or such period, respectively.
"Principal Payment Date" means a November 1 upon which the principal amount of any Bond is stated to mature or upon which the principal of any Term Bond is subject to redemption in satisfaction of an Amortization Requirement or such other date or dates as may be provided by the Related Supplemental Series Indenture.
"Principal Requirement" means for any Principal Payment Date, as applied to all Bonds or a portion thereof, the total of the principal regularly scheduled to become due on such Principal Payment Date. Principal payments shall be excluded from the definition of Principal Requirement to the extent that proceeds of any Bonds are held by the Trustee to pay such Principal. Unless VRA shall otherwise provide in a Supplemental Indenture, principal payments on Bond Credit Facilities drawn upon to purchase but not to retire Bonds, to the extent such principal exceeds the principal otherwise payable on such Bonds, shall not be included in the determination of a Principal Requirement.
"Projected Revenue Certificate" means an Officer's Certificate setting forth, as of any particular date:
(a) A schedule of estimated amounts of the following types of Revenues to be available in the then-current and each future Bond Year for the payment of the Principal and Interest Requirements of all of the Bonds and the Administrative Charges:
(i) Scheduled Local Obligation Payments except on Defaulted Local Obligations;

A-7
(ii) Income receivable from the investment of amounts from time to time held in the Infrastructure Revenue Debt Service Reserve Fund and the Capital Reserve Fund;
(iii) Amounts scheduled to be released from the Infrastructure Revenue Debt Service Reserve Fund or the Capital Reserve Fund as a result of the payment at maturity or pursuant to the Amortization Requirements of the Bonds Outstanding and, if applicable, then to be issued; and
(iv) Any other amounts identified as Revenues in the Projected Revenue Certificate and in a Supplemental Indenture, if there is filed with the Trustee written confirmation from each Rating Agency that the inclusion thereof will not result in the withdrawal or reduction of its then-current rating on any of the Bonds Outstanding.
(b) A schedule of estimated amounts of the following sources to be available in the then-current and each future Bond Year for the payment of the Principal and Interest Requirements of the Infrastructure Revenue Bonds.
(i) ORF Revenues;
(ii) Amounts, if any, which are or will be on deposit in the Operating Reserve Fund; and
(iii) Any other revenues or amounts identified in the Projected Revenue Certificate and in a Supplemental Indenture as Infrastructure Revenue Bond Revenues or Fund balances available for the payment of the Principal and Interest Requirements of the Infrastructure Revenue Bonds, if there is filed with the Trustee written confirmation from each Rating Agency that the inclusion thereof will not result in the withdrawal or reduction of its then-current rating on any of the Infrastructure Revenue Bonds Outstanding.
(c) A schedule of the Principal and Interest Requirements and all Administrative Charges scheduled to become due and payable on each Payment Date in the then-current and each future Bond Year with respect to all Bonds Outstanding and, if applicable, then to be issued.
(d) A schedule of the Principal and Interest Requirements scheduled to become due and payable on each Payment Date in the then-current and each future Bond Year with respect to all Infrastructure Revenue Bonds Outstanding and, if applicable, then to be issued.
(e) The percentage obtained by dividing the sum of estimated Revenues and Infrastructure Revenue Bond Revenues set forth in clauses (a) and (b)(i) and (iii) for each of the then-current and future Bond Years by the scheduled Principal and Interest Requirements and Administrative Charges set forth in clause (c) for the same Bond Year ("Revenue Coverage").
(f) The percentage obtained by dividing the sum of estimated Revenues and Infrastructure Revenue Bond Revenues set forth in clauses (a) and (b)(i) and (iii) for each of the then-current and future Bond Years by the scheduled Principal and Interest Requirements set forth in clause (d) for the same Bond Year ("Infrastructure Revenue Bond Revenue Coverage").
(g) The percentage obtained by dividing the sum of estimated Revenues and Infrastructure Revenue Bond Revenues set forth in clauses (a) and (b)(i) and (iii) and the Fund balances set forth in clause (b)(ii) and (iii) for each of the then-current and future Bond Years by the scheduled Principal and

A-8
Interest Requirements set forth in clause (d) for the same Bond Year ("Infrastructure Revenue Bond Debt Service Coverage").
(h) In projecting the foregoing, VRA shall make the following assumptions: (i) Revenues set forth in clause (a) that are scheduled to be retained in the Revenue Fund pursuant to paragraph "SEVENTH" in the section titled "Revenue Fund" in the Master Indenture shall be reflected as Revenues only with respect to the Payment Dates on which the Trustee is to be directed to apply such retained amounts; (ii) invested funds shall yield an investment return equal to the actual return at the time of the projection net of any Rebate Amounts to be paid therefrom and shall be invested until such time as they are to be applied to the purpose for which they are accumulated; (iii) no Local Obligations will be purchased or acquired by VRA after the date of the Projected Revenue Certificate; and (iv) Administrative Charges shall be collected for the remaining term of each Local Obligation at the rate or rates in effect at the time of the calculation. VRA must use a special set of assumptions set forth in the Master Indenture in preparing a Projected Revenue Certificate if any of the Bonds or Local Obligations to be covered thereby are Optional Tender Bonds and/or Variable Rate Bonds.
"Purchase Price" means the purchase price established in any Supplemental Series Indenture for Optional Tender Bonds as the purchase price to be paid for such Bonds upon an optional or mandatory tender of all or a portion of such Bonds.
"Rating Agency" means, with respect to any Bonds Outstanding, any nationally recognized credit rating agency if and for so long as such rating agency, at the request of VRA, maintains a rating on such Bonds.
"Rebate Amount" means the liability of VRA and/or the Related Local Governments under Section 148 of the Code (including any "yield reduction payments") with respect to any Series of Bonds as may be calculated or specified (including with such reserves or error margin as VRA may deem appropriate) in accordance with the Related Supplemental Series Indenture or the Related Tax Regulatory Agreement.
"Rebate Fund" means the Rebate Fund for a Series of Bonds to be established by the Related Supplemental Series Indenture.
"Refunding Bonds" shall have the meaning set forth under the heading "Issuance of Bonds" below.
"Reimbursement Fund" means the Reimbursement Fund Related to a Series of Bonds that may be established by the Related Supplemental Series Indenture.
"Reimbursement Obligations" means any reimbursement or payment obligations of VRA for which moneys in the Reimbursement Fund are pledged or payable pursuant to the provisions of the Master Indenture or any Supplemental Series Indenture.
"Related," as the context may require, means (i) when used with respect to any Cost of Issuance Fund, Acquisition Fund, Rebate Fund or Reimbursement Fund, or any Account or subaccount within any such Fund, the Fund, Account or subaccount so designated and established by the Related Supplemental Series Indenture authorizing a particular Series of Bonds, (ii) when used with respect to a Supplemental Series Indenture, the Supplemental Series Indenture authorizing a particular Series of Bonds, (iii) when used with respect to Local Obligations, the Local Obligations acquired or entered into with respect to a particular Series of Bonds, and (iv) when used with respect to a Bond Credit Facility or Reimbursement

A-9
Obligation, the Bond Credit Facility securing a particular Series of Bonds and the Reimbursement Obligation entered into in connection therewith.
"Required Revenue Coverage" means 100% or such higher percentage as may be specified in a Supplemental Series Indenture.
"Required Infrastructure Revenue Bond Debt Service Coverage" means 100% or such higher percentage as may be specified in a Supplemental Series Indenture.
"Required Infrastructure Revenue Bond Revenue Coverage" means 100% or such higher percentage as may be specified in a Supplemental Series Indenture.
"Reserve Determination Date" means (i) the tenth day after each Interest Payment Date, or, if such day is not a Business Day, on the first Business Day thereafter or (ii) any other date set forth in a Supplemental Series Indenture or an Officer's Certificate for the valuation of the Infrastructure Revenue Debt Service Reserve Fund and/or the Capital Reserve Fund.
"Revenue Coverage" shall have the meaning assigned to it in the definition of Projected Revenue Certificate.
"Revenue Fund" means the Revenue Fund established by the Master Indenture.
"Revenues" means (i) the Local Obligation Payments, (ii) any proceeds of any Series of Bonds originally deposited with the Trustee for the payment of accrued interest thereon, (iii) investment earnings on amounts in the Revenue Fund, the Infrastructure Revenue Debt Service Fund, the Infrastructure Revenue Debt Service Reserve Fund, the Moral Obligation Debt Service Fund and the Capital Reserve Fund, (iv) amounts released from the Infrastructure Revenue Debt Service Reserve Fund or the Capital Reserve Fund as a result of the payment at maturity, refunding, redemption or defeasance of Bonds and (v) any or all other revenues that may be identified as Revenues pursuant to a Supplemental Indenture; provided, however, that the following shall not be included in Revenues unless specifically authorized to be so included in a Supplemental Indenture: (i) Infrastructure Revenue Bond Revenues; (ii) any amounts in, or earnings on, a Rebate Fund; and (iii) any payments made by VRA or the Commonwealth to replenish the Capital Reserve Fund under Section 62.1-215 of the Act.
"Serial Bonds" means the Bonds of a Series that are stated to mature in semiannual or annual installments and that are so designated in the Related Supplemental Series Indenture.
"Series" means all of the Bonds of a particular series authenticated and delivered pursuant to the Master Indenture and the Related Supplemental Series Indenture and identified as such pursuant to such Supplemental Series Indenture, and any Bonds of such Series thereafter authenticated and delivered in lieu of or in substitution for such Bonds pursuant to the Master Indenture and such Supplemental Series Indenture, regardless of variations in lien status, maturity, interest rate, sinking fund installments or other provisions. A Series may be a combination of Infrastructure Revenue Bonds and Moral Obligation Bonds or consist entirely of Infrastructure Revenue Bonds or Moral Obligation Bonds, all as shall be specified in the Related Supplemental Series Indenture.
"Supplemental Indenture" means any indenture supplementary to or amendatory of the Master Indenture or any Supplemental Indenture or Supplemental Series Indenture now or hereafter duly executed and delivered in accordance with the provisions of the Master Indenture, including a Supplemental Series Indenture.

A-10
"Supplemental Series Indenture" means a Supplemental Indenture providing for the issuance of a Series of Bonds, as such Supplemental Series Indenture may be modified, altered, amended and supplemented by a Supplemental Indenture in accordance with the provisions of the Master Indenture.
"Tax Regulatory Agreement" means, with respect to any Series of Bonds, the Tax Certificate and Regulatory Agreement, dated the date of the issuance of the Related Series of Bonds, between VRA and the Trustee, as the same may be modified, altered, amended or supplemented pursuant to its terms.
"Term Bonds" means all or some of the Bonds of a Series, other than Serial Bonds, that shall be stated to mature on one or more dates and that are so designated in the Related Supplemental Series Indenture.
"Trustee" means U.S. Bank National Association, a national banking association, as successor trustee to SunTrust Bank, and any successors serving in the same capacity under the Master Indenture.
"Variable Rate Bonds" means any Bonds the interest rate on which is not established, at the time such Bonds are issued, at a single numerical rate for the entire term of the Bonds.
"Virginia Code" means the Code of Virginia of 1950, as amended.
"VRA" means the Virginia Resources Authority, a public body corporate and a political subdivision of the Commonwealth.
"VRA Debt" means "bonds" of VRA as defined in Section 62.1-199 of the Act.
"VRA Representative" means any of the Chairman, Vice Chairman or Executive Director of VRA and any other member, officer or employee of VRA authorized by resolution of VRA's Board of Directors to perform the act or sign the document in question.
Establishment of Trusts
Security for Infrastructure Revenue Bonds. (a) In order to provide for the payment of the principal of and the premium, if any, and interest on the Infrastructure Revenue Bonds of all Series issued under the Master Indenture, and to secure the performance of all of the obligations of VRA with respect to the Infrastructure Revenue Bonds, the Master Indenture and the Supplemental Series Indentures, VRA pledges and grants to the Trustee a security interest in the following:
(i) All of the Revenues and the Infrastructure Revenue Bond Revenues;
(ii) The Local Obligations and Agreements;
(iii) The amounts, money, investments and Infrastructure Revenue DSRF Credit Facilities, if any, held by the Trustee and the Paying Agent pursuant to the terms of the Master Indenture in the Revenue Fund, the Infrastructure Revenue Debt Service Fund, the Infrastructure Revenue Debt Service Reserve Fund, and the Operating Reserve Fund; and
(iv) All other property of any kind mortgaged, pledged or hypothecated to provide for the payment of or to secure the Infrastructure Revenue Bonds of all Series by VRA or by anyone on its behalf and with its written consent at any time as and for additional security under the Master Indenture and the Supplemental Series Indentures in favor of the Trustee, which is

A-11
authorized to receive all such property at any time and to hold and apply it subject to the terms of the Master Indenture and the Supplemental Series Indentures.
Any of the Revenues, Infrastructure Revenue Bond Debt Service Coverage, Funds and Accounts or other property described above that is received or held by the Trustee is to be held in trust for the equal and proportionate benefit and security of the Owners from time to time of the Infrastructure Revenue Bonds of all Series, except as otherwise provided in, and subject to its application in accordance with the terms of, the Master Indenture and the Supplemental Series Indentures.
Security for Moral Obligation Bonds. In order to provide for the payment of the principal of and the premium, if any, and interest on the Moral Obligation Bonds of all Series issued under the Master Indenture, and to secure the performance of all of the obligations of VRA with respect to the Moral Obligation Bonds, the Master Indenture and the Supplemental Series Indentures, VRA pledges and grants to the Trustee a security interest in the following:
(a) All of the Revenues;
(b) The Local Obligations and Agreements;
(c) The amounts, money, investments and CRF Credit Facilities, if any, held by the Trustee and the Paying Agent pursuant to the terms of the Master Indenture in the Revenue Fund, the Moral Obligation Debt Service Fund and the Capital Reserve Fund; and
(d) All other property of any kind mortgaged, pledged or hypothecated to provide for the payment of or to secure the Moral Obligation Bonds of all Series by VRA or by anyone on its behalf and with its written consent at any time as and for additional security under the Master Indenture and the Supplemental Series Indentures in favor of the Trustee, which is authorized to receive all such property at any time and to hold and apply it subject to the terms of the Master Indenture and the Supplemental Series Indentures.
VRA's pledge and grant of the security interest in the Revenues and the Local Obligations and Agreements to secure the Moral Obligation Bonds is in all respects junior and subordinate to the pledge and grant securing the Infrastructure Revenue Bonds. The Infrastructure Revenue Bond Revenues shall not secure the Moral Obligation Bonds unless Infrastructure Revenue Bond Revenues are expressly included in Revenues pursuant to a Supplemental Indenture. Notwithstanding the foregoing, however, only the Moral Obligation Bonds shall be secured and paid from amounts in the Moral Obligation Debt Service Fund and the Capital Reserve Fund. Any of the Revenues, Funds and Accounts, or other property described above that is received or held by the Trustee is to be held in trust for the equal and proportionate benefit and security of the Owners from time to time of the Moral Obligation Bonds of all Series, except as otherwise provided in, and subject to its application in accordance with the terms of, the Master Indenture and the Supplemental Series Indentures.
Bond Credit Facility. Any Bond Credit Facility which is given to secure some, but not all, of the Bonds, together with money drawn or paid under it, shall be held by the Trustee solely as security for the Bonds to which such Bond Credit Facility is Related. Neither such Bond Credit Facility nor any money drawn or paid under it will secure the payment of any other Bonds.
Issuance of Bonds
All Infrastructure Revenue Bonds of each Series issued and to be issued under the Master Indenture, respectively, are and are to be, to the extent provided in and subject to the Master Indenture

A-12
and Related Supplemental Series Indenture, equally and ratably secured by the Master Indenture and the Related Supplemental Series Indenture without preference, priority or distinction on account of the actual time or times of the authentication or delivery or maturity or redemption of the Infrastructure Revenue Bonds of such Series, or any of them. In addition, all Moral Obligation Bonds of each Series issued and to be issued under the Master Indenture, respectively, are and are to be, to the extent provided in and subject to the Master Indenture and the Related Supplemental Series Indenture, equally and ratably secured by the Master Indenture and the Related Supplemental Series Indenture without preference, priority or distinction on account of the actual time or times of the authentication or delivery or maturity or redemption of the Moral Obligation Bonds of such Series, or any of them.
In connection with the issuance of additional Bonds, VRA is required to file, among other things, the following documents with the Trustee:
(a) An original executed counterpart of the Related Supplemental Series Indenture which may include provisions (i) authorizing the issuance, fixing the principal amount and setting forth the details of the Bonds of the Series then to be issued, including identifying which Bonds within the Series are Infrastructure Revenue Bonds and which are Moral Obligation Bonds, the interest rate or rates and the manner in which the Bonds are to bear interest, the Principal and Interest Payment Dates of the Bonds, the purposes for which the Bonds are being issued, the date and the manner of numbering the Bonds, the series designation, the denominations, the maturity dates and amounts, the Amortization Requirements or the manner for determining such Amortization Requirements, and any other provisions for redemption before maturity; (ii) for Bond Credit Facilities for the Series and for Local Accounts and other Accounts and subaccounts to be established with respect to the Bonds within the Funds and Accounts established under the Master Indenture; (iii) for the application of the proceeds of the Bonds of the Series; (iv) necessary or expedient for the issuance of Bonds constituting Variable Rate Bonds or Optional Tender Bonds, including without limitation, tender and remarketing provisions, liquidity facility provisions and provisions for establishing the variable rate and changing interest rate modes; (v) for the amount, if any, to be deposited into the Infrastructure Revenue Debt Service Reserve Fund, which will be an amount at least sufficient to cause to be on deposit in the Infrastructure Revenue Debt Service Reserve Fund the Infrastructure Revenue DSRF Reserve Requirement for the Outstanding Infrastructure Revenue Bonds and the Infrastructure Revenue Bonds of the Series then to be issued; (vi) for the amount, if any, to be deposited into the Capital Reserve Fund, which will be an amount at least sufficient to cause to be on deposit in the Capital Reserve Fund the CRF Reserve Requirement for the Outstanding Moral Obligation Bonds and the Moral Obligation Bonds of the Series then to be issued; and (vii) for such other matters as VRA may deem appropriate;
(b) A certified copy of each resolution adopted by VRA's Board of Directors authorizing the execution and delivery of the Related Supplemental Series Indenture and any Related Reimbursement Obligation and the issuance, sale, execution and delivery of the Series of Bonds then to be issued;
(c) Original executed counterparts of the Related Tax Regulatory Agreement, any Related Bond Credit Facility and any Related Reimbursement Obligation;
(d) A Projected Revenue Certificate, dated the date of delivery of the Bonds of the Series then to be issued, giving effect to the issuance of such Series of Bonds and showing for each Bond Year (i) Revenue Coverage equal to at least the Required Revenue Coverage, (ii) Infrastructure Revenue Bond Revenues equal to at least Required Infrastructure Revenue Bond Revenues and (iii) Infrastructure Revenue Bond Revenue Coverage equal to at least the Required Infrastructure Revenue Bond Revenue Coverage;

A-13
(e) Evidence satisfactory to the Trustee that the amount on deposit in the Operating Reserve Fund is at least equal to the Minimum Balance as of the date of delivery of the Bonds of the Series then to be issued;
(f) If the Bonds of the Series then to be issued are to be issued to refund Bonds issued and outstanding under the Master Indenture ("Refunding Bonds"):
(i) Evidence satisfactory to the Trustee that VRA has made provision as required by the Master Indenture for the payment or redemption of all Bonds to be refunded; and
(ii) A written determination by a knowledgeable professional, including VRA's financial advisor but excluding any employee of VRA, or by a firm of independent certified public accountants that the proceeds (excluding accrued interest) of the Refunding Bonds, together with any other money to be deposited for such purpose with the Trustee in the Related Escrow Fund or otherwise upon the issuance of the Refunding Bonds and the investment income to be earned on funds held by the Trustee for the payment or redemption of Bonds to be refunded, will be sufficient to pay, whether upon redemption or at maturity, the principal of and premium, if any, and interest on the Bonds to be refunded and the estimated expenses incident to the refunding.
(g) An opinion of Bond Counsel to the effect that the Bonds of the Series then to be issued have been duly authorized, that all conditions precedent to the issuance thereof have been fulfilled and that such Bonds are valid and legally binding limited obligations of VRA, and are secured by the Master Indenture and the Related Supplemental Series Indenture to the extent provided;
(h) An Officer's Certificate, dated the date of delivery of the Bonds of the Series then to be issued, to the effect that to the best of the knowledge of the signatory, upon and immediately following such delivery, no Event of Default under the Master Indenture or any Supplemental Series Indenture with respect to any Series of Bonds Outstanding will have occurred and be continuing;
(i) A written order and authorization to the Trustee on behalf of VRA, signed by a VRA Representative, to authenticate and deliver the Bonds of the Series then to be issued to or upon the order of the purchaser or purchasers therein identified upon payment to the Trustee of the purchase price (including accrued interest, if any) of such Series of Bonds; and
(j) Any additional document or instrument specified in the Related Supplemental Series Indenture.
Modification of Certain Definitions. (a) In the case of the following described types of Bonds, the definition of the term "Principal and Interest Requirements" for the purposes of (i) preparing and delivering a Projected Revenue Certificate and (ii) establishing the sizes of the Infrastructure Revenue DSRF Requirement, the CRF Reserve Requirement and the Minimum CRF Reserve Requirement shall be modified as follows:
(A) Optional Tender Bonds. (1) If any of the Outstanding Bonds or additional Bonds of the Series then to be issued constitute Optional Tender Bonds, then the options of the Owners of such Bonds to tender the same for payment prior to their stated maturity or maturities shall be disregarded, (2) if such Bonds also constitute Variable Rate Bonds, VRA shall also make the adjustments described in subsection (a)(ii)(B) below, and (3) any obligation VRA may have, other than its obligation on such additional Bonds (which need not be uniform as

A-14
to all Owners thereof), to reimburse any Person for its having extended a Bond Credit Facility shall be disregarded.
(B) Variable Rate Bonds. If any of the Outstanding Bonds or Bonds of the Series then to be issued constitute Variable Rate Bonds, then the interest rate used in the above-described computations shall be the greater of (i) the interest rate on any additional Bonds issued as Variable Rate Bonds for the first period of calculation of such interest and (ii) the weighted average interest rate at which VRA could reasonably expect to have borrowed on the date of issuance of such Bonds by issuing such Bonds with a fixed rate or rates of interest. VRA's reasonable expectation shall be established by an Officer's Certificate and a letter of a knowledgeable professional, including VRA's financial advisor, confirming the interest rate expectation as reasonable. The conversion of Bonds constituting Variable Rate Bonds to bear interest at a fixed rate or rates or vice-versa, in accordance with their terms, shall not constitute a new issuance of Bonds under the Master Indenture.
(b) The requirements and provisions of the Master Indenture governing Projected Revenue Certificates shall also be modified as set forth in subsection (a) above as may be necessary or appropriate for Local Obligations that are or will be Related to Optional Tender Bonds or Variable Rate Bonds.
Junior Subordinate Debt. VRA may authorize and issue Junior Subordinate Debt for any lawful purpose payable from the revenues, money and other property pledged under the Master Indenture subject and subordinate to the payment of any Bonds or from securing any Junior Subordinate Debt and its payment by a lien and pledge of the revenues, money and other property pledged under the Master Indenture junior and inferior to the lien and pledge granted by the Master Indenture for the payment and security of Bonds. The resolutions and documents providing for the issuance or incurrence of any Junior Subordinate Debt shall provide that no remedies upon an event of default thereunder may be exercised so long as any Infrastructure Revenue Bonds or Moral Obligation Bonds remain Outstanding.
Establishment of Funds and Accounts
The following funds are established under the Master Indenture as follows:
Establishment and Custody of Pledged Funds for All Series of Bonds. With respect to and for the benefit of all Bonds there is, under the Master Indenture, established to be held by the Trustee the Revenue Fund. The Master Indenture provides that, the Revenue Fund is pledged, subject to the limitations within the Master Indenture, as security for all Bonds issued and Outstanding under the Master Indenture. With respect to and for the benefit of the Infrastructure Revenue Bonds of each Series there is established to be held by the Trustee the Infrastructure Revenue Debt Service Fund, the Infrastructure Revenue Debt Service Reserve Fund and the Operating Reserve Fund. These three Funds are pledged as security for all Infrastructure Revenue Bonds issued and Outstanding under the Master Indenture. With respect to and for the benefit of the Moral Obligation Bonds of each Series there is established to be held by the Trustee the Moral Obligation Debt Service Fund and the Capital Reserve Fund. The Master Indenture provides that both of these Funds are pledged, subject to the limitations hereof, as security for all Moral Obligation Bonds issued and Outstanding under the Master Indenture.

A-15
Establishment and Custody of Non-Pledged Funds for Each Series of Bonds. Unless otherwise provided in the Related Supplemental Series Indenture, the following Funds are to be established in the Related Supplemental Series Indenture and held by or at the direction of VRA with respect to each Series of Bonds:
(1) Cost of Issuance Fund; (2) Acquisition Fund; and (3) Rebate Fund.
Unless otherwise provided in the Related Supplemental Series Indenture, none of the Cost of Issuance Fund, the Acquisition Fund or the Rebate Fund is pledged as security for payment of any Bonds of any Series.
Establishment and Custody of Certain Special Funds. VRA may establish with the Trustee or an escrow agent satisfactory to the Trustee in connection with the issuance of any Series of Refunding Bonds an Escrow Fund to provide for the application and investment of the portion of the proceeds of such Series to be used to refund the refunded Bonds. Such Escrow Fund shall be established under or in accordance with the Related Supplemental Series Indenture. VRA may establish with the Trustee in connection with the incurrence of any Reimbursement Obligation a Reimbursement Fund. Amounts held for the credit of any Reimbursement Fund shall be paid out by the Trustee as necessary to enable VRA to meet its obligations constituting Reimbursement Obligations. Amounts held for the credit of a Reimbursement Fund may be pledged to the payment of any Related Reimbursement Obligation incurred by VRA.
Operation of Revenue Fund and Pledged Funds
Nature of Security Afforded by Certain Funds. All Infrastructure Revenue Bonds of any Series issued and to be issued under the Master Indenture are, and are to be, to the extent provided in the Master Indenture, equally and ratably secured by the Revenue Fund, the Infrastructure Revenue Debt Service Fund, the Infrastructure Revenue Debt Service Reserve Fund and the Operating Reserve Fund. All Moral Obligation Bonds of any Series issued and to be issued under the Master Indenture are, and are to be, to the extent provided in the Master Indenture, equally and ratably secured by the Revenue Fund, the Moral Obligation Debt Service Fund and the Capital Reserve Fund.
Revenue Fund. The Trustee shall promptly deposit and hold in the Revenue Fund the Local Obligation Payments and any other amounts transferred to the Revenue Fund from other Funds and Accounts or other sources as provided under the Master Indenture or the Supplemental Series Indentures. On or before each Payment Date on any Series of the Bonds, the Trustee shall make transfers from the Revenue Fund in the amounts and in the order of priority set forth below:
(a) To the Infrastructure Revenue Debt Service Fund the amount, if any, required so that the balance therein shall equal the amount of principal, if any, and interest due on the Payment Date on the Infrastructure Revenue Bonds; provided that for the purpose of computing the amount to be paid to the Infrastructure Revenue Debt Service Fund there shall be deducted the amount, if any, set aside in the Infrastructure Revenue Debt Service Fund which was deposited therein as accrued or capitalized interest and any amounts transferred to the Infrastructure Revenue Debt Service Fund as provided in the section titled "Infrastructure Revenue Debt Service Fund" in the Master Indenture, together in each case with investment earnings thereon;
(b) To the Infrastructure Revenue Debt Service Reserve Fund the amount necessary to cause the balance therein to be equal to the Infrastructure Revenue DSRF Requirement, if any (which shall

A-16
include the reimbursement of an Infrastructure Revenue DSRF Credit Provider for any drawings on an Infrastructure Revenue DSRF Credit Facility and the payment of any interest, penalties or fees assessed by the Infrastructure Revenue DSRF Credit Provider);
(c) To VRA the amount equal to the sum of the Administrative Charges as confirmed in an Officer's Certificate;
(d) To the Rebate Funds the amounts necessary to provide for the payment of any Rebate Amounts with respect to any Series of Bonds as confirmed in an Officer's Certificate;
(e) To the Moral Obligation Debt Service Fund the amount, if any, required so that the balance therein shall equal the amount of principal, if any, and interest due on the Payment Date on the Moral Obligation Bonds; provided that for the purpose of computing the amount to be paid to the Moral Obligation Debt Service Fund there shall be deducted the amount, if any, set aside in the Moral Obligation Debt Service Fund which was deposited therein as accrued or capitalized interest and any amounts transferred to the Moral Obligation Debt Service Fund as provided in the Master Indenture, together in each case with investment earnings thereon;
(f) To the Capital Reserve Fund to the extent necessary to cause the balance therein to be equal to the CRF Reserve Requirement (which shall include the reimbursement of a CRF Credit Provider for any drawings on a CRF Credit Facility and the payment of any interest, penalties or fees assessed by the CRF Credit Provider); and
(g) To the Operating Reserve Fund, any balance remaining in the Revenue Fund, unless and to the extent that the remaining balance is not necessary to pay future Principal and Interest Requirements on the Bonds at the times and in the amounts provided in (i) a Supplemental Series Indenture and confirmed in an Officer's Certificate or (ii) an Officer's Certificate.
The Trustee shall apply any amounts retained in the Revenue Fund as described in paragraph (g) above to pay the Principal and Interest Requirements on the Bonds at the times and in the amounts provided in the applicable Supplemental Series Indenture or Officer's Certificate as the case may be.
In the case of Bonds of a Series secured by a Bond Credit Facility, amounts on deposit in the Revenue Fund may be transferred to the Infrastructure Revenue Debt Service Fund or Moral Obligation Debt Service Fund, as the case may be, the Related Reimbursement Fund or elsewhere as provided in the Related Supplemental Series Indenture to reimburse the Bond Credit Provider for amounts drawn under the Bond Credit Facility to pay the principal of and premium, if any, and interest on such Bonds.
Infrastructure Revenue Debt Service Fund. The Trustee shall promptly deposit the following amounts in the Infrastructure Revenue Debt Service Fund:
(a) The amount, if any, of the proceeds of the Infrastructure Revenue Bonds of any Series, required by the Related Supplemental Series Indenture to be deposited in the Infrastructure Revenue Debt Service Fund in respect of accrued and/or capitalized interest;
(b) All amounts required to be transferred to the Infrastructure Revenue Debt Service Fund from the Revenue Fund;
(c) Any amounts required to be transferred to the Infrastructure Revenue Debt Service Fund from the Infrastructure Revenue Debt Service Reserve Fund and the Operating Reserve Fund, as provided under the Master Indenture; and

A-17
(d) Any other amounts required to be paid to the Infrastructure Revenue Debt Service Fund or otherwise made available for deposit therein by any Local Government or VRA, including amounts made available pursuant to the Related Supplemental Series Indenture.
The Trustee shall pay out of the Infrastructure Revenue Debt Service Fund to the Paying Agents for the Infrastructure Revenue Bonds (i) on each Interest Payment Date, the amount required for the payment of interest on the Infrastructure Revenue Bonds then due and (ii) on any redemption date, the amount required for the payment of accrued interest on the Infrastructure Revenue Bonds to be redeemed unless the payment of such accrued interest shall be otherwise provided for, and such amounts shall be applied by the Paying Agents to such payment. The Trustee shall also pay out of the Infrastructure Revenue Debt Service Fund the accrued interest included in the purchase price of the Infrastructure Revenue Bonds of any Series purchased for retirement pursuant to the Master Indenture. The Trustee shall pay out of the Infrastructure Revenue Debt Service Fund to the Paying Agents for the Bonds on each Principal Payment Date and redemption date for the Infrastructure Revenue Bonds, the amounts then required for the payment of such principal or redemption price, and such amounts shall be applied by the Paying Agents to such payments.
Infrastructure Revenue Debt Service Reserve Fund. Except as specifically provided below, the amount in the Infrastructure Revenue Debt Service Reserve Fund, if any, shall be used solely to cure deficiencies in the amount on deposit in the Infrastructure Revenue Debt Service Fund. If there is a deficiency in the amount on deposit in the Infrastructure Revenue Debt Service Fund to pay the principal of and interest on the Infrastructure Revenue Bonds when due, then the Trustee shall transfer the amount of the deficiency from the amount, if any, on deposit in the Infrastructure Revenue Debt Service Reserve Fund to the Infrastructure Revenue Debt Service Fund. The Trustee immediately shall notify VRA of the transfer. Notwithstanding the foregoing, no such transfer from the Infrastructure Revenue Debt Service Reserve Fund shall relieve a Local Government of its obligation to make the payments due on its Local Obligations or under the Related Agreement.
On each Reserve Determination Date, the Trustee shall determine if the balance on deposit in the Infrastructure Revenue Debt Service Reserve Fund is at least equal to the Infrastructure Revenue DSRF Requirement. In making each such determination, investments on deposit in the Infrastructure Revenue Debt Service Reserve Fund shall be valued as provided in the Master Indenture. If on any Reserve Determination Date the amount in the Infrastructure Revenue Debt Service Reserve Fund is less than the Infrastructure Revenue DSRF Requirement, the Trustee shall immediately notify VRA of such fact and the amount of the deficiency. VRA may deposit its own funds directly into the Infrastructure Revenue Debt Service Reserve Fund to cure any deficiency in it.
Any interest earned from the investment of money in the Infrastructure Revenue Debt Service Reserve Fund shall be transferred upon receipt to the Revenue Fund and/or to pay any Rebate Amounts in accordance with the Supplemental Series Indentures and Tax Regulatory Agreements (as confirmed in an Officer's Certificate) to the extent that such transfer will not cause the balance in the Infrastructure Revenue Debt Service Reserve Fund to be less than the Infrastructure Revenue DSRF Requirement. If on any Reserve Determination Date there exists a surplus in the Infrastructure Revenue Debt Service Reserve Fund, the Trustee shall transfer such surplus to the Revenue Fund and/or use it to pay any Rebate Amounts in accordance with the Supplemental Series Indentures and Tax Regulatory Agreements (as confirmed in an Officer's Certificate); provided, however, that if on any Reserve Determination Date there exists or will exist a surplus in the Infrastructure Revenue Debt Service Reserve Fund as the result of the payment at maturity, redemption or defeasance of a portion of the Bonds on or as of such Reserve Determination Date, then the Trustee is authorized to apply the surplus as specified in (i) a Supplemental Series Indenture (as confirmed in an Officer's Certificate) or (ii) an Officer's Certificate.

A-18
In lieu of maintaining and depositing money or securities in the Infrastructure Revenue Debt Service Reserve Fund, VRA may deposit with the Trustee an Infrastructure Revenue DSRF Credit Facility in an amount equal to all or a portion of the Infrastructure Revenue DSRF Requirement. Any Infrastructure Revenue DSRF Credit Facility will permit the Trustee to draw or obtain under it for deposit in the Infrastructure Revenue Debt Service Reserve Fund amounts that, when combined with the other amounts in the Infrastructure Revenue Debt Service Reserve Fund, are not less than the Infrastructure Revenue DSRF Requirement.
The Trustee will make a drawing on or otherwise obtain funds under the Infrastructure Revenue DSRF Credit Facility before its expiration or termination (i) whenever money is required for the purposes for which Infrastructure Revenue Debt Service Reserve Fund money may be applied and (ii) unless such Infrastructure Revenue DSRF Credit Facility has been extended or a qualified replacement for it delivered to the Trustee, in the event VRA has not deposited immediately available funds equal to the Infrastructure Revenue DSRF Requirement at least two Business Days preceding the expiration or termination of the Infrastructure Revenue DSRF Credit Facility.
If VRA provides the Trustee with an Infrastructure Revenue DSRF Credit Facility as provided in this subsection, the Trustee will transfer the corresponding amount of funds then on deposit in the Infrastructure Revenue Debt Service Reserve Fund to VRA, provided VRA delivers to the Trustee (i) an Opinion of Bond Counsel that such transfer of funds will not adversely affect the exclusion from gross income for purposes of federal income taxation of interest on any Bonds the interest on which was excludable on the date of their issuance and (ii) VRA covenants to comply with any directions or restrictions contained in such opinion concerning the use of such funds.
Moral Obligation Debt Service Fund. The Trustee shall promptly deposit the following amounts in the Moral Obligation Debt Service Fund:
(a) The amount, if any, of the proceeds of the Moral Obligation Bonds of any Series, required by the Related Supplemental Series Indenture to be deposited in the Moral Obligation Debt Service Fund in respect of accrued and/or capitalized interest;
(b) All amounts required to be transferred to the Moral Obligation Debt Service Fund from the Revenue Fund;
(c) Any amounts required to be transferred to the Moral Obligation Debt Service Fund from the Capital Reserve Fund, as provided under the Master Indenture; and
(d) Any other amounts required to be paid to the Moral Obligation Debt Service Fund or otherwise made available for deposit therein by any Local Government or VRA, including amounts made available pursuant to the Related Supplemental Series Indenture.
The Trustee shall pay out of the Moral Obligation Debt Service Fund to the Paying Agents for the Moral Obligation Bonds (i) on each Interest Payment Date, the amount required for the payment of interest on the Moral Obligation Bonds then due and (ii) on any redemption date, the amount required for the payment of accrued interest on the Bonds to be redeemed unless the payment of such accrued interest shall be otherwise provided for, and such amounts shall be applied by the Paying Agents to such payment. The Trustee shall also pay out of the Moral Obligation Debt Service Fund the accrued interest included in the purchase price of the Moral Obligation Bonds of any Series purchased for retirement pursuant to the Master Indenture.

A-19
The Trustee shall pay out of the Moral Obligation Debt Service Fund to the Paying Agents for the Bonds on each Principal Payment Date and redemption date for the Moral Obligation Bonds, the amounts then required for the payment of such principal or redemption price, and such amounts shall be applied by the Paying Agents to such payments.
Capital Reserve Fund. The Capital Reserve Fund shall be used solely to cure deficiencies in the amount on deposit in the Moral Obligation Debt Service Fund. If there is a deficiency in the amount on deposit in the Moral Obligation Debt Service Fund to pay the principal of and interest on the Moral Obligation Bonds when due, then the Trustee shall transfer the amount of the deficiency from the amount, if any, on deposit in the Capital Reserve Fund to the Moral Obligation Debt Service Fund. The Trustee immediately shall notify VRA of the transfer. Notwithstanding the foregoing, no such transfer from the Capital Reserve Fund shall relieve a Local Government of its obligation to make the payments due on its Local Obligations or under the Related Agreement.
On each Reserve Determination Date, the Trustee shall determine if the balance on deposit in the Capital Reserve Fund is at least equal to the CRF Reserve Requirement and the Minimum CRF Reserve Requirement. Unless and until VRA satisfies the requirements of the section titled "Release of Moral Obligations" in the Master Indenture, the CRF Reserve Requirement and the Minimum CRF Reserve Requirement shall be equal. In making each such determination, investments on deposit in the Capital Reserve Fund shall be valued as provided in the Master Indenture. If on any Reserve Determination Date the amount in the Capital Reserve Fund is less than the CRF Reserve Requirement or the Minimum CRF Reserve Requirement, the Trustee shall immediately notify VRA of such fact and the amount of the deficiency.
If any deficiency below the Minimum CRF Reserve Requirement shall continue to exist on or before December 1 of the year in which the deficiency occurs, VRA's Chairman shall under Section 62.1-215 of the Act make and deliver to the Governor and the Secretary of Administration of the Commonwealth a certificate setting forth the amount of such deficiency. Notwithstanding anything to the contrary contained herein, in determining whether such deficiency continues to exist on a December 1, the Chairman of VRA shall not take into account any deficiency resulting solely from the valuation by the Trustee of the investments in the Capital Reserve Fund (as opposed to a transfer therefrom to the Moral Obligation Debt Service Fund due to a default on a Local Obligation).
VRA may deposit its own funds directly into the Capital Reserve Fund to cure any deficiency in it.
VRA and the Trustee shall deposit directly into the Capital Reserve Fund any payments made by the Commonwealth pursuant to an appropriation by the General Assembly of the Commonwealth under Section 62.1-215 of the Act to replenish any deficiency below the Minimum CRF Reserve Requirement in the Capital Reserve Fund.
Any interest earned in the investment of money in the Capital Reserve Fund shall be transferred upon receipt to the Revenue Fund and/or to pay any Rebate Amounts in accordance with the Supplemental Series Indentures and Tax Regulatory Agreements (as confirmed in an Officer's Certificate) to the extent that such transfer will not cause the balance in the Capital Reserve Fund to be less than the CRF Reserve Requirement. If on any Reserve Determination Date there exists a surplus in the Capital Reserve Fund, the Trustee shall transfer the surplus to the Revenue Fund and/or use it to pay any Rebate Amounts in accordance with the Supplemental Series Indentures and Tax Regulatory Agreements (as confirmed in an Officer's Certificate); provided, however, that if on any Reserve Determination Date there exists or will exist a surplus in the Capital Reserve Fund as the result of the payment at maturity, redemption or defeasance of a portion of the Moral Obligation Bonds on or as of such Reserve
A-20
Determination Date, then the Trustee is authorized to apply the surplus as specified in (i) a Supplemental Series Indenture (as confirmed in an Officer's Certificate) or (ii) an Officer's Certificate.
In lieu of maintaining and depositing money or securities in the Capital Reserve Fund, VRA may deposit with the Trustee a CRF Credit Facility in an amount equal to all or a portion of the CRF Reserve Requirement. Any CRF Credit Facility will permit the Trustee to draw or obtain under it for deposit in the Capital Reserve Fund amounts that, when combined with the other amounts in the Capital Reserve Fund, are not less than the CRF Reserve Requirement.
The Trustee will make a drawing on or otherwise obtain funds under the CRF Credit Facility before its expiration or termination (i) whenever money is required for the purposes for which Capital Reserve Fund money may be applied and (ii) unless such CRF Credit Facility has been extended or a qualified replacement for it delivered to the Trustee, in the event VRA has not deposited immediately available funds equal to the CRF Reserve Requirement at least two Business Days preceding the expiration or termination of the CRF Credit Facility.
If VRA provides the Trustee with a CRF Credit Facility as provided in this subsection, the Trustee will transfer the corresponding amount of funds then on deposit in the Capital Reserve Fund to VRA, provided VRA delivers to the Trustee (i) an Opinion of Bond Counsel that such transfer of funds will not adversely affect the exclusion from gross income for purposes of federal income taxation of interest on any Bonds the interest on which was excludable on the date of their issuance and (ii) VRA covenants to comply with any directions or restrictions contained in such opinion concerning the use of such funds.
Release of Moral Obligation. Without obtaining the consent of either the Trustee or any of the Owners of the Bonds, VRA may at any time by resolution adopted by its Board of Directors and filed with the Trustee establish the Minimum CRF Reserve Requirement at an amount less than the CRF Reserve Requirement upon satisfaction of the following conditions:
(a) The above-described resolution contains a finding by VRA's Board of Directors that such action is not reasonably expected to affect adversely VRA's ability to pay the Principal and Interest Requirements on the Moral Obligation Bonds; and
(b) VRA files with the Trustee written confirmation from each Rating Agency for any Moral Obligation Bonds then Outstanding that its then-current rating on the Moral Obligation Bonds will not be withdrawn or reduced as a result of such action.
The Minimum CRF Reserve Requirement is intended to be the "minimal requirement" for the Capital Reserve Fund described in Section 62.1-215 of the Act. The portion of the Capital Reserve Fund representing or allocable to the excess, if any, of the CRF Reserve Requirement over the Minimum CRF Reserve Requirement shall not be deemed a "capital reserve fund" within the meaning of Section 62.1-215 of the Act.
Operating Reserve Fund. On each Payment Date, any amount on deposit in the Operating Reserve Fund shall be transferred to the Infrastructure Revenue Debt Service Fund if and to the extent that, after the transfers from the Revenue Fund provided for in the third paragraph of the section titled "Revenue Fund" in the Master Indenture and from the Infrastructure Revenue Debt Service Reserve Fund provided for in the section titled "Infrastructure Revenue Debt Service Reserve Fund" in the Master Indenture, amounts on deposit in the Infrastructure Revenue Debt Service Fund are insufficient to pay the principal and interest due on the Infrastructure Revenue Bonds on such date.
A-21
Investment earnings on amounts in the Operating Reserve Fund shall be retained therein unless necessary for transfer to the Infrastructure Revenue Debt Service Fund as provided in the above paragraph or transferred to VRA as provided in the paragraph below.
At any time upon the filing with the Trustee of a Projected Revenue Certificate, VRA may transfer to itself, from amounts on deposit in the Operating Reserve Fund, free and clear of any lien or pledge created by the Master Indenture, an amount which is not required to produce Revenue Coverage equal to the Required Revenue Coverage, Infrastructure Revenue Bond Debt Service Coverage equal to the Required Infrastructure Revenue Bond Debt Service Coverage, and an Infrastructure Revenue Bond Revenue Coverage equal to the Required Infrastructure Revenue Bond Revenue Coverage in the then-current and all future Bond Years, all as set forth in the Projected Revenue Certificate. The amounts VRA transfers to itself shall first be used to reimburse the Commonwealth in accordance with Section 62.1-215 of the Act for any amounts which the General Assembly may have appropriated and the Commonwealth has paid into the Capital Reserve Fund and then may be applied to any other lawful purpose under the Act. VRA shall provide written notification to each Rating Agency of each such transfer from the Operating Reserve Fund.
Cost of Issuance Funds. There shall be deposited in each Cost of Issuance Fund the portion of the proceeds of the Related Series of Bonds and such other amounts as may be specified in the Related Supplemental Series Indenture. VRA shall use such amounts to pay costs of issuance incurred in connection with the issuance of the Related Series of Bonds. Upon the filing with the Trustee of an Officer's Certificate that no further costs of issuance are to be paid from a Cost of Issuance Fund, VRA shall transfer any amounts remaining on deposit in such Fund to the Revenue Fund, the Related Acquisition Fund and/or another Fund or Account established hereunder as may be authorized or directed by the Related Supplemental Series Indenture or Tax Regulatory Agreement. Investment earnings on a Cost of Issuance Fund may be transferred therefrom periodically as provided in the Related Supplemental Series Indenture and Tax Regulatory Agreement.
Acquisition Funds. There shall be deposited into each Acquisition Fund such portion of the proceeds of the Related Series of Bonds and other amounts as may be specified in the Related Supplemental Series Indenture. VRA shall use amounts in each Acquisition Fund to acquire Related Local Obligations in accordance with the specific requirements of the Related Supplemental Series Indenture, Tax Regulatory Agreement and Related Agreements. Upon the filing with the Trustee of an Officer's Certificate that no additional Local Obligations are to be acquired or principal advances made thereon from amounts in an Acquisition Fund, VRA shall transfer any amounts remaining on deposit in such Fund to the Revenue Fund and/or another Fund or Account established hereunder as may be authorized or directed by the Related Supplemental Series Indenture or Tax Regulatory Agreement. Investment earnings in an Acquisition Fund may be transferred periodically therefrom as provided in the Related Supplemental Series Indenture and Tax Regulatory Agreement.
Rebate Funds. There shall be deposited in each Rebate Fund Rebate Amounts and such other amounts as may be specified in the Related Supplemental Series Indenture and the Related Tax Regulatory Agreement. VRA shall use the balance in a Rebate Fund to pay the obligations under Section 148 of the Code in connection with the Related Series of Bonds. VRA may transfer any amounts on deposit in a Rebate Fund that are not needed for such purpose to the Revenue Fund, the Operating Reserve Fund and/or another Fund or Account established hereunder as may be authorized or directed by the Related Supplemental Series Indenture or Tax Regulatory Agreement and confirmed in an Officer's Certificate.
A-22
Investments
All amounts deposited with VRA or the Trustee under the Master Indenture in excess of the amount guaranteed by the Federal Deposit Insurance Corporation or other federal agency shall be continuously held in bank accounts which are secured for the benefit of VRA and the Owners of the Bonds in the manner required and to the full extent permitted by the Virginia Security for Public Deposits Act, Chapter 44, Title 2.2 of the Virginia Code, or any successor provision of law; provided, however, that it shall not be necessary for the Paying Agent to give security for the deposit of any amounts with it for the payment of the principal of or premium, if any, or interest on any Bonds issued under the Master Indenture, or for any Person to give security for any investments described in the following paragraphs.
Subject to the provisions of any Supplemental Indenture, any amounts held in any Funds and Accounts established by the Master Indenture or any Supplemental Indenture may be separately invested and reinvested by the Trustee, at the request of and as directed in writing by a VRA Representative, in any investments which are at the time legal investments for public funds of the type to be invested under Virginia law, including without limitation the Act and the Investment of Public Funds Act, Chapter 45, Title 2.2 of the Virginia Code, or any successor provision of law.
Subject to the provisions of any Supplemental Indenture, all investments shall be held by or under the control of the Trustee or VRA, as the case may be, and while so held shall be deemed a part of the Fund or Account in which the amounts were originally held. The Trustee and VRA shall sell and reduce to cash a sufficient amount of investments whenever the cash balance in any Fund or Account is insufficient for its purposes.
Unless otherwise provided in a Supplemental Indenture, VRA or the Trustee shall value the investments in each Fund and Account established under the Master Indenture or any Supplemental Indenture and held by it or at its direction as of the last Business Day of each month, at the lower of cost or fair market value of such investments, plus accrued interest.
The Trustee may make investments permitted by the section titled "Permitted Investments" in the Master Indenture through its own trust or bond department.
Particular Covenants
Payment of Bonds. VRA covenants to perform its obligations as provided in the Master Indenture, any Supplemental Series Indenture, each Series of Bonds and related documents and to pay the Bonds, but only from revenues, moneys and other property specifically pledged for such purposes.
Records and Accounts; Inspections and Reports. VRA will maintain or cause to be maintained proper books or records and accounts, separate from any of its other records and accounts, showing complete and correct entries of all transactions relating to the Bonds. All books and documents in VRA's possession relating to the Bonds shall at all times be open to inspection by such agents as may be designated by the Trustee or the Owners of twenty-five percent or more in aggregate principal amount of Bonds then Outstanding. VRA will have an annual audit made by or on behalf of the Auditor of Public Accounts within 120 days after the end of each fiscal year and shall furnish to the Trustee copies of the audit report as soon as such report is available, which report shall include statements in reasonable detail, certified by the Auditor of Public Accounts or the accountant who prepared the report. Such audit report shall reflect VRA's financial position as of the end of such fiscal year and the results of its operations and changes in the financial position of its funds for such fiscal year.

A-23
Covenants with Credit Providers, Infrastructure Revenue DSRF Credit Providers and CRF Credit Providers. VRA may make such covenants as it may in its sole discretion determine to be appropriate with any Bond Credit Provider, Infrastructure Revenue DSRF Provider or CRF Credit Provider that provides for the Bonds of any one or more Series a Bond Credit Facility, an Infrastructure Revenue DSRF Credit Facility or a CRF Credit Facility that shall enhance the security or the value of such Bonds and thereby reduce the Principal and Interest Requirements on such Bonds or substitute for amounts in the Infrastructure Revenue Debt Service Reserve Fund or the Capital Reserve Fund. Such covenants may be set forth in the Related Supplemental Series Indenture or other Supplemental Indenture and shall be binding on VRA, the Trustee, the Paying Agents and the Owners of the Bonds the same as if such covenants were set forth in full in the Master Indenture.
Covenant to Enforce State Aid Intercept. VRA covenants that it will take any and all actions available to it under the laws of the Commonwealth, including those actions available under Section 62.1-216.1 of the Act and Section 15.2-2659 of the Virginia Code, to obtain Local Obligation Payments if the Related Local Government fails to make such payments when the same shall become due and payable.
Defeasance. If VRA shall pay or provide for the payment of the entire indebtedness on all Bonds Outstanding in any one or more of the following ways: (1) by paying or causing to be paid the principal of and premium, if any, and interest on all Bonds Outstanding, as and when the same become due and payable; (2) by delivering all Bonds Outstanding to the Trustee for cancellation; or (3) by depositing with the Trustee (or an escrow agent acceptable to the Trustee), in trust, cash and/or Defeasance Obligations in such amount as will, together with the income or increment to accrue thereon (the "Defeasance Amount"), be fully sufficient to pay or redeem (when redeemable) and discharge the indebtedness on all Bonds Outstanding at or before their respective maturity dates, without consideration of any reinvestment of the Defeasance Amount, as an independent certified public accountant shall verify to the Trustee's satisfaction; and if VRA shall pay or provide for the payment of (on the date of defeasance or over time) all other sums payable hereunder by VRA, and, if any of the Bonds Outstanding are to be redeemed before their maturity, notice of such redemption shall have been given as provided in Article IV of the Master Indenture (and the corresponding sections of the Supplemental Series Indentures) or provisions satisfactory to the Trustee shall have been made for the giving of such notice, the Master Indenture and the estate and rights granted in the Master Indenture (except for the provisions of Articles III and IV and Section 6.1 thereof) shall cease and become null and void. Thereupon the Trustee shall, upon receipt by the Trustee of an Officer's Certificate and an opinion of Bond Counsel, each stating that in the opinion of the signers all conditions precedent to the satisfaction and discharge of the Master Indenture as provided above have been complied with, forthwith execute proper instruments acknowledging satisfaction of and discharging the Master Indenture (except for the provisions of Articles III and IV of the Master Indenture (the corresponding sections of the Supplemental Series Indentures) and Section 6.1 of the Master Indenture), and the lien hereof.
Provision for Payment of Particular Bonds. If VRA shall pay or provide for the payment of the entire indebtedness on particular Bonds in any one or more of the following ways: (1) by paying or causing to be paid the principal of and premium, if any, and interest on such Bonds, as and when the same shall become due and payable; (2) by delivering such Bonds to the Trustee for cancellation; or (3) by depositing with the Trustee (or an escrow agent acceptable to the Trustee), in trust, cash and/or Defeasance Obligations in such amount as will, together with the income or increment to accrue thereon (the "Payment Amount"), be fully sufficient to pay or redeem (when redeemable) and discharge the indebtedness on such Bonds at or before their respective maturity dates, without consideration of any reinvestment of the Payment Amount, as an independent certified public accountant shall verify to the Trustee's satisfaction; and if VRA shall also pay or provide for the payment of all other sums payable hereunder by VRA with respect to such Bonds, and, if such Bonds are to be redeemed before their maturity, notice of such redemption shall have been given as provided in Article IV of the Master

A-24
Indenture (or the corresponding provisions of the Related Supplemental Series Indentures) or provisions satisfactory to the Trustee shall have been made for the giving of such notice, such Bonds shall cease to be entitled to any lien, benefit or security under the Master Indenture. The liability of VRA under such Bonds shall continue but their Owners shall thereafter be entitled to payment (to the exclusion of all other Owners) only out of the cash and/or Defeasance Obligations deposited with the Trustee (or an escrow agent acceptable to the Trustee) as aforesaid.
VRA may at any time surrender to the Trustee for cancellation any Bonds previously authenticated and delivered that VRA may have acquired in any manner whatsoever, and such Bonds, upon such surrender and cancellation, shall be deemed to be paid and retired as provided in the Master Indenture.
The defeasance provisions of the Master Indenture may be modified by the Related Supplemental Series Indentures with respect to Bonds of any Series that constitute Variable Rate Bonds and/or Optional Tender Bonds.
Events of Default; No Acceleration. The occurrence and continuation of one or more of the following events shall constitute an Event of Default with respect to the Bonds:
(a) default in the payment of any installment of interest in respect of any Bond as the same shall become due and payable; or
(b) default in the payment of the principal of or premium, if any, in respect of any Bond as the same shall become due and payable either at maturity, upon redemption, or otherwise; or
(c) default in the payment of any Amortization Requirement in respect of any Term Bond as the same shall become due and payable; or
(d) failure on the part of VRA duly to observe or perform any other of the covenants or agreements on the part of VRA contained in the Master Indenture, any Supplemental Series Indenture, any Tax Regulatory Agreement or any Bond; or
(e) Appointment by a court of competent jurisdiction of a receiver for all or any substantial part of the Revenues, the Infrastructure Revenue Bond Revenues, and the other Funds and Accounts pledged pursuant to the Master Indenture, or the filing by VRA of any petition for reorganization of VRA or rearrangement or readjustment of the obligations of VRA under the provisions of any applicable bankruptcy or insolvency law.
Notwithstanding any other provision of the Master Indenture, failure to pay the principal or any Amortization Requirement of or interest on the Moral Obligation Bonds will not constitute an Event of Default on the Infrastructure Revenue Bonds.
VRA may, pursuant to a Supplemental Series Indenture, provide for a particular Series of Bonds different or additional Events of Default and remedies upon the occurrence thereof, including, but not limited to, Events of Default upon the occurrence of events specified in any agreement entered into in connection with the delivery of a Bond Credit Facility and acceleration of the full principal amount of such Bonds.
No Acceleration. The principal of and interest on the Bonds is not subject to acceleration upon the occurrence and continuation of an Event of Default.

A-25
Other Remedies. Upon the occurrence and continuation of an Event of Default, the Trustee may in its discretion, and shall at the written request of the Majority Owners of the Infrastructure Revenue Bonds Outstanding, or if there are no Infrastructure Revenue Bonds Outstanding, at the written request of the Majority Owners of the Moral Obligation Bonds Outstanding, and having been indemnified as provided in the section titled "Acceptance of Trusts and Obligations" in the Master Indenture, pursue any available remedy, at law or in equity, to enforce the payment of the principal of and premium, if any, and interest on the Bonds, to enforce any covenant or condition under the Master Indenture or the Supplemental Indentures or to remedy any Event of Default.
Notwithstanding anything in the Master Indenture or the Supplemental Indentures to the contrary, upon the occurrence and continuation of an Event of Default, the Majority Owners of the Infrastructure Revenue Bonds Outstanding will control and direct all actions of the Trustee in exercising its rights and powers under the Master Indenture. If there are no Infrastructure Revenue Bonds Outstanding, upon the occurrence and continuation of an Event of Default, and if requested so to do in writing by the Majority Owners of the Moral Obligation Bonds Outstanding, and having been indemnified as provided in the Master Indenture, the Trustee will exercise such of the rights and powers conferred by the Master Indenture, being advised by counsel, that the Trustee deems most effective to enforce and protect the interests of the Owners.
So long as any Infrastructure Revenue Bonds are Outstanding, no Owner of any Moral Obligation Bond may exercise any remedy under the Master Indenture or any Supplemental Indenture.
Restriction on Owners' Actions. In addition to the other restrictions on the rights of Owners to request action upon the occurrence of an Event of Default and to enforce remedies set forth in the article titled "Default Provisions and Remedies of Trustee and Owners" in the Master Indenture, no Owner will have any right to institute any suit, action or proceeding in equity or at law for the enforcement of the Master Indenture or any remedy under the Master Indenture or any Supplemental Indenture or the Bonds, unless (i) an Event of Default has occurred and is continuing of which the Trustee has been notified as provided in the section titled "Acceptance of Trusts and Obligations" in the Master Indenture, or of which by such Section it is deemed to have notice; (ii) the Majority Owners of the Infrastructure Revenue Bonds or, if there are no Infrastructure Revenue Bonds Outstanding, the Majority Owners of the Moral Obligation Bonds, have made written request of the Trustee to institute the suit, action, proceeding or other remedy, after the right to exercise the powers or rights of action, as the case may be, has accrued, and have afforded the Trustee a reasonable opportunity either to proceed to exercise the powers granted in the Master Indenture or to institute the action, suit or proceeding in its or their name; (iii) there has been offered to the Trustee security and indemnity reasonably satisfactory to it against the costs, expenses and liabilities to be incurred as provided in the section titled "Acceptance of Trusts and Obligations" in the Master Indenture, and (iv) the Trustee has not complied with the request within a reasonable time. Such notification, request and offer of indemnity are declared, at the option of the Trustee, to be conditions precedent to the execution of the trusts of the Master Indenture or for any other remedy under the Master Indenture. It is intended that no one or more Owners will have any right to affect, disturb or prejudice the security of the Master Indenture, or to enforce any right under the Master Indenture or the Bonds, except in the manner provided for in the Master Indenture, and that all proceedings at law or in equity will be instituted, had and maintained in the manner provided in the Master Indenture and for the benefit of all Owners. Nothing in the Master Indenture will affect or impair the right of the Owners to enforce payment of the Bonds in accordance with their terms.
Waiver of Events of Default; Effect of Waiver. The Trustee will waive any Event of Default and its consequences at the written request of the Majority Owners of the Infrastructure Revenue Bonds Outstanding or, if there are no Infrastructure Revenue Bonds Outstanding, the Majority Owners of the Moral Obligation Bonds Outstanding. If any Event of Default with respect to the Bonds has been waived

A-26
as provided in the Master Indenture, the Trustee will promptly give written notice of the waiver to VRA and by first class mail, postage prepaid, to all Owners if the Owners had previously been given notice of the Event of Default. No waiver, rescission and annulment will extend to or affect any subsequent Event of Default or impair any right, power or remedy available under the Master Indenture.
No delay or omission of the Trustee or of any Owner to exercise any right, power or remedy accruing upon any default or Event of Default will impair any such right, power or remedy or will be construed to be a waiver of or acquiescence in any such default or Event of Default. Every right, power and remedy given to the Trustee and to the Owners, respectively, may be exercised from time to time and as often as may be deemed expedient.
Application of Money. Any amounts received by the Trustee will, after payment of the costs and expenses of the proceedings resulting in the collection of the money, the expenses, liabilities and advances incurred or made by the Trustee and the fees (whether ordinary or extraordinary) of the Trustee and expenses of VRA in carrying out the provisions of the Master Indenture, be deposited in an appropriate Account that the Trustee will establish in the Revenue Fund. The amounts in such Account shall be applied as follows:
(a) To the payment of the persons entitled to it of all installments of interest then due on the Infrastructure Revenue Bonds, in order of the maturity of the installments of such interest and, if the money available is not sufficient to pay in full any particular installment, then ratably, according to the amounts due on such installment, to the persons entitled to it, without any discrimination or privilege;
(b) To the payment of the persons entitled to it of the unpaid principal or Amortization Requirements of any of the Infrastructure Revenue Bonds which have become due (other than Infrastructure Revenue Bonds matured or called for redemption for the payment of which money is held pursuant to the provisions of the Master Indenture), in the order of their due dates and, if the amount available is not sufficient to pay in full such Infrastructure Revenue Bonds due on any particular date, then ratably, according to the amount of principal due on such date, to the persons entitled to it, without any discrimination or privilege;
(c) To the payment of the persons entitled to it of all installments of interest then due on the
Moral Obligation Bonds to the extent the same is not to be paid from amounts in the Capital Reserve Fund, in order of the maturity of the installments of such interest and, if the money available is not sufficient to pay in full any particular installment, then ratably, according to the amounts due on such installment, to the persons entitled to it, without any discrimination or privilege; and
(d) To the payment of the persons entitled to it of the unpaid principal or Amortization
Requirements of any of the Moral Obligation Bonds which have become due (other than Moral Obligation Bonds matured or called for redemption for the payment of which money is held pursuant to the provisions of the Master Indenture) to the extent the same is not to be paid from amounts in the Capital Reserve Fund, in the order of their due dates and, if the amount available is not sufficient to pay in full such Moral Obligation Bonds due on any particular date, then ratably, according to the amount of principal due on such date, to the persons entitled to it, without any discrimination or privilege.
Whenever money is to be applied pursuant to the Master Indenture, it will be applied at such times, and from time to time, as the Trustee determines, having due regard to the amount of money available for application and the likelihood of additional money becoming available for application in the future. Whenever the Trustee applies such money, it will fix the date on which payment is to be made, and interest on the amount of principal to be paid on such date will cease to accrue. The Trustee will

A-27
give, by first class mail as it may deem appropriate, notice to the Owners of the fixing of such payment date.
Notwithstanding anything to the contrary in the Master Indenture, amounts at any time on deposit in or transferred to the Capital Reserve Fund as described in the subsection titled "Capital Reserve Fund" above shall be used only to pay the principal of and interest on the Moral Obligation Bonds and such amounts shall be so used but only to the extent that amounts in the above-described Account and the Moral Obligation Debt Service Fund are insufficient therefor.
Notice of Certain Defaults; Opportunity to Cure Such Defaults. Notwithstanding anything to the contrary in the Master Indenture, no default not constituting a debt service payment or insolvency-related default under the Master Indenture will constitute an Event of Default until actual notice of the default is given to VRA by the Trustee or by the Owners of not less than twenty-five percent in aggregate principal amount of all Outstanding Bonds, and VRA has had (i) 30 days after receipt of the notice with respect to any default in the payment of money or (ii) 90 days after receipt of the notice of any other default to correct the default or to cause the default to be corrected; provided, however, that if the default can be corrected, but cannot be corrected within the applicable period, it will not constitute an Event of Default if corrective action is instituted by VRA within the applicable period and diligently pursued until the default is corrected.
Modification or Amendment of the Indenture
VRA and the Trustee may, without the consent of, or notice to, any of the Owners of the Bonds, enter into such Supplemental Indenture or Supplemental Indentures as shall not be inconsistent with the terms and provisions of the Master Indenture or any Supplemental Series Indenture for any one or more of the following purposes:
(a) To cure or correct any ambiguity, formal defect, omission or inconsistent provision in the Master Indenture or in a Supplemental Series Indenture;
(b) To grant to or confer on the Trustee for the benefit of the Owners any additional rights, remedies, powers or authority that may lawfully be granted to or conferred on the Owners or the Trustee or either of them;
(c) To subject to the lien and pledge of the Master Indenture additional revenues, properties or collateral;
(d) To provide for the issuance of coupon Bonds if authorized under the Related Supplemental Series Indenture;
(e) To amend certain provisions of the Master Indenture or any Supplemental Series Indenture in any manner consistent with Sections 103 and 141 through 150 of the Code (or such other hereinafter enacted sections of the Code as may be applicable to the Bonds) as in effect at the time of the amendment;
(f) To confirm, as further assurance, any pledge under, and the subjection to any lien or pledge created or to be created by, the Master Indenture or any Supplemental Series Indenture, of the Revenues, the Infrastructure Revenue Bond Revenues or any other moneys, property or Funds or Accounts;

A-28
(g) To modify, amend or supplement the Master Indenture or any Supplemental Series Indenture as required to permit its qualification under the Trust Indenture Act of 1939, as amended, or any similar federal statute hereafter in effect, or to permit the qualification of any of the Bonds for sale under the securities laws of any of the states of the United States, and, if VRA and the Trustee so determine, to add to this Master Indenture or any Supplemental Series Indenture such other terms, conditions and provisions as may be permitted by the Trust Indenture Act of 1939, as amended, or similar federal statute;
(h) To add to the covenants and agreements of VRA contained in this Indenture other covenants and agreements thereafter to be observed for the Owners' protection, including, but not limited to, additional requirements imposed by virtue of a change of law, or to surrender or to limit any right, power or authority therein reserved to or conferred upon VRA;
(i) To amend, modify or change the terms of any agreements governing any book-entry-only system for any of the Bonds;
(j) In the case of Supplemental Series Indentures, to provide for the issuance of additional Series of Bonds (including Refunding Bonds) and to provide for such other related matters as may be required or contemplated by or appropriate under the Master Indenture;
(k) To make any changes necessary to comply with the requirements of a Rating Agency or of a Bond Credit Provider, an Infrastructure Revenue DSRF Credit Provider or a CRF Credit Provider that, as expressed in a finding or determination by VRA (which is included in the Supplemental Indenture), would not materially adversely affect the security for the Bonds;
(l) To make any other changes that, as expressed in a determination or finding by VRA (which shall be stated in the Supplemental Indenture, and may be based upon an Opinion of Counsel and/or the opinion of VRA's financial advisor) shall not prejudice in any material respect the rights of the Owners of the Bonds then Outstanding; and
(m) To restate in one document the Master Indenture and all effective Supplemental Series Indentures and other Supplemental Indentures, which restatement shall then become the Master Indenture for all purposes, effective as of the date of this Master Indenture with respect to matters set forth therein and as of the date of any Supplemental Indenture included in the restatement as to matters set forth in any such Supplemental Indenture. Supplemental Series Indentures and the Bonds issued thereunder prior to a restatement shall be deemed to relate to the restated Master Indenture without any further action or amendment.
Supplemental Indentures Requiring Consent. Exclusive of Supplemental Indentures not requiring the consent of owners as described above and subject to the terms and provisions contained in the Master Indenture, the Owners of a majority in aggregate principal amount of Bonds then Outstanding shall have the right from time to time, notwithstanding any other provision of this Indenture, to consent to and approve the execution by VRA and the Trustee of such other Supplemental Indenture or Supplemental Indentures as VRA shall deem necessary or desirable to modify, alter, amend, add to or rescind any of the terms or provisions contained in the Master Indenture or in any Supplemental Indenture; provided, however, that without the consent and approval of the Owners of all of the affected Bonds then Outstanding nothing in the Master Indenture shall permit, or be construed as permitting (i) an extension of the maturity of the principal of or the interest on any Bond, (ii) a reduction in the principal amount of any Bond or the rate of interest on it, (iii) a privilege or priority of any Bond or Bonds over any other Bond or Bonds except as otherwise provided herein, or (iv) a reduction in the aggregate principal amount of Bonds required for consent to such Supplemental Indenture.

A-29
Fortieth Supplemental Series Indenture
The Fortieth Supplemental Series Indenture supplements the Master Indenture in the following ways.
Establishment of Funds and Accounts for the 2017C Bonds. In accordance with the Master Indenture, the 2017C Cost of Issuance Fund, the 2017C Acquisition Fund and the 2017C Rebate Fund are established with respect to the 2017C Bonds.
The Trustee is directed to establish a Local Account in the 2017C Acquisition Fund for each 2017C Local Obligation.
2017C Cost of Issuance Fund. The Trustee shall apply the amounts in the 2017C Cost of Issuance Fund to pay the costs of issuance of the 2017C Bonds as VRA shall direct pursuant to requisitions in the form provided in the Fortieth Supplemental Series Indenture. Any of the amounts deposited in the 2017C Cost of Issuance Fund that are not applied to pay the costs of issuance of the 2017C Bonds shall be transferred to the Revenue Fund and applied to pay debt service on the 2017C Bonds before any other amounts therein are so used.
2017C Acquisition Fund.
Purchase of 2017C Local Obligations. The allocation to each Local Account of the respective amount of the sale proceeds of the 2017C Bonds pursuant to the Fortieth Supplemental Series Indenture shall be deemed the purchase of each of the 2017C Local Obligations.
Disbursements and Transfers from Local Account. Commencing on the Closing Date, each 2017C Local Government may cause the Trustee to disburse amounts on deposit in the Related Local Account in accordance with the Related Agreement. The Trustee shall retain in the Local Account all income and profits, if any, from the investment and reinvestment of amounts therein.
Additional Conditions. Before the issuance and delivery of the 2017C Bonds by the Paying Agent, VRA shall deliver or cause to be delivered to the Trustee the following documents in addition to those required under the Master Indenture.
(a) A Projected Revenue Certificate satisfying the requirements of the section titled "Required Infrastructure Revenue Bond Revenue Coverage; Projected Revenue Certificate" in the Fortieth Supplemental Series Indenture.
(b) Each Related Local Obligation;
(c) An executed version of each Related Agreement, which shall at a minimum provide for the replenishment and payment by the 2017C Local Government of any amounts withdrawn from and foregone investment earnings on the Capital Reserve Fund due to a failure of the 2017C Local Government to make any payment under the Related Local Obligation;
(d) Certified copies or duplicate originals of all resolutions, documents, certificates and opinions of each 2017C Local Government relating to the Related Agreement or the issuance of the Related 2017C Local Obligation;
(e) Such certificates, instruments and documents as are required by the terms of each Related Agreement;

A-30
(f) An opinion of bond counsel to each 2017C Local Government dated the date of the
issuance of the Related 2017C Local Obligation which shall, at a minimum, state, subject to customary qualifications, that the Related Local Obligation and Agreement are valid and binding in accordance with their terms; and
(g) The executed Tax Regulatory Agreement for the 2017C Bonds (the "2017C Tax Regulatory Agreement").
2017C Tax Regulatory Agreement. VRA agrees that it will not take any action, or omit to take any action, if any such action or omission would adversely affect the exclusion from gross income of interest on the 2017C Bonds under Section 103 of the Code. VRA agrees that it will not directly or indirectly use or permit the use of any proceeds of the 2017C Bonds or any other funds of VRA or take or omit to take any action that would cause the 2017C Bonds to be "arbitrage bonds" under Section 148(a) of the Code. To these ends, VRA will comply with all requirements of Sections 141 through 150 of the Code, including the rebate requirement of Section 148(f), to the extent applicable to the 2017C Bonds.
Without limiting the generality of the foregoing, VRA agrees that (i) it will not directly or indirectly use or permit the use of the proceeds of the 2017C Bonds except in accordance with the 2017C Tax Regulatory Agreement and (ii) insofar as the 2017C Tax Regulatory Agreement imposes duties and responsibilities on VRA, the 2017C Tax Regulatory Agreement is specifically incorporated by reference into the Fortieth Supplemental Series Indenture.
The Trustee agrees to comply with all written instructions of a VRA Representative given in accordance with the 2017C Tax Regulatory Agreement, but the Trustee shall not be required to ascertain that the instructions comply with the 2017C Tax Regulatory Agreement. The Trustee shall be entitled to receive and may request from time to time from VRA written instructions from a nationally-recognized bond counsel acceptable to the Trustee regarding the interpretation of Sections 141 through 150 of the Code, and the Trustee agrees that it will comply with such directions (upon which the Trustee and VRA may conclusively rely) so as to enable VRA to perform its covenants under the Fortieth Supplemental Series Indenture.
Notwithstanding any provisions of the Fortieth Supplemental Series Indenture, if VRA shall provide to the Trustee an opinion of nationally-recognized bond counsel addressed and acceptable to VRA and the Trustee to the effect that any action is not required to maintain the exclusion from gross income of the interest on the 2017C Bonds under Section 103 of the Code, the Trustee may rely conclusively on such opinion in complying with the provisions of the Fortieth Supplemental Series Indenture.
Required Infrastructure Revenue Bond Revenue Coverage Certificate. For so long as any of the 2017C Bonds remains Outstanding, each Projected Revenue Certificate filed with the Trustee under the section titled "Conditions of Issuing a Series of Bonds" in the Master Indenture shall show for each Bond Year Infrastructure Revenue Bond Revenue Coverage equal to at least 120%. In other words, for purposes of the conditions for the issuance of additional Series of Bonds and for so long as any of the 2017C Bonds remains Outstanding, "Required Infrastructure Revenue Bond Revenue Coverage" means 120%.
Restriction on Withdrawals from Operating Reserve Fund. For so long as any of the 2017C Bonds remains Outstanding, VRA shall not request any transfer to itself from the Operating Reserve Fund pursuant to the section titled "Operating Reserve Fund" in the Master Indenture unless each request is accompanied by an Officer's Certificate stating that (i) no single Local Government has outstanding an

A-31
aggregate principal amount of Local Obligations representing more than 20% of the aggregate outstanding principal amount of all Local Obligations purchased or acquired with proceeds of Bonds issued under the Master Indenture and (ii) there are not fewer than twenty different Local Governments with outstanding Local Obligations purchased or acquired with proceeds of Bonds issued under the Master Indenture.
Restriction on Permitted Investments. For so long as any of the 2017C Bonds remains Outstanding, investments or providers of investments in the Capital Reserve Fund must meet certain requirements prescribed by the Rating Agency, including a general requirement that the investment or provider have ratings at least as high as the ratings on the Moral Obligation Bonds Outstanding.
Identification of Additional Revenues. For purposes of the Projected Revenue Certificate for the 2017C Bonds, in the Fortieth Supplemental Series Indenture, VRA has identified as "Revenues" certain payments from the IOW Escrow Fund and certain payments and investment earnings on such payments which may be made by BVUA as described in the subsections "ADDITIONAL INDEBTNESS" and "INVESTMENT CONSIDERATIONS" in Section Two of this Official Statement.

[THIS PAGE INTENTIONALLY LEFT BLANK]
APPENDIX B
COMMONWEALTH OF VIRGINIA FINANCIAL AND OTHER INFORMATION
Report date: October 23, 2017
APPENDIX B TABLE OF CONTENTS
INTRODUCTION ..............................................................................................................................................................1 GOVERNMENTAL ORGANIZATION ...........................................................................................................................1 Legislative Department ......................................................................................................................................... 1 Executive Department ........................................................................................................................................... 1 Judicial Department .............................................................................................................................................. 1 FINANCIAL FACTORS ....................................................................................................................................................2 Budgetary Process ................................................................................................................................................. 2 Development of Revenue Estimates ..................................................................................................................... 3 Financial Control Procedures ................................................................................................................................ 3 Investment of Public Funds................................................................................................................................... 3 Financial Statements ............................................................................................................................................. 4 Summary of General Fund Revenues, Expenditures and Changes in Fund Balance ............................................ 4 General Fund Revenues ........................................................................................................................................ 8 Collection of Delinquent Tax ................................................................................................................................ 9 General Fund Expenditures ................................................................................................................................. 10 General Fund Balance ......................................................................................................................................... 11 Nongeneral Fund Revenues ................................................................................................................................ 13 2016 Appropriation Act ...................................................................................................................................... 14 2017 Amendments to the 2016 Appropriation Act (2017 Appropriation Act) ................................................... 16 INDEBTEDNESS OF THE COMMONWEALTH ....................................................................................................... 18 Section 9(a) Debt ................................................................................................................................................ 18 Section 9(b) Debt ................................................................................................................................................ 18 Section 9(c) Debt ................................................................................................................................................ 18 Effect of Refunding Debt .................................................................................................................................... 18 General Obligation Debt Limit and Debt Margin ............................................................................................... 19 Tax-Supported Debt – General Obligation ......................................................................................................... 21 Other Tax-Supported Debt .................................................................................................................................. 21 Leases and Contracts ........................................................................................................................................... 21 Outstanding Tax-Supported Debt ....................................................................................................................... 22 Outstanding Tax-Supported Debt Service .......................................................................................................... 23 Authorized and Unissued Tax-Supported Debt .................................................................................................. 28 Moral Obligation Debt ........................................................................................................................................ 29 Other Debt........................................................................................................................................................... 29 Commonwealth Debt Management..................................................................................................................... 31 RETIREMENT PLANS .................................................................................................................................................. 31 OTHER LONG-TERM LIABILITIES ........................................................................................................................... 48 Employee Benefits Other than Pension Benefits ................................................................................................ 48 Self-Insurance ..................................................................................................................................................... 49 Medicaid Payable ................................................................................................................................................ 49 Other Post Employment Benefits (OPEB) – Financial Statement Reporting ..................................................... 49 LABOR RELATIONS .................................................................................................................................................... 50 LITIGATION ................................................................................................................................................................... 50 TOBACCO SETTLEMENT ........................................................................................................................................... 50 EFFECTS OF FEDERAL SEQUESTRATION ON VIRGINIA ................................................................................... 51

B-1
INTRODUCTION This financial and other information was provided by the Commonwealth of Virginia (the "Commonwealth"), its agencies, institutions and authorities. The data were compiled by the Department of the Treasury and were not independently verified; however, the Department of the Treasury has no reason to believe that such material is not true and correct.
GOVERNMENTAL ORGANIZATION Under the Constitution of Virginia (the “Constitution”), the legislative, executive and judicial powers of the Commonwealth are divided into three separate and distinct departments.
Legislative Department The legislative power is vested in the General Assembly, the oldest representative lawmaking body in the United States. The General Assembly is bicameral, consisting of a Senate with 40 Senators elected for four-year terms and a House of Delegates with 100 Delegates elected for two-year terms. The General Assembly convenes annually each January. Regular sessions are 60 days in duration in even numbered years and 30 days in odd numbered years, but each can be extended for an additional 30 days by a two-thirds vote of each house. The General Assembly is assisted in its legislative function by a full-time staff of over 200 persons and various commissions appointed by the General Assembly. The Joint Legislative Audit and Review Commission was established to carry out continuous legislative review and evaluation of Commonwealth programs from the standpoint of cost effectiveness. The Auditor of Public Accounts is elected by the General Assembly. The Auditor and a staff of approximately 130 persons audit the accounts of all Commonwealth offices, departments, boards, commissions, institutions and other agencies handling Commonwealth funds and report thereon to the General Assembly.
Executive Department The Governor, Lieutenant Governor and Attorney General are constitutional officers, elected every four years. The present term of each office began January 11, 2014 and each expires January 13, 2018. The Constitution does not allow a Governor to serve successive terms. The Governor is the Commonwealth's chief executive officer. The Governor advises the General Assembly on the condition of the Commonwealth and makes recommendations for legislation. The Governor is also charged with the responsibility for preparing and executing the Commonwealth's budget. The Governor's veto of legislation may be overridden only by a two-thirds vote of each house of the General Assembly. If deemed necessary for the welfare of the Commonwealth, the Governor may convene the General Assembly at any time. With few exceptions, the Governor appoints the administrative heads and boards of all Commonwealth agencies. Commonwealth agencies report to the Governor through a cabinet of twelve Secretaries appointed by the Governor to supervise and manage the various functions of the Commonwealth's government. The Lieutenant Governor is next in line in the event of the Governor's inability to serve. The Lieutenant Governor also serves as President of the Senate, but may not vote except in the event of a tie. The Attorney General is the chief executive officer of the Department of Law. The Department of Law represents the Commonwealth in all civil cases to which the Commonwealth or any of its agencies is a party and in all criminal cases on appeal to the Supreme Court of Virginia. The Attorney General is also the legal advisor to the Governor, General Assembly and heads of Commonwealth agencies.
Judicial Department The Supreme Court is the Commonwealth's highest court and consists of seven justices appointed by the General Assembly. Several agencies involved in legal administration operate under the control of the Supreme Court. These include the Judicial Inquiry and Review Commission, the Virginia State Bar and the State Board of Bar Examiners. The

B-2
Commonwealth is divided into 31 Judicial Circuits over which Circuit Judges preside. The Circuit Courts are courts of record having original jurisdiction in cases involving a specified sum and felonies, and appellate jurisdiction over lower District Courts. A Court of Appeals stands between the Circuit Courts and the Supreme Court and has appellate jurisdiction.
FINANCIAL FACTORS
Budgetary Process The Governor is the chief planning and budget officer of the Commonwealth. The Secretary of Finance and the Department of Planning and Budget assist the Governor in the preparation of executive budget documents. The Governor's Secretaries advise the Governor and the Department of Planning and Budget on the relative priority of the budget requests from their respective agencies. The Governor is required by statute to present a bill detailing his proposed budget for the next biennium (the “Budget Bill”) and a narrative summary of the bill to the General Assembly by December 20th in the year immediately prior to each even-year session. The Budget Bill is introduced in both the House of Delegates and the Senate. It is referred to the House Appropriations and Senate Finance Committees, which hold joint meetings to hear from citizens, from other General Assembly members and from agency representatives. The Budget Bill is then approved by each Committee in an open session and reported to the respective floors for consideration, debate, amendment and passage. After the bill has passed both houses, differences between the House and Senate versions are reconciled by a conference committee from both houses. Under constitutional provisions, the Governor retains the right in his review of legislative action on the Budget Bill, to suggest alterations to or to veto appropriations made by the General Assembly. After enactment, the Budget Bill becomes law (the “Appropriation Act”). In the odd-year sessions of the General Assembly, amendments are considered to the Appropriation Act enacted in the previous year. The Governor submits a bill by December 20th which includes his proposed amendments to the current biennial budget. It is then introduced in both houses and is considered in the same manner as the regular biennial Budget Bill. The Appropriation Act enacted in the odd-year session is effective upon passage, whereas the regular biennial Appropriation Act is effective July 1, the beginning of the biennium. An appropriation for a project or service is initially contained in the Appropriation Act enacted by the General Assembly. An agency request for an increase or other adjustments to its legislative appropriation must be reviewed and approved by the Department of Planning and Budget. Under the Constitution, no money may be paid out of the State Treasury except pursuant to appropriations made by law. No such appropriation may be made which is payable more than two years and six months after the end of the session of the General Assembly at which the appropriation was enacted. Implementation and administration of the provisions of the Appropriation Act are functions of the Governor, assisted by the Secretary of Finance and the Department of Planning and Budget. This process also involves constant monitoring of revenue collections and expenditures to ensure that a balanced budget is maintained. The Appropriation Act requires that if projected revenue collections fall below amounts appropriated, the Governor must reduce expenditures and withhold allotments of appropriations, with the exception of amounts needed for debt service and specified other purposes, to the extent necessary to prevent any expenditure in excess of estimated revenues. The Appropriation Act provides that up to 15 percent of a general fund appropriation to an agency may be withheld, if required. The Constitution requires the Governor to ensure that expenses do not exceed total revenues anticipated plus fund balances during the period of two years and six months following the end of the General Assembly session in which the appropriations are made. A Revenue Stabilization Fund was established by constitutional amendment effective January 1, 1993, and is available to offset, in part, anticipated shortfalls in revenues in years when revenues are forecasted to decline by more than two percent of the certified tax revenues collected in the most recently ended fiscal year. Deposits to the Fund are made pursuant to Constitutional provisions based on tax revenue collections as certified by the Auditor of Public Accounts. If in any year total revenues are forecast to decline by more than two percent of the certified tax revenues collected in the most recently ended fiscal year, the General Assembly may appropriate for transfer up to one-half of the Revenue Stabilization Fund balance to the General Fund to stabilize revenues. This transfer shall not exceed one-half of the forecast shortfall. The maximum balance in the Fund can consist of an amount not to exceed 15 percent of the Commonwealth's average annual tax revenues derived from income and retail sales taxes for the three immediately

B-3
preceding fiscal years, as certified by the Auditor of Public Accounts. If any amounts accrue to the credit of the Fund in excess of the 15 percent limitation, such as through interest or dividends, the Treasurer shall promptly transfer any such excess amounts to the General Fund.
Development of Revenue Estimates The development of the General Fund revenue estimate begins with the selection of a forecast of national economic activity for the state budget period prepared by independent economic forecasting firms based on the advice of the Joint Advisory Board of Economists and the Commonwealth's own staff. The national economic forecast is used to develop a forecast of similar indicators of in-state activity. The Governor’s Advisory Council on Revenue Estimates also examines the economic assumptions with respect to the general economic climate of the Commonwealth. After the development of forecasts of major Commonwealth economic indicators, revenue estimates are generated using revenue forecasting models developed and maintained by the Department of Taxation. Adjustments are made on a revenue source-by-source basis for any legislative, judicial or administrative changes that would affect the projected level of revenues but that cannot be forecast by models constructed using historical data. Finally, adjustments are made if revenues are substantially above or below the projected level.
Financial Control Procedures The General Assembly appropriates funds for a particular program in the Appropriation Act. These funds must then be allotted by the Governor and the Department of Planning and Budget for specific purposes. The State Comptroller accounts for certain specific personnel and non-personnel transactions. Once appropriation, allotment and accounting procedures have been completed, funds are disbursed by the State Treasurer upon a warrant of the State Comptroller drawn at the request of the responsible agency. The Auditor of Public Accounts audits such financial transactions to assure the reporting of such transactions is in compliance with generally accepted accounting principles. The Director of the Department of Planning and Budget is appointed by the Governor. The Department of Planning and Budget monitors and evaluates the use of resources to ensure that agencies are delivering effective and efficient services. The Governor is empowered to withhold appropriations to agencies in the event that expenditures are no longer warranted or are not being made for the purposes for which the funds were initially appropriated. The State Comptroller, who is appointed by the Governor subject to confirmation by the General Assembly, is the director of the Department of Accounts, the central accounting agency of the Commonwealth. The State Comptroller maintains a complete system of general accounts of every department, division, office, board, commission, institution and agency of the Commonwealth. In order to assure uniform accounting practices among the agencies and to avoid duplication, the State Comptroller also prescribes the accounts and control records that are to be kept by each state agency. The State Treasurer, who is also appointed by the Governor subject to confirmation by the General Assembly, is the director of the Department of the Treasury. This department receives, maintains custody of and disburses all funds of the Commonwealth. Unlike the State Comptroller and the State Treasurer, the Auditor of Public Accounts is appointed by the General Assembly for a term of four years and is, therefore, part of the Legislative Department rather than the Executive Department. The principal function of the Auditor is to audit the accounts of all state departments, offices, boards, commissions, institutions and agencies handling state funds. In the event the Auditor discovers some irregularity or misuse of funds, it is his duty to inform the Governor, the Joint Legislative Audit and Review Commission and the State Comptroller.
Investment of Public Funds It is the policy of the State Treasurer to invest public funds in a manner which will provide the highest investment return with the maximum security while meeting the daily cash flow demands and conforming to all statutes governing the investment of public funds. The General Account of the Commonwealth, which is comprised of funds collected and held for various fund groups including the General Fund, is divided into two major portfolios. Both portfolios are managed in accordance with guidelines promulgated by the Treasury Board. The Primary Liquidity Portfolio, representing approximately 75 percent of the General Account, provides for disbursements and operational needs. Safety of principal
B-4
and liquidity are the objectives of this portfolio. The Extended Duration and Credit Portfolio, which can be up to 25 percent of the General Account, is structured to generate investment returns over the long term higher than the return on the Primary Liquidity Portfolio, while maintaining sound credit quality and providing secondary liquidity.
Financial Statements The Commonwealth operates on a fiscal year basis beginning on July 1 and ending on June 30. The Commonwealth’s financial statements, audited by the Auditor of Public Accounts, for the fiscal year ended June 30, 2016, are contained in the Commonwealth Comprehensive Annual Financial Report (the “CAFR”) available at www.doa.virginia.gov. The financial statements conform to GASB Statement No. 34, Basic Financial Statements – and Management’s Discussion and Analysis – for State and Local Governments. The financial statements include government-wide statements using full accrual accounting, fund financial statements that use different accounting approaches based on the type of fund, and a reconciliation of the two types of statements. See the section in the CAFR entitled “Management’s Discussion and Analysis” for a more detailed explanation of the types of financial statements prepared. The Commonwealth’s annual budget is prepared principally on a cash basis and represents departmental appropriations as authorized by the General Assembly. Under the cash basis of accounting, revenues and other financial resources are recognized in the accounting period in which cash is received; expenditures and other financial uses are recognized when cash is disbursed. The section of the CAFR entitled “Required Supplementary Information” reconciles the budgetary (i.e., cash) presentation to the financial statements. The Preliminary Annual Report for the year ended June 30, 2017, which is comprised of cash basis financial statements, is presented on an unaudited basis, and is available at www.doa.virginia.gov. The audited CAFR for the fiscal year ended June 30, 2017 will be available on December 15, 2017.
Summary of General Fund Revenues, Expenditures and Changes in Fund Balance The following tables summarize the Commonwealth's General Fund revenues, expenditures and fund balance on a cash basis for fiscal years 2013 through 2017 and compares the final budget numbers to actual numbers. The General Fund balance, as shown on page B-5, decreased by $138.6 million in fiscal year 2017, a decrease of 9.37 percent from fiscal year 2016. Overall tax revenues increased by 3.5 percent from fiscal year 2016 to fiscal year 2017. Individual and Fiduciary Income tax revenues increased by 4.0 percent. Corporation Income tax collections increased by 8.1 percent from fiscal year 2016 to fiscal year 2017. Other tax collections, which includes Deeds, Contracts, Wills and Suits; Alcoholic Beverage Sales; Tobacco Products; Estate and Other Taxes overall increased by 3.7 percent from fiscal year 2016 to fiscal year 2017. Tax revenue decreases occurred in the form of a 2.7 percent decrease in Communication Sales and Use tax collections. Overall revenue increased by 3.4 percent and non-tax revenues increased by 1.3 percent. Overall expenditures increased by 3.4 percent in fiscal year 2017, compared to a 5.1 percent increase in fiscal year 2016. Individual and family service expenditures increased by $312.6 million, or 5.0 percent, and education expenditures increased by $355.6 million, or 4.4 percent. General government expenditures decreased $108.8 million or 4.4 percent. Of the $1.3 billion fund balance as of June 30, 2017, $548.8 million was restricted as the Revenue Stabilization Fund (the Stabilization “Fund”). During fiscal year 2017, a withdrawal of $294.7 million was made from the Stabilization Fund. The Stabilization Fund is segregated from the General Fund and can be used only for constitutionally authorized purposes. Virginia law directs that the Stabilization Fund be included as a component of the General Fund only for financial reporting purposes. Under the provisions of Article X, Section 8 of the Constitution of Virginia, a deposit of $605.6 million was made during fiscal year 2017 based on fiscal year 2015 revenue collections. A deposit in 2018 is not required based on fiscal year 2016 revenue collections. Also, no deposit is required based on fiscal year 2017 revenue collections. The required deposits are reported as restricted components of fund balance. Pursuant to the constitutional amendment of Article X, Section 8, effective January 1, 2011, the amount on deposit cannot exceed 15 percent of the Commonwealth’s average annual tax revenues derived from taxes on income and retail sales for the preceding three fiscal years. As of June 30, 2017, the Constitutional maximum is $2.5 billion. Section 2.2-1829(b) of the Code of Virginia, requires that if certain revenue criteria are met, then an additional deposit to the Stabilization Fund equal to at least one-half the mandatory deposit must be included in the Governor’s budget. The Code further requires that any such additional deposits to the Stabilization Fund shall be included in the Governor's budget recommendations only if the estimate of General Fund revenues for the fiscal year in which the deposit is to be made is at least five percent greater than the actual General Fund revenues for the immediately preceding fiscal year. These conditions were not met for fiscal year 2017.

B-5
SUMMARY OF GENERAL FUND REVENUES, EXPENDITURES AND
CHANGES IN FUND BALANCE – CASH BASIS (in thousands)
2013 2014 2015 2016 2017* Revenues: Taxes Individual and Fiduciary Income 11,339,966 11,253,348 12,328,675 12,555,624 13,052,887 State Sales and Use 3,441,195 3,400,486 3,587,849 3,651,400 3,720,552 Corporation Income 796,728 757,491 831,907 764,948 826,961 Communications Sales and Use 427,262 422,823 417,209 406,707 395,733 Deeds, Contracts, Wills and Suits 388,633 318,998 354,461 377,699 403,459 Premiums of Insurance Companies 262,242 320,421 300,641 339,081 340,910 Alcoholic Beverage Sales 195,192 199,225 207,802 217,594 222,354 Tobacco Products 187,874 180,626 178,996 178,741 171,198 Estate - 196 98 222 8,202 Public Service Corporations 96,222 98,156 98,537 92,586 95,084 Other Taxes 18,036 28,760 30,251 32,107 31,048 Total Taxes 17,153,350 16,980,530 18,336,426 18,616,709 19,268,388
Rights and Privileges 76,931 79,085 78,654 84,628 85,919 Sales of Property and Commodities 25,477 30,682 28,930 42,671 31,515 Assessments and Receipts for Support of Special Services 858 931 1,582 3,539 4,008 Institutional Revenue 37,210 36,143 38,240 36,819 36,137 Interest, Dividends, Rents 72,958 78,333 54,626 57,680 61,130 Fines, Forfeitures, Court Fees, Penalties, and Escheats 216,788 211,512 216,698 222,039 222,600 Federal Grants and Contracts 6,354 9,454 6,416 3,868 6,720 Receipts from Cities, Counties, and Towns 15,813 16,318 16,533 16,951 18,360 Private Donations, Gifts and Contracts 439 438 775 364 476 Tobacco Master Settlement 74,010 48,693 48,207 47,664 49,019 Other 238,148 190,636 158,807 225,342 235,237 Total Revenues 17,918,336 17,682,755 18,985,894 19,358,274 20,019,509 Expenditures: General Government 2,173,327 2,215,179 2,273,965 2,497,121 2,388,305 Education 7,587,805 7,755,863 7,928,734 8,095,292 8,450,900 Transportation 172 773 836 328 236 Resources and Economic Development 389,221 406,052 413,053 413,406 445,102 Individual and Family Services 5,383,507 5,525,897 5,765,208 6,238,651 6,551,237 Administration of Justice 2,443,464 2,519,888 2,586,618 2,678,980 2,740,411 Capital Outlay 6,274 10,663 6,510 26,010 44,488 Total Expenditures 17,983,770 18,434,315 18,974,924 19,949,788 20,620,679 Revenues Over (Under) Expenditures (65,434) (751,560) 10,970 (591,514) (601,170) Other Financing Sources (Uses): Transfers In 712,400 770,542 866,913 775,363 904,255 Transfers Out (509,749) (490,310) (468,029) (464,559) (441,670) Total Other Financing Sources (Uses) 202,651 280,232 398,884 310,804 462,585 Revenues and Other Sources Over (Under) Expenditures and Other Uses 137,217 (471,328) 409,854 (280,710) (138,585) Fund Balance, July 1: Restricted 707,401 940,906 943,491 1,082,618 855,001 Committed 518,619 556,076 365,220 328,791 429,390 Assigned 457,392 323,647 40,590 347,746 194,054 Total Fund Balance, July 1, as restated 1,683,412 1,820,629 1,349,301 1,759,155 1,478,445 Fund Balance, June 30: Restricted 940,906 943,491 1,082,618 855,001 557,102 Committed 556,076 365,220 328,791 429,390 514,831 Assigned 323,647 40,590 347,746 194,054 267,927 Total Fund Balance, June 30 $1,820,629 $1,349,301 $1,759,155 $1,478,445 $1,339,860
*Preliminary and Unaudited. Source: Department of Accounts.

B-6
SUMMARY OF GENERAL FUND REVENUES, EXPENDITURES AND
CHANGES IN FUND BALANCE BUDGET AND VARIANCE OF ACTUAL-BUDGETARY BASIS
(in thousands)
Fiscal Year Ended June 30,
2013 2014
Variance of Variance of
Actual Actual
Final Favorable Final Favorable
Budget (Unfavorable) Budget (Unfavorable)
Revenues:
Taxes
Individual and Fiduciary Income $11,092,600 $247,366 $11,669,100 ($415,752)
State Sales and Use 3,471,616 (30,421) 3,414,100 (13,614)
Corporation Income 820,900 (24,172) 769,900 (12,409)
Communications Sales and Use 440,000 (12,738) 440,000 (17,177)
Public Service Corporations 95,300 922 97,700 456
Premiums of Insurance Companies 255,600 6,642 289,400 31,021
Other [1] 743,309 46,426 786,805 (59,000)
Total Taxes $16,919,325 $234,025 $17,467,005 ($486,475)
Rights and Privileges 79,663 (2,732) 89,910 (10,825)
Institutional Revenue 41,668 (4,458) 41,485 (5,342)
Interest, Dividends, Rents and Other Investment Income 68,064 4,894 50,572 27,761
Tobacco Master Settlement 52,733 21,277 49,727 (1,034)
Other [2] 413,991 89,886 437,459 22,512
Total Revenues $17,575,444 $342,892 $18,136,158 ($453,403)
Expenditures: General Government 2,360,523 187,196 2,272,147 56,968
Education 7,670,879 83,074 7,823,406 67,543
Transportation 172 - 1,312 539
Resources and Economic Development 512,266 123,045 460,327 54,275
Individual and Family Services 5,488,489 104,982 5,655,699 129,802
Administration of Justice 2,477,411 33,947 2,531,750 11,862
Capital Outlay 36,297 30,023 32,047 21,384
Total Expenditures $18,546,037 $562,267 $18,776,688 $342,373
Revenues Over (Under) Expenditures ($970,593) $905,159 ($640,530) ($111,030)
Other Financing Sources (Uses): Transfers In 699,253 13,147 745,413 25,129
Transfers Out (493,024) (16,725) (473,579) (16,731)
Total Other Financing Sources (Uses) $206,229 ($3,578) $271,834 $8,398
Revenues and Other Sources Over (Under) Expenditures and Other Uses (764,364) 901,581 (368,696) (102,632)
Fund Balance, July 1 1,683,412 - 1,820,629 -
Fund Balance, June 30 $919,048 $901,581 $1,451,933 ($102,632)
[1] Note that under Taxes above, certain line items have been combined into the “Other” line item; they are: “Deeds, Contracts, Wills and Suits,” “Alcoholic Beverage Sales”, “Tobacco Products”, “Estate” and “Other”. The reason for this is consistency with the CAFR line items. [2] Note that under Revenues above, certain line items have been combined into the “Other” line item; they are: “Sales of Property and Commodities,” “Assessments and Receipts for Support of Special Services,” “Fines, Forfeitures, Court Fees, Penalties, and Escheats,” “Federal Grants and Contracts,” “Receipts from Cities, Counties, and Towns”, “Private Donations, Gifts, and Contracts” and “Other”. The reason for this is consistency with the CAFR line Items. Source: Department of Accounts.

B-7
Fiscal Year Ended June 30,
2015 2016 2017* Variance of Variance of Variance of Actual Actual Actual Final Favorable Final Favorable Final Favorable Budget (Unfavorable) Budget (Unfavorable) Budget (Unfavorable)
$11,816,300 $512,375 $12,823,000 ($267,376) $12,913,800 $139,087 3,568,100 19,749 3,734,400 (83,000) 3,752,210 (31,658) 840,900 (8,993) 722,800 42,148 794,200 32,761 425,000 (7,791) 419,000 (12,293) 407,000 (11,267) 96,800 1,737 98,900 (6,314) 97,800 (2,716) 320,500 (19,859) 322,700 16,381 344,100 (3,190) 733,367 38,241 808,478 (2,115) 827,850
8,411
$17,800,967 535,459 $18,929,278 ($312,569) $19,136,960 $131,428
87,192 (8,538) 85,179 (551) 100,561 (14,642)
41,796 (3,556) 46,422 (9,603) 45,508 (9,371)
62,629 (8,003) 47,089 10,591 62,700 (1,570)
51,086 (2,879) 47,962 (298) 48,000 1,019
411,136 18,605 453,470 61,304 470,259 48,657
$18,454,806 $531,088 $19,609,400 ($251,126) $19,863,988 $155,521
2,334,088 60,123 2,571,068 73,947 2,474,935 86,630
7,977,968 49,234 8,142,706 47,414 8,503,248 52,348
2,367 1,531 363 35 263 27
465,224 52,171 475,598 62,192 494,179 49,077
5,827,264 62,056 6,291,377 52,726 6,589,797 38,560
2,608,951 22,333 2,700,068 21,088 2,763,740 23,329
31,380 24,870 110,556 84,546 101,151 56,663
$19,247,242 $272,318 $20,291,736 $341,948 $20,927,313 $306,634
($792,436) 803,406 ($682,336) $90,822 ($1,063,325) $462,155
864,788 2,125 762,600 12,763 878,536 25,719
(431,678) (36,351) (460,976) (3,583) (440,560) (1,110)
433,110 ($34,226) 301,624 9,180 437,976 24,609
(359,326) 769,180 (380,712) 100,002 (625,349) 486,764
1,349,301 - 1,759,155 - 1,478,445 -
$989,975 $769,180 $1,378,443 $100,002 $853,096 $486,764
*Preliminary and Unaudited. Source: Department of Accounts.

B-8
General Fund Revenues Of total fiscal year 2017 tax revenue, 97.3 percent was derived from six major taxes imposed by the Commonwealth: Individual and Fiduciary Income Taxes, State Sales and Use Taxes, Corporate Income Taxes, Communications Sales and Use Taxes, Taxes on Deeds, Contracts, Wills and Suits and Taxes on Premiums of Insurance Companies. Individual and fiduciary income taxes are the principal component of General Fund revenues. These revenues support a number of government functions, primarily education, individual and family services, public safety and general government. General Fund revenues are available for payment of debt service obligations of the Commonwealth. Individual and Fiduciary Income Taxes: (67.7 percent of Total Taxes in fiscal year 2017) The individual and fiduciary income tax applies to income derived by resident and non-resident individuals and fiduciaries. The tax is based on a taxpayer's federal adjusted gross income with modifications, if applicable, and with deductions for personal exemptions and standard or itemized deductions. The following tax rates are applicable to net taxable income for the taxable year 2017:
PERSONAL TAX RATES
Taxable Income Rate Of Excess Over
$0 – $3,000 2.00% $3,001 – $5,000 $ 60 + 3.00% $ 3,000 $5,001 – $17,000 $120 + 5.00% $ 5,000 Over $17,000 $720 + 5.75% $17,000
Source: Department of Taxation. An individual income tax return for a taxable year must be filed by May 1 of the following year. Prepayment of the tax on most earnings is accomplished through withholdings by employers. Employers must transfer withholding taxes to the Department of Taxation quarterly, monthly or, in some cases, eight times a month. Individual income taxpayers are required to file a declaration of estimated tax for any income not subject to withholding and pay one-fourth of such estimated tax in quarterly installments. State Sales and Use Taxes: (19.3 percent of Total Taxes in fiscal year 2017) A sales and use tax is imposed at the rate of 5.3 percent on the sale, rental, lease or storage for use or consumption of tangible personal property except food for home consumption. Food for home consumption is taxed at a rate of 2.5 percent. There are certain exclusions from the tax, including motor vehicles, aircraft and large watercraft, prescription medicines. One percent of the 5.3 percent sales tax and of the 2.5 percent sales tax on food for home consumption is distributed to localities on the basis of school age population for use in public education. Retail sellers collect the sales and use taxes from customers at the time of sale. Sellers are required to remit collected taxes either monthly or quarterly. Corporation Income Taxes: (4.3 percent of Total Taxes in fiscal year 2017) The Commonwealth imposes a 6 percent income tax on the net income of all corporations having income from sources in the Commonwealth, whether domestic or foreign, with the exception of insurance companies, inter-insurance exchanges, state and national banks, banking associations, companies doing business on a mutual basis, credit unions and non-profit corporations. Commonwealth taxable income is based on federal income, with modifications. If a corporation is engaged in multi-state activities, and if its income is taxable both by the Commonwealth and another state, the Commonwealth permits the corporation to apportion its taxable income (other than dividends which are allocated according to the commercial domicile of the taxpayer) according to a three factor formula comprised of property, payroll and sales. A corporation income tax return must be filed on or before the 15th day of the 4th month following the close of the corporation's taxable year. Corporations are required to make a declaration of estimated tax directly to the Department of Taxation and pay such estimated tax in such taxable year.
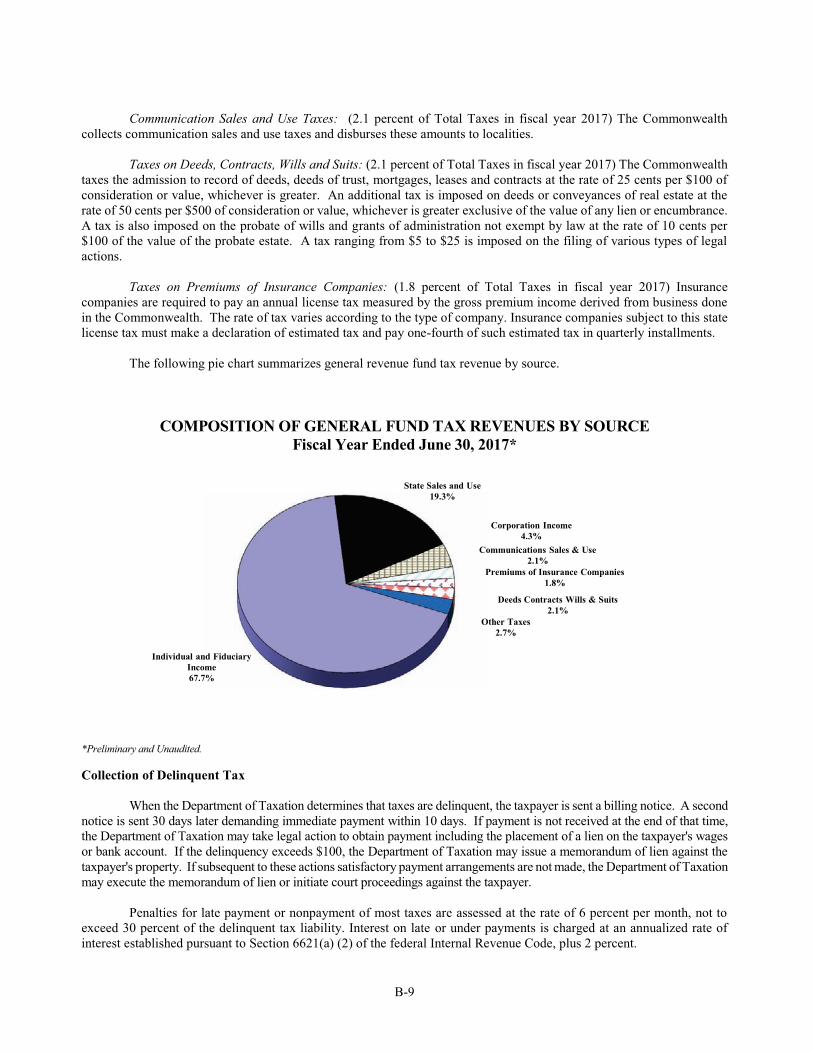
B-9
Communication Sales and Use Taxes: (2.1 percent of Total Taxes in fiscal year 2017) The Commonwealth collects communication sales and use taxes and disburses these amounts to localities. Taxes on Deeds, Contracts, Wills and Suits: (2.1 percent of Total Taxes in fiscal year 2017) The Commonwealth taxes the admission to record of deeds, deeds of trust, mortgages, leases and contracts at the rate of 25 cents per $100 of consideration or value, whichever is greater. An additional tax is imposed on deeds or conveyances of real estate at the rate of 50 cents per $500 of consideration or value, whichever is greater exclusive of the value of any lien or encumbrance. A tax is also imposed on the probate of wills and grants of administration not exempt by law at the rate of 10 cents per $100 of the value of the probate estate. A tax ranging from $5 to $25 is imposed on the filing of various types of legal actions. Taxes on Premiums of Insurance Companies: (1.8 percent of Total Taxes in fiscal year 2017) Insurance companies are required to pay an annual license tax measured by the gross premium income derived from business done in the Commonwealth. The rate of tax varies according to the type of company. Insurance companies subject to this state license tax must make a declaration of estimated tax and pay one-fourth of such estimated tax in quarterly installments. The following pie chart summarizes general revenue fund tax revenue by source.
COMPOSITION OF GENERAL FUND TAX REVENUES BY SOURCE Fiscal Year Ended June 30, 2017*
*Preliminary and Unaudited. Collection of Delinquent Tax When the Department of Taxation determines that taxes are delinquent, the taxpayer is sent a billing notice. A second notice is sent 30 days later demanding immediate payment within 10 days. If payment is not received at the end of that time, the Department of Taxation may take legal action to obtain payment including the placement of a lien on the taxpayer's wages or bank account. If the delinquency exceeds $100, the Department of Taxation may issue a memorandum of lien against the taxpayer's property. If subsequent to these actions satisfactory payment arrangements are not made, the Department of Taxation may execute the memorandum of lien or initiate court proceedings against the taxpayer. Penalties for late payment or nonpayment of most taxes are assessed at the rate of 6 percent per month, not to exceed 30 percent of the delinquent tax liability. Interest on late or under payments is charged at an annualized rate of interest established pursuant to Section 6621(a) (2) of the federal Internal Revenue Code, plus 2 percent.
Individual and Fiduciary Income67.7%
State Sales and Use19.3%
Corporation Income4.3%
Communications Sales & Use2.1%
Premiums of Insurance Companies1.8%
Deeds Contracts Wills & Suits2.1%
Other Taxes2.7%

B-10
The following table presents total outstanding collectible tax receivables for all tax types at the end of fiscal years 2013 through 2017:
OUTSTANDING COLLECTIBLE TAX RECEIVABLES Fiscal Year
Ended June 30, Amount 2012 ............................................................................ 489,381,022* 2013 ............................................................................ 543,912,785* 2014 ............................................................................. 552,666,423* 2015 ............................................................................ 574,351,971* 2016 ............................................................................. 597,103,392* 2017 ............................................................................. 612,943,746*
*Preliminary and Unaudited. Amount does not include non-billed or uncollectible receivables. Source: Department of Taxation.
General Fund Expenditures General Fund expenditures relate to resources used for those services traditionally provided by a state government, which is not accounted for in any other fund. These services include general government, legislative, public safety, judicial, health and mental health, human resources, licensing and regulation, and primary and secondary education (See table on page B-5). Education: (41.0 percent of Total Expenditures in fiscal year 2017) Expenditures for education support individuals in developing knowledge, skills and cultural awareness, including elementary and secondary education instruction, supervision and assistance. Individual and Family Services: (31.8 percent of Total Expenditures in fiscal year 2017) Expenditures for individual and family services support programs to benefit the economic, social and physical well-being of the individual and family, including disease research, control and prevention. Administration of Justice: (13.3 percent of Total Expenditures in fiscal year 2017) Expenditures for administration of justice relate to the activities of the civil and criminal justice systems. These activities encompass the apprehension, trial, punishment and rehabilitation of law violators, and the deterrence and detection of crime. General Government: (11.6 percent of Total Expenditures in fiscal year 2017) General government expenditures support the general activities of state, regional and local levels of government. These activities include financial assistance to localities, enactment of legislative policy, intergovernmental projects, and distribution of sales and use taxes to localities, and payments to localities pursuant to the Personal Property Tax Relief Act of 1998. Resources and Economic Development: (2.2 percent of Total Expenditures in fiscal year 2017) Resources and economic development expenditures support activities to develop the Commonwealth's economic base, including alternative natural resources, and to regulate this base with regard to the public interest of the Commonwealth. Capital Outlay & Transportation: (0.2 percent of Total Expenditures in fiscal year 2017) Expenditures for capital outlay relate to the construction and renovation of state-owned buildings and facilities. Transportation expenditures relate to the movement by road, water or air of people, goods and services, and the regulation thereof.
The following pie chart summarizes the general fund expenditures by source:

B-11
DISTRIBUTION OF GENERAL FUND EXPENDITURES BY SOURCE Fiscal Year Ended June 30, 2017*
*Preliminary and Unaudited General Fund Balance The Commonwealth's General Fund unreserved fund balance for the last ten fiscal years is shown below:
UNRESERVED GENERAL FUND ENDING BALANCE (in thousands)
Fiscal Year Cash Basis Modified Accrual Basis
2008 1,091,882 78,468
2009 160,986 -927,977
2010 491,244 -1,069,071
2011 * *
2012 * *
2013 * *
2014 * *
2015 * *
2016 * *
2017 * * *See 2013, 2014, 2015, 2016 and 2017 below for an explanation as to how GASB 54 has required a change in the unreserved General Fund balance classification. Refer to Fund Balances Chart as set forth on page B-5. Source: Department of Accounts.
Education41.0%
Individual and Family Services31.8%
Administration of Justice13.3%
General Government11.6%
Resources and Economic Development
2.2%
Capital Outlay and Transportation
0.2%

B-12
2013. General Fund revenues and other sources exceeded expenditures and other uses by $137.2 million in fiscal year 2013. Total revenues increased by 4.8 percent and total expenditures increased by 6.5 percent. Transfers to the General Fund decreased by 10.9 percent while transfers out decreased by 17.9 percent. Transfers to and from Component Units in fiscal year 2013 are reported as expenditures and revenues in accordance with GASB Statement No. 34. With the implementation of GASB No. 54, the fund equity classifications of Reserved and Unreserved have been changed to Restricted, Committed, Assigned, and Unassigned. Restricted fund balances are those that have a restriction by the Constitution of Virginia or from a party external to the Commonwealth. Committed fund balances represent amounts that have been legislatively mandated for a specific purpose. Assigned fund balances represent amounts the Commonwealth has identified for a specific purpose, but for which the use is not legislatively mandated. Unassigned fund balances are those that have not been restricted, committed, or assigned to specific purposes. Due to statutory requirements, any unassigned balances in the General Fund on a cash basis are automatically committed for transfer to the Transportation Trust Fund and for nonrecurring expenditures. The table on page B-5 reflects the Fund Balance as of June 30, 2013 in these classifications. 2014. General Fund revenues and other sources were less than expenditures and other uses by $471.3 million in fiscal year 2014. Total revenues decreased by 1.3 percent and total expenditures increased by 2.5 percent. Transfers to the General Fund increased by 8.2 percent while transfers out decreased by 3.8 percent. Transfers to and from Component Units in fiscal year 2014 are reported as expenditures and revenues in accordance with GASB Statement No. 34. With the implementation of GASB No. 54, the fund equity classifications of Reserved and Unreserved have been changed to Restricted, Committed, Assigned, and Unassigned. Restricted fund balances are those that have a restriction by the Constitution of Virginia or from a party external to the Commonwealth. Committed fund balances represent amounts that have been legislatively mandated for a specific purpose. Assigned fund balances represent amounts the Commonwealth has identified for a specific purpose, but for which the use is not legislatively mandated. Unassigned fund balances are those that have not been restricted, committed, or assigned to specific purposes. Due to statutory requirements, any unassigned balances in the General Fund on a cash basis are automatically committed for transfer to the Transportation Trust Fund and for nonrecurring expenditures. The table on page B-5 reflects the Fund Balance as of June 30, 2014 in these classifications. 2015. General Fund revenues and other sources exceeded expenditures and other uses by $409.9 million in fiscal year 2015. Total revenues increased by 7.4 percent and total expenditures increased by 2.9 percent. Transfers to the General Fund increased by 12.5 percent while transfers out decreased by 4.5 percent. Transfers to and from Component Units in fiscal year 2015 are reported as expenditures and revenues in accordance with GASB Statement No. 34. With the implementation of GASB No. 54, the fund equity classifications of Reserved and Unreserved have been changed to Restricted, Committed, Assigned, and Unassigned. Restricted fund balances are those that have a restriction by the Constitution of Virginia or from a party external to the Commonwealth. Committed fund balances represent amounts that have been legislatively mandated for a specific purpose. Assigned fund balances represent amounts the Commonwealth has identified for a specific purpose, but for which the use is not legislatively mandated. Unassigned fund balances are those that have not been restricted, committed, or assigned to specific purposes. Due to statutory requirements, any unassigned balances in the General Fund on a cash basis are automatically committed for transfer to the Transportation Trust Fund and for nonrecurring expenditures. The table on page B-5 reflects the Fund Balance as of June 30, 2015 in these classifications. 2016. General Fund revenues and other sources were less than expenditures and other uses by $280.7 million in fiscal year 2016. Total revenues increased by 2.0 percent and total expenditures increased by 5.1 percent. Transfers to the General Fund decreased by 10.6 percent while transfers out decreased by 0.7 percent. Transfers to and from Component Units in fiscal year 2016 are reported as expenditures and revenues in accordance with GASB Statement No. 34. With the implementation of GASB No. 54, the fund equity classifications of Reserved and Unreserved have been changed to Restricted, Committed, Assigned, and Unassigned. Restricted fund balances are those that have a restriction by the Constitution of Virginia or from a party external to the Commonwealth. Committed fund balances represent amounts that have been legislatively mandated for a specific purpose. Assigned fund balances represent amounts the Commonwealth has identified for a specific purpose, but for which the use is not legislatively mandated. Unassigned fund balances are those that have not been restricted, committed, or assigned to specific purposes. Due to statutory requirements, any unassigned balances in the General Fund on a cash basis are automatically committed for transfer to the Transportation Trust Fund and for nonrecurring expenditures. The table on page B-5 reflects the Fund Balance as of June 30, 2016 in these classifications.

B-13
2017. Preliminary and Unaudited. General Fund revenues and other sources were less than expenditures and other uses by $138.6 million in fiscal year 2017. Total revenues increased by 3.4 percent and total expenditures increased by 3.4 percent. Transfers to the General Fund increased by 16.6 percent while transfers out decreased by 5.0 percent. Transfers to and from Component Units in fiscal year 2017 are reported as expenditures and revenues in accordance with GASB Statement No. 34. With the implementation of GASB No. 54, the fund equity classifications of Reserved and Unreserved have been changed to Restricted, Committed, Assigned, and Unassigned. Restricted fund balances are those that have a restriction by the Constitution of Virginia or from a party external to the Commonwealth. Committed fund balances represent amounts that have been legislatively mandated for a specific purpose. Assigned fund balances represent amounts the Commonwealth has identified for a specific purpose, but for which the use is not legislatively mandated. Unassigned fund balances are those that have not been restricted, committed, or assigned to specific purposes. Due to statutory requirements, any unassigned balances in the General Fund on a cash basis are automatically committed for transfer to the Transportation Trust Fund and for nonrecurring expenditures. The table on page B-5 reflects the Fund Balance on a preliminary and unaudited basis as of June 30, 2017 in these classifications.
Nongeneral Fund Revenues Nongeneral fund revenues consist of all revenues not accounted for in the General Fund. Included in this category are special taxes and user charges earmarked for specific purposes, the majority of institutional revenues and revenues from the sale of property and commodities, and receipts from the federal government. Approximately 50 percent of the nongeneral revenues are accounted for by grants and donations from the federal government, motor vehicle taxes and institutional revenues. Institutional revenues consist primarily of fees and charges collected by institutions of higher education, medical and mental hospitals and correctional institutions. Motor vehicle related taxes include the motor vehicle fuel tax, motor vehicle sales and use tax, oil excise tax, driver's license fee, title registration fee, motor vehicle registration fee and other miscellaneous revenues. Below is a summary of revenues and expenditures for the largest of the Commonwealth's Special Revenue Funds, the Commonwealth Transportation Fund, prepared according to generally accepted accounting principles.
COMMONWEALTH TRANSPORTATION FUND (in thousands)
Fiscal Year Ended June 30,
2012
2013
2014
2015
2016
Total revenues $3,871,439 $4,306,638 $4,988,575 $5,422,649 $5,533,920
Total expenditures 4,488,603 4,633,673 5,154,523 5,438,605 5,902,033
Revenues over (under) expenditures (617,164) (327,035) (165,948) (15,956) (368,113)
Other sources (uses) net 929,228 1,508 27,722 15,828 76,728
Revenue and other sources (uses) over
(under) expenditures 312,064 325,527 (138,226) (128) (291,385)
Beginning fund balance (adjusted) 2,434,530 2,739,308 2,402,970 2,271,235 2,219,801
Ending fund balance $2,746,594 $2,413,781 $2,264,744 $2,271,107 $1,928,416
Notes: * 2017 Data not yet available. Included in the Commonwealth Transportation Fund (formerly Highway Maintenance and Construction Fund) is the activity of the Highway
Maintenance and Operating Fund and the Transportation Trust Fund. The Transportation Trust Fund was created in September 1986 during a special session of the Virginia General Assembly.
Source: Reports of the Comptroller, 2012-2016.

B-14
2016 Appropriation Act
On December 17, 2015, Governor McAuliffe presented the Budget Bill for the 2016-2018 biennium that begins July 1, 2016 (House Bill/Senate Bill 30) (the “2016 Budget Bill”). The introduced 2016 Budget Bill focused on building the New Virginia Economy and was developed with the following core objectives:
� Investing in the Future
� Creating 21st Century Jobs
� Creating healthier communities
� Creating stronger, safer communities
� Maintaining prudent and sound government
The introduced 2016 Budget Bill appropriated over $109 billion from all fund sources for total state government operations, and would have left an unappropriated general fund balance on June 30, 2018 of $17.6 million.
The Governor’s introduced 2016 budget bill was considered by the 2016 Session of the General Assembly which convened on January 14, 2016. The General Assembly adjourned on March 11, 2016 offering their recommendations for additional amendments to the bill. At the April 20, 2016 reconvened session, the Governor offered executive amendments that were considered and where they agreed, folded into the budget for the 2016-2018 biennium. On May 20th, the Governor signed the 2016 Appropriation Act with one line-item veto. The 2016 Appropriation Act, also known as Chapter 780, 2016 Acts of Assembly, was effective as of July 1, 2016.
Chapter 780 provides an additional $605.6 million to the Revenue Stabilization Fund in fiscal year 2017. With this deposit, the Revenue Stabilization Fund was expected to reach a balance of over $845 million. The top ten general fund spending changes included in Chapter 780 are as follows:
� Medicaid utilization and inflation increase $794.7 million
� Revenue Stabilization Fund deposit $605.6 million
� Update costs of the K12 Standards of Quality (SOQ) $398.1 million
� Salary increases for state supported public employees $346.3 million
� Lottery Proceeds Fund Per Pupil Allocations $163.4 million
� Increased funding for state employee health insurance
program
$137.3 million
� Provide debt service for projects and equipment $107.8 million
� Deposit funding to the Water Quality Improvement
Fund and Virginia Natural Resources Commitment
Fund (from the fiscal year 2015 surplus)
$61.7 million
� Fund teacher retirement, retiree health care credit, and
group life contributions at the full rates
$55.1 million
Chapter 780 assumed a general fund balance at the end of the 2016-2018 biennium of $21.2 million.
The table on the following page summarizes Chapter 780 (2016 Appropriation Act).

B-15
2016 Appropriation Act (Chapter 780, 2016 Acts of Assembly)
FY 2017 FY 2018 Total GENERAL FUND
Revenue
Unrestricted Balance June 30, 2016 $265,336,321 $0 $265,336,321
Additions to balance 680,905,000 (500,000) 680,405,000
Official revenue estimate 18,902,391,274 19,633,121,954 38,535,513,228
Transfers 577,749,718 596,782,957 1,174,532,675
Total general fund resources available for appropriation $20,426,382,313 $20,229,404,911 $40,655,787,224
Appropriations
Legislative $80,253,077 $80,279,687 $160,532,764
Judicial 484,511,320 485,295,817 969,807,137
Executive 19,772,741,498 19,719,208,059 39,491,949,557
Independent Agencies 1,233,841 251,292 1,485,133
Sub-total operating expenses $20,338,739,736 $20,285,034,855 $40,623,774,591
Capital Outlay 10,800,000 0 10,800,000
Total appropriations $20,349,539,736 $20,285,034,855 $40,634,574,591
NONGENERAL FUNDS
Revenue
Balance June 30, 2016 $4,728,561,193 0 $4,728,561,193
Official revenue estimate 27,087,129,137 27,422,707,612 54,509,836,749
Lottery Proceeds Fund 561,527,170 541,231,250 1,102,758,420
Internal Service Fund 2,027,184,365 2,127,218,076 4,154,402,441
Bond proceeds 342,336,000 99,900,000 442,236,000
Total nongeneral fund revenue available for appropriation $34,746,737,865 $30,191,056,938 $64,937,794,803
Appropriations
Legislative $3,189,351 $3,189,532 $6,378,883
Judicial 33,152,496 33,155,404 66,307,900
Executive Department 30,905,244,006 30,868,523,176 61,773,767,182
Independent Agencies 568,743,656 599,250,578 1,167,994,234
Sub-total operating expenses 31,510,329,509 31,504,118,690 63,014,448,199
Capital Outlay 495,730,700 151,146,000 646,876,700
Total appropriations $32,006,060,209 $31,655,264,690 $63,661,324,899 Source: Department of Planning and Budget.

B-16
2017 Amendments to the 2016 Appropriation Act (2017 Appropriation Act)
On December 16, 2016, Governor McAuliffe presented his proposed amendments to the 2016 Appropriation Act, impacting the remainder of the 2016-2018 biennium.
After the adoption of Chapter 780, it became apparent that actual general fund revenue collections for fiscal year 2016 were lower than anticipated. At the end of fiscal year 2016, revenue collections finished $279.3 million below forecast. As a result of this, the Governor directed the Secretary of Finance to conduct a reforecast of revenues. This interim revenue reforecast was released on August 26, 2016, reducing revenues by $1.2 billion for fiscal years 2017 and 2018 from the official forecast included in Chapter 780. When combined with the fiscal year 2016 revenue shortfall, the total budget revenue shortfall was estimated to be $1.5 billion. Subsequent to the August interim forecast, the normal revenue estimating process which was concluded in November 2016, yielded an outlook that while remaining conservative, resulted in more estimated revenue than that originally forecasted in August. Specifically, the November forecast showed a reduction of revenue of $784.9 million over the biennium when compared to Chapter 780 as opposed to the $1.2 billion reduction assumed in August.
The Governor’s introduced 2017 amended budget bill was considered by the 2017 Session of the General Assembly which convened on January 11, 2017. The General Assembly adjourned on February 25, 2017 offering their recommendations for additional amendments to the bill. At the April 5, 2017 reconvened session, the Governor offered executive amendments that were considered and where they agreed, folded into the amended budget for the 2016-2018 biennium. On April 28th, the Governor signed the 2017 Appropriation Act with six line-item vetoes. The 2017 Appropriation Act, also known as Chapter 836, 2017 Acts of Assembly, became effective upon the Governor’s signature on April 28, 2017.
General fund appropriation changes in the 2017 Appropriation Act focus on a) reducing general fund spending as a result of reduced projected revenue, b) addressing the spending needs of mandated and formulaic programs, c) addressing emergent issues, such as growing problems in mental health and d) providing compensation adjustments to state supported public employees.
General funds savings were included in the Governor’s introduced amendments as follows: $99.4 million in savings from agency submitted across-the-board savings strategies, $76.1 million in reductions to state supported institutions of higher education, $347.2 million from the removal of compensation and salary increase funding included in Chapter 780, and $283.8 million in targeted reductions to various programs. While the General Assembly restored some savings proposed by the Governor and included additional savings not included in the Governor’s proposed amendments, the overall change in general fund savings in the 2017 Appropriation Act did not differ significantly from the introduced version of the bill.
In addition to general fund appropriation savings, the 2017 Appropriation Act also includes various increases in resources, including $567.2 million in withdrawals from the revenue stabilization fund, $133.5 million in prior year general fund capital balances, $89.5 million resulting from a Tax Amnesty program, $47.9 million from changes in the accelerated sales tax, $12.0 million to tighten sales tax nexus rules, $9.9 million to limit the return on Historic Rehabilitation tax credits, $13.5 million in various other revenues, and $112.1 million in various transfers from nongeneral funds to the general fund.
Amendments for mandated and formulaic programs, emergent issues, and public employee compensation make up the majority of general fund increases included in the 2017 Appropriation Act. Major spending amendments in these areas include the following:
� Cost of Medicaid forecast updated .................................................................................................... $247.8 million
� Compensation increase for state supported public employees .......................................................... $155.2 million
� Projected expenditure and caseload growth for Children’s Services Act services ............................. $85.7 million
� Provide appropriation for Revenue Cash Reserve ............................................................................... $35.0 million
� Funding to address issues in mental health system and services ......................................................... $32.2 million
� Increases in inmate medical expenses ................................................................................................. $18.5 million
� UNISYS mainframe transition costs .................................................................................................... $8.6 million
� K-12 enrollment loss assistance ............................................................................................................. $7.3 million
� Provide full inflation funding to nursing facilities ................................................................................. $5.5 million
� Family Access to Medical Insurance Security (FAMIS) forecast changes ........................................... $5.1 million
After general fund resource changes, savings, and spending, the 2017 Appropriation Act resulted in an estimated $8.4 million general fund balance at the end of the biennium.
The table on the following page summarizes the 2017 Appropriation Act.

B-17
(Chapter 836, 2017 Acts of Assembly)
FY 2017 FY 2018 Total GENERAL FUND
Revenue
Unrestricted Balance June 30, 2016 $623,444,000 $0 $623,444,000
Additions to balance 112,929,105 128,219,397 241,148,502
Official revenue estimate 18,560,962,400 19,193,307,390 37,754,269,790
Revenue Stabilization Fund 294,653,279 272,542,500 567,195,779
Transfers 650,847,811 640,823,562 1,291,671,373
Total general fund resources available for appropriation $20,242,836,595 $20,234,892,849 $40,477,729,444
Appropriations
Legislative $80,459,665 $84,307,682 $164,767,347
Judicial 482,917,972 485,607,817 968,525,789
Executive 19,549,120,905 19,784,449,728 39,333,570,633
Independent Agencies 1,233,841 251,292 1,485,133
State Grants to Nonstate Entities - - -
Sub-total operating expenses $20,113,732,383 $20,354,616,519 $40,468,348,902
Capital Outlay 1,000,000 - 1,000,000
Total appropriations $20,114,732,383 $20,354,616,519 $40,469,348,902
NONGENERAL FUNDS
Revenue
Balance June 30, 2016 $4,795,976,243 $0 $4,795,976,243
Official revenue estimate 27,771,433,871 28,300,946,274 56,072,380,145
Lottery Proceeds Fund 599,982,144 546,495,789 1,146,477,933
Internal Service Fund 2,077,103,387 2,174,937,786 4,252,041,173
Bond proceeds 384,882,000 408,626,132 793,508,132
Total nongeneral fund revenue available for appropriation $35,629,377,645 $31,431,005,981 $67,060,383,626
Appropriations
Legislative $3,437,191 $3,338,936 $6,776,127
Judicial 33,219,891 33,261,054 66,480,945
Executive Department 31,454,752,512 $30,936,160,379 62,390,912,891
Independent Agencies 581,743,029 $608,149,455 1,189,892,484
State Grants to Nonstate Entities - - -
Sub-total operating expenses $32,073,152,623 $31,580,909,824 $63,654,062,447
Capital Outlay 539,302,700 494,576,132 1,033,878,832
Total appropriations $32,612,455,323 $32,075,485,956 $64,687,941,279
Source: Department of Planning and Budget.

B-18
INDEBTEDNESS OF THE COMMONWEALTH
Section 9 of Article X of the Constitution of Virginia provides for the issuance of debt by or on behalf of the Commonwealth. Sections 9(a), (b) and (c) provide for the issuance of debt to which the Commonwealth's full faith and credit is pledged and Section 9(d) provides for the issuance of debt not secured by the full faith and credit of the Commonwealth, but which may be supported by and paid from Commonwealth tax collections subject to appropriations by the General Assembly. The Commonwealth may also enter into leases and contracts that are classified on its financial statements as long-term indebtedness. Certain authorities and institutions of the Commonwealth may also issue debt. This section discusses the provisions for and limitations on the issuance of general obligation debt and other types of debt of the Commonwealth and its authorities and institutions.
Section 9(a) Debt Section 9(a) of Article X provides that the General Assembly may contract general obligation debt: (1) to meet certain types of emergencies, (2) to meet casual deficits in the revenue or in anticipation of the collection of revenues of the Commonwealth and (3) to redeem a previous debt obligation of the Commonwealth. Total indebtedness issued pursuant to Section 9(a) (2) shall not exceed 30 percent of an amount equal to 1.15 times the annual tax revenues derived from taxes on income and retail sales, as certified by the Auditor of Public Accounts, for the preceding fiscal year.
Section 9(b) Debt Section 9(b) of Article X provides that the General Assembly may authorize the creation of general obligation debt for capital projects. Such debt is required to be authorized by an affirmative vote of a majority of the members elected to each house of the General Assembly and approved in a statewide referendum. The outstanding amount of such debt is limited in the aggregate to an amount equal to 1.15 times the average annual tax revenues derived from taxes on income and retail sales, as certified by the Auditor of Public Accounts, for the three immediately preceding fiscal years ("9(b) Debt Limit"). Thus, the amount of such debt that can be issued is the 9(b) Debt Limit less the total amount of such debt outstanding ("Debt Margin"). There is an additional 9(b) debt restriction on the amount of such debt that the General Assembly may authorize in any year. The additional authorization restriction is limited to 25% of the 9(b) Debt Limit less any 9(b) debt authorized in the current and prior three fiscal years. The phrase "taxes on income and retail sales" is not defined in the Constitution or by statute. The record made in the process of adopting the Constitution, however, suggests an intention to include only income taxes payable by individuals, fiduciaries and corporations and the state sales and use tax.
Section 9(c) Debt Section 9(c) of Article X provides that the General Assembly may authorize the creation of general obligation debt for revenue producing capital projects for executive branch agencies and institutions of higher learning. Such debt is required to be authorized by an affirmative vote of two-thirds of the members elected to each house of the General Assembly and approved by the Governor. The Governor must certify before the enactment of the bond legislation and again before the issuance of the bonds that the net revenues pledged are expected to be sufficient to pay principal and interest on the bonds issued to finance the projects. The outstanding amount of Section 9(c) debt is limited in the aggregate to an amount equal to 1.15 times the average annual tax revenues derived from taxes on income and retail sales, as certified by the Auditor of Public Accounts, for the three immediately preceding fiscal years (“9(c) Debt Limit”). While the debt limits under Sections 9(b) and 9(c) are each calculated as the same percentage of the same average tax revenues, these debt limits are separately computed and apply separately to each type of debt.
Effect of Refunding Debt In general, when the Commonwealth issues bonds to refund outstanding bonds issued pursuant to Section 9(b) or 9(c) of Article X of the Constitution, the refunded bonds are considered paid for purposes of the constitutional limitations upon debt incurrence and issuance and the refunding bonds are counted in the computations of such limitations. Section 9(a) (3) provides that in the case of the refunding of debt incurred in accordance with Section 9(c) of Article X, the debt evidenced by the refunding bonds will be counted against the 9(c) Debt Limit unless the Governor does not provide the

B-19
net revenue sufficiency certification, in which case the debt evidenced by the refunding bonds will be counted against the 9(b) Debt Limit.
General Obligation Debt Limit and Debt Margin Using individual and fiduciary income, corporate income and the state sales and use tax revenues, as of June 30, 2016, the debt limits pursuant to Article X, Section 9 of the Constitution of Virginia are as follows:
[REMAINDER OF PAGE INTENTIONALLY LEFT BLANK]

B-20
COMPUTATION OF LEGAL DEBT LIMIT AND DEBT MARGIN* (in thousands)
Fiscal Year Ended June 30,
Taxes 2015 2016 2017* Individual and Fiduciary Income [1] $12,328,675 $12,555,624 $13,052,887 Corporation Income [2] 831,907 764,948 826,961 State Sales and Use [3] 3,587,849 3,651,400 3,720,552
Total $16,748,431 $16,971,972 $17,600,400
Average tax revenues for the three fiscal years $17,106,934
Section 9(a)(2) General Obligation Debt Issuance Limit and Margin [4]:
Debt Issuance Limit: 30% of 1.15 times annual tax revenues for fiscal year 2017* $6,072,138 Less 9(a)(2) Bonds Outstanding: 0
Debt Issuance Margin for Section 9(a)(2) General Obligation Bonds $6,072,138
Section 9(b) General Obligation Debt Issuance Limit and Margin:
Debt Issuance Limit: 1.15 times the average tax revenues for three fiscal years as calculated above $19,672,974 Less 9(b) Bonds Outstanding at June 30, 2017*: Public Facilities Bonds [6] $514,522 Transportation Facilities Refunding Bonds [5][6] 0 Bond Anticipation Notes 0
Total 9(b) Bonds Outstanding at June 30, 2017* 514,522
Debt Issuance Margin for Section 9(b) General Obligation Bonds $19,158,452
Debt Authorization Limit: 25% of 1.15 times average tax revenues for three fiscal years as calculated above $4,918,244 Less 9(b) debt authorized during the three prior fiscal years 0
Maximum additional 9(b) debt that may be authorized by the General Assembly (subject to referendum): 4,918,244
Section 9(c) General Obligation Debt Issuance Limit and Margin:
Debt Issuance Limit: 1.15 times the average tax revenues for three fiscal years as calculated above $19,672,974 Less 9(c) Bonds Outstanding at June 30, 2017*: Parking Facilities [6] $11,101 Transportation Facilities [6] 11,642 Higher Educational Institutions [6] 897,018 Bond Anticipation Notes 0
Total 9(c) Bonds Outstanding at June 30, 2017* 919,761
Debt Issuance Margin for Section 9(c) General Obligation Bonds $18,753,213
* Preliminary & Unaudited [1] Includes taxes imposed pursuant to Articles 2 and 9 of Chapter 3, Title 58.1 of the Code of Virginia.
[2] Includes taxes imposed pursuant to Article 10 of Chapter 3, Title 58.1 of the Code of Virginia. [3] Includes taxes imposed pursuant to Chapter 6, Title 58.1 of the Code of Virginia, less taxes identified in Sections 58.1-605 and 58.1-638. [4] Debt limit applies only to debt authorized pursuant to Article X, Section 9(a)(2) of the Constitution of Virginia.
[5] These bonds refunded certain Section 9(c) debt and because the Governor did not certify the feasibility of the refinanced
project, it must be applied against the Section 9(b) Debt Limit. [6] Net of unamortized discounts and premiums.
Sources: Department of Accounts and Department of the Treasury.
B-21
Tax-Supported Debt – General Obligation Tax-supported debt of the Commonwealth includes both general obligation debt and debt of agencies, institutions, boards and authorities for which debt service is expected to be made in whole or in part from appropriations of tax revenues. Outstanding Section 9(b) debt as of June 30, 2017 includes the unamortized portion of $514.5 million of general obligation bonds. In November 1992, $613.0 million in general obligation bonds were authorized and approved by the voters. In November 2002, $1.0 billion in general obligation bonds were authorized and approved by the voters. Various series of refunding bonds were issued to refund certain series of bonds. Outstanding Section 9(c) debt as of June 30, 2017 includes various series of Higher Educational Institutions Bonds (including refunding bonds) issued from 2005 to 2016, one series of Transportation Facilities Bonds issued in 2006, and two series of Parking Facilities Bonds (including refunding bonds) issued between 2009 and 2012. Outstanding general obligation debt does not include 9(b) and 9(c) advance refunded bonds for which funds have been deposited in irrevocable escrow accounts in amounts sufficient to meet all required future debt service.
Other Tax-Supported Debt Section 9(d) of Article X provides that the restrictions of Section 9 are not applicable to any obligation incurred by the Commonwealth or any of its institutions, agencies or authorities if the full faith and credit of the Commonwealth is not pledged or committed to the payment of such obligation. There are currently outstanding various types of 9(d) revenue bonds issued by authorities, political subdivisions and agencies to which the Commonwealth's full faith and credit is not pledged. Certain of these bonds, however, are paid in part or in whole from revenues received as appropriations by the General Assembly from general tax revenues, while others are paid solely from revenues derived from enterprises related to the operation of the financed capital projects or other non-general fund revenues. The debt repayments of the Virginia Public Building Authority, the Virginia College Building Authority 21st Century College and Equipment Programs, the Virginia Biotechnology Research Partnership Authority and several other long-term capital leases or notes have been supported all or in large part by General Fund appropriations. The Commonwealth Transportation Board (“CTB”) has issued various series of bonds authorized under the State Revenue Bond Act. These bonds are secured by and payable from funds appropriated by the General Assembly from the Transportation Trust Fund. The Transportation Trust Fund was established by the General Assembly in 1986 as a special non-reverting fund administered and allocated by the Transportation Board for the purpose of increased funding for construction, capital and other needs of state highways, airports, mass transportation and ports. As of June 30, 2017, $2.4 billion (unadjusted) in CTB Tax-Supported bonds were outstanding. During 2007, the CTB was authorized by the General Assembly to issue up to $3.0 billion in Capital Projects Revenue Bonds, with an additional $180 million authorized in 2008. As of June 30, 2017, $2.3 billion had been issued under this authorization. The Virginia Port Authority (“VPA”) issues bonds secured by its share of the Transportation Trust Fund. As of June 30, 2017, $253.2 million of Commonwealth Port Fund Revenue Bonds were outstanding. In 2008, the Authority was authorized to issue an additional $155 million in Commonwealth Port Fund Revenue Bonds and $30 million of that amount was rescinded during 2011.
Leases and Contracts Capital Leases. The Commonwealth is involved in numerous agreements to lease buildings, energy efficiency projects and equipment. For a detailed description, see "Notes to the Financial Statements" included in the Comprehensive Annual Financial Report for the Fiscal Year Ended June 30, 2016. These lease agreements are for various terms, and each lease contains a nonappropriation clause indicating that continuation of the lease is subject to funding by the General Assembly. The principal balance of all tax-supported capital leases outstanding was $117.9 million as of June 30, 2016.

B-22
Installment Purchases. The Commonwealth also finances the acquisition of certain personal property and equipment through installment purchase agreements. The length of the agreements and the interest rates charged vary. In most cases, the agreements are collateralized by the personal property and equipment acquired. Installment purchase agreements contain nonappropriation clauses indicating that continuation of the installment purchase is subject to funding by the General Assembly. The principal balance of tax-supported installment purchase obligations outstanding was $159.7 million as of June 30, 2016.
Outstanding Tax-Supported Debt The following table summarizes for the past five fiscal years the outstanding indebtedness of the Commonwealth, its agencies, institutions and authorities for which appropriated tax revenues are required to pay debt service. In certain instances, debt service may be paid with or payable from other non-tax sources (e.g., toll revenues, port revenues and user fees), but the underlying security remains the appropriation of tax revenues by the Commonwealth.
[REMAINDER OF PAGE INTENTIONALLY LEFT BLANK]
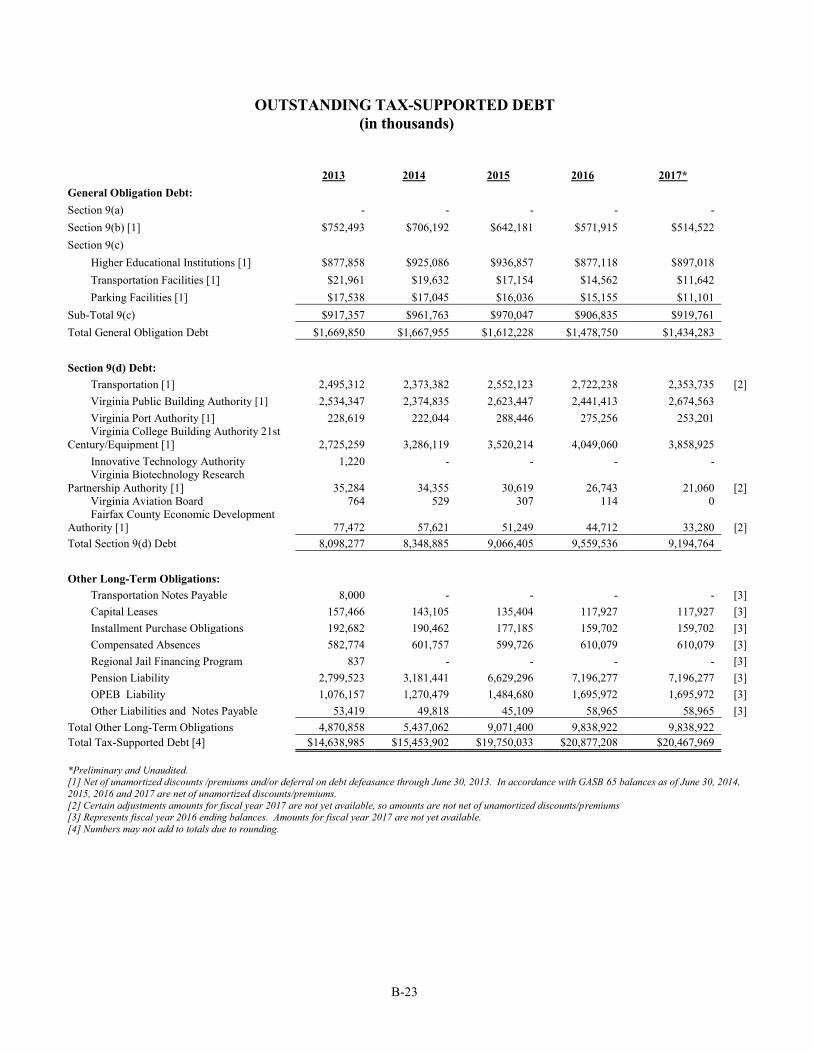
B-23
OUTSTANDING TAX-SUPPORTED DEBT (in thousands)
2013 2014 2015 2016 2017* General Obligation Debt:
Section 9(a) - - - - -
Section 9(b) [1] $752,493 $706,192 $642,181 $571,915 $514,522
Section 9(c)
Higher Educational Institutions [1] $877,858 $925,086 $936,857 $877,118 $897,018
Transportation Facilities [1] $21,961 $19,632 $17,154 $14,562 $11,642
Parking Facilities [1] $17,538 $17,045 $16,036 $15,155 $11,101
Sub-Total 9(c) $917,357 $961,763 $970,047 $906,835 $919,761
Total General Obligation Debt $1,669,850 $1,667,955 $1,612,228 $1,478,750 $1,434,283
Section 9(d) Debt:
Transportation [1] 2,495,312 2,373,382 2,552,123 2,722,238 2,353,735 [2]
Virginia Public Building Authority [1] 2,534,347 2,374,835 2,623,447 2,441,413 2,674,563
Virginia Port Authority [1] 228,619 222,044 288,446 275,256 253,201 Virginia College Building Authority 21st Century/Equipment [1]
2,725,259
3,286,119
3,520,214
4,049,060 3,858,925
Innovative Technology Authority 1,220 - - - - Virginia Biotechnology Research Partnership Authority [1]
35,284
34,355
30,619
26,743 21,060 [2]
Virginia Aviation Board 764 529 307 114 0 Fairfax County Economic Development Authority [1] 77,472 57,621 51,249 44,712 33,280 [2]
Total Section 9(d) Debt 8,098,277 8,348,885 9,066,405 9,559,536 9,194,764
Other Long-Term Obligations:
Transportation Notes Payable 8,000 - - - - [3]
Capital Leases 157,466 143,105 135,404 117,927 117,927 [3]
Installment Purchase Obligations 192,682 190,462 177,185 159,702 159,702 [3]
Compensated Absences 582,774 601,757 599,726 610,079 610,079 [3]
Regional Jail Financing Program 837 - - - - [3]
Pension Liability 2,799,523 3,181,441 6,629,296 7,196,277 7,196,277 [3]
OPEB Liability 1,076,157 1,270,479 1,484,680 1,695,972 1,695,972 [3]
Other Liabilities and Notes Payable 53,419 49,818 45,109 58,965 58,965 [3]
Total Other Long-Term Obligations 4,870,858 5,437,062 9,071,400 9,838,922 9,838,922 Total Tax-Supported Debt [4] $14,638,985 $15,453,902 $19,750,033 $20,877,208 $20,467,969 *Preliminary and Unaudited. [1] Net of unamortized discounts /premiums and/or deferral on debt defeasance through June 30, 2013. In accordance with GASB 65 balances as of June 30, 2014, 2015, 2016 and 2017 are net of unamortized discounts/premiums. [2] Certain adjustments amounts for fiscal year 2017 are not yet available, so amounts are not net of unamortized discounts/premiums [3] Represents fiscal year 2016 ending balances. Amounts for fiscal year 2017 are not yet available. [4] Numbers may not add to totals due to rounding.

B-24
OUTSTANDING TAX-SUPPORTED DEBT As of June 30, –2013-2017
*2017 data Preliminary and Unaudited. Outstanding Tax-Supported Debt Service The following table summarizes annual debt service on outstanding tax-supported debt as of June 30, 2017. The table does not include debt service requirements for capital lease and installment purchase obligations payable from the General Fund of the Commonwealth.
$0.0
$1.0
$2.0
$3.0
$4.0
$5.0
$6.0
$7.0
$8.0
$9.0
$10.0
2013 2014 2015 2016 2017
Fiscal Year
Billions
Section 9(b) Section 9(c) Section 9(d) Other Long-Term Obligations

B-25
ANNUAL DEBT SERVICE REQUIREMENTS TAX-SUPPORTED DEBT OUTSTANDING AT JUNE 30, 2017*
(in thousands)
General Obligation Debt Other Tax-Supported Debt Fiscal Year Sections 9(a), 9(b) and 9(c) Section 9(d) [1] [2] Total
Ending June 30 Principal Interest Total Principal Interest Total Principal Interest Total
2018 104,055 56,772 160,827 567,185 374,849 942,034 671,240 431,621 1,102,861 2019 103,645 52,028 155,673 551,750 358,404 910,154 655,395 410,432 1,065,828 2020 101,395 47,233 150,628 529,273 332,770 862,044 632,668 380,003 1,012,671 2021 105,660 42,491 148,151 532,001 308,441 840,442 637,661 350,932 988,593 2022 101,305 37,526 138,831 511,970 284,024 795,994 613,275 321,550 934,825 2023 101,885 32,848 134,733 506,185 260,929 767,114 608,070 293,777 901,847 2024 101,670 28,196 129,866 506,666 237,908 744,573 608,336 266,103 874,439 2025 93,645 23,558 117,203 486,064 214,900 700,964 579,709 238,458 818,167 2026 88,455 19,456 107,911 491,149 193,099 684,248 579,604 212,555 792,159 2027 80,320 15,574 95,894 477,786 172,004 649,790 558,106 187,578 745,684 2028 65,090 11,909 76,999 472,410 145,229 617,639 537,500 157,138 694,638 2029 50,595 9,250 59,845 469,075 124,515 593,590 519,670 133,764 653,434
2030 41,730 7,192 48,922 452,290 103,917 556,207 494,020 111,109 605,129 2031 37,415 5,568 42,983 400,850 83,472 484,322 438,265 89,040 527,305 2032 26,720 4,152 30,872 374,580 66,632 441,212 401,300 70,784 472,084 2033 26,365 3,183 29,548 316,580 51,550 368,130 342,945 54,734 397,679 2034 24,070 2,223 26,293 303,805 38,273 342,078 327,875 40,495 368,370 2035 17,145 1,325 18,470 259,785 25,576 285,361 276,930 26,901 303,831 2036 9,680 679 10,359 181,635 15,060 196,695 191,315 15,739 207,054 2037 1,895 328 2,223 105,110 8,222 113,332 107,005 8,550 115,555 2038 1,675 244 1,919 39,195 4,662 43,857 40,870 4,906 45,776 2039 1,730 165 1,895 40,685 3,160 43,845 42,415 3,325 45,740 2040 1,785 84 1,869 24,015 1,598 25,613 25,800 1,682 27,482 2041 - - - 24,900 704 25,604 24,900 704 25,604
Subtotal $1,289,930 $401,984 $1,691,914 $8,624,945 $3,409,895 $12,034,841 $9,914,875 $3,811,880 $13,726,755
Add
Unamortized Premium & Accretion on
CAB's - - - - - - - - -
Add
Unamortized
Premium 144,353 - 144,353 569,819 - 569,819 714,172 - 714,172
Less
Unamortized
Discount - - - - - - - - -
TOTAL $ 1,434,283 $ 401,984 $ 1,836,267 $ 9,194,764 $ 3,409,895 $ 12,604,660 $ 10,629,047 $ 3,811,880 $ 14,440,927
*Preliminary and Unaudited
[1] Net of unamortized discounts/premiums and/or deferral on debt defeasance through June 30, 2013. In accordance with GASB 65 balances as of June 30, 2014, 2015and 2016 are net of unamortized discounts/premiums. [2] Numbers may not add to totals due to rounding. [3] Certain adjustment amounts for fiscal year 2017 are not yet available, so amounts are not net of unamortized discounts and premiums. Source: Department of Treasury.

B-26
ANNUAL DEBT SERVICE REQUIREMENTS TAX-SUPPORTED DEBT OUTSTANDING AT JUNE 30, 2017*
(in thousands)
*Preliminary and Unaudited. Source: Department of Treasury.
[REMAINDER OF PAGE INTENTIONALLY LEFT BLANK]
$0
$200,000
$400,000
$600,000
$800,000
$1,000,000
$1,200,000
Fiscal Year
Thousands
Total Principal Interest

B-27
RATIOS OF OUTSTANDING TAX-SUPPORTED DEBT TO POPULATION AND PERSONAL INCOME*
Fiscal Population Personal Outstanding Tax-
Supported Debt/Income Year Income Debt Debt/Capita
2012 8,192,048 $396,005,223 $14,193,511 1,732.60 3.6%
2013 8,262,692 $400,660,395 $14,638,985 1,771.70 3.7%
2014 8,317,372 $417,173,337 $15,453,902 1,858.03 3.7%
2015 8,367,587 $436,655,248 $19,750,033 2,360.30 4.5%
2016 8,411,808 $445,461,657 $20,877,208 2,481.89 4.7%
2017 Data not yet available. Source: Population Division, U.S. Census Bureau Bureau of Economic Analysis SA1-3 Personal Income Summary, 2012-2016 revised population estimates as of September 2017. BEA State Personal Income for 2014-2016 updated as September 2017, SA05N Personal Income by Major Source and Earnings by NAICS Industry.
[REMAINDER OF PAGE INTENTIONALLY LEFT BLANK]

B-28
Authorized and Unissued Tax-Supported Debt As of June 30, 2017, the following tax-supported debt had been authorized by the General Assembly and remained unissued:
Authorized and Unissued Tax-Supported Debt as of June 30, 2017*
Section 9(b) Debt:
Higher Educational Institutions Bonds $ -
Park and Recreational Facilities Bonds -
Subtotal 9(b) Debt: $ -
Section 9(c) Debt:
Higher Educational Institutions Bonds $ 642,335
Parking Facility Bonds 226
Subtotal 9(c) Debt: $ 642,561
Section 9(d) Debt:
Transportation Capital Projects Revenue Bonds $ 887,335
Northern Virginia Transportation District Program 24,700
U.S. Route 58 Corridor Development Program 595,700
Virginia Public Building Authority -- Projects 1,341,464
Virginia Public Building Authority -- Jails 39,776
Virginia College Building Authority -- 21st Century Projects 2,068,435
Virginia College Building Authority -- 21st Century Equipment 83,000
Virginia Port Authority 0
Subtotal 9(d) Debt: $ 5,040,412
Total $ 5,682,972
* Preliminary and Unaudited. Source: Department of the Treasury; Department of Accounts.
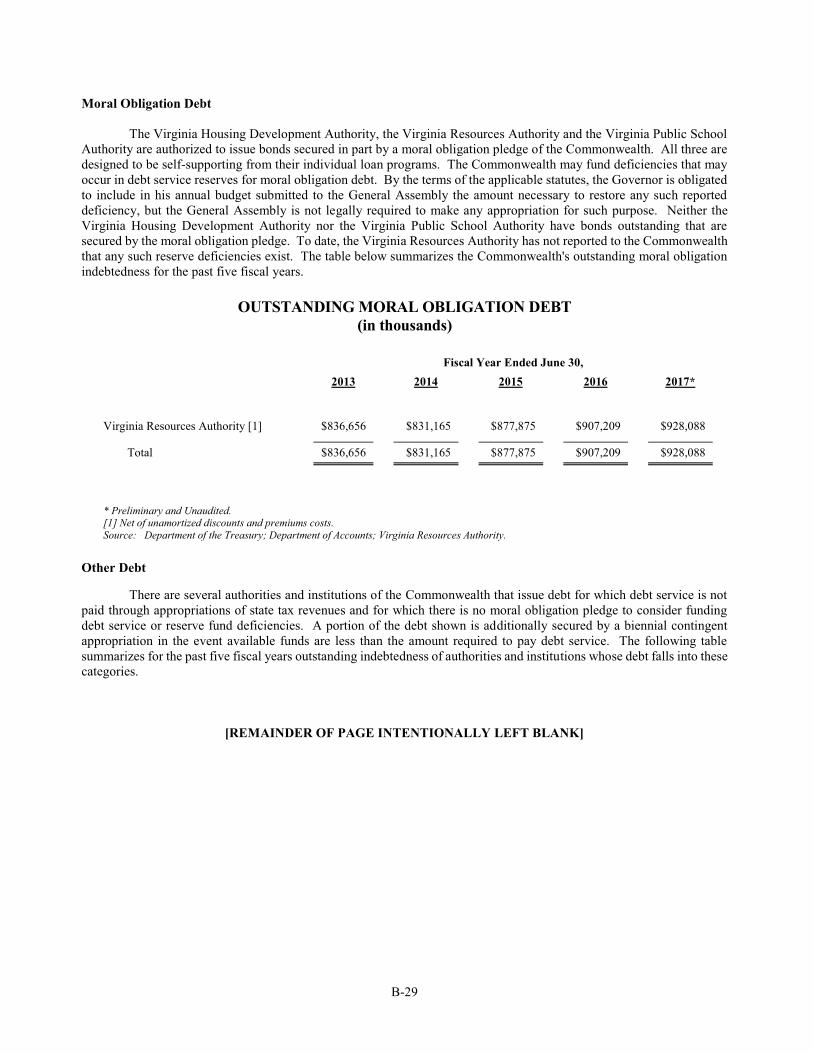
B-29
Moral Obligation Debt The Virginia Housing Development Authority, the Virginia Resources Authority and the Virginia Public School Authority are authorized to issue bonds secured in part by a moral obligation pledge of the Commonwealth. All three are designed to be self-supporting from their individual loan programs. The Commonwealth may fund deficiencies that may occur in debt service reserves for moral obligation debt. By the terms of the applicable statutes, the Governor is obligated to include in his annual budget submitted to the General Assembly the amount necessary to restore any such reported deficiency, but the General Assembly is not legally required to make any appropriation for such purpose. Neither the Virginia Housing Development Authority nor the Virginia Public School Authority have bonds outstanding that are secured by the moral obligation pledge. To date, the Virginia Resources Authority has not reported to the Commonwealth that any such reserve deficiencies exist. The table below summarizes the Commonwealth's outstanding moral obligation indebtedness for the past five fiscal years.
OUTSTANDING MORAL OBLIGATION DEBT
(in thousands)
Fiscal Year Ended June 30, 2013 2014 2015 2016 2017*
Virginia Resources Authority [1] $836,656 $831,165 $877,875 $907,209
$928,088
Total $836,656 $831,165 $877,875 $907,209
$928,088
* Preliminary and Unaudited. [1] Net of unamortized discounts and premiums costs. Source: Department of the Treasury; Department of Accounts; Virginia Resources Authority.
Other Debt
There are several authorities and institutions of the Commonwealth that issue debt for which debt service is not paid through appropriations of state tax revenues and for which there is no moral obligation pledge to consider funding debt service or reserve fund deficiencies. A portion of the debt shown is additionally secured by a biennial contingent appropriation in the event available funds are less than the amount required to pay debt service. The following table summarizes for the past five fiscal years outstanding indebtedness of authorities and institutions whose debt falls into these categories.
[REMAINDER OF PAGE INTENTIONALLY LEFT BLANK]

B-30
OUTSTANDING OTHER DEBT (in thousands)
Fiscal Year Ended June 30, 2012 2013 2014 2015 2016
Institutions of Higher Education [1] $1,541,802 $1,538,395 $1,826,602 $2,038,579 $2,081,823
Virginia College Building Authority
1,715,515
1,773,190
1,759,970
1,729,375
1,674,505
Public Higher Education Financing
Program
Virginia College Building Authority
639,597
675,510
660,169
701,572
817,418 Private College Program Virginia Housing Development Authority [1] 5,945,174
5,742,689
4,931,982
4,498,847 4,320,935
Virginia Public School Authority [1] 3,378,084 3,483,366 3,523,633 3,551,741 3,655,914
Virginia Port Authority 281,978 276,816 272,831 256,656 252,631 Commonwealth Transportation Board Federal Highway Reimbursement Anticipation Notes [1] 182,450
89,836
60,905
30,624
-
Grant Anticipation Notes (GARVEES) [1] 298,728
473,733
746,812
705,574
663,147
Hampton Roads Sanitation District 639,286 790,503 766,353 748,397 879,294
Total $14,622,614 $14,844,038 $14,549,257 $14,261,365 $14,345,667
2017 data not yet available. [1] Net of unamortized discounts and premium costs. Source: Department of the Treasury.
[REMAINDER OF PAGE INTENTIONALLY LEFT BLANK]

B-31
Commonwealth Debt Management Debt Capacity Advisory Committee The Debt Capacity Advisory Committee (the “Committee”) is charged by statute with annually estimating the amount of tax-supported debt which may prudently be authorized for the next biennium, consistent with the financial goals, capital needs and policies of the Commonwealth. Such estimate is provided to the Governor and General Assembly. The Committee is also required to review annually the amount and condition of bonds, notes and other security obligations of the Commonwealth’s agencies, institutions, boards and authorities which are either secured by a moral obligation pledge to replenish reserve fund deficiencies or for which the Commonwealth has a contingent or limited liability. The Committee provides its recommendations on the prudent use of such obligations to the Governor and the General Assembly. The Committee also reviews the amounts and condition of bonds, notes and other security obligations of the Commonwealth’s agencies, institutions, boards and authorities which are neither tax-supported debt nor obligations secured by a moral obligation pledge to replenish reserve fund deficiencies. The Committee may recommend limits, when appropriate, on these other obligations. The Committee’s latest report can be found at http://www.trs.virginia.gov/debt/dcac.aspx. Capital Outlay Plan The Department of Planning and Budget has prepared a Six-Year Capital Outlay Plan (the "Plan") for the Commonwealth. The Plan lists proposed capital projects, and it recommends how the proposed projects should be financed. More specifically, the Plan distinguishes between immediate demands and longer-term needs, assesses the state's ability to meet its highest priority needs, and outlines an approach for addressing priorities in terms of costs, benefits and financing mechanisms. The General Assembly has set out requirements for the funding of capital projects at a level not less than two percent of the General Fund revenues for the biennium, and the portion of that amount that may be recommended for bonded indebtedness.
RETIREMENT PLANS
The Commonwealth contributes to four pension plans each of which is administered by the Virginia Retirement System ("System"). The System acts as a common investment and administrative agent for the Commonwealth, local school boards and political subdivisions in Virginia. The plans administered by the System consist of the Virginia Retirement System ("VRS"), the State Police Officers Retirement System ("SPORS"), the Virginia Law Officers’ Retirement System (“VaLORS”) and the Judicial Retirement System ("JRS"). Membership in the VRS consists of Commonwealth employees, public school teachers and employees of political subdivisions that have voluntarily joined the system. Membership in SPORS consists of Commonwealth state police officers. Membership in VaLORS consists of law enforcement and corrections officers of the Commonwealth other than state police officers, and membership in JRS consists of judges in the Commonwealth's Circuit Courts, General District Courts, Court of Appeals and Supreme Court. Membership in the applicable retirement plans is mandatory for all eligible employees. VRS is the largest of four systems covering 330,231 active Commonwealth employees, school teachers and covered employees of local governments as of June 30, 2017, as compared with 10,969 active members of SPORS, VaLORS, and JRS combined. In addition, the four plans combined had approximately 49,932 inactive vested members who are no longer contributing but have not withdrawn previous contributions and may be eligible for a retirement benefit in the future.

B-32
ACTIVE MEMBER DISTRIBUTION OF
RETIREMENT PLANS
Fiscal Year Ended June 30
2016 2017 State Employees (VRS)…………………….. 77,651 77,617
Teachers (VRS)…………………………….. 146,854 146,090
Employees of Political Subdivisions (VRS)... 105,654 106,524
State Police Officers (SPORS)……………... 1,947 1,877
Virginia Law Officers (VaLORS)………….. 9,147 8,673
Judges (JRS)………………………………... 418 419
Source: Virginia Retirement System.
The System's Board of Trustees administers all four plans pursuant to statute. Each plan provides retirement, disability and death benefits. In addition, most members of all four plans are covered by group term life insurance.
The General Assembly established a new retirement plan (Hybrid Retirement Plan) for all new members hired on or after January 1, 2014 who are not in SPORS, VaLORS or VRS as a hazardous duty employee of a political subdivision. All new members hired on or after July 1, 2010 and before January 1, 2014 are in Plan 2. Vested members on January 1, 2013 with service before July 1, 2010 are in Plan 1. Non-vested members on January 1, 2013 with service before July 1, 2010 are in Plan 2. The different provisions for the retirement plans are set forth in the following table:
Retirement Benefit Plan Provisions AS ESTABLISHED BY TITLE 51.1 OF THE CODE OF VIRGINIA (1950), AS AMENDED
All full-time, salaried permanent (professional) employees of state agencies, public school divisions and employees of participating employers are automatically covered by a pension plan upon employment. Members qualify for retirement when they become vested and meet the age and service requirements for their plan, as shown in the following table.
The System administers three different benefit structures for government employees: Plan 1, Plan 2 and the Hybrid Retirement Plan. Each of these is called a plan in statute and each has different provisions with a specific eligibility and benefit structure. These different benefit structures are set out in the following table:

B-33
PLAN 1 PLAN 2 HYBRID RETIREMENT PLAN
About Plan 1 Plan 1 is a defined benefit plan. The retirement benefit is based on a member’s age, creditable service and average final compensation at retirement using a formula.
About Plan 2 Plan 2 is a defined benefit plan. The retirement benefit is based on a member’s age, creditable service and average final compensation at retirement using a formula.
About the Hybrid Retirement Plan The Hybrid Retirement Plan combines the features of a defined benefit plan and a defined contribution plan. The defined benefit is based on a member’s age, creditable service and average final compensation at retirement using a formula.
• The benefit from the defined contribution component of the plan depends on the member and employer contributions made to the plan and the investment performance of those contributions.
• In addition to the monthly benefit payment payable from the defined benefit plan at retirement, a member may start receiving distributions from the balance in the defined contribution account, reflecting the contributions, investment gains or losses and any required fees.
Eligible Members Members are covered under Plan 1 if their membership date is prior to July 1, 2010, they were vested before January 1, 2013 and they have not taken a refund.
Hybrid Opt-In Election VRS non-hazardous duty-covered Plan 1 members were allowed to make an irrevocable decision to opt into the Hybrid Retirement Plan during a special election window held January 1 through April 30, 2014. The Hybrid Retirement Plan’s effective date for eligible Plan 1 members who opted in was July 1, 2014. If eligible deferred members returned to work during the election window, they were also eligible to opt into the Hybrid Retirement Plan. Members who were eligible for an optional retirement plan (ORP) and had prior service under Plan 1 were not eligible to elect the Hybrid Retirement Plan and remain as Plan 1 or ORP.
Eligible Members Members are eligible for Plan 2 if their membership date is from July 1, 2010, to December 31, 2013, and they have not taken a refund. Additionally, members are covered under Plan 2 if they have a membership date prior to July 1, 2010, but were not vested before January 1, 2013.
Hybrid Opt-In Election Eligible Plan 2 members were allowed to make an irrevocable decision to opt into the Hybrid Retirement Plan during a special election window held January 1 through April 30, 2014. The Hybrid Retirement Plan’s effective date for eligible Plan 2 members who opted in was July 1, 2014. If eligible deferred members returned to work during the election window, they were also eligible to opt into the Hybrid Retirement Plan. Members who were eligible for an optional retirement plan (ORP) and have prior service under Plan 2 were not eligible to elect the Hybrid Retirement Plan and remain as Plan 2 or ORP.
Eligible Members Employees are in the Hybrid Retirement Plan if their membership date is on or after January 1, 2014. This includes:
• State employees*
• School division employees
• Political subdivision employees*
• Judges appointed or elected to an original term on or after January 1, 2014, regardless if vested to VRS Plan 1 or VRS Plan 2.
• Members in Plan 1 or Plan 2 who elected to opt into the plan during the election window held January 1-April 30, 2014; the plan’s effective date for opt-in members was July 1, 2014.
*Non-Eligible Members Some employees are not eligible to participate in the Hybrid Retirement Plan. They include:
• Members of the State Police Officers’ Retirement System (SPORS)
• Members of the Virginia Law Officers’ Retirement System (VaLORS)
• Political subdivision employees who are covered by enhanced benefits for hazardous duty employees
Those employees eligible for an optional retirement plan (ORP) must elect the ORP plan or the Hybrid Retirement Plan. If these members have prior service under Plan 1 or Plan 2, they are not eligible to elect the

B-34
Hybrid Retirement Plan and must select Plan 1 or Plan 2 (as applicable) or ORP.
Retirement Contributions State employees, excluding state elected officials, judges in Plan 1 or Plan 2 and optional retirement plan participants, contribute 5% of their compensation each month to their member contribution account through a pre-tax salary reduction. Some school divisions and political subdivisions elected to phase in the required 5% member contribution; all employees pay the full 5% as of July 1, 2016. Member contributions are tax-deferred until they are withdrawn as part of a retirement benefit or as a refund. The employer makes a separate actuarially determined contribution to VRS for all covered employees. VRS invests both member and employer contributions to provide funding for the future benefit payment.
Retirement Contributions State employees contribute 5% of their compensation each month to their member contribution account through a pre-tax salary reduction. Some school divisions and political subdivisions elected to phase in the required 5% member contribution; all employees pay the full 5% as of July 1, 2016.
Retirement Contributions A member’s retirement benefit is funded through mandatory and voluntary contributions made by the member and the employer to both the defined benefit and the defined contribution components of the plan. Mandatory contributions are based on a percentage of the employee’s creditable compensation and are required from both the member and the employer. Additionally, members may choose to make voluntary contributions to the defined contribution component of the plan, and the employer is required to match those voluntary contributions according to specified percentages. Mandatory member contributions and the employer match on the mandatory and voluntary member contributions are recorded in a 401(a) account, along with the accrued net investment income. The voluntary member contributions and accrued net investment income are recorded in a 457(b) account. Members are responsible for investing their accounts using the various investment options that are available.
Creditable Service Creditable service includes active service. Members earn creditable service for each month they are employed in a covered position. It also may include credit for prior service the member has purchased or additional creditable service the member was granted. A member’s total creditable service is one of the factors used to determine eligibility for retirement and to calculate the retirement benefit. It also may count toward eligibility for the health insurance credit in retirement, if the employer offers the health insurance credit.
Creditable Service Same as Plan 1.
Creditable Service Defined Benefit Component: Under the defined benefit component of the plan, creditable service includes active service. Members earn creditable service for each month they are employed in a covered position. It also may include credit for prior service the member has purchased or additional creditable service the member was granted. A member’s total creditable service is one of the factors used to determine eligibility for retirement and to calculate the retirement benefit. It also may count toward eligibility for the health insurance credit in retirement, if the employer offers the health insurance credit. Defined Contribution Component: Under the defined contribution component, creditable service is used to determine vesting for the employer contribution portion of the plan.
Vesting Vesting is the minimum length of service a member needs to qualify for a future retirement benefit. Members become vested when they have at least five years (60 months) of creditable service.
Vesting Same as Plan 1.
Vesting Defined Benefit Component: Defined benefit vesting is the minimum length of service a member needs to qualify for a future retirement benefit. Members are vested under the defined benefit component of the Hybrid Retirement Plan

B-35
Vesting means members are eligible to qualify for retirement if they meet the age and service requirements for their plan. Members also must be vested to receive a full refund of their member contribution account balance if they leave employment and request a refund. Members are always 100% vested in the contributions that they make.
when they reach five years (60 months) of creditable service. Plan 1 or Plan 2 members with at least five years (60 months) of creditable service who opted into the Hybrid Retirement Plan remain vested in the defined benefit component. Defined Contribution Component: Defined contribution vesting refers to the minimum length of service a member needs to be eligible to withdraw the employer contributions from the defined contribution component of the plan. Members are always 100% vested in the contributions that they make. Upon retirement or leaving covered employment, a member is eligible to withdraw a percentage of employer contributions to the defined contribution component of the plan, based on service.
• After two years, a member is 50% vested and may withdraw 50% of employer contributions.
• After three years, a member is 75% vested and may withdraw 75% of employer contributions.
• After four or more years, a member is 100% vested and may withdraw 100% of employer contributions.
Distribution is not required by law until age 70½.
Calculating the Benefit The Basic Benefit is calculated based on a formula using the member’s average final compensation, a retirement multiplier and total service credit at retirement. It is one of the benefit payout options available to a member at retirement. An early retirement reduction factor is applied to the Basic Benefit if the member retires with a reduced retirement benefit or selects a benefit payout option other than the Basic Benefit.
Calculating the Benefit See definition under Plan 1.
Calculating the Benefit Defined Benefit Component: See definition under Plan 1. Defined Contribution Component: The benefit is based on contributions made by the member and any matching contributions made by the employer, plus net investment earnings on those contributions.
Average Final Compensation A member’s average final compensation is the average of the 36 consecutive months of highest creditable compensation as a covered employee.
Average Final Compensation A member’s average final compensation is the average of the 60 consecutive months of highest creditable compensation as a covered employee.
Average Final Compensation Same as Plan 2. It is used in the retirement formula for the defined benefit component of the plan.
Service Retirement Multiplier VRS Plan 1: The retirement multiplier is a factor used in the
Service Retirement Multiplier Service Retirement Multiplier Defined Benefit Component:

B-36
formula to determine a final retirement benefit. The retirement multiplier for non-hazardous duty members is 1.70%. SPORS, sheriffs and regional jail superintendents: The retirement multiplier is 1.85%. VaLORS: The retirement multiplier is 1.70% or 2.00%.
� Members hired before July 1, 2001, have a 1.70% multiplier and are eligible for a hazardous duty supplement. They also had the option to elect the 2.00% multiplier and no supplement.
� Members hired on or after July 1, 2001, have a 2.00% multiplier and no supplement.
Political subdivision hazardous duty employees: The retirement multiplier of eligible political subdivision hazardous duty employees other than sheriffs and regional jail superintendents is 1.70% or 1.85% as elected by the employer. JRS Plan 1: If appointed or elected to an original term prior to January 1, 2013, the retirement multiplier is 1.70%. If appointed or elected to an original term between January 1, 2013, and December 31, 2013, the retirement multiplier is 1.70% on non-JRS service earned, purchased or granted before the date of appointment or election to an original term, and 1.65% on JRS service earned, purchased or granted on or after the date of appointment or election to an original term.
VRS Plan 2: Same as Plan 1 for service earned, purchased or granted prior to January 1, 2013. For non-hazardous duty members, the retirement multiplier is 1.65% for creditable service earned, purchased or granted on or after January 1, 2013. SPORS, sheriffs and regional jail superintendents: Same as Plan 1. VaLORS: The retirement multiplier is 2.00%. Political subdivision hazardous duty employees: Same as Plan 1. JRS Plan 2: Same as Plan 1.
VRS: The retirement multiplier for the defined benefit component is 1.00%. For members who opted into the Hybrid Retirement Plan from Plan 1 or Plan 2, the applicable multipliers for those plans will be used to calculate the retirement benefit for service credited in those plans. SPORS, sheriffs and regional jail superintendents: Not applicable. VaLORS: Not applicable. Political subdivision hazardous duty employees: Not applicable. JRS: The retirement multiplier for the defined benefit component is 1.00%. The member will retain the applicable multiplier on any covered service outside JRS. Defined Contribution Component: Not applicable.
Normal Retirement Age VRS: Age 65. SPORS, VaLORS and political subdivision hazardous duty employees: Age 60. JRS: Age 65; mandatory retirement age is 73.
Normal Retirement Age VRS: Normal Social Security retirement age. SPORS, VaLORS and political subdivision hazardous duty employees: Same as Plan 1. JRS: Same as Plan 1.
Normal Retirement Age Defined Benefit Component: VRS: Same as Plan 2. SPORS, VaLORS and political subdivision hazardous duty employees: Not applicable. JRS: Same as Plan 1.

B-37
Defined Contribution Component: Members are eligible to receive distributions upon leaving employment, subject to restrictions.
Earliest Unreduced Retirement Eligibility VRS: Age 65 with at least five years (60 months) of creditable service or at age 50 with at least 30 years of creditable service. SPORS, VaLORS and political subdivision hazardous duty employees: Age 60 with at least five years of creditable service or age 50 with at least 25 years of creditable service. JRS: Age 65 with at least five years of creditable service or at age 60 with at least 30 years of creditable service. Service earned under JRS is weighted. The weighting factors for a judge appointed prior to July 1, 2010, are as follows:
• 3.5 for JRS members appointed or elected to an original term before January 1, 1995.
• 2.5 for JRS members appointed or elected to an original term on or after January 1, 1995, but before July 1, 2010.
For members appointed or elected to an original term between July 1, 2010, and December 31, 2013, the weighting factors are:
� 1.5 if appointed or elected to an original term before age 45.
� 2.0 if appointed or elected to an original term between ages 45 and 54.
� 2.5 if appointed or elected to an original term at age 55 or older.
Earliest Unreduced Retirement Eligibility VRS: Normal Social Security retirement age with at least five years (60 months) of creditable service or when their age and service equal 90. SPORS, VaLORS and political subdivision hazardous duty employees: Same as Plan 1. JRS: Same as Plan 1. Service earned under JRS is weighted. The weighting factors under Plan 2 are:
• 1.5 for JRS members appointed or elected to an original term before age 45.
• 2.0 for JRS members appointed or elected to an original term between ages 45 and 54.
• 2.5 for JRS members appointed or elected to an original term at age 55 or older.
Earliest Unreduced Retirement Eligibility Defined Benefit Component: VRS: Normal Social Security retirement age and have at least five years (60 months) of creditable service or when their age and service equal 90. SPORS, VaLORS and political subdivision hazardous duty employees: Not applicable. JRS: Same as Plan 2. Defined Contribution Component: Members are eligible to receive distributions upon leaving employment, subject to restrictions.
Earliest Reduced Retirement Eligibility VRS: Age 55 with at least five years (60 months) of creditable service or age 50 with at least 10 years of creditable service.
Earliest Reduced Retirement Eligibility VRS: Age 60 with at least five years (60 months) of creditable service. SPORS, VaLORS and political subdivision hazardous duty employees: Same as Plan 1.
Earliest Reduced Retirement Eligibility Defined Benefit Component: VRS: Age 60 with at least five years (60 months) of creditable service. SPORS, VaLORS and political subdivision hazardous duty employees: Not applicable.

B-38
SPORS, VaLORS and political subdivision hazardous duty employees: Age 50 with at least five years of creditable service. JRS: Age 55, with at least five years of creditable service.
JRS: Same as Plan 1.
JRS: Same as Plan 1. Defined Contribution Component: Members are eligible to receive distributions upon leaving employment, subject to restrictions.
Cost-of-Living Adjustment (COLA) in Retirement The Cost-of-Living Adjustment (COLA) matches the first 3% increase in the Consumer Price Index for all Urban Consumers (CPI-U) and half of any additional increase (up to 4%) up to a maximum COLA of 5%. Eligibility: For members who retire with an unreduced benefit or with a reduced benefit with at least 20 years of creditable service, the COLA will go into effect on July 1 after one full calendar year from the retirement date. For members who retire with a reduced benefit and who have fewer than 20 years of creditable service, the COLA will go into effect on July 1 after one calendar year following the unreduced retirement eligibility date. Exceptions to COLA Effective Dates: The COLA is effective July 1 following one full calendar year (January 1 to December 31) under any of the following circumstances:
• The member is within five years of qualifying for an unreduced retirement benefit as of January 1, 2013.
• The member retires on disability.
• The member is involuntarily separated from employment for causes other than job performance or misconduct and is eligible to retire under the Workforce Transition Act or the Transitional Benefits Program.
• The member dies in service and the member’s survivor or beneficiary is eligible for a monthly death-in-service
Cost-of-Living Adjustment (COLA) in Retirement The Cost-of-Living Adjustment (COLA) matches the first 2% increase in the CPI-U and half of any additional increase (up to 2%), for a maximum COLA of 3%. Eligibility: Same as Plan 1. Exceptions to COLA Effective Dates: Same as Plan 1.
Cost-of-Living Adjustment (COLA) in Retirement Defined Benefit Component: Same as Plan 2. Defined Contribution Component: Not applicable. Eligibility: Same as Plan 1 and Plan 2. Exceptions to COLA Effective Dates: The COLA is effective July 1 following one full calendar year (January 1 to December 31) under any of the following circumstances:
• The member is within five years of qualifying for an unreduced retirement benefit as of January 1, 2013.
• The member is involuntarily separated from employment for causes other than job performance or misconduct and is eligible to retire under the Workforce Transition Act or the Transitional Benefits Program.
• The member dies in service and the member’s survivor or beneficiary is eligible for a monthly death-in-service benefit. The COLA will go into effect on July 1 following one full calendar year (January 1 to December 31) from the date the monthly benefit begins.

B-39
benefit. The COLA will go into effect on July 1 following one full calendar year (January 1 to December 31) from the date the monthly benefit begins.
Disability Coverage For members who are eligible to be considered for disability retirement and retire on disability, the retirement multiplier is 1.70% on all service, regardless of when it was earned, purchased or granted. Most state employees are covered under the Virginia Sickness and Disability Program (VSDP) and are not eligible for disability retirement. VSDP members are subject to a one-year waiting period before becoming eligible for non-work-related disability benefits.
Disability Coverage For members who are eligible to be considered for disability retirement and retire on disability, the retirement multiplier is 1.65% on all service, regardless of when it was earned, purchased or granted. Most state employees are covered under the Virginia Sickness and Disability Program (VSDP) and are not eligible for disability retirement. VSDP members are subject to a one-year waiting period before becoming eligible for non-work-related disability benefits.
Disability Coverage Employees of political subdivisions and school divisions (including Plan 1 and Plan 2 opt-ins) participate in the Virginia Local Disability Program (VLDP) unless their local governing body provides an employer-paid comparable program for its members. State employees (including Plan 1 and Plan 2 opt-ins) participating in the Hybrid Retirement Plan are covered under the Virginia Sickness and Disability Program (VSDP), and are not eligible for disability retirement. Hybrid members (including Plan 1 and Plan 2 opt-ins) covered under VSDP or VLDP are subject to a one-year waiting period before becoming eligible for non-work-related disability benefits.
Purchase of Prior Service Members may be eligible to purchase service from previous public employment, active duty military service, an eligible period of leave or VRS refunded service as creditable service in their plan. Prior creditable service counts toward vesting, eligibility for retirement and the health insurance credit, if offered by the employer. Only active members are eligible to purchase prior service. Members also may be eligible to purchase periods of leave without pay.
Purchase of Prior Service Same as Plan 1.
Purchase of Prior Service Defined Benefit Component: Same as Plan 1, with the following exception: Hybrid Retirement Plan members are ineligible for ported service. Defined Contribution Component: Not applicable.
Following is a summary of additions and deductions of the four retirement plans, including additions and deductions attributable to VRS members who are employees of local school boards and political subdivisions. The political subdivisions have voluntarily joined the VRS, and the Commonwealth is responsible only for administration of the programs and not for contribution.

B-40
RETIREMENT PLANS ADDITIONS AND DEDUCTIONS
(in thousands)
Each employer contributes an amount for any period equal to the sum of the normal cost and amortization of the unfunded actuarial accrued liability, if any. The Commonwealth's liability is determined, at a minimum, every two years by the System's Board of Trustees on the basis of studies by the consulting actuary. With respect to teachers, the Commonwealth pays a share of the employer contributions on the compensation of teachers who are employees of local school boards with the Commonwealth's portion determined by a formula that uses the student/teacher ratio, average teachers' salaries and the source of revenue used for salary. Employees contribute 5 percent of their creditable compensation unless the contribution is assumed by the employer as in the case of judges. Effective July 1, 2011, Commonwealth employees (except elected officials), state police officers, and state law enforcement and correctional officers other than state police officers began paying the 5% employee contribution. This contribution is handled as a pre-tax payroll deduction. Effective July 1, 2012, teacher and political subdivision employers were required to begin requiring their members to pay the 5% member contribution that was previously paid by the employer. The phase-in required the shift of a minimum of 1% each year with full implementation of the shift to member-paid for all employers by July 1, 2016. Employer contributions are calculated under an entry age normal cost method, and the unfunded actuarial accrued liability is amortized as a level percentage of payroll within 30 years or less. The entry age normal cost method is designed to produce level normal costs over the working lifetime of the participating employees and to permit the amortization of any unfunded liability over a period of years. The unfunded liability arises because normal costs based on the current benefit provisions have not been in effect throughout the working lifetime of current employees and because of actuarial losses. Post-retirement benefit adjustments are pre-funded during the employees’ working lifetime.
The Commonwealth's contribution rates for the 2016 fiscal year were determined in accordance with the actuarial valuation as of June 30, 2013 and the contribution rates for the 2017 fiscal year were determined in accordance with the
2013 2014 2015 2016 2017 Additions:
Member Contributions $ 595,339 $ 725,970 $ 781,755 $ 867,951 $ 916,718
Employer Contributions 2,003,248 1,970,998 2,467,860 2,507,106 2,325,678
Net Investment Income (net of investment expenses) 910,677 983,847 911,279 906,362 904,842
Other 1,574 460 1,723 1,789 1,798
Total Additions 3,510,838 3,681,275 4,162,617 4,283,208 4,149,036
Deductions:
Benefits 3,672,541 3,878,071 4,114,239 4,356,978 4,518,958
Refunds 81,538 103,399 106,115 104,552 119,705
Administrative Expenses 31,866 40,916 41,026 41,587 48,015
Other 4,743 6,994 2,410 2,339 11,403
Total Deductions 3,790,688 4,029,380 4,263,790 4,505,456 4,698,081
Excess of Additions over Deductions [before net
appreciation (depreciation) in fair value of investments] (279,850) (348,105) (101,173) (222,248) (549,045)
Net appreciation (depreciation) in fair value of investments 5,167,659 7,891,213
2,009,958 230,536 7,109,992
Net Position - Restricted for Benefits at the End of the Year $56,979,164 $64,522,272 $66,431,057 $66,439,345 $73,000,292
Note: Effective July 1, 2011, state employees, except state elected officials, judges and optional retirement plan participants, were required to contribute the full 5.00% member contribution that had been previously paid by the employer. Effective July 1, 2012, teachers and political subdivision employers were required to begin requiring their members to pay the 5.00% member contribution that was previously paid by the employer.

B-41
actuarial valuation as of June 30, 2015. In calculating the Commonwealth’s contribution rates for the 2016 fiscal year, the actuary assumed a 7.00 percent net investment yield compounded annually, a 2.50 percent inflation allowance in the salary scale, a 30-year amortization period for the June 30, 2013 Unfunded Actuarial Accrued Liability (UAAL), an 8-year amortization for deferred contributions as defined under the 2011 Appropriations Act, Item 469(I)(6), and valued the assets using a modified market basis. For fiscal year 2016, several changes impacted the contribution rates being paid. The teacher plan received an additional contribution of $192.9 million from the Commonwealth’s Literary Fund. This transfer reduced the teacher actuarial contribution rate from 18.20% to 17.64% and the contributed rate from 14.50% to 14.06%. The judges plan had an increase in the mandatory retirement age from age 70 to age 73. This reduced the actuarial rate from 57.84% to 55.55%. In addition, the Commonwealth elected to move to funding 90% of the actuarial rate effective August 10, 2015. As a result, the contribution rates paid for state, SPORS, VaLORS and Judges were 12.33%, 25.82%, 17.67%, and 49.62%, respectively for the month of July 2015; 13.28%, 26.83%, 18.34%, and 49.82%, respectively for the month of August 2015; and 14.22%, 27.83%, 19.00%, and 50.02%, respectively for the month of September 2015 and the remainder of fiscal year 2016.
For fiscal year 2017, pension contributions due or required were based on the June 30, 2015 actuarial valuation,
adjusted to reflect the impact of the one-time payment of $192,884,000 from the Literary Fund authorized in Item 136 (C)(2c) of Chapter 665 of the 2015 Virginia Acts of Assembly for teachers and the transfer of appropriations of general fund and unobligated non-general fund cash balances in June 2016 of $162,406,000, $2,119,000, $16,492,000, and $8,466,000 for state employee, SPORS, VaLORS, and JRS, respectively, as an accelerated payback of the deferred contribution in the 2010-12 biennium. The transfers for the state employee groups were set out on Item 467(Z), Item 3-1.01(DDD)(1), and Item 3-1.01(DDD)(2) of Chapter 732 of the 2016 Virginia Acts of Assembly.
For fiscal year 2017, the employer retirement contribution rate for state employees was 13.49% and the employer retirement contribution rate for teachers was 14.66%. While the state employee rate was 100% of the adjusted actuarially determined rate, the teacher rate was only 89.84% of the adjusted actuarially determined rate of 16.32% based on the provisions of Section 51.1-145(K1) of the Code of Virginia. Additionally, the employer retirement contribution rates for SPORS, VaLORS and JRS were funded at 100% of the adjusted actuarially determined rate and were 28.54%, 21.05%, and 41.97%, respectively. There was no adjustment to the employer contribution rates for political subdivision employers or to the member contribution rate of 5.00%.
The normal contribution and accrued liability cost rates (expressed as percentages of covered compensation)
recommended by the actuaries are as follows:

B-42
Virginia Retirement System Finance Division
RETIREMENT SYSTEMS CONTRIBUTIONS, ACCRUED LIABILITY AND SUPPLEMENTARY COSTS (1997-1998 biennium through 2017 fiscal year) (1)
State School State Virginia
Law Employees Teachers Police Officers (2) Judges
Normal contribution rate: 1997-1998 2.73 3.51 9.39 - 15.12
1998-1999 3.56 4.54 8.72 - 17.34
1999-2000 4.18 5.09 10.52 4.18 18.74
2000-2001 4.24 5.83 8.92 8.92 27.85
2001-2002 4.00 6.03 7.45 7.91 26.11
2002-2003 4.00 6.03 7.99 8.51 22.27
2003-2004 4.00 6.03 7.99 8.51 22.27
2004-2005 4.00 6.03 7.99 8.51 22.19
2005-2006 4.00 6.03 7.99 8.51 22.19
2006-2007 2.80 4.45 7.47 8.06 24.49
2007-2008 2.80 4.45 8.35 8.06 24.49
2008-2009 2.93 4.71 8.84 8.24 25.13
2009-2010 2.93 4.71 8.84 8.24 25.13
2010-2011 2.67 4.68 8.81 5.81 30.15
2011-2012 2.67 4.68 8.81 5.81 30.15
2012-2013 3.55 5.93 10.49 6.80 33.69
2013-2014 3.55 5.93 10.49 6.80 33.69
2014-2015 4.28 5.77 10.72 7.70 34.31
2015-2016 4.28 5.77 10.72 7.70 34.31
2016-2017 4.18 5.61 11.11 8.15 28.95
Accrued liability rate: 1997-1998 2.08 3.77 3.99 - 13.98
1998-1999 2.28 3.95 8.12 - 14.34
1999-2000 1.85 3.95 8.68 1.85 15.51
2000-2001 0.98 1.71 16.08 7.23 17.15
2001-2002 0.24 (1.79) 17.55 17.09 18.89
2002-2003 0.24 (1.79) 17.01 16.49 22.73
2003-2004 0.24 (1.79) 17.01 16.49 22.73
2004-2005 (0.11) 2.07 17.01 16.49 22.81
2005-2006 (0.11) 2.07 17.01 16.49 22.81
2006-2007 4.53 6.73 12.35 9.33 15.59
2007-2008 4.53 6.73 14.34 9.33 15.59
2008-2009 5.09 7.13 15.25 8.54 12.91
2009-2010 5.09 7.13 15.25 8.54 12.91
2010-2011 5.79 8.23 16.75 10.12 16.64
2011-2012 5.79 8.23 16.75 10.12 16.64
2012-2013 9.52 10.84 22.13 12.72 20.42
2013-2014 9.52 10.84 22.13 12.72 20.42
2014-2015 11.52 12.43 20.06 13.36 23.53
2015-2016 11.52 11.87 20.06 13.36 21.24
2016-2017 9.31 10.71 17.43 12.90 13.02
Total contribution rate: 1997-1998 4.81 7.28 13.38 - 29.10
1998-1999 5.84 8.49 16.84 - 31.68
1999-2000 6.03 9.04 19.20 6.03 34.25
2000-2001 5.22 7.54 25.00 16.15 45.00
2001-2002 (3) 4.24 4.24 25.00 25.00 45.00
2002-2003 (4) 4.24 4.24 25.00 25.00 45.00

B-43
2003-2004 (5) 4.24 4.24 25.00 25.00 45.00
2004-2005 (6) 3.89 8.10 25.00 25.00 45.00
2005-2006 (7) 3.89 8.10 25.00 25.00 45.00
2006-2007 (8) 7.33 11.18 19.82 17.39 40.08
2007-2008 (9) 7.33 11.18 22.69 17.39 40.08
2008-2009 (10) 8.02 11.84 24.09 16.78 38.04
2009-2010 (11) 8.02 11.84 24.09 16.78 38.04
2010-2011 (12) 8.46 12.91 25.56 15.93 46.79
2011-2012 (13) 8.46 12.91 25.56 15.93 46.79
2012-2013 (14) 13.07 16.77 32.62 19.52 54.11
2013-2014 (14) 13.07 16.77 32.62 19.52 54.11
2014-2015 (15) 15.80 18.20 30.78 21.06 57.84
2015-2016 (16) 15.80 17.64 30.78 21.06 55.55
2016-2017 (17) 13.49 16.32 28.54 21.05 41.97
(1) Rates for FY 2000 reflect "carve-out" of a portion of the retirement rate for the Virginia Sickness and Disability Program. (2) The Virginia Law Officers' Retirement System was established October 1, 1999. (3) Contributions actually paid in FY 2002 were 2.12%, 3.60%, 12.50%, 8.07% and 22.50% for State, School Teachers, State Police, VaLORS, and Judges, respectively.
(4) Contributions actually paid in FY 2003 were 0.00%, 3.77%, 11.05%, 12.00% and 29.00% for State, School Teachers, State Police, VaLORS, and Judges, respectively.
(5) Contributions actually paid in FY 2004 were 3.77%, 3.77%, 12.79%, 13.95% and 32.03% for State, School Teachers, State Police, VaLORS, and Judges, respectively.
(6) Contributions actually paid in FY 2005 were 3.91%, 6.03%, 16.49%, 16.99% and 30.55% for State, School Teachers, State Police, VaLORS, and Judges, respectively.
(7) Contributions actually paid in FY 2006 were 3.91%, 6.62%, 16.49%, 16.99% and 30.55% for State, School Teachers, State Police, VaLORS, and Judges, respectively.
(8) Contributions actually paid in FY 2007 were 5.74%, 9.20%, 16.71%, 14.96% and 36.47% for State, School Teachers, State Police, VaLORS, and Judges, respectively.
(9) Contributions actually paid in FY 2008 were 6.15%, 10.30%, 20.76%, 15.86% and 38.01% for State, School Teachers, State Police, VaLORS, and Judges, respectively. State Police computed and paid rates reflect an increase of 2.87% resulting from an increase in the multiplier from 1.70% to 1.85%, effective July 1, 2007.
(10) Contributions actually paid in FY 2009 were 6.23%, 8.81%, 20.05%, 14.23% and 34.51% for State, School Teachers, State Police, VaLORS, and Judges, respectively. (11) Contributions actually paid in FY 2010 were 6.26%, 8.81%, 20.05%, 14.23% and 34.51% for State, School Teachers, State Police, VaLORS, and Judges, respectively. In addition, these contributions were suspended for state employee groups for April, May and the first half of June 2010, and for school teachers for the entire fourth quarter of FY 2010.
(12) Contributions actually paid in FY 2011 were 2.13%, 3.93%, 7.76%, 5.12% and 28.81% for State, School Teachers, State Police, VaLORS, and Judges, respectively. (13) Contributions actually paid in FY 2012 are 6.33% for School Teachers and 2.08%, 7.73%, 5.07% and 28.65% for State, State Police, VaLORS, and Judges, respectively for the period July 2011 through March 2012 and 6.58%, 21.16%, 13.09%, and 42.58% for State, State Police, VaLORS, and Judges, respectively for April, May and June 2012.
(14) Contributions actually paid in FY 2013 and FY 2014 were 8.76%, 11.66%, 24.74%, 14.80% and 45.44% for State, School Teachers, State Police, VaLORS, and Judges, respectively.
(15) Contributions actually paid in FY 2015 were 12.33%, 14.50%, 25.82%, 17.67% and 51.66% for State, School Teachers, State Police, VaLORS, and Judges, respectively. (16) Contributions actually paid in July 2015 were 12.33%, 14.06%, 25.82%, 17.67% and 49.62% for State, School Teachers, State Police, VaLORS, and Judges, respectively. Contributions actually paid in August 2015 were 13.28%, 14.06%, 26.83%, 18.34% and 49.82% for State, School Teachers, State Police, VaLORS, and Judges, respectively. Contributions actually paid in September 2015 through June 2016 were 14.22%, 14.06%, 27.83%, 19.00% and 50.02%, for State, School Teachers, State Police, VaLORS, and Judges, respectively.
(17) Contributions actually paid in FY 2017 were 14.66% for School Teachers. Other groups were 100% of actuarial requirements.

B-44
Effective October 1, 1983, the Commonwealth assumed the 5 percent employee contribution previously paid by its employees who are members of the VRS, SPORS, VaLORS and JRS. The total contribution rate actually being paid by the Commonwealth for Commonwealth employees, state police officers, state law enforcement and correctional officers other than state police officers, and judges through the 2010 fiscal year is, therefore, higher by that amount than what is shown in the summary. Effective July 1, 2011, Commonwealth employees (except elected officials), state police officers, and state law enforcement and correctional officers other than state police officers began paying the 5% employee contribution through payroll deduction. The latest valuations of the pension plans were performed by Cavanaugh Macdonald Consulting, LLC under the provisions of the new Government Accounting Standards Board (GASB) Statement No. 67 using June 30, 2015data, rolled forward to June 30, 2016. The plan fiduciary net position as a percentage of the total pension liability was 71.29% for the VRS state plan, 68.28% for the VRS teacher plan, 83.67% for the aggregate total of the VRS political subdivision plans, 67.22% for SPORS, 61.01% for VaLORS and 75.19% for JRS. The calculations reflect an assumed rate of return on investments of 7.00%. For further discussion of the funding of the pension programs, see “Retirement and Pension Systems” in The Report of the Comptroller for the Fiscal Year Ended June 30, 2015. Investments Allocations and Returns. The target asset allocation is set by the Board of Trustees, with no legal limit imposed by the General Assembly. The actual allocation takes into account that private market investments are made gradually in order to prudently reach the target level over multiple years. Amounts not yet invested in private markets are currently allocated to public equity and fixed income.
Asset Allocation
Actual allocation as of 09/30/2017
Target allocation range
Public Equity 41.3% 38 - 48% Credit Strategies 17.7% 12 - 22% Fixed Income 16.7% 15 - 22% Real Assets 12.6% 9 - 19% Private Equity 8.7% 4 - 14% Strategic Opportunities Portfolio 2.5% 0 - 5% Cash 0.5% 0 - 5% Total* 100.0%
* Totals may not add due to rounding. Source: Virginia Retirement System. As of September 30, 2016, the historical rates of return (on an unaudited basis, expressed in percentages and net of fees) on the System’s investments are as follows:
1 Yr. 3 Yr. 5 Yr. 10 Yr. Total VRS Fund
12.1%
6.2%
9.1%
4.9%
Source: Virginia Retirement System.
The System’s rate of return on investments during the fiscal year ended June 30, 2017, was 12.1% compared to a
return of 1.9% for the fiscal year ending June 30, 2016. The increase was due primarily to the performance of the public equity investments in the portfolio.
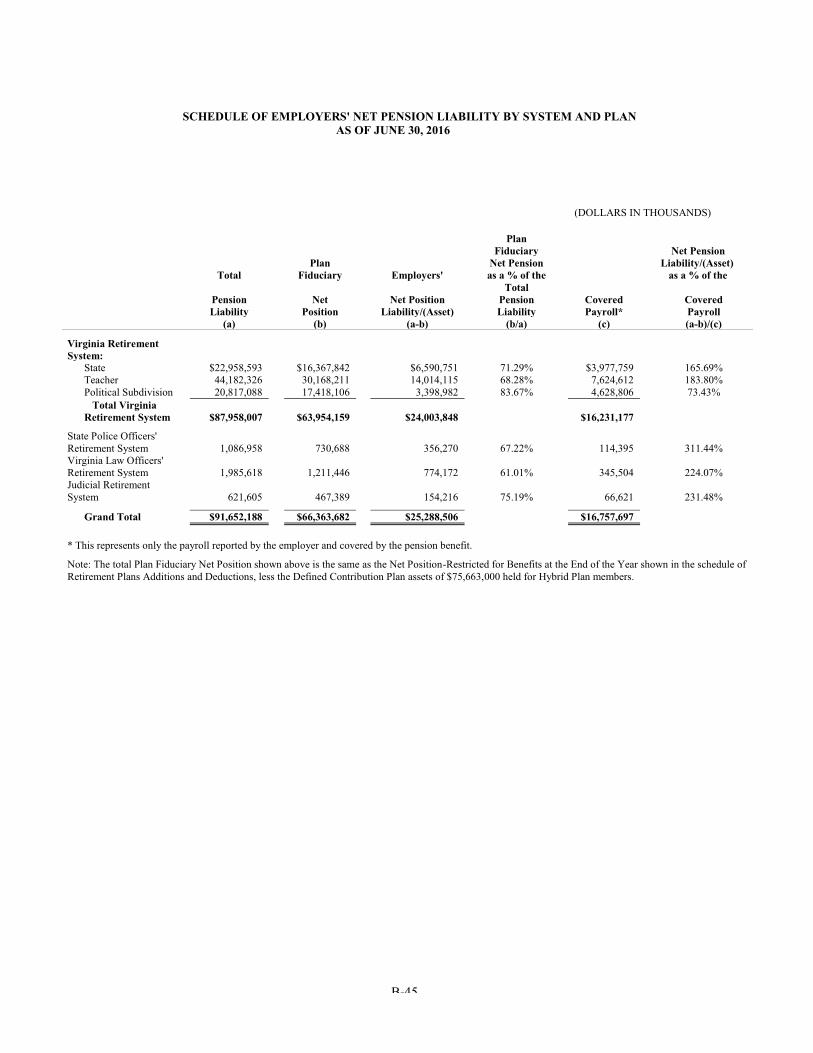
B-45
SCHEDULE OF EMPLOYERS' NET PENSION LIABILITY BY SYSTEM AND PLAN AS OF JUNE 30, 2016
(DOLLARS IN THOUSANDS)
Plan Fiduciary Net Pension
Plan Net Pension Liability/(Asset) Total Fiduciary Employers' as a % of the as a % of the
Pension Net Net Position Total
Pension Covered Covered Liability Position Liability/(Asset) Liability Payroll* Payroll (a) (b) (a-b) (b/a) (c) (a-b)/(c) Virginia Retirement System: State $22,958,593 $16,367,842 $6,590,751 71.29% $3,977,759 165.69%
Teacher 44,182,326 30,168,211 14,014,115 68.28% 7,624,612 183.80%
Political Subdivision 20,817,088 17,418,106 3,398,982 83.67% 4,628,806 73.43%
Total Virginia Retirement System $87,958,007 $63,954,159 $24,003,848 $16,231,177
State Police Officers' Retirement System 1,086,958 730,688 356,270 67.22% 114,395 311.44% Virginia Law Officers' Retirement System 1,985,618 1,211,446 774,172 61.01% 345,504 224.07% Judicial Retirement System 621,605 467,389 154,216 75.19% 66,621 231.48%
Grand Total $91,652,188 $66,363,682 $25,288,506 $16,757,697 * This represents only the payroll reported by the employer and covered by the pension benefit. Note: The total Plan Fiduciary Net Position shown above is the same as the Net Position-Restricted for Benefits at the End of the Year shown in the schedule of Retirement Plans Additions and Deductions, less the Defined Contribution Plan assets of $75,663,000 held for Hybrid Plan members.

B-46
(DOLLARS IN THOUSANDS)
2016 2015 2014 2016 2015 2014
Total pension liability:Service cost 369,779$ 375,149$ 369,120$ 828,856$ 828,901$ 831,501$
Interest 1,533,764 1,482,951 1,436,064 2,931,065 2,834,138 2,722,788
Benefit changes - - - - - -
Difference between actual and -
expected experience (245,642) 59,923 - (391,881) (212,089) -
Assumption changes - - - - - -
Benefit payments (1,195,198) (1,136,102) (1,081,866) (2,081,069) (1,980,353) (1,874,636)
Refunds of contributions (25,240) (27,724) (25,036) (35,067) (36,058) (36,103)
Net change in total pension liability 437,463 754,197 698,282 1,251,904 1,434,539 1,643,550
Total pension liability ‒ beginning 22,521,130 21,766,933 21,068,651 42,930,422 41,495,883 39,852,333 Total pension liability ‒ ending (a) 22,958,593$ 22,521,130$ 21,766,933$ 44,182,326$ 42,930,422$ 41,495,883$
Plan fiduciary net position:Contributions ‒ employer 722,617$ 480,657$ 343,259$ 1,062,338$ 1,267,250$ 853,634$
Contributions ‒ member 200,184 195,582 198,035 380,314 373,525 371,241
Net investment income 277,166 728,083 2,243,999 516,704 1,327,047 4,042,441
Benefit payments (1,195,198) (1,136,102) (1,081,866) (2,081,069) (1,980,353) (1,874,636)
Refunds of contributions (25,240) (27,724) (25,036) (35,067) (36,058) (36,103)
Administrative expense (10,140) (10,302) (12,341) (18,859) (18,238) (22,036)
Other (122) (154) 123 (222) (284) 217
Net change in plan fiduciary net position (30,733) 230,040 1,666,173 (175,861) 932,889 3,334,758
Plan fiduciary net position ‒ beginning 16,398,575 16,168,535 14,502,362 30,344,072 29,411,183 26,076,425 Plan fiduciary net position ‒ ending (b) 16,367,842$ 16,398,575$ 16,168,535$ 30,168,211$ 30,344,072$ 29,411,183$
Net pension liability ‒ ending (a-b) 6,590,751$ 6,122,555$ 5,598,398$ 14,014,115$ 12,586,350$ 12,084,700$
Plan fiduciary net position as a percentage
of the total pension liability (b/a) 71.29% 72.81% 74.28% 68.28% 70.68% 70.88%
Covered payroll (c) 3,977,759$ 3,878,632$ 3,861,712$ 7,624,612$ 7,434,932$ 7,313,025$
Net pension liability as a percentage
of covered payroll ((a-b)/c) 165.69% 157.85% 144.97% 183.80% 169.29% 165.25%
Note: This schedule should present 10 years of data, however, the information prior to FY 2014 is not available.
VRS State VRS Teacher
REQUIRED SUPPLEMENTAL SCHEDULE OF CHANGES IN EMPLOYERS' NET PENSION LIABILITY

B-47
(DOLLARS IN THOUSANDS)
2016 2015 2014 2016 2015 2014
Total pension liability:Service cost 535,322$ 530,945$ 524,758$ 18,700$ 18,847$ 18,341$
Interest 1,362,892 1,309,484 1,243,386 72,618 70,350 67,978
Benefit changes 2,053 1,135 - - - -
Difference between actual and
expected experience (87,268) (185,419) - (14,711) (2,890) -
Assumption changes - - - - - -
Benefit payments (893,585) (819,201) (754,706) (53,515) (53,338) (50,467)
Refunds of contributions (37,380) (36,898) (36,876) (584) (375) (685)
Net change in total pension liability 882,034 800,046 976,562 22,508 32,594 35,167
Total pension liability ‒ beginning 19,935,054 19,135,008 18,158,446 1,064,450 1,031,856 996,689 Total pension liability ‒ ending (a) 20,817,088$ 19,935,054$ 19,135,008$ 1,086,958$ 1,064,450$ 1,031,856$
Plan fiduciary net position:Contributions ‒ employer 543,947$ 533,877$ 539,366$ 33,655$ 28,427$ 42,683$
Contributions ‒ member 231,934 227,060 225,555 5,759 5,680 5,646
Net investment income 300,995 761,164 2,272,284 12,634 32,466 98,682
Benefit payments (893,585) (819,201) (754,706) (53,515) (53,338) (50,467)
Refunds of contributions (37,380) (36,898) (36,876) (584) (375) (685)
Administrative expense (10,696) (10,358) (12,153) (590) (471) (431)
Other (130) (162) 120 (23) (27) -
Net change in plan fiduciary net position 135,085 655,482 2,233,590 (2,664) 12,362 95,428
Plan fiduciary net position ‒ beginning 17,283,021 16,627,539 14,393,949 733,352 720,990 625,562 Plan fiduciary net position ‒ ending (b) 17,418,106$ 17,283,021$ 16,627,539$ 730,688$ 733,352$ 720,990$
Net pension liability ‒ ending (a-b) 3,398,982$ 2,652,033$ 2,507,469$ 356,270$ 331,098$ 310,866$
Plan fiduciary net position as a percentage
of the total pension liability (b/a) 83.67% 86.70% 86.90% 67.22% 68.89% 69.87%
Covered payroll (c) 4,628,806$ 4,513,335$ 4,434,764$ 114,395$ 110,059$ 112,010$
Net pension liability as a percentage
of covered payroll ((a-b)/c) 73.43% 58.76% 56.54% 311.44% 300.84% 277.53%
Note: This schedule should present 10 years of data, however, the information prior to FY 2014 is not available.
VRS Political Subdivisions SPORS
REQUIRED SUPPLEMENTAL SCHEDULE OF CHANGES IN EMPLOYERS' NET PENSION LIABILITY

B-48
In addition to the defined benefit programs described above, the Commonwealth also makes contributions to a defined contribution retirement plan for political appointees. Contributions for this plan are based on 12.3% of each appointee's salary. At June 30, 2017, this plan had 341 accounts and total assets of approximately $14,864,428.
OTHER LONG-TERM LIABILITIES
Employee Benefits Other than Pension Benefits Employees of the Commonwealth accrue annual leave at a rate of four to nine hours semi-monthly, depending on their length of service. The maximum accumulation is dependent on years of service, but in no case may it exceed 42 days. All employees hired after January 1, 1999, are required to enroll in the Virginia Sickness and Disability Program (“VSDP”). Under the VSDP, employees receive a specified number of sick and personal leave hours, depending on their length of service, and any balances at the end of the calendar year revert. Individuals employed at January 1, 1999, had the option of converting to the VSDP or remaining in the original sick leave plan. If converting, the employee’s sick leave balance could be used to purchase retirement credits or be converted to disability credits. If an employee opted to remain in the original sick leave program, sick leave accrues at a rate of five hours semimonthly. Employees who leave State service after a minimum of five years employment receive the lesser of 25 percent of the value of their disability credits
(DOLLARS IN THOUSANDS)
2016 2015 2014 2016 2015 2014
Total pension liability:Service cost 45,608$ 47,531$ 46,504$ 21,978$ 23,254$ 24,024$
Interest 129,756 124,579 119,040 42,820 41,759 40,013
Benefit changes - - - (15,552) - -
Difference between actual and
expected experience 4,997 (4,849) - (18,681) (9,107) -
Assumption changes - - - . - -
Benefit payments (92,270) (84,990) (78,412) (41,341) (40,205) (37,984)
Refunds of contributions (4,524) (4,797) (4,665) - - -
Net change in total pension liability 83,567 77,474 82,467 (10,776) 15,701 26,053
Total pension liability ‒ beginning 1,902,051 1,824,577 1,742,110 632,381 616,680 590,627 Total pension liability ‒ ending (a) 1,985,618$ 1,902,051$ 1,824,577$ 621,605$ 632,381$ 616,680$
Plan fiduciary net position:Contributions ‒ employer 79,392$ 62,084$ 67,483$ 41,502$ 31,503$ 27,727$
Contributions ‒ member 17,574 17,081 17,908 3,236 3,015 3,051
Net investment income 20,899 52,312 156,786 8,112 20,051 60,833
Benefit payments (92,270) (84,990) (78,412) (41,341) (40,205) (37,984)
Refunds of contributions (4,524) (4,797) (4,665) - - -
Administrative expense (940) (743) (681) (363) (283) (268)
Other (38) (44) - (15) (17) -
Net change in plan fiduciary net position 20,093 40,903 158,419 11,131 14,064 53,359
Plan fiduciary net position ‒ beginning 1,191,353 1,150,450 992,031 456,258 442,194 388,835 Plan fiduciary net position ‒ ending (b) 1,211,446$ 1,191,353$ 1,150,450$ 467,389$ 456,258$ 442,194$
Net pension liability ‒ ending (a-b) 774,172$ 710,698$ 674,127$ 154,216$ 176,123$ 174,486$
Plan fiduciary net position as a percentage
of the total pension liability (b/a) 61.01% 62.64% 63.05% 75.19% 72.15% 71.71%
Covered payroll (c) 345,504$ 338,562$ 352,492$ 66,621$ 61,092$ 61,020$
Net pension liability as a percentage
of covered payroll ((a-b)/c) 224.07% 209.92% 191.25% 231.48% 288.29% 285.95%
Note: This schedule should present 10 years of data, however, the information prior to FY 2014 is not available.
VaLORS JRS
REQUIRED SUPPLEMENTAL SCHEDULE OF CHANGES IN EMPLOYERS' NET PENSION LIABILITY

B-49
or accumulated sick leave at the current earnings rate or $5,000. All employees leaving State service are paid for accrued annual leave up to the maximum calendar year limit at their current earnings rate. The VSDP was established for all full-time, classified state employees, including state police officers, and other state law enforcement and correctional officers. Part-time, classified state employees who work at least 20 hours a week on a salaried basis and who accrue leave are also covered. After a seven calendar-day waiting period following the first incident of disability, the VSDP provides short-term disability benefits from 60% to 100% of compensation up to a maximum of 125 work days. After a 180 calendar day waiting period, eligible employees receive long-term disability benefits equal to 60% of compensation until they return to work, until age 65 (age 60 for state police officers and other state law enforcement and correctional officers), or until death. Eligibility periods for non-work related disability coverage and certain income replacement levels apply for employees hired on or after July 1, 2009. In addition to providing pension benefits, the Commonwealth provides life insurance for active and retired employees and a retiree health insurance credit to offset a portion of the cost of health insurance premiums for qualifying state retirees under VRS, SPORS, JRS and VaLORS. The estimated costs of these benefits are funded over the working lives of the employees through employer contributions and investment income.
Self-Insurance The Commonwealth provides several types of self-insurance for the benefit of state agencies and institutions. The Department of the Treasury, Division of Risk Management, administers self-insurance programs for general (tort) liability, medical malpractice and automobile liability. The Department of Human Resource Management administers the state employee health care self-insurance fund. At June 30, 2017, $958.7 million was reported as the combined estimated claims payable for self-insurance.
Medicaid Payable The Department of Medical Assistance Services estimates, based on past experience, the total amount of claims that will be paid from the Medicaid program in the future which relate to services provided before year end. At June 30, 2016, the estimated liability related to normal operations totaled $726.1 million. Of this amount, $367.4 million is reflected in the General Fund and $358.7 million in the Federal Trust Special Revenue Fund. For a more detailed explanation of Other Long-Term Liabilities, see "Notes to the Financial Statements" in The Report of the Comptroller for the Fiscal Year Ended June 30, 2016.
Other Post-Employment Benefits (OPEB) – Financial Statement Reporting The Commonwealth currently has five postemployment benefit programs other than the retirement plans described above (“OPEB Programs”). They are: Retiree Health Insurance Credit, Group Life Insurance, Virginia Sickness and Disability Plan, Pre-Medicare Retiree Health Insurance Program and Line of Duty Death and Health Insurance Benefit.
The Governmental Accounting Standards Board (GASB) issued accounting and reporting standards for other
postemployment benefits. The VRS implemented GASB Statement No. 43, Financial Reporting for Postemployment Benefit Plans Other Than Pension Plan, in their published financial statements for the fiscal year ended June 30, 2007. The Commonwealth, as an employer, implemented GASB Statement No. 45, Accounting and Financial Reporting by Employers for Postemployment Benefits Other Than Pensions for the fiscal year ended June 30, 2008.
The Commonwealth’s OPEB programs promise benefits to individuals who perform services for government today to be paid following the conclusion of their service. Historically, the Commonwealth and most other government employers financed other post-employment benefit programs on a pay-as-you-go basis. The new reporting standards require expenses associated with these programs to be calculated and reported on an actuarial basis even though payment is deferred until after an individuals’ service ends. As of June 30, 2017, the Commonwealth’s estimated annual required OPEB contribution was $444.8 million and the estimated unfunded actuarial liabilities were $4.0 billion.
B-50
LABOR RELATIONS
It is against public policy for Commonwealth or local officials to recognize any labor union as a representative of public employees or to engage in collective bargaining with any labor union. Public employees of the Commonwealth do not have a legal right to strike, and no strike by employees of the Commonwealth has ever taken place. Any such employee who engages in any organized strike or willfully refuses to perform his duties shall, according to state law, be deemed to have terminated his employment. The General Assembly has rejected several recent legislative proposals to authorize public employees to engage in collective bargaining.
LITIGATION
The Commonwealth, its officials and employees are named as defendants in legal proceedings which occur in the normal course of governmental operations, some involving claims for substantial amounts. It is not possible at the present time to estimate the ultimate outcome or liability, if any, of the Commonwealth with respect to these lawsuits. However, any ultimate liability resulting from these suits is not expected to have a material adverse effect on the financial condition of the Commonwealth.
TOBACCO SETTLEMENT The Commonwealth is a party to the national tobacco settlement (the “Settlement”) between leading United States tobacco product manufacturers, 45 other states, the District of Columbia and 5 territories. The Settlement provides that tobacco companies pay a total of $206 billion to the participating states by the year 2025; significantly curb their advertising; and disband industry trade groups. The Commonwealth’s share of the total amount to be paid to states through 2025 would be approximately $4.1 billion. The exact dollar amount is contingent upon certain adjustments as set forth in the Settlement. Under the Settlement, the tobacco companies will make three types of payments. Tobacco companies made five “initial payments” totaling approximately $13 billion over the six year period ending in January 2003. In addition, the tobacco companies make “annual payments” that began on April 15, 2000. Such payments will be paid annually into perpetuity and will be adjusted annually based on inflation and volume adjustments as determined by future sales of cigarettes. Approximately $8.6 billion of the Settlement was deposited into a strategic contribution fund and allocated based on the states' contribution toward resolving the Settlement. The “strategic contribution payments” will be made in equal installments over a 10-year period beginning in 2008. The Commonwealth created the Tobacco Region Revitalization Commission (formerly the Tobacco Indemnification and Community Revitalization Commission) and Fund (the “TICR Commission” and “TICR Fund,” respectively). Fifty percent of the amounts received by the Commonwealth from the Settlement is allocable to the TICR Commission (the “TICR Commission Allocation”). The TICR Commission distributes moneys in the TICR Fund to (i) provide payments to tobacco farmers as compensation for the elimination or decline in tobacco quotas and (ii) promote economic growth and development in tobacco dependent communities. In 2002, the General Assembly authorized the securitization of the TICR Commission Allocation and created the Tobacco Settlement Financing Corporation (the “Corporation”). The Corporation was established to carry out the financing, purchasing, owning and managing of the portion of the TICR Commission Allocation that may be sold by the Commonwealth from time to time. On May 16, 2005, the Corporation issued $448,260,000 of its Tobacco Settlement Asset-Backed Bonds, Series 2005 (the “Series 2005 Bonds”). Net proceeds of the sale were deposited to the Tobacco Indemnification and Community Revitalization Endowment established pursuant to Section 3.1-1109.1 of the Code of Virginia to fund economic development projects throughout Southside and Southwest Virginia. On May 3, 2007, the Corporation issued $1,149,273,283 of its Tobacco Settlement Asset-Backed Bonds, Series 2007 (the “Series 2007 Bonds”). A portion of the proceeds of the Series 2007 Bonds were used to defease and refund the outstanding Series 2005 Bonds. The Series 2007 Bonds are backed solely by the TICR Commission Allocation. Tobacco Bonds issued by the Corporation are not obligations of the Commonwealth or any instrumentality other than the Corporation. The Commonwealth also created the Virginia Foundation for Healthy Youth, and within it, the Virginia Tobacco Settlement Foundation to coordinate and finance efforts to restrict the use of tobacco products by minors through such means as educational and awareness programs on the health effects of tobacco use on minors and laws restricting the distribution of tobacco products to minors. Ten percent of the annual amount received by the Commonwealth from the Settlement is allocated to the Virginia Tobacco Settlement Fund (the “Foundation Allocation”). Chapter 345 of the 2007

B-51
Virginia Acts of Assembly authorizes the securitization of the Foundation Allocation; however no securitization of the Foundation Allocation has occurred. The remaining forty percent of unallocated Settlement payments are deposited to the General Fund. The allocation and expenditures of the annual amounts received by the Commonwealth from the settlement are subject to appropriation by the General Assembly.
EFFECTS OF FEDERAL SEQUESTRATION ON VIRGINIA The Federal budget reductions commonly referred to as “Sequestration” are expected to negatively impact Virginia disproportionately compared to other states. The steep reduction in federal military and domestic programs is expected to acutely impact Virginia because of Virginia’s robust community of defense contractors and other federal contractors. From 2001 to 2011, economists observed that Virginia’s economy grew more dependent on federal government spending, with about $58.9 billion being spent in Virginia in 2011. This was more than any other state and was the equivalent of 13.7 percent of Virginia’s total economic output. According to a June 2014 Report of the Joint Legislative Audit and Review Commission (JLARC) entitled Size and Impact of Federal Spending in Virginia, cuts in federal spending will have larger adverse impacts in Virginia than other states, in part because the state relies more on military spending. Sequestration will cause many areas of discretionary federal spending such as military procurement to decline or grow more slowly through 2021. Military contracts in Virginia have already declined from $44 to $35 billion or about 20 percent between 2011 and 2013. The JLARC report predicts that federal spending cuts will also adversely affect Virginia state tax revenue because 18 to 30 percent of general fund revenue is estimated to come from federal spending. Virginia is currently experiencing slower job and economic growth than the national average. The reduction in defense spending will be felt primarily in Northern Virginia and the Hampton roads area.

[THIS PAGE INTENTIONALLY LEFT BLANK]

APPENDIX C
COMMONWEALTH OF VIRGINIA DEMOGRAPHIC AND ECONOMIC INFORMATION
Report Date: October 23, 2017
APPENDIX C TABLE OF CONTENTS
INTRODUCTION ........................................................................................................................................ 1 DEMOGRAPHIC CHARACTERISTICS .................................................................................................... 1
General ................................................................................................................................................................ 1 Population Trends ................................................................................................................................................ 1 Age Distribution of Population ............................................................................................................................ 2 Geographic Distribution of Population ................................................................................................................ 2
ECONOMIC FACTORS ........................................................................................................................................... 4 Taxable Retail Sales ............................................................................................................................................ 4 Personal Income .................................................................................................................................................. 4 Residential Construction ...................................................................................................................................... 7 Assessed Value of Locally Taxed Property ......................................................................................................... 8 Employment ........................................................................................................................................................ 8 Largest Employers ............................................................................................................................................. 11 Unemployment .................................................................................................................................................. 12 Other Economic Factors .................................................................................................................................... 13

C-1
INTRODUCTION
The following demographic and economic information is provided by the Commonwealth of Virginia, its agencies,
institutions and authorities (the "Commonwealth"). The data were compiled by the Department of the Treasury and were not
independently verified; however, the Department of the Treasury has no reason to believe that such material is not true and correct.
DEMOGRAPHIC CHARACTERISTICS
General
The Commonwealth is divided into five distinct geographic regions – The Tidewater region is a coastal plain cut into
peninsulas by four large tidal rivers. It includes the Eastern Shore and estuaries of the Chesapeake Bay. The Piedmont Plateau is
the largest geographical land of the state, and is characterized by low, rolling hills. The Blue Ridge Mountains, which lie to the
west of the Piedmont region, are the main eastern mountain range of the Appalachian Mountains. The Appalachian Ridge and
Valley Region stretch from southwest to the northeast along Virginia's western border, and include the Shenandoah Valley. The
Appalachian Plateau region lies in the far southwestern portion of Virginia. In Kentucky it is called the Cumberland Plateau. The
topography of this region is characterized by rivers, streams, and forests. Approximately one-third of all land in Virginia is used
for farming and other agricultural services. This variety of terrain, the location of the Commonwealth on the Atlantic Seaboard at
the southern extremity of the northeast population corridor and its close proximity to the nation's capital have had a significant
influence on the development of the present economic structure of the Commonwealth.
According to the U.S. Census Bureau, the Commonwealth's 2016 estimated population was 8,411,808 which was 2.6
percent of the United States total. Among the 50 states, it ranked twelfth in population. With 39,490 square miles of land area, its
2016 population density was 213.0 persons per square mile, compared with 91.5 persons per square mile for the United States.
Population Trends
From 2007 to 2016, Virginia's population increased 8.9 percent versus 7.1 percent for the nation. Population trends since
2007 for the Commonwealth and the United States are shown in the following table:
POPULATION TREND
Virginia United States Increase Increase Over Over Preceding Preceding Year Population Year Population Year 2007 7,719,749 1.0 301,579,895 1.0
2008 7,795,424 1.0 304,374,846 0.9
2009 7,882,590 1.1 307,006,550 0.9
2010 8,001,024 1.5 308,745,538 0.6
2011 8,104,384 1.3 311,587,816 0.9
2012 8,193,422 1.1 313,873,685 0.7
2013 8,270,345 0.9 316,497,531 0.8
2014 8,326,289 0.7 318,857,056 0.7
2015 * 8,382,993 0.7 321,418,820 0.8
2016 * 8,411,808 0.3 323,127,513 0.5
Source: U.S. Department of Commerce, Bureau of the Census. * 2015 and 2016 Estimates revised as of December 2016. 2017 Data not yet available.

C-2
AGE DISTRIBUTION OF POPULATION
Compared to the nation, a higher proportion of the Commonwealth's population is in the adult/working ages of 20 through
64. A lower proportion of Virginia's population is comprised of persons ages 65 and older and of persons ages 5 through 19. In
2016, the population of the Commonwealth and of the United States was distributed by age as follows:
AGE DISTRIBUTION 2016
Age Virginia United States
Under 5 years 6.1 % 6.2 %
5 through 19 years 18.8 19.2 20 through 44 years 33.9 33.3 45 through 64 years 26.7 26.1 65 years and older 14.6 15.2
100.0 % 100.0 %
Source: U.S. Bureau of the Census Annual Estimates as of June 2017.
GEOGRAPHIC DISTRIBUTION OF POPULATION
Like the nation as a whole, the Commonwealth has a high percentage of its citizens living in urban areas. Virtually all of
the Commonwealth's population growth between 1950 and 1970 occurred in these areas. During the 1970s, however, non-
metropolitan areas grew at a slightly faster rate than metropolitan areas. Since 1980, this trend has reversed with the metropolitan
areas growing at three times the rate of the rest of the Commonwealth. Of the Commonwealth’s population, 87 percent reside in
ten metropolitan statistical areas.
The largest metropolitan area is the Northern Virginia portion of the Washington-Arlington-Alexandria MSA. This is the
fastest growing metropolitan area in the Commonwealth and had a 2016 population of 6,131,977 (including Washington and
Maryland’s population of 1,982,950). Northern Virginia has long been characterized by the large number of people employed in
both civilian and military work with the federal government. It is also one of the nation’s leading high-technology centers for
computer software and telecommunications.
Spanning Hampton Roads is the Virginia Beach-Norfolk-Newport News MSA, which has large military installations and
major port facilities. It had a 2016 population of 1,726,907 and is an important center of manufacturing and tourism. The
Richmond MSA is the third largest metropolitan area with a 2016 population of 1,281,708. The Richmond MSA is a leading
center of diversified manufacturing activity including chemicals, tobacco, printing, paper, metals and machinery. Richmond is
also the capital of the Commonwealth and its financial center, which includes the Fifth District Federal Reserve Bank. The
Roanoke MSA is the manufacturing, trade and transportation center for the western part of the Commonwealth. It had a 2016
population of 313,698. Also in the western part of the Commonwealth are the Lynchburg and Kingsport-Bristol-Bristol MSAs,
which are both manufacturing centers, and had 2016 populations of 260,232 and 306,334, respectively. The Kingsport-Bristol-
Bristol population includes West Virginia portions of the MSA. Located at the foot of the Blue Ridge Mountains is the
Charlottesville MSA, a community with a 2016 population of 231,349 and home of the University of Virginia and significant
manufacturing industries.

C-3
In 2003, the federal Office of Management & Budget recognized three new Virginia MSAs -- Winchester, Harrisonburg
and Blacksburg-Christiansburg-Radford. The Winchester MSA is located at the northernmost tip of Virginia and had a 2016
population of 135,238. This fast-growing community has become increasingly attractive for both business and residential
development due to its location bordering the Washington-Arlington-Alexandria MSA. With a population of 6,131,977, this region
is the home of the George Mason University, Virginia’s largest university and is the Commonwealth’s largest public research university. The Harrisonburg MSA, a community with a 2016 population of 132,822, is located in western central Virginia. It is
a major retail, service and manufacturing center in the Shenandoah Valley. With a 2016 population of 182,876, the Blacksburg-
Christiansburg-Radford MSA is located in the New River Valley in southwestern Virginia. The town of Blacksburg is the home
of Virginia Polytechnic Institute & State University, Virginia’s second largest university and one of the nation’s leading research institutions. Population figures for all ten Commonwealth MSAs are shown below:
METROPOLITAN STATISTICAL AREA POPULATION AND PER CAPITA INCOME
2016 Per Capita
MSA Population Income*** Blacksburg-Christiansburg-Radford 182,876 $34,370
Charlottesville 231,349 52,795
Harrisonburg 132,822 35,700
Kingsport-Bristol-Bristol* 306,334 37,322
Lynchburg 260,232 37,107
Richmond 1,281,708 50,460
Roanoke 313,698 43,405
Virginia Beach-Norfolk-Newport News 1,726,907 46,400
Washington-Arlington-Alexandria** 6,131,977 64,882
Winchester 135,238 42,436
2016(2) 2016(1) Per Capita Population Income
Commonwealth of Virginia 8,411,808 $53,723
Source: (1) 2016 Commonwealth Population and MSA Population Data Release Date: March 2017. (2) Per Capital Income data for the Commonwealth dated as of March 2017.
* Kingsport-Bristol-Bristol MSA includes West Virginia. ** Washington-Arlington-Alexandria MSA includes Washington and Maryland. ***2016 Per Capita Income by MSA data not available. Per Capita Income by MSA for 2015 dated as of November 2016.
Distributed throughout Virginia are smaller urban areas, most of which historically have been trade centers for the
surrounding areas and continue to be so today. These communities have attracted many of the new manufacturing facilities locating
in the Commonwealth in recent years. The remainder of the Commonwealth's population lives in rural areas, including most of the
towns and the remaining smaller cities.

C-4
ECONOMIC FACTORS
Taxable Retail Sales
Over the past ten years, taxable retail sales in Virginia increased by $10.7 billion, or 12.0 percent. This growth is less
than the average rate of inflation for this same period, which was 17.6 percent. The following table illustrates the changes in
taxable retail sales for calendar years 2006 through 2015:
Taxable
Calendar Retail % Year
Sales Change
2006 $89,478,625,283 15.8
2007
92,043,248,947 2.9
2008 89,773,478,959 -2.5
2009
85,869,132,300 -4.3
2010
86,420,963,843 0.6
2011
89,070,341,371 3.1
2012
93,335,660,137 4.8
2013
94,597,893,918 1.4
2014
96,203,913,416 1.7
2015 100,219,956,703 4.2
2016 101,740,768,841 1.5
Source: Department of Taxation as of February 2017. Personal Income
According to the U.S. Department of Commerce, estimated personal income for Virginians in 2016 was over $451.9
billion. This results in a Commonwealth per capita income of $53,723, ranking eleventh among states and greater than the national
average of $49,571.
From 2007 to 2016, the Commonwealth’s 2.5 percent average annual rate of growth in per capita income was slightly less
than the national average rate of growth of 2.8 percent. Virginia and United States per capita personal income are shown in the
following table and graph:

C-5
PERSONAL INCOME TRENDS
Virginia United States
Increase Increase Per Capita Over Per Capita Over Personal Preceding Personal Preceding Year Income Year Income Year 2007 $43,921 4.4 $39,804 4.4
2008 44,900 2.2 40,873 2.7
2009 44,063 -1.9 39,357 -3.7
2010 44,854 1.8 40,163 2.0
2011 47,126 5.1 42,298 5.3
2012 48,377 2.7 43,735 3.4
2013 48,838 1.0 44,765 2.4
2014 50,345 3.1 46,049 2.9
2015 52,052 3.4 48,112 4.5
2016 53,723 3.2 49,571 3.0
Source: Bureau of Economic Analysis revised estimates for 2007-2016 dated as of March 2017.
Source: Bureau of Economic Analysis as of March 2017.
$20,000
$25,000
$30,000
$35,000
$40,000
$45,000
$50,000
$55,000
2007 2008 2009 2010 2011 2012 2013 2014 2015 2016
Virginia United States

C-6
In 2017, the sources of personal income in the Commonwealth and the comparable sources of personal income for the
United States are shown in the following table and pie chart:
SOURCES OF PERSONAL INCOME 2017
Percentage of Personal Income Before Virginia Residence Adjustment (in Millions) Virginia United States Forestry, fisheries, related activities and other $ 505 0.2 % 0.3 % Construction 18,531 5.7 6.0 Farming 134 0.0 0.6 Finance and insurance 16,361 5.1 6.8 Government: State and local 36,475 11.3 12.4 Federal, civilian 27,017 8.4 2.9 Federal, military 13,123 4.1 1.2 Manufacturing 18,243 5.6 9.4 Mining 149 0.0 1.2 Services 156,597 48.4 44.0 Transportation, warehousing & utilities 9,063 2.8 4.4 Wholesale and retail trade 27,316 8.4 10.8 Subtotal $ 323,515 100 % 100 %
Contributions for government social insurance (36,988) Plus: Dividends, interest and rent 91,150 Transfer payments 64,151 Personal income before residence adjustment $ 441,828 Residence adjustment (1) 20,586 Total Personal Income $ 462,415
Source: Bureau of Economic Analysis est. for 1st Quarter 2017, data as of June 2017. (1) Total personal income is reported by place of residence. However, income by industry is shown by place of work. Thus, this adjustment was necessary to account for income earned by Virginia residents who worked outside the Commonwealth. These were primarily federal government employees who lived in Northern Virginia but worked in Washington, D.C.
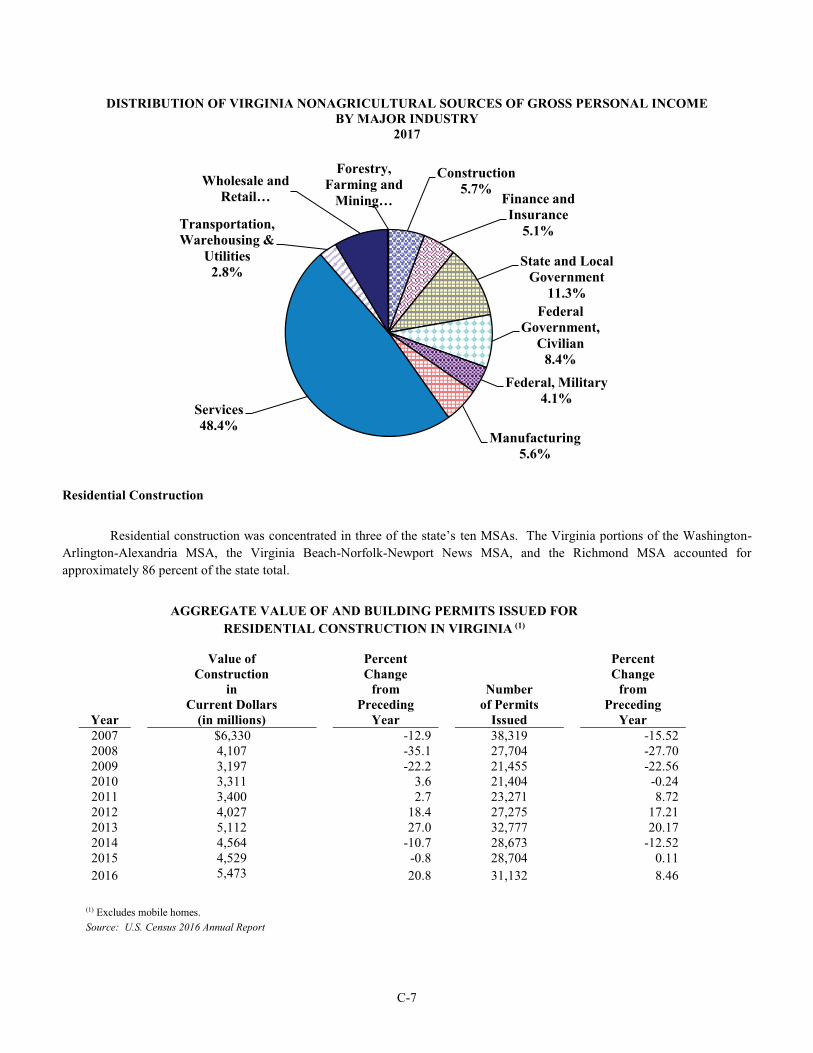
C-7
DISTRIBUTION OF VIRGINIA NONAGRICULTURAL SOURCES OF GROSS PERSONAL INCOME BY MAJOR INDUSTRY
2017
Residential Construction
Residential construction was concentrated in three of the state’s ten MSAs. The Virginia portions of the Washington-
Arlington-Alexandria MSA, the Virginia Beach-Norfolk-Newport News MSA, and the Richmond MSA accounted for
approximately 86 percent of the state total.
AGGREGATE VALUE OF AND BUILDING PERMITS ISSUED FOR
RESIDENTIAL CONSTRUCTION IN VIRGINIA (1) Value of Percent Percent Construction Change Change in from Number from Current Dollars Preceding of Permits Preceding Year (in millions) Year Issued Year 2007 $6,330 -12.9 38,319 -15.52
2008 4,107 -35.1 27,704 -27.70
2009 3,197 -22.2 21,455 -22.56
2010 3,311 3.6 21,404 -0.24
2011 3,400 2.7 23,271 8.72
2012 4,027 18.4 27,275 17.21
2013 5,112 27.0 32,777 20.17
2014 4,564 -10.7 28,673 -12.52
2015 4,529 -0.8 28,704 0.11
2016 5,473 20.8 31,132 8.46
(1) Excludes mobile homes.
Source: U.S. Census 2016 Annual Report
Construction5.7%
Finance and Insurance
5.1%
State and Local Government
11.3%Federal
Government, Civilian
8.4%Federal, Military
4.1%
Manufacturing5.6%
Services48.4%
Transportation, Warehousing &
Utilities2.8%
Wholesale and Retail …
Forestry, Farming and
Mining…

C-8
Assessed Value of Locally Taxed Property
The Constitution of Virginia provides that real estate, coal and other mineral lands and tangible personal property, except
the rolling stock of public service corporations, are reserved for taxation by cities, counties, towns and other local government
entities. Shown below is the assessed value of real estate and personal property as determined by the various taxing jurisdictions
and the combined value of real estate and personal property for public utilities as determined by the State Corporation Commission.
Cities and counties are required by law to assess real estate at 100 percent of market value.
ASSESSED VALUES OF REAL ESTATE AND TANGIBLE PERSONAL PROPERTY
Tax Year Ended Public Service Personal 31-Dec Real Estate Corporation Property Total
2006 $900,079,538,628 $28,843,374,447 $69,815,543,837 $998,738,456,912
2007 982,816,278,651 29,126,367,531 70,911,848,399 1,082,854,494,581
2008 1,023,386,154,546 31,749,628,737 71,398,689,437 1,126,534,472,720
2009 988,853,631,404 34,705,834,232 68,225,665,097 1,091,785,130,733
2010 940,691,278,363 37,137,075,381 70,049,322,677 1,047,877,676,422
2011 949,019,441,456 38,455,832,384 71,600,491,421 1,059,075,765,261
2012 954,082,225,088 40,142,313,094 76,551,011,940 1,070,775,550,122
2013 968,744,700,482 41,415,115,231 73,286,019,303 1,083,445,835,016
2014 1,001,173,297,581 42,105,842,848 81,234,501,278 1,124,513,641,707
2015 1,031,975,708,795 44,154,961,529 84,093,951,056 1,160,224,621,380
Source: Department of Taxation's 2016 Annual Report 2016 data not yet available
Employment
As of August 2017, up to 4.3 million residents of the Commonwealth were in the civilian labor force, which includes
agricultural and nonagricultural employment, the unemployed, the self-employed and residents who commute to jobs in other
states.
Virginia is a right-to-work state with diverse sources of income. In part because of its proximity to Washington DC,
Virginia has a larger share of federal and military employees than most states. More than ten percent of Virginia’s workers are federal employees or active military. The following table indicates the distribution by category of nonagricultural employment in
the Commonwealth and the comparative distribution in the United States.

C-9
DISTRIBUTION OF NONAGRICULTURAL EMPLOYMENT 2017
Virginia United States Natural Resource & Mining 0.2 % 0.5 % Construction 4.8 4.6 Manufacturing 5.9 8.4 Wholesale Trade 3.8 4.0 Retail Trade 10.0 10.6 Transportation, Warehousing & Utilities 2.8 3.8 Information Services 1.6 1.8 Financial Activities 5.2 7.4 Professional & Business Activities 18.5 13.9 Education & Health 13.9 15.5 Leisure & Hospitality 10.3 10.7 Other Services 5.1 3.9 Public Administration Federal Government 4.5 1.9 State Government 4.0 3.4 Local Government 9.5 9.6
100.0 % 100.0 %
Source: National Data is Preliminary from The Department of Labor, Bureau of Labor Statistics Release Date September 2017
Virginia Data is Preliminary from The Virginia Employment Commission Release Date September 2017
DISTRIBUTION OF VIRGINIA NONAGRICULTURAL EMPLOYMENT BY MAJOR INDUSTRY 2017
Construction4.8% Manufacturing
5.9%Wholesale Trade
3.8%Retail Trade
10.0%Transportation, Warehousing &
Utilities2.8%
Information Services
1.6%Financial Activities
5.2%Professional &
Business Activities18.5%
Natural Resource & Mining
0.2%
Education & Health13.9%
Leisure & Hospitality
10.3%
Other Services5.1%
Federal Government4.5%
State Government4.0%
Local Government
9.5%

C-10
NONAGRICULTURAL EMPLOYMENT
% Change
2013 2014 2015 2016 2017 2013-2017
Natural Resource & Mining 10,100 9,800 8,100 8,300 7,600 -24.8 % Construction 177,300 179,900 185,600 188,800 191,000 7.7 Manufacturing 230,600 231,300 235,400 229,500 233,800 1.4 Wholesale Trade 111,200 102,880 150,512 155,848 152,444 37.1 Retail Trade 409,900 424,380 394,276 408,254 399,337 -2.6 Transportation & Warehousing, Utilities 116,200 115,740 109,612 113,498 111,019 -4.5 Information Services 71,100 68,800 70,500 68,400 64,500 -9.3 Financial Activities 192,100 196,200 198,600 200,900 206,100 7.3 Professional & Business Activities 678,200 663,000 695,300 726,900 735,100 8.4 Education & Health 497,100 513,100 507,600 530,700 554,000 11.4 Leisure & Hospitality 366,200 374,200 385,100 393,200 409,100 11.7 Other Services 193,900 197,200 199,200 205,000 202,500 4.4 Public Administration Federal Government 173,600 170,700 170,700 178,300 178,200 2.6 State Government 160,000 162,300 163,400 163,300 160,200 0.1 Local Government 376,400 375,300 374,100 374,000 376,300 0.0 Total 3,763,900 3,784,800 3,848,000 3,944,900 3,981,200 5.8 %
Virginia Employment Commission Report Release date August 2017.
The table above shows employment trends in the Commonwealth during the five years from 2013 to 2017. The most
significant growth has occurred in the Wholesale Trade, Education & Health, Leisure & Hospitality and Construction sectors,
while the largest declines were in the Natural Resources & Mining sectors and Information Services.
From 2016 to 2017, the largest growth rates occurred in the Education & Health sector which increased by 4.4 percent,
from 530,700 in 2016 to 554,000 in 2017. The Leisure & Hospitality sector also showed growth for the year by 4.0 percent, from
393,200 in 2016 to 409,100 in 2017. In addition, the Financial Activities sector showed an increase of 2.6 percent. Changes from
2016 to 2017 occurred in the Manufacturing sector by 1.9 percent.
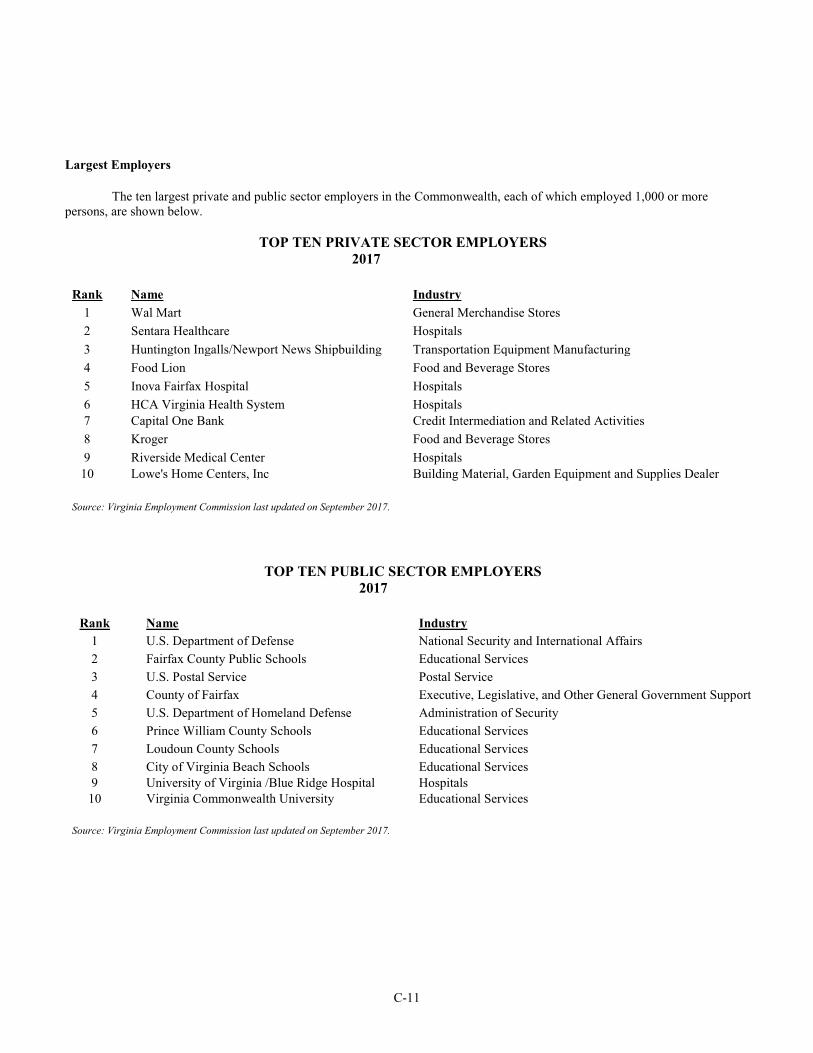
C-11
Largest Employers The ten largest private and public sector employers in the Commonwealth, each of which employed 1,000 or more persons, are shown below.
TOP TEN PRIVATE SECTOR EMPLOYERS 2017
Rank Name Industry 1 Wal Mart General Merchandise Stores
2 Sentara Healthcare Hospitals
3 Huntington Ingalls/Newport News Shipbuilding Transportation Equipment Manufacturing
4 Food Lion Food and Beverage Stores
5 Inova Fairfax Hospital Hospitals
6 HCA Virginia Health System Hospitals
7 Capital One Bank Credit Intermediation and Related Activities
8 Kroger Food and Beverage Stores
9 Riverside Medical Center Hospitals
10 Lowe's Home Centers, Inc Building Material, Garden Equipment and Supplies Dealer
Source: Virginia Employment Commission last updated on September 2017.
TOP TEN PUBLIC SECTOR EMPLOYERS 2017
Rank Name Industry 1 U.S. Department of Defense National Security and International Affairs
2 Fairfax County Public Schools Educational Services
3 U.S. Postal Service Postal Service
4 County of Fairfax Executive, Legislative, and Other General Government Support
5 U.S. Department of Homeland Defense Administration of Security
6 Prince William County Schools Educational Services
7 Loudoun County Schools Educational Services
8 City of Virginia Beach Schools Educational Services
9 University of Virginia /Blue Ridge Hospital Hospitals
10 Virginia Commonwealth University Educational Services
Source: Virginia Employment Commission last updated on September 2017.

C-12
Unemployment The Commonwealth is one of 26 states with a Right-to-Work Law and has a record of good labor-management relations.
The Commonwealth's favorable business climate is reflected in the relatively small number of strikes and other work stoppages it
experiences.
The Commonwealth is one of the least unionized of the more industrialized states. Three major reasons for this situation
are: the Right-to-Work Law; the importance of manufacturing industries such as textiles, apparel, electric and electronic equipment
and lumber which are not highly unionized in the Commonwealth; and the importance of federal civilian and military employment.
Typically, the percentage of nonagricultural employees belonging to unions in the Commonwealth has been approximately half
the U.S. average.
In the year 2017, Virginia had modest job growth in the seven metropolitan statistical areas (MSAs) reported on by the
Virginia Employment Commission. Those areas include Blacksburg-Christiansburg-Radford, Charlottesville, Harrisonburg,
Northern Virginia, Richmond, Virginia Beach-Norfolk-Newport News and Winchester. Northern Virginia, the state’s largest MSA
experienced the largest absolute job gain, with an increase of 12,800 jobs while Charlottesville experienced the largest percentage
increases of 2.4%.
The following table shows the size of the Commonwealth's total civilian labor force from 2007 through 2017, the
percentage unemployed during this period and the comparable national unemployment rate.
UNEMPLOYMENT TRENDS
Virginia's Civilian Unemployment Unemployment Year Labor Force in Virginia in United States 2007 4,048,996 3.00 4.60 2008 4,188,397 4.00 5.80 2009 4,179,810 6.80 9.30 2010 4,185,321 6.90 9.60 2011 4,347,644 6.10 8.50 2012 4,209,532 5.90 7.90 2013 4,240,111 5.50 7.40 2014 4,238,540 4.50 5.60 2015 4,222,819 4.20 5.00 2016 4,261,091 4.20 4.60
2017 (1) 4,340,369 3.70 4.20
(1)2017 Virginia's Civilian Labor Force as of October 2017, Virginia Labor Market Information. 2017 Unemployment in Virginia as of October 2017, United States Department of Labor Bureau of Labor Statistics and Virginia Labor Market Information. 2017 Unemployment in United States as of October 2017, Virginia Labor Market Information.

C-13
Other Economic Factors 1
Utilities: Over the last decade, Virginia opened the door to electric utility deregulation. However, the competition had not
materialized. Therefore, the Virginia General Assembly enacted "re-regulation legislation" which has re-established retail rate
regulation. The legislation permits choice for large commercial and industrial customers with demands exceeding 5 megawatts
(MW). The measure provides flexible and innovative forms of ratemaking that could provide incentives for utility operational
efficiencies and for generation plant construction. The legislation also creates incentives for the development of renewable energy
resources and for energy efficiency and conservation programs.
Virginia’s electric rates remain very competitive. In 2016, the average cost per unit of electricity for the industrial sector
is 6.65 cents in Virginia, compared to 7.22 cents for the nation. More than 4,300 megawatts of additional electric generating power
is planned or under construction statewide. All transmission-owning utilities in Virginia have taken the important step of joining
PJM, North America’s largest regional transmission manager, which oversees the grid across a vast area from Illinois to North
Carolina.
Adequate electric power is available throughout the Commonwealth through the investor-owned utilities of Dominion
Virginia Power (Dominion) and Appalachian Power (APCO), 13 electric cooperatives that distribute power in rural districts, and
16 municipalities that have their own distribution systems with power purchased primarily from the previously mentioned
companies. The electric utilities serving the Commonwealth are interconnected with neighboring utilities, both within and outside
of the Commonwealth, for reliability of service.
Dominion’s 1,329-megawatt Warren County Power Station, located just north of Front Royal, entered into commercial
operation December 2014. This natural gas-fires power station can produce enough electricity to power about 330,000 homes at peak demand. In April 2016, the 1,360-megawatt Brunswick Power Station in Brunswick County officially began generating electricity for Dominion customers.
Dominion’s $1.8 billion clean-coal power station in Wise County, Virginia became operational in July, 2012. The 668-
megawatt coal-fired power plant, also known as the Virginia City Hybrid Energy Center, uses advanced technology designed to
reduce emissions and protect the environment.
Virginia is served by eight regulated natural gas utility companies which provide an extensive network of underground
pipes and other gas facilities. In 2014, Virginia’s industrial sector accounted for nearly 20 percent of natural gas consumption in
the state. Virginia’s natural gas suppliers specialize in serving industrial customers and provide expert advice in engineering,
construction and inspection.
With few exceptions, municipalities and several highly urbanized counties own their own waterworks systems. In some
instances, the system of a municipality serves nearby communities and suburban areas. Most subdivision systems are privately
owned and operated. Some federal installations and many industrial plants have their own water supplies. Larger municipalities
usually depend on surface water or surface water supplemented by groundwater. There are approximately 2,700 public community
water supplies in Virginia, serving approximately 87 percent of the state's population. Virginia has more than 50,000 miles of
freshwater streams producing greater than 25 billion gallons per day of freshwater flow.
All cities, many towns, and some counties have their own sewage collection systems. Existing or planned facilities provide
wastewater treatment which meets or will meet established water quality standards. Transportation: The state’s central location on the East Coast is within a one day (10-hour) drive of 43% of the U.S.
population. As the nation’s third largest state-maintained transportation network, Virginia’s highway system includes more than
1 Information contained in this section was compiled from various Virginia state agencies and entities, including the Virginia Economic Development Partnership.

C-14
70,000 miles of primary and secondary roads and six major north-south and east-west interstate routes. The Commonwealth is
within easy reach of the nation’s leading industrial and distribution centers. For example, Richmond is only 338 miles from New
York City to the north, 623 miles from Detroit to the west, and 521 miles from Atlanta to the south. Two of the nation’s largest Class I railroads operate in Virginia. CSX Corporation Railroad has offices in Richmond, and Norfolk Southern Corporation is
headquartered in Norfolk. Both have extensive infrastructure throughout the Commonwealth. Eight shortline railroads also
provide freight rail service. Nearly 3,400 miles of railway (excluding trackage rights) traverse the state.
Norfolk Southern Corporation’s Heartland Corridor double-stack rail project is a $290 million public-private partnership
that offers efficient routing between the Port of Virginia and the Midwest markets. In a major engineering feat, clearances were
raised in 29 tunnels to make way for double stacked intermodal trains. Cargo can now be transported via double-stack rail with
next morning service to Columbus, Ohio and second-morning service to Chicago, Illinois while existing rail lines can handle
increasing container volumes.
Norfolk Southern's Crescent Corridor Project will improve the existing 2,500-mile rail network enabling it to handle more
freight traffic. The Crescent Corridor traverses 13 states from Louisiana to New Jersey and touches 26 percent of the nation's
population and 26 percent of the nation's manufacturing output. The estimated $3 billion project is expected to be fully operational
in 2020. To increase rail capacity on the Crescent's route through Virginia, Norfolk Southern is planning $47.1 million in track
and signal upgrades through 2016. With 30 new lanes now open connecting to the Crescent Corridor, Norfolk Southern’s high capacity intermodal routes are truck competitive, fuel efficient and dependable.
Virginia is served by 14 commercial airports (including those just across the state line at Bluefield, West Virginia;
Blountville, Tennessee; Greensboro and Raleigh-Durham, North Carolina; and Baltimore, Maryland). Scheduled commercial
airline service is provided to over 147 non-stop destinations around the world. Two of the nation’s largest airports, Dulles
International and Ronald Reagan Washington National Airports offer daily international non-stop flights to approximately 50
destinations. The commercial airports are supplemented by 57 general aviation airports licensed for public use throughout the
Commonwealth. Washington Dulles International has been one of the fastest growing airports in the country. Ronald Reagan
Washington National Airport located in Arlington, historically has been one of the world's busiest airports.
Virginia Commercial Space Flight Authority: The Commonwealth, through the Virginia Commercial Space Flight
Authority (VCSFA) and in partnership with NASA, has invested heavily in the development of the Mid Atlantic Regional
Spaceport (MARS) at Wallops Island, Virginia. The MARS facility is only one in four spaceports in the United States that is
currently licensed to launch to orbit, and is only one of two on the east coast. The Commonwealth has invested over $80 million
in state funds that were used for the construction of the new Pad OA to support Orbital Science Corporation's contract with NASA
for eight resupply missions to the International Space Station (ISS). With NASA turning to the commercial aerospace industry to
conduct many of its mission critical activities, the Commonwealth is well situated to serve a vital role in the future of our nation's
space program. MARS, with its strategic location, serves not only as a valuable asset to the U.S. space program, but also as crucial
link in Virginia's job creation and economic development efforts.
Port Facilities: The Port of Virginia is largely responsible for the Commonwealth's strong ties with international
commerce. As a 50 foot ice channel, the Port of Virginia offers the deepest shipping channels on the U.S. East Coast and is
serviced by more than 30 international steamship lines. Norfolk Southern and CSX offer on-dock, double stack intermodal service
to key inland markets in the Midwest, Ohio Valley and Southeast.
Norfolk International Terminals (NIT) located in Hampton Roads Harbor on 567 acres along the Elizabeth and Lafayette
Rivers, is the Port of Virginia's largest terminal and has fourteen of the biggest, most efficient cranes in the world. The General
Assembly in 2016 authorized the financing of a $350 million expansion of the cargo capacity at NIT. The money will be used to
reconfigure the South Berth, increasing the cargo capacity at NIT by 46% to approximately 2 million TEUs. With the purchase
of additional rail mounted gantry cranes, capacity and efficiency will increase. The main channel leading to the terminal is 50 feet
deep and the Virginia Port Authority (VPA) has the authorization to dredge to 55 feet when needed. Slightly down the river from
NIT is VPA’s second largest terminal, Portsmouth Marine Terminal (PMT). PMT has 3,540 feet of wharf, 3 berths, and 6 cranes,

C-15
and has direct access to both CSX and Norfolk Southern railways, and will soon connect to the Commonwealth Railway, a 19-
mile short line. Located in Newport News, Virginia, the Newport News Marine Terminal (NNMT) provides 42,720 feet of direct
cargo loading on and off ships to and from the CSX break-bulk rail service, and 3,480 feet of total pier space serviced by four
cranes, covered storage, container storage, and accessibility from 3 major Virginia roadways.
In 2010, the VPA executed a 20-year lease with Virginia International Gateway (VIG), formerly APM Terminals North
America. The lease allows VPA to assume operations at the VIG facility in Portsmouth, Virginia. The 576 acre terminal is
recognized as the most technologically advanced marine cargo facility in the Americas and provides on-site rail with links to
Norfolk Southern and CSX. VIG has a current capacity of over one million twenty-foot equivalent units (TEUs) annually, with
room for further expansion. In late 2016, the VPA amended its lease with VIG. As part of the amended lease agreement, which
would extended the lease term to 2065, the terminal will be expanded to include a 650-foot berth extension, 13 new customer yard
sticks with automatic stacking rail-mounted gantry cranes, an extended rail yard utilizing cantilevered rail-mounted gantry cranes,
and four new inbound gate lanes.
The Virginia Inland Port (VIP) in Front Royal is an intermodal container transfer facility that complements the Port of
Virginia’s marine terminal services. VIP occupies 161 acres of land and is approximately 60 miles west of Washington, D.C. The
terminal brings the Port of Virginia 220 miles closer to inland markets by providing rail service to the terminals in Hampton Roads.
It also consolidates and containerizes local cargo for export. VIP serves markets in northern Virginia, West Virginia, Maryland,
Pennsylvania and Eastern Ohio. The facility also contains 17,820 feet of on-site rail served by Norfolk Southern and is located
within 1 mile of I-66 and 5 miles of I-81. The Virginia Inland Port is a U.S. Customs-designated port of entry and provides the full
range of customs functions to customers.
In 2012, the Port of Virginia and the U.S. Army Corps of Engineers signed a partnership agreement for the Craney Island
Eastward Expansion project. This dual-purpose project will extend the life of Craney Island as a dredged material management
area and also provide land for the construction of a new marine terminal.
This multi-phase project will result in the newest, most modern marine terminal in the United States. The terminal will
be built in four phases with Phase One completion scheduled in 2040.
Ports of Entry: Five Port of Entry facilities and one Service Port facility also serve businesses: Front Royal, New River
Valley Airport in Dublin, Norfolk-Newport News (Service Port), Richmond-Petersburg, Tri-Cities near Bristol in Northeaster
Tennessee and Washington-Dulles in Northern Virginia.
Telecommunications: Virginia is one of the most connected states in the nation with access to a robust fiber network that
matches or exceeds virtually every domestic market and most major financial centers around the world. The Commonwealth hosts
prominent commercial internet exchange points, and 70 percent of the world’s internet traffic passes through the Metropolitan
Area Exchange East located in Ashburn, Virginia. The Richmond area has been connected to Ashburn with “dark fiber” opening opportunities along the I-95 corridor. In Southern and Southwest Virginia, the benefits of a 1,500+ mile advanced fiber-optic
broadband network connects more than 100 certified GigaParks.
Customers in the Commonwealth have access to a full range of high quality, technologically advanced communication
services. Virtually all major cities and towns are linked by fiber-optic lines crisscrossing the Commonwealth, which, in turn, are
tied into recently constructed national fiber optic networks. In the 2016 Digital States Survey, Virginia was one of only five states
to receive the top ranking of “A”.
Since 2006, the Mid-Atlantic Broadband Cooperative (MBC), nationally renowned as a model for rural economic development, has provided world-class fiber-optic backbone network infrastructure to Southern Virginia. This cable network provides opportunities for the region to connect directly with major Tier 1 peering and carrier collocation centers. MBC owns and operates more than 1,800 miles of advanced, open-access fiber network in 31 counties in Southern Virginia that reaches 100% of the business, industrial, and technology parks in the region. Backed by grants from the U.S. Department of Commerce and the Virginia Tobacco Commission, MBC continues to grow and expand.

C-16
Efforts are underway to further expand and enhance Southwest Virginia’s technological capabilities. Grants from the
Tobacco Commission and the Virginia Coalfield Economic Development Authority will enable electronic upgrades as well as last
mile connections.
The Bristol Virginia Utilities (BVU) Authority is a public utility company in Southwest Virginia that expanded its
broadband infrastructure 900 miles into eight neighboring counties. That network – called OptiNet and CPC OptiNet in four of the
counties – now provides fiber-optic speeds of up to 1 Gbps (gigabit per second) to customers in the city of Bristol and the counties
of Bland, Buchanan, Dickenson, Russell, Smyth, Tazewell, Washington and Wythe, positioning Southwest Virginia for
unprecedented economic growth. Monetary grant awards of nearly $40 million from the Virginia Tobacco Commission since 2003
have helped to fund the existing 900-mile OptiNet infrastructure. As recently as July 2010, the Virginia Tobacco Commission
continued its support of OptiNet by providing another $5 million, facilitating acquisition of a Recovery Act grant of $22 million
from the National Telecommunications and Information Administration. The monies go toward construction of 388 miles of
middle-mile fiber into seven of OptiNet’s rural counties. This project paves the way for eventual fiber-to-the-home connectivity
across Southwest Virginia. BVU Authority is considering the sale of all of its OptiNet and CPC OptiNet assets to Sunset Digital
Communications.
Citizens is a regional full service communications provider offering land-line telephone, VoIP, IPTV Video, web and e-
mail hosting, DSL, and FTTP (Fiber to the Premises: Business Ethernet and FTTH, Fiber to the Home), serving 7 counties in
Southwest Virginia. In addition, Citizens operates a 248 mile regional open access fiber network in 6 Virginia counties including
8 industrial parks. Citizen provides wholesale transport and internet bandwidth to a variety of service providers and partners with
other open access networks, like MBC and BVU, to provide high-capacity optical transport services that are necessary to assist in
the economic revitalization efforts of Southwest and Southside Virginia.
Research and Development: The Commonwealth is home to many internationally recognized research and development
(R&D) facilities. Federally funded R&D facilities, coupled with the research from Virginia universities, provide Virginia
businesses access to leading researchers and technologies. Virginia is home to hundreds of private sector R&D operations, 11
federally funded R&D Centers, and 23 Federal Laboratory Consortium Laboratories such as the Homeland Security Institute,
NASA Langley Research Center, and the Thomas Jefferson National Accelerator Facility. Unique university research parks across
the state offer private companies’ opportunities for co-location and cooperative relationships with Virginia universities, federal
labs and other research consortia.
The Virginia BioTechnology Park in downtown Richmond is home to over 60 life science companies, research institutes
and state/federal labs, employing over 2,400 scientists, engineers and researchers. The Park features nine buildings on a 34-acre
campus. Members include early and mid-stage companies; multinational pharmaceutical, environmental and consumer product
companies; national healthcare organizations managing the nation’s solid organ transplant program and a number of international
companies.
The National Institute of Aerospace (NIA) is a non-profit research and graduate education institute headquartered in
Hampton, Virginia, near NASA’s Langley Research Center. NIA’s mission is to conduct leading-edge aerospace and atmospheric
research, develop new technologies for the nation and help inspire the next generation of scientists and engineers. NIA was formed
in 2002 by a consortium of research universities to ensure a national capability to support NASA’s mission by expanding collaboration with academia and leveraging expertise inside and outside NASA. NIA performs research in a broad range of
disciplines including space exploration, systems engineering, nanoscale materials science, flight systems, aerodynamics, air traffic
management, aviation safety, planetary and space science, and global climate change.
SRI Shenandoah Valley in Harrisonburg, Virginia focuses on health and biomedical research and drug discovery and
development with the ultimate goal of bringing new therapies and diagnostics to market. As part of SRI Biosciences, the research
complements capabilities at other SRI locations, including SRI's Menlo Park, California headquarters. SRI’s state-of-the-art
40,000-square-foot research facility is located on a 25-acre campus in the Innovation Village at Rockingham. The facility provides

C-17
a convenient base for collaboration with academia, entrepreneurs, government, industry, and investors in Virginia and the greater
Washington, D.C. area. SRI moved into its Shenandoah Valley laboratory facility in 2009 and further expanded in 2011 and 2013
to accommodate growth in its R&D programs. Scientific research at SRI Shenandoah Valley focuses on prevention, detection and
treatment of diseases. Activities span basic research in emerging infectious disease, metabolic disease and proteomics; applied
research in therapeutics including drugs, biologics, and vaccines; and personalized medicine through the development of
companion diagnostics and biomarkers.
The Commonwealth Center for Advanced Manufacturing (CCAM) located in a state-of-the-art research facility in Prince
George County, Virginia, is an applied research center that bridges the gap between fundamental research typically performed at
universities and product development routinely performed by companies. CCAM provides production-ready advanced
manufacturing solutions to member companies across the globe. Members guide the research, leveraging talent and resources
within CCAM and at Virginia’s top universities, through a collaborative model that enables them to pool R&D efforts to increase
efficiencies. Results can then be applied directly to the factory floor, turning ideas into profit faster and more affordable than ever
before.
Following the successful model of the Commonwealth Center for Advanced Manufacturing, the Commonwealth Center
for Advanced Logistics Systems (CCALS) was established in 2013 in Prince George County, Virginia. This public-private alliance
focuses on solving logistics challenges and bringing solutions to market more quickly by partnering Virginia’s leading universities
and logistics companies. Founding members include Longwood University, University of Virginia, Virginia Commonwealth
University, Virginia State University, Logistics Management Resources, and LMI.
New and Expanding Companies: Over the last three and a half years Virginia has announced 1,026 new or expansion
projects with a capital investment of $16.5 billion and creating over 215,000 new jobs. Facebook is investing $750 million to establish a 970,000 square foot data center in Henrico County, Virginia creating
thousands of construction jobs and more than 100 full-time operational jobs. This will bring more than $1 billion of new investment to the Commonwealth.
Ferguson, the largest plumbing wholesaler in the U.S. announced in June 2017, it will invest $82.8 million to expand its
headquarters operation in the City of Newport News, retaining more than 1,000 jobs and creating 434 new jobs. Also in June 2017, Virginia has become the home to 206 licensed breweries, a 468% growth since 2012 and contributes
more than $9.34 billion annually to Virginia’s economy. Richmond-based Hardywood Craft Brewery announced in 2015 and will enter the world’s second largest export market for U.S. craft beer. Hardywood has invested over $28 million to construct a 60,000-square-foot brewery in Goochland County. This is yet another example of the Commonwealth’s growing craft brewing industry.
The Kentuck Solar project announced in May 2017, Virginia’s largest municipal utility solar farm, will begin construction
this August 2017. The Kentuck project is a 6 megawatt solar array that will be part of the generation mix for Danville Municipal Utility. The project is estimated to be a more than $10 million investment and slated to be completed by the end of 2017.
Nestlé USA, a leading global nutrition, health and wellness company announced in February 2017, it will be investing
almost $40 million in Virginia by relocating its U.S. corporate headquarters operation to Arlington County and create 748 new jobs.
In January 2017, Navy Federal Credit Union announced that it will invest $100 million to expand its Winchester operations center in Frederick County. The project will nearly double the Navy Federal’s workforce employee-count creating 1,400 new jobs.
In December 2016, Peet’s coffee announced that it will invest $58 million to establish an East Coast manufacturing
operation in the City of Suffolk, creating 175 new jobs. Also in December 2016, American Woodmark Corporation announced it will invest $30 million to consolidate
headquarters in Frederick County, thereby retaining 37 jobs in addition to creating 55 new jobs.

C-18
In November 2016, Microsoft Corporation announced that it will invest $251.6 million to expand its data center site in Mecklenburg County and increase capacity to serve its growing customer base. Microsoft has now invested nearly $2 billion in its Mecklenburg facility and created over 250 jobs since 2010.
In October 2016, CoStar Group announced that it would invest $8.17 million in a new research and software
development center in Richmond. This project is expected to create 732 new jobs and have a total economic impact of $250 million.
In August 2016, Fortune 200 retailer Dollar Tree announced that it will invest $110 million to expand its headquarters in the City of Chesapeake. This expansion is expected to create 600 new jobs with an additional 825 jobs retained.
German grocer Aldi chose Dinwiddie County as the location for a new division headquarters and 500,000 square-foot
distribution facility. This new facility was announced in August 2016, and it is expected to create 145 new jobs and involve $57 million in investment
Grant Thornton, a subsidiary of British firm Grant Thornton International, announced in June 2016 that it would be
consolidating its D.C. and Virginia locations in Arlington County. Grant Thornton will invest $15.75 million as part of this consolidation and create 348 new jobs. An additional 994 jobs will be retained in Virginia.
In March 2016, Deschutes Brewery announced that the City of Roanoke would be the location of the Oregon company’s
first Eastern U.S. location. The company is expected to invest $85 million and create 108 new jobs. During that same month, Italian auto-parts manufacturer Eldor Corporation announced that it would be building its first
U.S. factory in neighboring Botetourt County. Eldor will invest more than $75 million and create 350 new jobs with this new project.
In March 2016, pharmaceutical company Merck announced that it will invest $168 million to upgrade its manufacturing
facility in Rockingham County. Merck has been a valued employer in this community since 1941. Polykon Manufacturing LLC, a joint venture between German Seppic Inc. and French Shulke Inc., announced in February
2016 that it would be locating its first North American manufacturing facility in Henrico County. This facility will manufacture ingredients for the cosmetic and pharmaceutical industries, create more than 50 new jobs, and bring in over $56 million in investment.
In November 2015, Microsoft announced the fourth expansion of its data center in Mecklenburg County. This expansion
will create 42 new jobs, and involve over $402 million in investment by the company. With this expansion, Microsoft will have invested $1.74 billion in Mecklenburg County since 2010.
Navy Federal Credit Union announced in March 2015 that it will invest $114.6 million to expand its headquarters in
Fairfax County. This expansion is expected to create 600 new jobs. Navy Federal Credit Union is a valued employer that supports over 5,000 jobs in the Commonwealth.
German grocer Lidl announced in June 2015 that it had chosen Arlington County as the site of its U.S. headquarters. The
company will invest over $77 million and create over 500 new jobs. The company also announced $125 million in investment to construct a distribution center in Spotsylvania County and create 200 new jobs.
Business Climate: Virginia is headquarters to 37 Fortune 1000 companies and is ranked highly in three of the most
comprehensive and impartial independent studies evaluating America's top states for business: Forbes.com, Pollina Corporate
Real Estate and CNBC.
Virginia ranked eleventh out of twenty states in 2017 as one of the “Top States for Doing Business” in the Area
Development magazine. This is the first time since 2010 by the prestigious annual site consultants’ survey. Virginia was ranked seventh in CNBC’s “America’s Top States for Business 2017”. All 50 states are ranked on 60
measures of competitiveness, using input from business groups, economic development experts, companies, and the states themselves. The network separates those measures into 10 broad categories: cost of doing business, workforce, quality of life, economy, infrastructure, technology and innovation, education, business friendliness, access to capital, and cost of living. Since
C-19
the rankings began, Virginia has claimed the number one spot in 2007, 2009, and 2011 while receiving second in 2008 and 2010. In the 2017 study, the Commonwealth was also ranked second in the workforce development, seventh in business friendly, and thirteenth in education.
In 2016, 300 Virginia companies appeared on the Inc. 5000 list of the fastest growing private companies in the country.
Virginia ranked seventh in the country in Forbes.com’s “2016 Best States for Business” study. Virginia took the top spot
in 2006, 2007, 2008, 2009, and 2013 and ranked second overall in 2010, 2011, and 2012. The review examines multiple objective
measurements, including business cost, regulatory climate, quality of the workforce, and economic growth. Forbes.com is the
official Internet site of the Forbes family of business publications. According to Forbes.com 2016 study, the Commonwealth ranked
No. 2 for labor supply, No. 3 in the Regulatory Environment category because of its strong incentive offerings and business-
friendly government policies,, and received a No. 8 ranking for quality of life.
In 2015, Pollina Corporate Real Estate, a full-service brokerage and consulting firm representing corporations in real
estate matters on a national and international basis, ranked Virginia as America’s fourth most business-friendly state in their annual
independent study titled, “Pollina Corporate Top 10 Pro-Business States 2015”. The study evaluates and ranks states based on 32
factors including taxes, human resources, right-to-work legislation, energy costs, infrastructure spending, worker compensation
legislation, jobs lost or gained, economic incentive programs and state economic development efforts. According to the most recent
study, Virginia excels in offering low operating costs, a pro-business environment, access to global markets, and a skilled educated
workforce to businesses. The Commonwealth ranked first in the Pollina study in 2007, 2009, 2010, and 2011 while ranking second
in 2006 and 2012, third in 2008, and fourth in 2013, 2014 and 2015. In the 2015 CNBC study, the Commonwealth was also ranked
third in business friendliness, fifth in education, and third in workforce.
Education: The Constitution of Virginia vests the supervision of public elementary and secondary schools in local school
boards. The State Board of Education is, however, required to prescribe standards of quality and has prescribed minimum
competency tests for high school graduation.
Virginia's public schools are financed through a combination of state, local and federal funds. The private sector also
contributes through partnerships with schools and school divisions. The apportionment of the state funds for public education is
the responsibility of the General Assembly, through the Appropriations Act. General fund appropriations serve as the mainstay of
state support for the commonwealth's public schools, augmented by retail sales and use tax revenues, state lottery proceeds, and
other sources. Historically, state funding for public education represents about one-third of the state general fund budget.
Counties, cities and towns comprising school divisions also support public education by providing the locality's share to
maintain an educational program meeting the commonwealth's Standards of Quality.
While public education is primarily a state and local responsibility, the federal government provides assistance to state
and local education agencies in support of specific federal initiatives and mandates.
In the 2016-17 academic year, an estimated 388,749 students were enrolled in the Commonwealth's 39 public colleges,
community colleges and universities. Of these students, an estimated 173,072 attended 23 community colleges on 40 campuses
within the Virginia Community College System. A total of 1,288,481 students attended public elementary and secondary schools.
The following table illustrates enrollment levels for all educational levels for the last 10 academic years.

C-20
ENROLLMENT FOR PUBLIC AND PRIVATE INSTITUTIONS OF HIGHER EDUCATIONAND PUBLIC PRIMARY AND SECONDARY SCHOOLS
Public (2) Academic Higher Education (1) Primary and Year Public Private Total Secondary 2007-08 370,598 79,073 449,671 1,230,857
2008-09 383,459 86,959 470,418 1,235,064
2009-10 401,352 100,514 501,866 1,244,873
2010-11 409,277 110,495 519,772 1,251,949
2011-12 413,019 122,275 535,294 1,258,520
2012-13 409,069 123,144 532,213 1,264,880
2013-14 403,975 125,343 529,318 1,273,211
2014-15 398,689 135,591 534,280 1,279,773
2015-16 393,545 135,121 528,666 1,284,680
2016-17 388,749 132,144 520,893 1,288,481
Source: (1) State Council for Higher Education in Virginia; (2 )Department of Education
In 2017 Smart Asset ranked Virginia No.1 as best state for Higher Education. The study compares four-year public
colleges and universities in each state using multiple metrics, including the undergraduate graduation rate, the average
net price, the 20-year return on investment and the student-faculty ratio. The study also calculated the in-state
attendance rate to assess whether states can effectively educate their own residents.
Natural Resources: Virginia’s five physiographic provinces are characterized by rocks, minerals and energy resources that provide a wealth of economic opportunities. The total estimated value of energy and mineral resources produced in Virginia
in 2015 is $2.6 billion. The value of construction aggregate, estimated to be $870 million, overtook that of coal as the leading
value commodity in Virginia. Located in all of the physiographic provinces, aggregate mining operations serve mostly local
markets and provide thousands of mining and construction-related jobs. Although energy markets continue to evolve with greater
utilization of renewable energy sources, natural gas and coal will remain important fuels for electricity generation in the near
future.
Virginia’s forests provide more than $21 billion in annual economic benefits to the Commonwealth, and the forest industry
provides employment for more than 107,900 Virginians. In addition, the nearly 16 million acres of forestland provide citizens
environmental benefits, such as water quality and air quality, habitat for wildlife and plants, recreational opportunities and aesthetic
beauty.
Virginia’s geographic location contributes to the success of its seafood industry. The Virginia seafood industry is one of
the oldest industries in the United States and largest seafood production states on the East Coast. In addition, Virginia is the
nation’s third largest producer of marine products with total landings of over 417 million pounds in 2015. Its ports are rarely, if
ever, closed in the winter. Its catch is widely diversified, preventing dependence on any one species. Among the 50 commercially
valuable seafood species harvested from some 620,000 acres of water are sea scallops, eastern oysters, blue crabs, menhaden,
northern quahog clam, summer flounder, striped bass and Atlantic croaker. The Virginia Institute of Marine Science has reported
the annual economic impact of Virginia’s seafood industry to be over $500 million.
Agriculture: The agricultural industry has an economic impact of $70 billion annually and provides nearly 334,000 jobs
in the Commonwealth. The industries of agriculture and forestry together have a total economic impact of almost $91 billion.
Every job in agriculture and forestry supports 1.7 jobs elsewhere in the Virginia economy.

C-21
Production agriculture employs nearly 55,000 farmers and workers in Virginia and generates approximately $3.8 billion
in total output. Value-added industries, those that depend on farm commodities, employ an additional 69,000 workers. When the
employment and value-added impact of agriculture and forestry are considered together, they make up 9.5 percent of the state’s local gross domestic product.
A burgeoning wine industry is proving to be increasingly important to Virginia’s economy. Released in early 2017, an economic impact study shows that Virginia’s wine industry contributes more than $1.37 billion annually to Virginia’s economy. The report showed that the Virginia Wine industry employs over 8,218 in 261 wineries.
Tourism: Another of Virginia’s most important economic assets is the travel and tourism industry. Tourism’s economic contribution to Virginia in 2016 increased to $23.7 billion, a 3.3 percent increase over 2015. Approximately 229,300 Virginia jobs
were directly supported by travel spending in 2016, including employment in such travel-related businesses as lodging
establishments, restaurants, museums, amusement parks, retail stores and gasoline service stations. Tourism is also a significant
source of government revenues and was responsible for $3.3 billion in combined state and local tax revenues in 2016, up 4.8
percent from 2015.

[THIS PAGE INTENTIONALLY LEFT BLANK]

APPENDIX D COMMONWEALTH OF VIRGINIA AUDITED FINANCIAL STATEMENTS FOR THE YEAR
ENDED JUNE 30, 2016

[THIS PAGE INTENTIONALLY LEFT BLANK]

Report of the Comptroller to the Governor of Virginia
A Comprehensive Annual Financial Report
For the Fiscal Year Ended June 30, 2016
Terence R. McAuliffeGovernor
Richard D. BrownSecretary of Finance
David A. Von MollComptroller

2 Commonwealth of Virginia
Table of Contents
Introductory SectionComptroller’s Letter of Transmittal to the Governor ................................................................................................................... 6 Certificate of Achievement for Excellence in Financial Reporting ............................................................................................ 17Organization of Executive Branch of Government ................................................................................................................... 20Organization of Government – Selected Government Officials – Executive Branch ................................................................ 21Organization of the Department of Accounts............................................................................................................................ 22
Financial SectionIndependent Auditor's Report................................................................................................................................................... 24Management's Discussion and Analysis .................................................................................................................................. 27Basic Financial Statements
Government-wide Financial StatementsStatement of Net Position .......................................................................................................................................... 40Statement of Activities ............................................................................................................................................... 42
Fund Financial StatementsBalance Sheet – Governmental Funds ...................................................................................................................... 46Reconciliation of the Balance Sheet – Governmental Funds to the Government-wide
Statement of Net Position ................................................................................................................................... 48Statement of Revenues, Expenditures, and Changes in Fund Balances –
Governmental Funds .......................................................................................................................................... 50Reconciliation of the Statement of Revenues, Expenditures, and Changes in Fund
Balances – Governmental Funds to the Government-wide Statement of Activities ............................................ 52Statement of Fund Net Position – Proprietary Funds................................................................................................. 54Statement of Revenues, Expenses, and Changes in Fund Net Position – Proprietary Funds ................................... 56Statement of Cash Flows – Proprietary Funds........................................................................................................... 58Statement of Fiduciary Net Position – Fiduciary Funds ............................................................................................. 64Statement of Changes in Fiduciary Net Position – Fiduciary Funds .......................................................................... 65Statement of Net Position – Component Units........................................................................................................... 68Statement of Activities – Component Units................................................................................................................ 70
Index to the Notes to the Financial Statements................................................................................................................. 73Notes to the Financial Statements ............................................................................................................................. 74
Required Supplementary InformationSchedule of Revenues, Expenditures, and Changes in Fund Balances – Budget and Actual –
General and Major Special Revenue Funds ............................................................................................................ 180Schedule of Changes in Employers’ Net Pension Liability .............................................................................................. 184Schedule of Employer Contributions – Pension Plans .................................................................................................... 188Schedule of Funding Progress for Other Postemployment Benefit Plans ....................................................................... 192Schedule of Employer Contributions – Other Postemployment Benefit Plans ................................................................ 195Claims Development Information .................................................................................................................................... 196
Combining and Individual Fund Statements and SchedulesNonmajor Governmental Funds
Combining Balance Sheet – Nonmajor Governmental Funds.................................................................................. 204Combining Statement of Revenues, Expenditures, and Changes in Fund Balance –
Nonmajor Governmental Funds........................................................................................................................ 208Schedule of Revenues, Expenditures, and Changes in Fund Balance –
Budget and Actual – Nonmajor Special Revenue Funds .................................................................................. 212Nonmajor Enterprise Funds
Combining Statement of Fund Net Position – Nonmajor Enterprise Funds ............................................................. 216Combining Statement of Revenues, Expenses, and Changes in Fund Net Position –
Nonmajor Enterprise Funds .............................................................................................................................. 220Combining Statement of Cash Flows – Nonmajor Enterprise Funds ....................................................................... 224
Internal Service FundsCombining Statement of Fund Net Position – Internal Service Funds ..................................................................... 232Combining Statement of Revenues, Expenses, and Changes in Fund Net Position –
Internal Service Funds...................................................................................................................................... 234Combining Statement of Cash Flows – Internal Service Funds ............................................................................... 236

Commonwealth of Virginia 3
Fiduciary FundsCombining Statement of Fiduciary Net Position – Private Purpose Trust Funds ..................................................... 242Combining Statement of Changes in Fiduciary Net Position – Private Purpose Trust Funds .................................. 244Combining Statement of Fiduciary Net Position – Pension and Other Employee Benefit
Trust Funds ...................................................................................................................................................... 246Combining Statement of Changes in Fiduciary Net Position – Pension and Other
Employee Benefit Trust Funds ......................................................................................................................... 250Combining Statement of Fiduciary Net Position – Investment Trust Fund............................................................... 254Combining Statement of Changes in Fiduciary Net Position – Investment Trust Fund............................................ 255Combining Statement of Fiduciary Net Position – Agency Funds............................................................................ 256Combining Statement of Changes in Assets and Liabilities – Agency Funds .......................................................... 260
Nonmajor Component UnitsCombining Statement of Net Position – Nonmajor Component Units ...................................................................... 266Combining Statement of Activities – Nonmajor Component Units ........................................................................... 274
Debt SchedulesSummary Schedule – Total Debt and Other Long-term Obligations of the Commonwealth .................................... 278Tax-Supported Debt and Other Long-term Obligations ........................................................................................... 279Debt and Other Long-term Obligations Not Supported by Taxes............................................................................. 280Authorized and Unissued Tax-Supported Debt........................................................................................................ 281Tax-Supported Debt – Annual Debt Service Requirements..................................................................................... 282Tax-Supported Debt – Detail of Long-term Indebtedness........................................................................................ 284
Statistical SectionTen-Year Schedule of Revenues and Expenditures – Modified Accrual Basis –
General Governmental Revenues by Source and Expenditures by Function ................................................................. 296Net Position by Component – Accrual Basis of Accounting ................................................................................................... 298Changes in Net Position – Accrual Basis of Accounting ........................................................................................................ 300Changes in Fund Balance, Governmental Funds – Modified Accrual Basis of Accounting.................................................... 304Fund Balance, Governmental Funds – Modified Accrual Basis of Accounting....................................................................... 306Comparison of General Fund Balance ................................................................................................................................... 308Personal Income Tax Rates................................................................................................................................................... 310Effective Tax Rates ................................................................................................................................................................ 310Personal Income Tax Filers and Liability by Income Level..................................................................................................... 311Personal Income by Industry.................................................................................................................................................. 312Taxable Sales by Business Class .......................................................................................................................................... 314Sales Tax Revenue by Business Class.................................................................................................................................. 316Ratios of Outstanding Debt by Type ...................................................................................................................................... 318Ratios of General Obligation Bonded Debt Outstanding ........................................................................................................ 319Computation of Legal Debt Limit and Margin ......................................................................................................................... 320Schedule of Pledged Revenue Bond Coverage – Primary Government 9(d) General Long-term Debt ................................. 322Schedule of Demographic and Economic Statistics ............................................................................................................... 324Principal Employers ............................................................................................................................................................... 324State Employees by Function ................................................................................................................................................ 326Operating Indicators by Function ........................................................................................................................................... 328Capital Asset Statistics by Function ....................................................................................................................................... 332Employees of the Department of Accounts ............................................................................................................................ 334

4 Commonwealth of Virginia
Illustrations
Figure 1 Annual Percentage Change in Nonfarm Payroll Employment, Fiscal Years 2011 – 2016 .................................... 8Figure 2 Nonfarm Payroll Employment, Fiscal Years 2011 – 2016..................................................................................... 9Figure 3 Annual Percent Change in Nonfarm Payroll Employment in Virginia’s MSAs, Fiscal Years 2011 – 2016 .......... 10Figure 4 Percentage Change in Personal Income, Fiscal Years 2011 – 2016.................................................................. 10Figure 5 Civilian Unemployment Rate, Fiscal Years 2011 – 2016 .................................................................................... 11Figure 6 Civilian Unemployment Rate for Virginia’s MSAs, Fiscal Years 2011 – 2016..................................................... 12Figure 7a Unemployment Rate by Locality, Fiscal Year 2016 ............................................................................................ 12Figure 7b Unemployment Rate by Locality, Fiscal Year 2015 ............................................................................................ 13Figure 8 Annual Percentage Change in Taxable Sales in Virginia, Fiscal Years 2011 – 2016 ......................................... 13Figure 9 Percentage Change in Housing Prices, Fiscal Years 2011 – 2016..................................................................... 14Figure 10 New Privately Owned Housing Units Authorized, Annual Percentage Change,
Fiscal Years 2011 – 2016............................................................................................................................ 15Figure 11 Net Position as of June 30, 2016 and 2015 ........................................................................................................ 30Figure 12 Changes in Net Position for the Fiscal Years Ended June 30, 2016 and 2015................................................... 31Figure 13 Revenues by Source – Governmental Activities, Fiscal Year 2016 .................................................................... 32Figure 14 Expenses by Type – Governmental Activities, Fiscal Year 2016 ........................................................................ 32Figure 15 Business-type Activities – Program Revenues and Expenses, Fiscal Year 2016 ............................................... 33Figure 16 Capital Assets as of June 30, 2016 (Net of Depreciation)................................................................................... 35Figure 17 Outstanding Debt as of June 30, 2016 – General Obligation Bonds................................................................... 36

Commonwealth of Virginia 5
INTRODUCTORY SECTION
Comptroller’s Letter of Transmittal to the GovernorCertificate of Achievement for Excellence in Financial Reporting
Organization of Executive Branch of GovernmentOrganization of Government – Selected Government Officials – Executive Branch
Organization of the Department of Accounts
6 Commonwealth of Virginia
COMMONWEALTH of VIRGINIA
DAVID A. VON MOLL, CPA Office of the Comptroller P. O. BOX 1971COMPTROLLER RICHMOND, VIRGINIA 23218-1971
December 15, 2016
The Honorable Terence R. McAuliffeGovernor of the Commonwealth of VirginiaState CapitolRichmond, Virginia 23219
Dear Governor McAuliffe:
It is my pleasure to present the Comprehensive Annual Financial Report (CAFR) for the fiscal year ended June 30, 2016, in accordance with Section 2.2-813 of the Code of Virginia. This report consists of management’s representations concerning the Commonwealth of Virginia’s finances. Management assumes full responsibility for the completeness and reliability of all information presented. This report reflects my commitment to you, to the citizens of the Commonwealth, and to the financial community tomaintain our financial statements in conformance with accounting principles generally accepted in the United States of America (GAAP) as established by the Governmental Accounting Standards Board (GASB). Data presented in this report is believed to beaccurate in all material respects, and all disclosures that are necessary to enable the reader to obtain a thorough understanding of the Commonwealth’s financial activities have been included.
The 2016 CAFR is presented in three sections. The Introductory Section includes this transmittal letter and organization charts for state government. The Financial Section includes the State Auditor’s Report, management’s discussion and analysis (MD&A),audited government-wide and fund financial statements and notes thereto, required supplementary information other than MD&A, and the underlying combining and individual fund financial statements and supporting schedules. The Statistical Section sets forth selected unaudited economic, financial trend, and demographic information for the Commonwealth on a multi-year basis.
The Commonwealth’s management is responsible for the establishment and maintenance of internal accounting controls that ensure assets are safeguarded and financial transactions are properly recorded and adequately documented. To ensure that the costs of controls do not exceed the benefits obtained, management is required to use cost estimates and judgments to attain reasonable assurance as to the adequacy of such controls. The Commonwealth’s established internal controls fulfill these requirements and provide reasonable, but not absolute assurance, that the accompanying financial statements are free of material misstatement.
In accordance with Section 30-133 of the Code of Virginia, the Auditor of Public Accounts has audited the Commonwealth’s financial statements for the year ended June 30, 2016. The audit was conducted in accordance with auditing standards generally accepted in the United States of America and Government Auditing Standards issued by the Comptroller General of the United States. The auditor’s opinion is included in the Financial Section of this report. Audit testing for compliance with the U. S. Office of Management and Budget Compliance Supplement and the related Uniform Administrative Requirements, Cost Principles and Audit Requirements for Federal Awards, is performed at the statewide level. The Commonwealth’s Single Audit Report will be issued at a later date. I would like to acknowledge the Auditor of Public Accounts’ staff for their many contributions to the preparation of this report.
GASB Statement No. 34, Basic Financial Statements – and Management’s Discussion and Analysis – for State and Local Governments, requires that management provide a narrative introduction, overview and analysis to accompany the basic financial statements in the form of MD&A. This letter of transmittal is designed to complement the MD&A and should be read in conjunction with it. In addition to the financial analysis addressing the Commonwealth’s governmental and business-type activities, the MD&A focuses on the Commonwealth’s major funds: General, Commonwealth Transportation Special Revenue, Federal Trust Special Revenue, Literary Special Revenue, Virginia Lottery, Virginia College Savings Plan, and Unemployment Compensation. The Commonwealth’s MD&A can be found on page 27 immediately following the independent auditor’s report.

Commonwealth of Virginia 7
PROFILE OF THE GOVERNMENT
Reporting Entity
For financial reporting purposes, the Commonwealth’s reporting entity consists of (1) the primary government, (2) component unit organizations for which the primary government is financially accountable (blended component units), and (3) other component unit organizations for which the nature and significance of their relationship with the primary government is such that exclusion would cause the reporting entity’s financial statements to be misleading or incomplete (discrete component units). The funds and accounts of all agencies, boards, commissions, foundations, and authorities that have been identified as part of the primary government or a component unit have been included. Further information can be found in Note 1.B. to the Financial Statements.
Section 2100 of the GASB Codification of Governmental Accounting and Financial Reporting Standards describes the criteria for determining which organizations, functions, and activities should be considered part of the Commonwealth for financial reporting purposes. The basic criteria include appointing a voting majority of an organization’s governing body, as well as the Commonwealth’s ability to impose its will on that organization, or the potential for the organization to provide specific financial benefits to, or impose specific financial burdens on, the Commonwealth. The Commonwealth’s discretely presented major component units are the Virginia Housing Development Authority, Virginia Public School Authority, Virginia Resources Authority, and Virginia College Building Authority.
The Commonwealth and its component units provide a wide range of services and funding to its citizens, including elementary, secondary and higher education; health and human services; economic development; environment and natural resources; public safety, corrections, and regulation; transportation; agriculture; and general government services. The financial activities associated with these services are reflected in both summary and detail throughout the CAFR.
Budgetary Control
In addition to the internal controls previously discussed, the Commonwealth maintains budgetary controls to ensure compliance with the legal provisions of the Commonwealth’s Appropriation Act, which reflects the General Assembly’s approval of a biennialbudget. The financial transaction process begins with development and approval of the budget, after which budgetary control is maintained through a formal appropriation and allotment system. The budgeted amounts reflected in the accompanying financial statements represent summaries of agency budgets.
The Commonwealth’s budget is prepared principally on a cash basis and represents appropriations as authorized by the General Assembly on a biennial basis at the program level. The Commonwealth monitors spending activity to ensure the expenditures do not exceed the appropriated amounts at the agency level. The State Comptroller maintains a central general ledger that records total appropriations and related expenditures for all agencies and institutions included in the approved budget. Systemic controls are in place to prevent disbursements that exceed authorized appropriations. Additional information regarding the Commonwealth’s budgetary process can be found in Note 1.E. to the Financial Statements.

8 Commonwealth of Virginia
ECONOMIC REVIEW
Local Economy
Introduction
This overview of the economy of the Commonwealth of Virginia was prepared by the Weldon Cooper Center for Public Service at the University of Virginia. In fiscal year 2016, Virginia’s economy continued to rebound from earlier lackluster growth and outpaced the nation. Employment expanded at the fastest rate in over 10 years, and the jobless rate reached levels last seen before therecession. Personal income and taxable sales exhibited a healthy pace of growth, while housing market indicators such as home sales, housing prices, and building permits issued improved across the board. As the nation enters the eighth year of economic expansion and labor markets continue to tighten, job growth is expected to gradually slow. Robust consumer spending, a gradually improving housing market, and higher federal government outlays are expected to support moderate national and state economic growth into the coming fiscal year.
Employment
Virginia experienced its sixth consecutive year of employment growth in fiscal year 2016 (Figure 1). The fiscal year 2016 growth rate of 2.3 percent was a significant improvement over 1.1 percent the fiscal year before and outpaced the national growth rate of 1.9 percent. The easing of federal spending restrictions as the result of the Bipartisan Budget Act of 2013 and other more recent federal spending legislation helped propel the Virginia economy forward despite a slight slowing in the national economy.
Figure 1Annual Percentage Change in Nonfarm Payroll Employment
Fiscal Years 2011 – 2016
0.0%
0.5%
1.0%
1.5%
2.0%
2.5%
2011 2012 2013 2014 2015 2016
Virginia United States
Source: U. S. Bureau of Labor Statistics
Virginia attained a new jobs milestone in fiscal year 2016 with nonfarm payroll employment reaching 3,895,900. The state realized 87,600 more jobs during the fiscal year, a number that compares quite favorably with the net 93,700 jobs created over the entire fiscal year 2012-2015 period. Figure 2 shows changes in Virginia’s nonfarm employment by industry for fiscal years 2011 through 2016 along with the employment change between fiscal years 2015 and 2016 for Virginia and the U.S. Federal Government employment grew by 2,500 jobs in fiscal year 2016, the largest increment in the last five years. Professional and Business Services, another sector sensitive to federal government spending, expanded by 24,200 jobs in fiscal year 2016, also the best performance in the last five years. The Education and Health Services sector continued to provide a significant boost to the state economy as it has throughout the economic recovery, resulting in 17,000 additional jobs. Resilient consumer spending also helped power the largest annual post-recessionary increases in employment for the leisure and hospitality (15,200 jobs) and retail trade (9,800 jobs) industries.
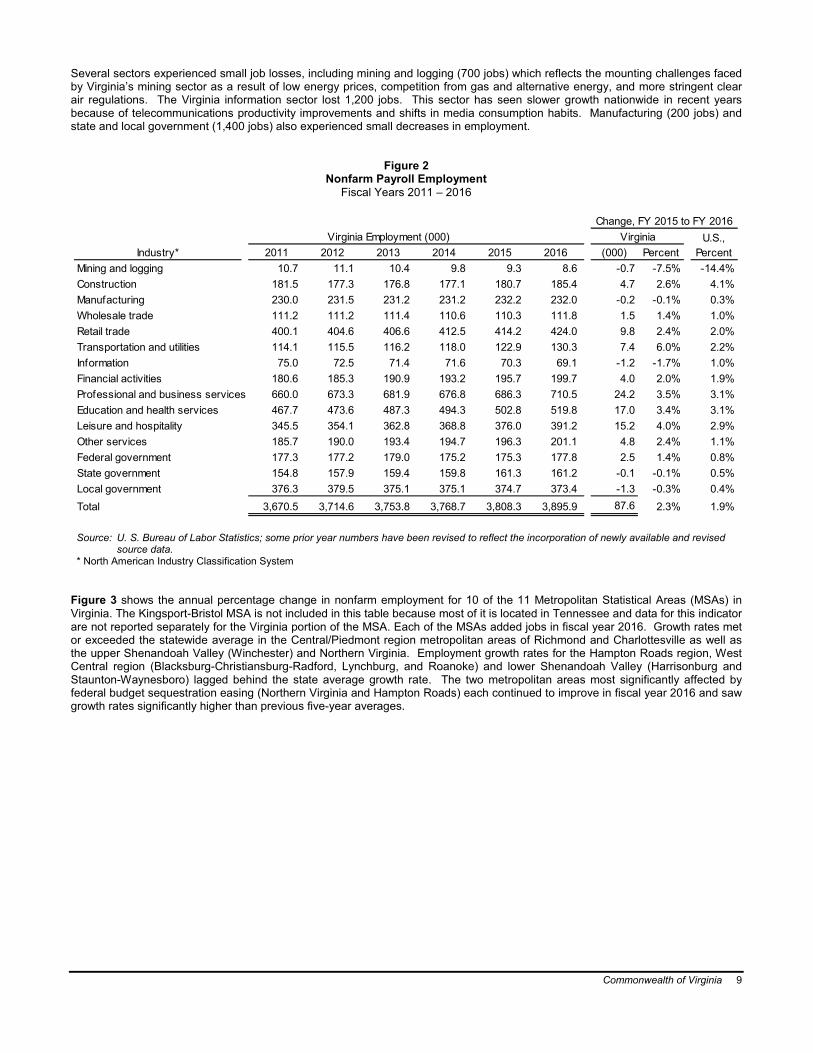
Commonwealth of Virginia 9
Several sectors experienced small job losses, including mining and logging (700 jobs) which reflects the mounting challenges faced by Virginia’s mining sector as a result of low energy prices, competition from gas and alternative energy, and more stringent clear air regulations. The Virginia information sector lost 1,200 jobs. This sector has seen slower growth nationwide in recent years because of telecommunications productivity improvements and shifts in media consumption habits. Manufacturing (200 jobs) andstate and local government (1,400 jobs) also experienced small decreases in employment.
Figure 2Nonfarm Payroll Employment
Fiscal Years 2011 – 2016
Industry* 2011 2012 2013 2014 2015 2016 (000) PercentMining and logging 10.7 11.1 10.4 9.8 9.3 8.6 -0.7 -7.5% -14.4%Construction 181.5 177.3 176.8 177.1 180.7 185.4 4.7 2.6% 4.1%Manufacturing 230.0 231.5 231.2 231.2 232.2 232.0 -0.2 -0.1% 0.3%Wholesale trade 111.2 111.2 111.4 110.6 110.3 111.8 1.5 1.4% 1.0%Retail trade 400.1 404.6 406.6 412.5 414.2 424.0 9.8 2.4% 2.0%Transportation and utilities 114.1 115.5 116.2 118.0 122.9 130.3 7.4 6.0% 2.2%Information 75.0 72.5 71.4 71.6 70.3 69.1 -1.2 -1.7% 1.0%Financial activities 180.6 185.3 190.9 193.2 195.7 199.7 4.0 2.0% 1.9%Professional and business services 660.0 673.3 681.9 676.8 686.3 710.5 24.2 3.5% 3.1%Education and health services 467.7 473.6 487.3 494.3 502.8 519.8 17.0 3.4% 3.1%Leisure and hospitality 345.5 354.1 362.8 368.8 376.0 391.2 15.2 4.0% 2.9%Other services 185.7 190.0 193.4 194.7 196.3 201.1 4.8 2.4% 1.1%Federal government 177.3 177.2 179.0 175.2 175.3 177.8 2.5 1.4% 0.8%State government 154.8 157.9 159.4 159.8 161.3 161.2 -0.1 -0.1% 0.5%Local government 376.3 379.5 375.1 375.1 374.7 373.4 -1.3 -0.3% 0.4%Total 3,670.5 3,714.6 3,753.8 3,768.7 3,808.3 3,895.9 87.6 2.3% 1.9%
VirginiaChange, FY 2015 to FY 2016
Virginia Employment (000) U.S., Percent
Source: U. S. Bureau of Labor Statistics; some prior year numbers have been revised to reflect the incorporation of newly available and revised source data.
* North American Industry Classification System
Figure 3 shows the annual percentage change in nonfarm employment for 10 of the 11 Metropolitan Statistical Areas (MSAs) in Virginia. The Kingsport-Bristol MSA is not included in this table because most of it is located in Tennessee and data for this indicator are not reported separately for the Virginia portion of the MSA. Each of the MSAs added jobs in fiscal year 2016. Growth rates met or exceeded the statewide average in the Central/Piedmont region metropolitan areas of Richmond and Charlottesville as well asthe upper Shenandoah Valley (Winchester) and Northern Virginia. Employment growth rates for the Hampton Roads region, West Central region (Blacksburg-Christiansburg-Radford, Lynchburg, and Roanoke) and lower Shenandoah Valley (Harrisonburg and Staunton-Waynesboro) lagged behind the state average growth rate. The two metropolitan areas most significantly affected by federal budget sequestration easing (Northern Virginia and Hampton Roads) each continued to improve in fiscal year 2016 and saw growth rates significantly higher than previous five-year averages.

10 Commonwealth of Virginia
Figure 3Annual Percent Change in Nonfarm Payroll Employment in Virginia’s MSAs
Fiscal Years 2011 – 2016
2011 2012 2013 2014 2015 2016Virginia 1.1% 1.2% 1.1% 0.4% 1.1% 2.3%Metropolitan areas (a)
Blacksburg-Christiansburg-Radford 0.9% 2.5% 1.7% 0.9% 0.9% 1.6%Charlottesville 0.7% 1.0% 1.0% 1.2% 3.6% 3.4%Harrisonburg 1.9% 0.8% 0.9% 0.4% 0.8% 0.6%Lynchburg -0.6% -0.8% 0.4% 0.4% 0.5% 1.0%Northern Virginia 1.9% 1.9% 1.5% -0.1% 0.8% 2.3%Richmond 0.8% 2.0% 1.9% 1.6% 1.9% 3.9%Roanoke 0.3% 1.0% 1.0% 0.9% 0.4% 1.2%Staunton-Waynesboro 0.1% 0.5% 0.0% 1.1% 1.3% 0.3%Virginia Beach-Norfolk-New port New s (b) 0.1% 0.7% 1.2% 0.7% 0.4% 1.0%Winchester (c) 3.1% 2.7% 1.9% 2.2% 1.3% 3.9%
Area
Source: U. S. Bureau of Labor Statistics; some prior year numbers have been revised to reflect the incorporation of newly available and revised source data
(a) Excludes Kingsport-Bristol MSA, and TN-VA, most of which is located in Tennessee(b) Includes portion in North Carolina(c) Includes portion in West Virginia
Personal Income
Personal income provides the best currently available gauge of the overall health of Virginia’s economy. Changes in personalincome are also strongly correlated with state government revenues such as income tax and retail sales tax collections. As shown inFigure 4, state personal income growth in fiscal year 2016 (4.1 percent) outpaced the nation (3.8 percent) for the first time since fiscal year 2012. This rate represented a slight slowdown from the year before (4.8 percent). Wages and salaries, which make up over half of Virginia total personal income, grew at a rate of 4.3 percent in fiscal year 2016. The next largest component isdividends, interest and rent, which expanded 2.0 percent. Among other components, transfer receipts grew 5.2 percent, supplements to wages and salaries (which includes employer contributions to employee pensions, health insurance, social security/Medicare and other benefits) expanded 4.6 percent, and proprietors’ income advanced 5.7 percent.-
Figure 4Percentage Change in Personal Income
Fiscal Years 2011 – 2016
0%
1%
2%
3%
4%
5%
6%
2011 2012 2013 2014 2015 2016
Virginia United States
Source: U.S. Bureau of Economic Analysis

Commonwealth of Virginia 11
Unemployment
Unemployment rates at both the state and national levels continued to improve in fiscal year 2016. Figure 5 shows that the unemployment rate in Virginia declined from 4.9 percent in fiscal year 2015 to 4.1 percent in fiscal year 2016, while the national rate decreased from 5.7 percent to 5.0 percent. These rates are slowly converging on pre-recessionary unemployment rates of 3.1percent and 4.5 percent, respectively. Virginia has almost achieved the goal of full-employment by one conventional measure--an unemployment rate at or below 4.0 percent. The rate has been slower to come down during the economic recovery because of the severity of the 2007-2009 recession and backlog of discouraged workers, relatively slow economic growth during the expansion, and the difficulty of employers in finding workers with suitable job skills to fill existing openings (the so-called “jobs-skills” mismatch) due to rapid changes in technology and increased educational/experience job requirements.
Figure 5Civilian Unemployment Rate
Fiscal Years 2011 – 2016
0%1%2%3%4%5%6%7%8%9%
10%
2011 2012 2013 2014 2015 2016
Virginia United States
Source: U.S. Bureau of Labor Statistics
Figure 6 shows unemployment rates for Virginia’s metropolitan and non-metropolitan regions. Unemployment rates for each of the 11 metropolitan areas decreased in fiscal year 2016. These decreases continue a pattern of gradual improvement in each metropolitan area over the fiscal year 2011 to fiscal year 2016 period. Below statewide average unemployment rates were observed in Northern Virginia (3.3 percent), the Charlottesville MSA (3.5 percent), the Winchester MSA (3.6 percent), and theStaunton-Waynesboro MSA (3.9 percent). The non-metropolitan area unemployment rate continues to lag behind the metropolitan area unemployment rate. But, it also saw significant improvement during the year, moving from 6.4 percent in fiscal year 2015down to 5.5 percent in fiscal year 2016.

12 Commonwealth of Virginia
Figure 6Civilian Unemployment Rate for Virginia’s MSAs
Fiscal Years 2011 – 2016
2011 2012 2013 2014 2015 2016Virginia 6.8% 6.4% 5.8% 5.5% 4.9% 4.1%Metropolitan Areas 6.4% 6.1% 5.6% 5.2% 4.7% 3.9%
Blacksburg-Christiansburg-Radford 7.5% 6.8% 6.5% 5.7% 5.1% 4.4%Charlottesville 6.1% 5.8% 5.2% 4.8% 4.3% 3.5%Harrisonburg 6.8% 6.6% 6.0% 5.4% 5.0% 4.1%Kingsport-Bristol* 7.7% 7.2% 6.8% 6.2% 5.4% 4.6%Lynchburg 7.4% 7.0% 6.4% 5.9% 5.3% 4.5%Northern Virginia* 5.1% 4.9% 4.6% 4.5% 4.1% 3.3%Richmond 7.6% 7.0% 6.3% 5.8% 5.1% 4.2%Roanoke 7.1% 6.6% 6.0% 5.5% 4.9% 4.0%Staunton-Waynesboro 7.0% 6.5% 5.8% 5.2% 4.6% 3.9%Virginia Beach-Norfolk-New port New s* 7.3% 7.1% 6.4% 5.9% 5.3% 4.6%Winchester 7.0% 6.4% 5.7% 5.1% 4.5% 3.6%
Non-metropolitan Areas 9.4% 8.6% 8.1% 7.4% 6.4% 5.5%
Area
Source: U.S. Bureau of Labor Statistics; some prior year numbers have been revised to reflect the incorporation of newly available and revised source data
* Includes only the portion of the MSA located in Virginia
Figures 7a and 7b show changes in the spatial pattern of unemployment in Virginia during the last two fiscal years using locality-level data. For fiscal year 2016, the highest unemployment rates (above 6.0 percent) were found in the Southwestern region and isolated pockets (mainly independent cities) elsewhere. In comparison to the year before (shown in Figure 7b) when only Alexandria City, Arlington County, and Fairfax City had unemployment rates below 4.0 percent, many localities in Northern Virginia as well as Central Virginia, the Shenandoah Valley, the Roanoke Valley saw unemployment rates dip below 4.0 percent in fiscal year 2016. Despite these marked improvements, 23 localities actually saw their unemployment rates increase between the last two fiscal years. The largest geographical cluster of unemployment increase occurred in eight Southwest region localities (Bland, Buchanan, Dickenson, Russell, Tazewell, Wise, Wythe Counties and Norton City), many of which have been affected by mining industry layoffs.
Figure 7aUnemployment Rate by Locality
Fiscal Year 2016
Source: Virginia Employment Commission

Commonwealth of Virginia 13
Figure 7bUnemployment Rate by Locality
Fiscal Year 2015
Source: Virginia Employment Commission
Taxable Sales
Changes in state retail sales are represented here using information on taxable sales. This measure is a useful proxy for retail sales, but omits some goods (e.g., motor vehicles, motor fuel sales) that appear in the comparable national measure and includes some services (e.g., restaurant sales, lodging sales) not included in that measure. Figure 8 shows that taxable sales decreased slightly from a 3.9 percent increase in fiscal year 2015 to a 3.2 percent increase in fiscal year 2016, a still healthy rate of growth. This growth dip mirrors the slight drop in personal income growth reported earlier.
Figure 8Annual Percentage Change in Taxable Sales in Virginia
Fiscal Years 2011 – 2016
0%
1%
2%
3%
4%
5%
6%
2011 2012 2013 2014 2015 2016
Source: Virginia Department of Taxation.

14 Commonwealth of Virginia
Housing Market
Housing market indicators show that the Virginia market continues to gradually recover. According to Virginia Association of Realtor reports, sales of single-family homes, townhomes, and condos increased from 104,091 units in fiscal year 2015 to 112,019 units in fiscal year 2016. This represents a 7.6 percent rate of increase, which compares to a 5.5 percent rate in fiscal year 2015 and 3.0percent rate in fiscal year 2014. Housing prices published by the Federal Housing Finance Agency provide further support of improving conditions in the Virginia housing market. Figure 9 shows the percentage change in housing prices for Virginia and the nation. Virginia housing prices appreciated 3.6 percent in fiscal year 2016. This rate is an increase from 2.6 percent in fiscal year 2015, but was still lower than the national rate. At the national level, housing prices grew 5.8 percent in fiscal year 2016, and led Virginia for the fourth straight year.
Figure 9Percentage Change in Housing Prices
Fiscal Years 2011 – 2016
-5%
0%
5%
10%
2011 2012 2013 2014 2015 2016
Virginia United States
Source: Federal Housing Finance Agency
Current building permit data indicate that Virginia experienced an increase in new privately owned housing units authorized for construction in fiscal year 2016 of 6.0 percent (Figure 10). This is a marked improvement over the 3.4 percent decline realized in fiscal year 2015 and 0.9 percent increase in fiscal year 2014. As in previous years, this rate is likely to be revised upwards slightly as rural jurisdictions that report building permits on an annual rather than monthly basis submit their data at the end of calendar year 2016. Nationally, building permits increased at a 4.4 percent rate in fiscal year 2016, which represents a slowdown from double-digit growth in fiscal years 2015 (11.9 percent) and 2014 (10.2 percent).

Commonwealth of Virginia 15
Figure 10New Privately Owned Housing Units Authorized
Annual Percentage ChangeFiscal Years 2011 – 2016
-10%
-5%
0%
5%
10%
15%
20%
25%
30%
35%
2011 2012 2013 2014 2015 2016
Virginia United States
Source: U.S. Census Bureau
Conclusion
Fiscal year 2016 saw significant improvement in Virginia’s economy. This improvement paralleled higher federal spending growththan previous fiscal years. The employment growth rate increased and exceeded the national growth rate. The unemployment rate eased and approached what is ordinarily considered full-employment. Personal income and taxable sales growth rates slowed slightly but were still relatively brisk. The Virginia housing market also continued to recover with home sales accelerating, price appreciation picking up, and building permit issuance growing. On many major economic indicators (employment growth, unemployment rate, personal income growth, and building permit growth), the state performed better than the nation as a whole.
As the nation enters the eighth year of what has been a relatively slow-growth recovery and labor markets continue to tighten, the pace of employment increase is likely to slow. In addition, the Federal Reserve is expected to resume lifting interest rates. Further clouding the picture is an expected continued global economic slowdown attributable to weak growth in developed nations, an impending UK Brexit, slackening growth in China, and recession in some natural resource-dependent developing nations. On the other hand, consumer spending is likely to continue to be buoyed by employment growth, rising wages, and stronger household balance sheets. Investment spending may be strengthened by a slowly improving housing market and reduced drag from business fixed investment that has adjusted to energy price and exchange rate shifts. This combination of factors is likely to support near-term moderate national and state economic growth.

16 Commonwealth of Virginia
MAJOR INITIATIVES
The CAFR has received unmodified audit opinions from fiscal year 1986 through fiscal year 2015. During this period, the Commonwealth has also received the Government Finance Officers Association Certificate of Achievement for Excellence in Financial Reporting. While we are very proud of these unmodified audit opinions and awards, we must be mindful of the fact that they are not automatic. The successes of the State Comptroller’s office are directly attributable not only to the professionalism, experience and integrity of the State Comptroller’s technical and accounting personnel, but also to the professionalism, experience and integrity of the financial and accounting personnel throughout the Commonwealth. These major initiatives will support efforts to continue our legacy of quality financial management.
Long-term Financial Planning
In 1992, an amendment to the Constitution of Virginia required the establishment of a Revenue Stabilization Fund. Annually, revenue collections are evaluated to determine whether deposits are required to the Fund. Withdrawals can only occur if the general fund revenues appropriated exceed the revised general fund revenue forecast by more than 2.0 percent of the certified tax revenues collected in the most recently ended fiscal year. Additionally, a withdrawal from the Fund cannot compensate for more than one-half of the difference between the general fund appropriations and revised estimate nor can it exceed more than one-half of the Fund balance. Further, pursuant to the constitutional amendment of Article X, Section 8, effective January 1, 2011, the amount on deposit cannot exceed 15.0 percent of the Commonwealth’s average annual tax revenues derived from taxes on income and retail sales for the preceding three fiscal years. This is an increase of the previous limit of 10.0 percent.
Enterprise Application Project
The Cardinal Project represents a shared vision between the offices of the Secretary of Transportation, Secretary of Finance and the Virginia Information Technologies Agency to replace the Commonwealth’s financial system (CARS) and the Virginia Department of Transportation’s (VDOT) financial system with a modern, enterprise-wide financial system (base financial system). The base financial system provides a solid foundation for the Commonwealth to expand system functionality and facilitates better integration of key administrative systems across the state. This foundation enables the Commonwealth to re-engineer activities to include taking advantage of shared services, increasing functionality for better fiscal management, and reducing redundant agency financial systems and related cost. The Cardinal Project implemented the base financial system in three phases. The first phaseimplemented VDOT’s planned functionality on December 5, 2011, and the second phase implemented the Commonwealth’s base financial system at the Department of Accounts (DOA) on October 1, 2012. The third phase of the project included rolling Cardinal out to all other state agencies. The remaining agencies were divided into two waves, and the first wave was successfully implemented on October 1, 2014. The second wave was successfully implemented on February 1, 2016. Effective July 1, 2016 (fiscal year 2017), Cardinal became the official general ledger accounting system for the Commonwealth and CARS was retired.
The Commonwealth has embarked on a project to replace the existing statewide Payroll system, CIPPS, and integrate the statewide payroll system into Cardinal. I, as State Comptroller, chair the Cardinal Steering Committee, and DOA has assigned full-time resources to this project.
AWARDS AND ACKNOWLEDGMENTS
The Government Finance Officers Association of the United States and Canada (GFOA) awarded the Certificate of Achievement for Excellence in Financial Reporting to the Commonwealth for its CAFR for the fiscal year ended June 30, 2015. The Certificate of Achievement is a prestigious national award that recognizes conformance with the highest standards for preparation of state and local government financial reports. In order to be awarded a Certificate of Achievement, a government unit must publish an easily readable and efficiently organized comprehensive annual financial report that conforms to program standards. Such reports must satisfy both accounting principles generally accepted in the United States of America and all applicable legal requirements.
A Certificate of Achievement is valid for a period of one year. The Commonwealth has received a Certificate of Achievement forthe last 30 consecutive years (fiscal years 1986-2015). I believe that this year’s report continues to conform to the Certificate of Achievement program requirements and we are submitting it to GFOA.
This report could not have been prepared without the full cooperation of all state agencies within the Executive Branch, the Legislature, the Judiciary, the Component Units, and especially the dedication and professionalism of the financial reporting staff in the Department of Accounts.
Respectfully submitted,
David A. Von Moll Comptroller of the Commonwealth of Virginia

Commonwealth of Virginia 17

18 Commonwealth of Virginia

Commonwealth of Virginia 19
Organization Charts

20 Commonwealth of Virginia
Organization of Executive Branch of GovernmentAs of June 30, 2016
Attorney General Governor Lieutenant Governor
Chief of Staff
Off ice of the Inspector General
Department of Law
Secretary of the Commonw ealthInterstate Organization Contributions
Secretary of AdministrationCompensation BoardDepartment of General ServicesDepartment of Human Resource ManagementDepartment of Elections
Secretary of Agriculture and ForestryVirginia Agricultural CouncilDepartment of Agriculture and Consumer
ServicesDepartment of ForestryVirginia Racing Commission
Secretary of Commerce and TradeBoard of AccountancyDepartment of Housing and Community
DevelopmentDepartment of Labor and IndustryDepartment of Mines, Minerals and EnergyDepartment of Professional and Occupational
RegulationDepartment of Small Business and Supplier
DiversityTobacco Region Revitalization CommissionVirginia Economic Development PartnershipVirginia Employment CommissionVirginia Tourism Authority
Secretary of Health and Human ResourcesOffice of Children’s ServicesDepartment for Aging and Rehabilitative
ServicesDepartment for the Blind and Vision ImpairedDepartment for the Deaf and Hard-of-HearingDepartment of Behavioral Health and
Developmental ServicesDepartment of HealthDepartment of Health ProfessionsDepartment of Medical Assistance ServicesDepartment of Social ServicesVirginia Board for People with DisabilitiesVirginia Foundation for Healthy YouthVirginia Rehabilitation Center for the Blind and
Vision ImpairedWilson Workforce and Rehabilitation Center
Secretary of EducationChristopher Newport UniversityDepartment of EducationFrontier Culture Museum of VirginiaGeorge Mason UniversityGunston Hall Institute for Advanced Learning and ResearchJames Madison UniversityJamestown-Yorktown FoundationLongwood UniversityNew College InstituteNorfolk State UniversityOld Dominion UniversityRadford UniversityRichard Bland CollegeRoanoke Higher Education AuthoritySouthern Virginia Higher Education Center Southwest Virginia Higher Education CenterState Council of Higher Education for VirginiaThe College of William and Mary The Library of VirginiaThe Science Museum of VirginiaUniversity of Mary Washington University of VirginiaVirginia College Building AuthorityVirginia Commission for the ArtsVirginia Commonwealth UniversityVirginia Community College SystemVirginia Institute of Marine ScienceVirginia Military InstituteVirginia Museum of Fine ArtsVirginia Polytechnic Institute and State
UniversityVirginia School for the Deaf and Blind Virginia State University
Secretary of FinanceDepartment of AccountsDepartment of Planning and BudgetDepartment of TaxationDepartment of the TreasuryTreasury Board
Secretary of Natural ResourcesDepartment of Conservation and RecreationDepartment of Environmental QualityDepartment of Game and Inland FisheriesDepartment of Historic ResourcesMarine Resources CommissionVirginia Museum of Natural History
Secretary of Public Safety and Homeland Security
Commonwealth Attorneys’ Services CouncilDepartment of Alcoholic Beverage ControlDepartment of CorrectionsDepartment of Criminal Justice ServicesDepartment of Emergency ManagementDepartment of Fire ProgramsDepartment of Forensic ScienceDepartment of Juvenile JusticeDepartment of Military AffairsDepartment of State PoliceVirginia Correctional EnterprisesVirginia Parole Board
Secretary of TechnologyInnovation and Entrepreneurship Investment
AuthorityVirginia Information Technologies Agency
Secretary of TransportationDepartment of AviationDepartment of Motor VehiclesDepartment of Rail and Public TransportationDepartment of TransportationMotor Vehicle Dealer BoardVirginia Port Authority
Secretary of Veterans and Defense AffairsDepartment of Veterans Services

Commonwealth of Virginia 21
Organization of GovernmentSelected Government Officials - Executive Branch
As of December 15, 2016
Citizens of Virginia
Attorney GeneralMark R. Herring
GovernorTerence R. McAuliffe
Lieutenant GovernorRalph S. Northam
Counsel to the GovernorCarlos L. Hopkins
Chief of StaffPaul J. Reagan
Secretary ofthe CommonwealthKelly T. Thomasson
Secretary ofCommerce and Trade
Todd P. Haymore
Secretary ofEducation
Dr. Dietra Y. Trent
Secretary ofHealth and Human Resources
Dr. William A. Hazel, Jr.
Secretary ofNatural ResourcesMolly Joseph Ward
Secretary of PublicSafety and Homeland Security
Brian J. Moran
Secretary ofTechnology
Karen R. Jackson
Secretary ofAdministration
Nancy Rodrigues
Secretary ofAgriculture and Forestry
Basil I. Gooden
Secretary of Veteransand Defense AffairsJohn C. Harvey, Jr.
Secretary ofTransportation
Aubrey L. Layne, Jr.
Secretary ofFinance
Richard D. Brown
Director, Department ofPlanning and BudgetDaniel S. Timberlake
State ComptrollerDavid A. Von Moll, CPA, CGFM
State Tax CommissionerCraig M. Burns
State TreasurerManju S. Ganeriwala

22 Commonwealth of Virginia
Organization of the Department of AccountsAs of December 15, 2016
Director, General Accounting
Melinda L. Pearson, CPA
Senior Financial Reporting Analyst
Sara L. G. Page, CPA
State ComptrollerDavid A. Von Moll, CPA, CGFM
Indirect Cost CoordinatorPenny B. Williams
Director, Cardinal EnterpriseApplications
Stacy D. McCracken
Assistant Director, Financial Statements
Susan L. Jones
Chief Technology OfficerPamela W. Tauer
Director, Financial Reporting
Sharon H. Law rence, CPA, CGMA
Assistant Director, CapitalAssets & Federal Reporting
Robert D. Eddleton, CPA, CIA
Assistant Director, Financial Statements
John J. Sotos, CPA
Senior LeadFinancial Reporting Analyst
Jennifer A. Wykoff
Senior LeadFinancial Reporting Analyst
M. Christy Tuck, CPA
Capital Assets and Lease Accounting Analyst
Nilca K. McClatchie
Financial Reporting AnalystSandra Muir
Information Security OfficerFrank J. Pitera
Financial Reporting Analyst(vacant)
Financial Reporting Analyst /Learning Center Administrator
Marianne P. Madison
Financial Reporting AnalystWilliam H. Campbell, Jr.
Financial Reporting AnalystTiffany D. Hopkins
Financial Reporting AnalystAneri Patel
Senior Financial Reporting Analyst
Esther Kim, CPA, CGMA
Deputy State ComptrollerLew is R. (Randy) McCabe, Jr.,
CPA, CGFM, CGMA
Acting Director, State Payroll Operations
Cathy C. McGill
Senior Financial Reporting Analyst
Thomas E. Mays, CPA
Director,Finance and Administration
Douglas N. Page, CPA
Senior LeadFinancial Reporting Analyst
Matthew K. Wiggins
Senior Financial Reporting Analyst
Sarah B. Duncan
Senior Financial Reporting Analyst
Hannah M. Goodman
Director, Payroll Service Bureau
Jean S. Turlington

Commonwealth of Virginia 23
FINANCIAL SECTION
Independent Auditor’s ReportManagement’s Discussion and Analysis
Basic Financial StatementsRequired Supplementary Information
Combining and Individual Fund Statements and Schedules

24 Commonwealth of Virginia
CCommonwealth of VirginiaAuditor of Public Accounts
Martha S. Mavredes, CPA P.O. Box 1295Auditor of Public Accounts Richmond, Virginia 23218
December 15, 2016
The Honorable Terence R. McAuliffeGovernor of Virginia
The Honorable Robert D. Orrock, Sr.Chairman, Joint Legislative Audit
And Review Commission
INDEPENDENT AUDITOR’S REPORT
Report on Financial Statements
We have audited the accompanying financial statements of the governmental activities, the business-type activities, the aggregate discretely presented component units, each major fund, and the aggregate remaining fund information of the Commonwealth of Virginia, as of and for the year ended June 30, 2016, and the related notes to the financial statements, which collectively comprise the Commonwealth’s basic financial statements as listed in the table of contents.
Management’s Responsibility for the Financial Statements
Management is responsible for the preparation and fair presentation of these financial statements in accordance with accounting principles generally accepted in the United States of America; this includes the design, implementation, and maintenance of internal control relevant to the preparation and fair presentation of financial statements that are free from material misstatement, whether due to fraud or error.
Auditor’s Responsibility
Our responsibility is to express opinions on these financial statements based on our audit. We did not audit the financial statements of certain discretely presented components units of the Commonwealth, which are discussed in Note 1.B. These component units collectively represent 29.15 percent of total assets and deferred outflows, 25.06 percent of net position, and 10.09percent of revenues of the aggregate discretely presented component units. Those financial statements were audited by other auditors whose reports thereon have been furnished to us, and our opinion, insofar as it relates to the amounts included for certain component units discussed in Note 1.B. is based on the reports of the other auditors.
We conducted our audit in accordance with auditing standards generally accepted in the United States of America and the standards applicable to financial audits contained in Government Auditing Standards, issued by the Comptroller General of the United States. Those standards require that we plan and perform the audit to obtain reasonable assurance about whether the financial statements are free of material misstatement. The financial statements of the Hampton Roads Sanitation District Commission, Science Museum of Virginia Foundation, Virginia Museum of Fine Arts Foundation, Library of Virginia Foundation,and Danville Science Center, Inc., which were audited by other auditors upon whose reports we are relying, were audited in accordance with auditing standards generally accepted in the United States of America, but not in accordance with Government Auditing Standards.
An audit involves performing procedures to obtain audit evidence about the amounts and disclosures in the financial statements. The procedures selected depend on the auditor’s judgment, including the assessment of the risks of material misstatement of the financial statements, whether due to fraud or error. In making those risk assessments, the auditor considers internal control relevant to the entity’s preparation and fair presentation of the financial statements in order to design audit procedures that are appropriate in the circumstances, but not for the purpose of expressing an opinion on the effectiveness of the entity’s internal control. Accordingly, we express no such opinion. An audit also includes evaluating the appropriateness ofaccounting policies used and the reasonableness of significant accounting estimates made by management, as well as evaluating the overall financial statement presentation.
Commonwealth of Virginia 25
We believe that the audit evidence we have obtained is sufficient and appropriate to provide a reasonable basis for our audit opinions.
Opinions
In our opinion, based on our audit and the reports of other auditors, the financial statements referred to above present fairly, in all material respects, the respective financial position of the governmental activities, the business-type activities, the aggregate discretely presented component units, each major fund, and the aggregate remaining fund information of the Commonwealth of Virginia as of June 30, 2016, and the respective changes in financial position and, where applicable, cash flows thereof for the year then ended, in accordance with accounting principles generally accepted in the United States of America.
Emphasis of Matter
Change in Accounting Principle
The Commonwealth of Virginia’s basic financial statements for the year ended June 30, 2016, reflect the provisions of the Governmental Accounting Standards Board’s (GASB) Statement No. 72, Fair Value Measurement and Application. The Commonwealth of Virginia implemented the requirements of GASB Statement No. 72 in accordance with their required effective date. See Note 6 in the accompanying financial statements for the impact of the standard’s implementation. Our opinion is not modified with respect to this matter.
Correction of 2015 Financial Statements
As discussed in Note 2 of the accompanying financial statements, the fiscal year 2015 governmental activities,Commonwealth Transportation major special revenue fund, the Federal Trust major special revenue fund, the Literary Fund major special revenue fund, the Other non-major special revenue fund, the Unclaimed Property private purpose trust fund, and the component unit financial statements have been restated to correct misstatements. Our opinion is not modified with respect to these matters.
Other Matters
Required Supplementary Information
Accounting principles generally accepted in the United States of America require that the management’s discussion and analysis, budgetary comparison schedules, the schedule of changes in employer’s net pension liability, schedule of employer contributions for pension plans, schedule of funding progress for other post-employment benefit plans, schedule of employer contributions for other post-employment benefit plans, and claims development information on pages 27 through 37 and 179through 200, be presented to supplement the basic financial statements. Such information, although not a part of the basic financial statements, is required by the Governmental Accounting Standards Board who considers it to be an essential part of the financial reporting for placing the basic financial statements in an appropriate operational, economic, or historical context. We have applied certain limited procedures to the required supplementary information in accordance with auditing standards generally accepted in the United States of America, which consisted of inquiries of management about the methods of preparing the information and comparing the information for consistency with management’s responses to our inquiries, the basic financial statements, and other knowledge we obtained during our audit of the basic financial statements. We do not express an opinion or provide any assurance on the information because the limited procedures do not provide us with sufficient evidence to express an opinion or provide any assurance.
Supplementary and Other Information
Our audit was conducted for the purpose of forming opinions on the financial statements that collectively comprise the Commonwealth of Virginia’s basic financial statements. The accompanying supplementary information, such as the combining and individual fund statements and schedules, and other information such as the introductory and statistical sections, are presented for the purpose of additional analysis and is not a required part of the basic financial statements.
The combining and individual fund statements and schedules are the responsibility of management and were derived from and relate directly to the underlying accounting and other records used to prepare the basic financial statements. Such informationhas been subjected to the auditing procedures applied in the audit of the basic financial statements and certain additional procedures, including comparing and reconciling such information directly to the underlying accounting and other records used to prepare the basic financial statements or to the basic financial statements themselves, and other additional procedures in accordance with auditing standards generally accepted in the United States of America by us and other auditors. In our opinion, based on our audit, the procedures performed as described above, and the report of the other auditors, the combining and individual fund statements and schedules are fairly stated, in all material respects, in relation to the basic financial statements taken as a whole.

26 Commonwealth of Virginia
The introductory and statistical sections have not been subjected to the auditing procedures applied in the audit of the basic financial statements and, accordingly, we do not express an opinion or provide any assurance on them.
Other Reporting Required by Government Auditing Standards
In accordance with Government Auditing Standards, our report dated December 15, 2016, on our consideration of theCommonwealth’s internal control over financial reporting and on our tests of its compliance with certain provisions of laws, regulations, contracts and grant agreements, and other matters is issued in the Commonwealth of Virginia Single Audit Report.The purpose of that report is to describe the scope of our testing of internal control over financial reporting and compliance and the results of that testing, and not to provide an opinion on the internal control over financial reporting or on compliance. That report isan integral part of an audit performed in accordance with Government Auditing Standards in considering the Commonwealth’sinternal control over financial reporting and compliance.
MARTHA S. MAVREDESAUDITOR OF PUBLIC ACCOUNTS

Commonwealth of Virginia 27
Management’s Discussion and Analysis(Unaudited)
The following is a discussion and analysis of the Commonwealth of Virginia’s (the Commonwealth) financial performance, including an overview and analysis of the financial activities of the Commonwealth for the fiscal year ended June 30, 2016. Readers should consider this information in conjunction with the transmittal letter, which is located in the Introductory Section of this report, and the Commonwealth’s financial statements, including the notes to the financial statements, which are located after this analysis.
Financial HighlightsGovernment-wide Highlights
The primary government’s assets and deferred outflows of resources exceeded its liabilities and deferred inflows of resources at June 30, 2016, by $21.7 billion. Net position of governmental activities increased by $569.0 million and net position of business-type activities increased by $206.8 million. Component units reported an increase in net position of $283.5 million from June 30, 2015.
Fund Highlights
At the end of the fiscal year, the Commonwealth’s governmental funds reported a combined ending fund balance of $3.7 billion, a decrease of $744.1 million in comparison with the prior year. Of this total fund balance, $307.1 million represents nonspendable fund balance, $1.6 billion represents restricted fund balance, $2.5 billion represents committed fund balance, and $29.3 million represents assigned fund balance. These amounts are offset by a negative $709.3 million unassigned fund balance. The Enterprise Funds reported net position at June 30, 2016, of $1.6 billion, an increase of $214.3 million during the year which isprimarily attributable to the Unemployment Compensation Fund and the Virginia College Savings Plan. See page 33 for additional information.
The General Fund recognized higher fund revenues and expenditures, as well as lower assets and deferred outflows of resourcesand liabilities and deferred inflows of resources when compared to fiscal year 2015. See page 34 for additional information.
Long-term Debt
The Commonwealth’s total debt rose during the fiscal year to $42.8 billion, an increase of $873.0 million, or 2.1 percent. During the fiscal year, the Commonwealth issued new debt in the amount of $409.0 million for the primary government and $3.8 billion for the component units. These debt issuances, coupled with debt retirements, decreased the debt balances to $14.5 billion for theprimary government and increased the debt balances to $28.3 billion for component units.
Overview of the Financial StatementsThis discussion and analysis is an introduction to the Commonwealth’s basic financial statements, which include three components: 1) government-wide financial statements; 2) fund financial statements; and 3) notes to the financial statements. The report also contains additional required supplementary information and other information.
Government-wide Statements
The government-wide financial statements are designed to provide readers with a broad overview of the Commonwealth’s finances in a manner similar to a private-sector business. The statements provide both short-term and long-term information about the Commonwealth’s financial position which helps readers determine whether the Commonwealth’s financial position has improved or deteriorated during the fiscal year. These statements include all non-fiduciary financial activity on the full accrual basis of accounting. This means that all revenue and expenditures are reflected in the financial statements even if the related cash has not been received or paid as of June 30.
The Statement of Net Position (pages 40 and 41) presents information on all of the Commonwealth’s assets and deferred outflowsof resources, and liabilities and deferred inflows of resources; net position represents the difference between all other elements in a statement of financial position and is displayed in three components – net investment in capital assets; restricted; and unrestricted.Over time, increases or decreases in net position may indicate whether the financial position of the Commonwealth is improving or deteriorating.
The Statement of Activities (pages 42 through 44) presents information showing how the Commonwealth’s net position changedduring fiscal year 2016. All changes in net position are reported as soon as the underlying event giving rise to the change occurs,regardless of the timing of related cash flows. Thus, revenues and expenses are reported in this statement for some items that will only result in cash flows in future fiscal periods (e.g., uncollected taxes and earned but unused vacation leave).

28 Commonwealth of Virginia
Both the Statement of Net Position and Statement of Activities report three separate activities. These activities are described as follows:
Governmental Activities – account for functions of the Commonwealth that are primarily supported by taxes and intergovernmental revenues. The majority of the Commonwealth’s basic services, such as education, individual and familyservices, transportation, resources and economic development, administration of justice, and general government, fall within this category.
Business-type Activities – account for functions that are intended to recover all or a significant portion of their costs through user fees and charges. The major business-type activities of the Commonwealth include the Virginia Lottery, Virginia College Savings Plan, and Unemployment Compensation Fund.
Discretely Presented Component Units – account for functions of legally separate entities for which the Commonwealth is financially accountable. The Commonwealth has 26 non-higher education component units and 22 higher education institutions that are reported as discretely presented component units. Information regarding the individual financial statements of the component units is presented in the notes to the financial statements.
This report includes two schedules (pages 48 and 52) that reconcile the amounts reported on the governmental fund financial statements (modified accrual accounting) with governmental activities on the appropriate government-wide statements (full accrual accounting). The following indicates some of the reporting differences between the government-wide financial statements and the fund financial statements.
� Capital assets used in governmental activities are not reported on governmental fund statements.� Long-term liabilities, unless due and payable, are not included in the fund financial statements. These liabilities are only
included in the government-wide statements.� Internal service funds are reported as governmental activities in the government-wide statements, but are reported as
proprietary funds in the fund financial statements.� Other long-term assets that are not available to pay for current period expenditures are deferred in the governmental fund
statements, but not deferred in the government-wide statements.� Capital outlay spending results in capital assets on the government-wide statements, but is reported as expenditures in
the fund financial statements.� Bond proceeds provide current financial resources on the fund financial statements, but are recorded as long-term
liabilities in the government-wide financial statements.
Fund Financial Statements
A fund is a grouping of related accounts that is used to maintain control over resources that have been segregated for specific activities or objectives. The Commonwealth, like other state and local governments, uses fund accounting to ensure and demonstrate compliance with finance-related legal requirements. All of the Commonwealth’s funds can be divided into three categories: governmental, proprietary, and fiduciary. Each of these categories uses different accounting approaches. Fund financial statements begin on page 46 and provide detailed information about the major individual funds.
� Governmental funds – Most of the basic services provided by the Commonwealth are reported in the governmental funds. These statements provide a detailed, short-term view of the functions reported as governmental activities in the government-wide financial statements. The government-wide financial statements are reported using the full accrual basis of accounting, but the governmental fund financial statements are reported using the modified accrual basis of accounting. This allows the reader to focus on assets that can be readily converted to cash and determine whether there are adequate resources to meet the Commonwealth’s current needs.
Because the focus of governmental funds is more limited than that of the government-wide financial statements, it is useful to compare the information presented for governmental funds with similar information presented for governmental activities in the government-wide financial statements. This comparison can help readers better understand the long-term impact of the Commonwealth’s near-term financing decisions. Both the governmental fund balance sheet and the governmental fund statement of revenues, expenditures, and changes in fund balances provide a reconciliation to facilitate this comparison between governmental funds and governmental activities. These reconciliations are presented on the page immediately following each governmental fund financial statement.
The Commonwealth reports 12 individual governmental funds. Information is presented separately in the governmental fund statements for the General, Commonwealth Transportation, Federal Trust, and Literary funds, which are all considered major funds. Data from the other 8 governmental funds are aggregated into a single column on the fund statements. Individual fund data for these nonmajor governmental funds is provided in the combining financial statements immediately following the required supplementary information.

Commonwealth of Virginia 29
� Proprietary funds – The Commonwealth maintains two different types of proprietary funds, enterprise and internal service. These funds report activities that operate more like those of private-sector business and use the full accrual basis of accounting. Enterprise funds report activities that charge fees for supplies or services to the general public like the Virginia Lottery. Enterprise funds are reported as business-type activities on the government-wide financial statements.
The enterprise funds use the full accrual basis of accounting and the only differences between amounts reported on the government-wide statements and the enterprise fund statements are due to internal service fund activity (see reconciliations on pages 54 and 56). Internal service funds report activities that charge fees for supplies and services toother Commonwealth agencies, like Fleet Management. Internal service funds are reported as governmental activities in the government-wide statements because these types of services predominantly benefit governments rather than business-type functions.
The Commonwealth reports 24 individual proprietary funds. Information is presented separately in the proprietary fundstatements for the Virginia Lottery, Virginia College Savings Plan, and Unemployment Compensation Funds, all of which are considered major funds. Data from the other enterprise funds are aggregated into a single column on the fund statements. All internal service funds are aggregated into a single column on the fund statements. Individual fund data for all nonmajor proprietary funds is provided in the combining financial statements immediately following the required supplementary information.
� Fiduciary funds – These funds are used to account for resources held for the benefit of parties outside the government and use the full accrual basis of accounting. Fiduciary funds are excluded from the government-wide financial statements because the resources of these funds are restricted and cannot be used to finance the Commonwealth’s operations. The Commonwealth’s fiduciary activities are reported in separate Statements of Fiduciary Net Position and Changes in Fiduciary Net Position beginning on page 64.
The Commonwealth’s fiduciary funds are the:
o Private Purpose Trusts, which reports the activities for 7 separate funds and accounts for transactions of trust arrangements in which the principal and income benefit individuals, private organizations, or other governments;
o Pension and Other Employee Benefit Trusts, which reports the activities of 13 separate pension and other employment retirement plans for employees;
o Investment Trust, which accounts for the activities of the external investment pool; and,o Agency, which accounts for assets held on behalf of others in 20 separate funds.
Individual fund data for all fiduciary funds is provided in the combining financial statements immediately following the required supplementary information.
� Component Units – The government-wide financial statements report information for all component units aggregated in a single column. Information is provided separately in the component unit fund statements for the Virginia Housing Development Authority, Virginia Public School Authority, Virginia Resources Authority, and Virginia College Building Authority, all of which are considered major component units. Data from the other component units are aggregated into a single column on the fund statements. Individual fund data for all nonmajor component units is provided in the combining financial statements immediately following the required supplementary information.
Notes to the Financial Statements
The notes provide additional information that is essential to a full understanding of the data provided in the government-wide and fund financial statements. The notes to the financial statements can be found immediately following the component unit fund financial statements.
Required Supplementary Information
The basic financial statements are followed by a section of required supplementary information. This section includes budgetary comparison schedules reconciling the statutory and generally accepted accounting principles fund balances at June 30. It alsoincludes information concerning the Commonwealth’s funding progress and employer contributions for pension and other postemployment benefits and changes in employers’ net pension liability, as well as trend information for Commonwealth-managed risk pools.

30 Commonwealth of Virginia
Other Information
The combining statements referred to earlier in connection with nonmajor funds and component units can be found beginning onpage 201 of this report. The individual fund information is aggregated into a single total on the combining financial statements,which carries forward to the fund financial statements.
Government-wide Financial Analysis
The primary government’s assets and deferred outflows of resources exceeded its liabilities and deferred inflows of resources by $21.7 billion during the fiscal year. The net position of the governmental activities increased $569.0 million, or 2.9 percent, primarily due to increases in capital assets and deferred outflows of resources offset by increases in total liabilities and deferred inflows of resources. Capital assets are discussed further on page 35, the long-term liabilities are discussed further on page 36,and deferred inflows and outflows of resources are discussed in Note 13, “Deferred Outflows and Deferred Inflows of Resources.”Business-type activities had an increase of $206.8 million, or 15.0 percent, primarily due to an increase for the Unemployment Compensation Fund and Virginia College Savings Plan as discussed on page 33. As discussed in Note 2, the government-wide beginning balance was restated predominantly for a change in investment liquidation management strategy for the Literary Fundand the correction of prior year errors to arrive at a restated beginning balance of $20.9 billion.
Figure 11Net Position as of June 30, 2016 and 2015
(Dollars in Thousands)
Current and other assets $ 8,760,492 $ 9,394,081 $ 4,220,594 $ 4,425,736 $ 12,981,086 $ 13,819,817Capital assets 30,415,387 29,357,553 38,319 40,227 30,453,706 29,397,780Deferred outf low s of resources 731,279 507,048 17,903 13,438 749,182 520,486
Total assets and deferred outf low s of resources 39,907,158 39,258,682 4,276,816 4,479,401 44,183,974 43,738,083Long-term liabilities outstanding 12,157,996 11,953,821 2,346,500 2,736,277 14,504,496 14,690,098Other liabilities 5,059,991 4,841,326 334,095 342,291 5,394,086 5,183,617Deferred inflow s of resources 2,574,935 2,918,314 9,967 21,371 2,584,902 2,939,685
Total liabilities and deferred inflow s of resources 19,792,922 19,713,461 2,690,562 3,099,939 22,483,484 22,813,400Net position:Net investment in capital
assets 24,308,954 23,416,290 32,960 34,519 24,341,914 23,450,809Restricted 1,365,260 1,585,961 1,044,558 845,213 2,409,818 2,431,174Unrestricted (5,559,978) (5,457,030) 508,736 499,730 (5,051,242) (4,957,300)
Total net position $ 20,114,236 $ 19,545,221 $ 1,586,254 $ 1,379,462 $ 21,700,490 $ 20,924,683
20162015
Governmental Activities Business-type Activities Total
2016 as restated 2016 20152015
as restated
The largest portion of the primary government’s net position reflects its investment in capital assets (e.g., land, buildings, equipment, infrastructure, construction-in-progress, and intangible assets including water rights, easements and software), less any related outstanding debt and deferred inflows of resources used to acquire those assets. These assets are recorded net of depreciation in the financial statements. The primary government uses these capital assets to provide services to citizens; therefore, these assets are not available for future spending. Although the primary government’s investment in its capital assets is reported net of related debt, it should be noted that the resources needed to repay this debt must be provided from other sources, since the capital assets themselves cannot be used to liquidate these liabilities (Figure 11). The governmental activities net investment in capital assets amount exceeds total net position due to a negative unrestricted net position amount unrelated to capital assets.
An additional portion of the primary government’s net position represents restricted net position. These resources are subject to external restrictions or constitutional provisions specifying how they may be used. The remaining balance of negative $5.1 billion is unrestricted net position (Figure 11).
Approximately 55.9 percent of the primary government’s total revenue came from taxes. While the primary government’s expenses cover many services, the largest expenses are for education and individual and family services. General revenues normally fund governmental activities. For fiscal year 2016, governmental expenses exceeded program and general revenues by $218.4 million.Program revenues exceeded expenses from business-type activities by $984.0 million. The following condensed financial information (Figure 12) was derived from the Government-wide Statement of Activities and provides detail regarding the change in net position (see page 42).

Commonwealth of Virginia 31
Figure 12Changes in Net Position for the Fiscal Years Ended June 30, 2016 and 2015
(Dollars in Thousands)
Revenues:Program Revenues:
Charges for Services $ 2,567,716 $ 2,543,208 $ 4,069,063 $ 3,953,679 $ 6,636,779 $ 6,496,887Operating Grants and Contributions 9,147,407 9,064,631 430 183 9,147,837 9,064,814Capital Grants and Contributions 1,466,927 1,618,761 - - 1,466,927 1,618,761
General Revenues:Taxes:
Individual and Fiduciary Income 12,685,001 12,265,530 - - 12,685,001 12,265,530Sales and Use 4,993,762 4,829,677 - - 4,993,762 4,829,677Corporation Income 772,639 801,165 - - 772,639 801,165Motor Fuel 975,851 888,348 - - 975,851 888,348Motor Vehicle Sales and Use 909,617 846,197 - - 909,617 846,197Communications Sales and Use 405,576 416,051 - - 405,576 416,051Deeds, Contracts, Wills, and Suits 470,644 440,896 - - 470,644 440,896Premiums of Insurance Companies 485,018 453,376 - - 485,018 453,376Alcoholic Beverage Sales 147,813 139,832 - - 147,813 139,832Tobacco Products 176,401 178,954 - - 176,401 178,954Estate 175 92 - - 175 92Public Service Corporations 108,158 118,849 - - 108,158 118,849Beer and Beverage Excise 43,185 42,719 - - 43,185 42,719Wine and Spirits/ABC Liter 26,442 26,253 - - 26,442 26,253Bank Stock 17,796 19,030 - - 17,796 19,030Other Taxes 118,288 112,368 9,141 9,142 127,429 121,510
Unrestricted Grants and Contributions 48,031 48,613 - - 48,031 48,613Investment Earnings 63,397 15,970 900 1,603 64,297 17,573Miscellaneous 281,562 205,625 175 243 281,737 205,868
Total Revenues 35,911,406 35,076,145 4,079,709 3,964,850 39,991,115 39,040,995
Expenses:General Government 3,229,507 3,267,158 - - 3,229,507 3,267,158Education 10,178,231 9,845,532 - - 10,178,231 9,845,532Transportation 4,528,605 4,369,089 - - 4,528,605 4,369,089Resources and Economic Development 1,007,607 970,545 - - 1,007,607 970,545Individual and Family Services 14,024,213 13,271,422 - - 14,024,213 13,271,422Administration of Justice 2,921,635 2,746,146 - - 2,921,635 2,746,146Interest and Charges on Long-term Debt 240,007 223,584 - - 240,007 223,584Virginia Lottery - - 1,415,154 1,299,753 1,415,154 1,299,753Virginia College Savings Plan - - 103,307 155,331 103,307 155,331Unemployment Compensation - - 390,441 431,437 390,441 431,437Alcoholic Beverage Control - - 614,641 579,945 614,641 579,945Risk Management - - 14,281 10,240 14,281 10,240Local Choice Health Care - - 411,656 349,910 411,656 349,910Route 460 Funding Corporation of Virginia - - 1,461 13,024 1,461 13,024Virginia Industries for the Blind - - 41,860 42,722 41,860 42,722Consolidated Laboratory - - 10,016 8,630 10,016 8,630eVA Procurement System - - 22,573 22,563 22,573 22,563Department of Environmental Quality Title V - - 11,135 10,444 11,135 10,444Wireless E-911 - - 41,851 36,804 41,851 36,804Museum and Library Gift Shops - - 6,676 6,618 6,676 6,618Behavioral Health Canteen and Work Activity - - 451 466 451 466
Total Expenses 36,129,805 34,693,476 3,085,503 2,967,887 39,215,308 37,661,363
(218,399) 382,669 994,206 996,963 775,807 1,379,632Special Item - (134,561) - 34,437 - (100,124)Transfers 787,414 728,371 (787,414) (728,371) - -Increase in net position 569,015 976,479 206,792 303,029 775,807 1,279,508Net position, July 1, as restated 19,545,221 18,568,742 1,379,462 1,076,433 20,924,683 19,645,175Net position, June 30 $ 20,114,236 $ 19,545,221 $ 1,586,254 $ 1,379,462 $ 21,700,490 $ 20,924,683
2016 as restated
Total
2016 as restated 2016 20152015 2015
Excess/(Deficiency) before transfers
Business-type ActivitiesGovernmental Activities

32 Commonwealth of Virginia
Governmental Activities Revenues
Figure 13 is a graphical representation of the Statement of Activities revenues for governmental activities. Governmental activities revenues increased by $835.3 million, or 2.4 percent. The net increase is mainly attributable to increases in the General Fund, which are discussed on page 34.
Figure 13Revenues by Source – Governmental Activities
Fiscal Year 2016
Charges for Services7%
Operating Grants and Contributions
26%
Capital Grants and Contributions
4%
Individual and Fiduciary IncomeTax
35%
Sales and Use Tax14%
Corporation Income Tax2%
Motor Fuel Tax3%
Motor Vehicle Sales and Use Tax
3%
Communications Sales and Use
1%Premiums of Insurance
Companies Tax1%
Other Taxes3%
Other 1%
Governmental Activities Expenses
Figure 14 is a graphical representation of the Statement of Activities expenses for governmental activities. Governmental activities expenses increased by $1.4 billion, or 4.1 percent. This change is primarily attributable to increases in all expense types with the exception of General Government. See pages 34 and 35 for additional information.
Figure 14Expenses by Type – Governmental Activities
Fiscal Year 2016
General Government9%
Education28%
Transportation12%
Resources & Economic Development
3%
Individual & Family Services
39%
Administration of Justice
8%
Other1%

Commonwealth of Virginia 33
Net Position of Business-type Activities
Net position of business-type activities increased by $206.8 million during the fiscal year. As shown in Figure 15, highlights of the changes in net position for the major enterprise funds were as follows:
� Lottery sales were $2.0 billion, an increase of $163.0 million over the prior year. Net income was $593.6 million, anincrease of $48.1 million (8.8 percent) from fiscal year 2015. Sales of scratch games increased by $82.1 million (8.1percent) and online sales increased by $80.9 million (9.8 percent). Additionally, there is an increase of $114.7 million (8.8percent) in total expenses, primarily attributable to the cost of prizes and claims.
� Virginia College Savings Plan’s net position increased by $43.0 million (7.9 percent) during the fiscal year. Although the investment income decreased from the prior year, total revenues still exceeded expenses incurred during fiscal year 2016.
� Unemployment Compensation Fund net position increased by $199.3 million during fiscal year 2016, primarily as a result of a decrease in benefit claims. Operating expenses decreased by $41.0 million. These factors combined give the Trust Fund the large increase.
Over the one year period from July 1, 2015, to June 30, 2016, the unemployment rate declined from 4.9 percent to 4.1percent. Additionally, there were approximately 16,482 fewer initial unemployment claims filed than in the previous year.These declines were accompanied by a decrease in the average benefit duration from 16.0 weeks to 14.9 weeks in fiscal year 2016. There was an increase in the average weekly benefit amounts from approximately $289.0 to $298.1 in fiscal year 2016. These multiple influences led to a decrease in the total benefit payments of $41.0 million over the prior year.
Figure 15Business-type Activities
Program Revenues and ExpensesFiscal Year 2016
(Dollars in Thousands)
$0
$500,000
$1,000,000
$1,500,000
$2,000,000
$2,500,000
Virginia Lottery Virginia College SavingsPlan
UnemploymentCompensation
Other
Expenses Program Revenues

34 Commonwealth of Virginia
Fund Statements Financial Analysis
As of the end of the fiscal year, the primary government’s governmental funds reported combined ending fund balances of $3.7billion, including a negative unassigned fund balance of $709.3 million indicating that restricted and committed amounts exceed theavailable modified accrual basis fund balance. The remainder of fund balance is nonspendable, restricted or committed to indicate that it is not available for new spending.
General Fund Highlights
At the end of the fiscal year, the General Fund reported a combined ending fund balance of $710.3 million, a decrease of $138.1million in comparison with the prior year. Of this total fund balance, $114.4 million represents nonspendable fund balance, $908.2million represents restricted fund balance, and $397.0 million represents committed fund balance. These amounts are offset by a negative $709.3 million unassigned fund balance.
Fiscal year 2016 General Fund revenues were 3.7 percent, or $692.8 million, higher than fiscal year 2015 revenues. This revenue change results from increases of $716.5 million primarily attributable to individual and fiduciary income taxes ($362.0 million), sales and use taxes ($122.5 million), other revenue primarily relating to expenditure recoveries from prior years ($73.6 million), interest, dividends, and rents ($45.3 million), premiums of insurance companies taxes ($36.1 million), and deeds, contracts, wills and suitstaxes ($23.4 million), offset by decreases of $23.7 million primarily attributable to communications sales tax ($10.8 million), and public service corporations ($4.9 million).
Fiscal year 2016 expenditures increased by 5.5 percent, or $1.0 billion, when compared to fiscal year 2015. This was primarily attributable to increases in individual and family services, general government, education, and administration of justiceexpenditures of $505.6 million, $239.7 million, $159.2 million, and $114.5 million, respectively. Net other financing sources and uses decreased by $9.3 million, which is primarily due to lower transfers in from nongeneral funds and lower proceeds from the sale of capital assets offset by a decrease in transfers out to nongeneral funds.
Budget Highlights
The General Fund began the year with an original revenue budget that was $547.3 million, or 3.0 percent, higher than the finalfiscal year 2015 revenue budget. Additionally, the final revenue budget was slightly higher ($607.3 million or 3.2 percent) than the original budget. The change between the original and final budget was primarily attributable to increases in the final budget for individual and fiduciary income taxes of $603.3 million, deeds, contracts, wills and suits of $61.2 million and sales and use taxes of $48.4 million. This was offset by decreases in the final budget for corporation income taxes of $97.9 million and sales of property and commodities of $31.5 million. Total actual General Fund revenues were lower than final budgeted revenues by $251.1 million due to weaker actual than anticipated collections.
Total final budget expenditures were higher than original budget expenditures by $612.2 million, or 3.1 percent. This increase was primarily attributable to budgeted expenditures for individual and family services of $292.6 million, administration of justice of $115.7 million, capital outlay of $82.9 million, and education of $72.2 million.
The Commonwealth spent less than planned so actual expenditures were $341.9 million, or 1.7 percent, lower than final budget expenditures.
Budget Outlook
In order to mitigate the effects of difficult economic conditions over the past several years, the Commonwealth adopted temporary budget solutions such as accelerated sales taxes.
While some of the conditions left by the financial and economic downturn experienced between 2008 and 2010 are still visible in certain sectors, Virginia’s economy saw significant improvement. Data regarding the primary economic indicators – jobs and newhousing units saw improvement and the state performed better than the nation as a whole. The unemployment rate has continuedto decrease from the previous fiscal year and has approached what is considered full-employment while housing indicators continue to improve with home sales accelerating, price appreciation picking up, and building permit issuance growing. During fiscal year 2016, the two General Fund revenue sources most closely tied to current economic activity – individual income taxes and retail sales taxes – experienced increases when compared to the 2015 collections by $227.0 million (1.8 percent) and $60.4 million (1.9 percent), respectively. The individual income tax collections and retail sales taxes were less than the estimated revenue by $267.4 million (2.1 percent) and $71.9 million (2.1 percent), respectively.
Although the fiscal year 2016 revenue collections exceeded fiscal year 2015, the fiscal year 2016 collections did not meet theestimate. Based on the most recent General Fund revenue estimate, the fiscal year 2017 revenue is projected to increase 1.7percent over the fiscal year 2016 revenue collections. This planned increase is a result of continued growth in individual income taxes and retail sales taxes. The Governor will release his amendments to the 2017-2018 biennial budget on December 16, 2016.

Commonwealth of Virginia 35
Major Special Revenue Fund Highlights
The Commonwealth Transportation Fund ended the fiscal year with a fund balance of $1.9 billion. Approximately $3.5 billion is contractually committed for various highways, public transportation, and rail preservation projects (see Note 20). Additionally, revenues and expenditures increased $111.3 million, or 2.1 percent, and $463.4 million, or 8.5 percent, respectively. The revenue increase was primarily due to increases in tax collections of $194.4 million, or 5.9 percent, offset by decreases in federal income of $87.9 million, or 6.6 percent. Expenditures increased mainly for highway maintenance, acquisition, and construction.
The Federal Trust Fund balance increased by $8.3 million, or 6.9 percent, primarily due to an increase in expenditure recoveries of $72.3 million, or 93.7 percent, an increase in Federal Grants and Contracts revenue of approximately $248.1 million, or 3.0percent, and offset by a significant increase in expenditures of $291.3 million. This change in the Federal Grants and Contracts revenue was mainly attributed to an increase in Medicaid funding ($224.1 million), offset by decreases of American Recovery and Reinvestment Act revenue ($1.7 million), unemployment insurance ($7.9 million), food and home energy assistance programs ($31.0 million), child and family assistance ($20.2 million), and education grants ($8.4 million). The remaining difference is distributed over many other federal programs. Net other financing sources and uses experienced a smaller decrease of $3.0million, or 12.9 percent, primarily attributable to higher transfers in from other funds.
The Literary Fund ending balance decreased by $61.7 million, or 54.8 percent. As discussed in Note 2, the beginning balance was restated to reflect a change in investment liquidation management strategy that increased the amounts available to the fund. Additionally, expenditures exceeded net receipts by $67.6 million. The loans of $193.9 million owed to the Virginia Public School Authority (major component unit) increased by $8.0 million or 4.3 percent.
Capital Asset and Long-term Debt
Capital Assets. The primary government’s investment in capital assets for its governmental and business-type activities as of June 30, 2016, amounts to $30.5 billion (net of accumulated depreciation totaling $17.5 billion). This investment in capital assets includes land, buildings, improvements, equipment, infrastructure, construction-in-progress, and intangible assets including water rights, easements, and software. Infrastructure assets are items that are normally immovable such as roads, bridges, drainage systems, and other similar assets. As noted on page 30, increases in capital assets and deferred outflows of resources offset byincreases in total liabilities and deferred inflows of resources resulted in an increase in net position of the governmental activities of $569.0 million, or 2.9 percent. The increase in the primary government’s net investment in capital assets was primarily attributable to increases in infrastructure of $611.8 million and construction-in-progress of $365.3 million. These changes are primarily attributable to transportation. The primary government reports equipment with a value of $50,000 or greater and an expected useful life of two or more years. The primary government capitalizes all land, buildings, infrastructure, and intangible assets that have a cost or value greater than $100,000 and an expected useful life of two or more years. Additional information on the primary government’s capital assets can be found in Note 12, Capital Assets.
Figure 16Capital Assets as of June 30, 2016
(Net of Depreciation)(Dollars in Thousands)
Land $ 3,101,588 $ 1,977 $ 3,103,565Buildings 2,552,870 17,032 2,569,902Equipment 482,496 11,307 493,803Water Rights/Easements 75,328 - 75,328Infrastructure 19,591,501 - 19,591,501Softw are 241,433 6,463 247,896Construction-in-Progress 4,370,171 1,540 4,371,711Total $ 30,415,387 $ 38,319 $ 30,453,706
TotalActivities ActivitiesGovernmental Business-type

36 Commonwealth of Virginia
Long-term Debt. The Commonwealth is prohibited from issuing general obligation bonds for operating purposes. At the end of the current fiscal year, the Commonwealth had total debt outstanding of $42.8 billion, including total tax-supported debt of $20.9billion and total debt not supported by taxes of $21.9 billion. Bonds backed by the full faith and credit of the government and tax-supported total $1.5 billion. Debt is considered tax-supported if Commonwealth tax revenues are used or pledged for debt service payments. An additional $907.2 million is considered moral obligation debt which is not tax-supported. The Commonwealth has no direct or indirect pledge of tax revenues to fund reserve deficiencies. However, in some cases, the Commonwealth has made amoral obligation pledge to consider funding deficiencies in debt service reserves that may occur. The remainder of the Commonwealth’s debt represents bonds secured solely by specified revenue sources (i.e., revenue bonds).
During fiscal year 2016, the Commonwealth issued $4.2 billion of new debt for various projects. Of this new debt, $409.0 millionwas for the primary government and $3.8 billion for the component units. Additional information on the Commonwealth’s outstanding debt can be found in Note 26, “Long-Term Liabilities,” as well as in the section entitled “Debt Schedules.” The Commonwealth maintains a “triple A” bond rating for general obligation debt from the three rating agencies: Moody’s InvestorsService; Standard & Poor’s Ratings Group, a division of The McGraw Hill Companies, Inc.; and Fitch, Inc.
State statutes limit the amount of general obligation debt the Commonwealth may issue for each specific type of debt. The 9(a) bonds, which may be issued to fund the defense of the Commonwealth; to meet casual deficits in revenue or in anticipation of the collection of revenues; or to redeem previous debt obligations, and are limited to 30.0 percent of 1.15 times the annual tax revenues for fiscal year 2016. The 9(b) bonds, which have been authorized by the citizens of Virginia through bond referenda to finance capital projects, are limited to 1.15 times the average of selected tax revenues for fiscal years 2014, 2015, and 2016. The 9(c) bonds, which have been issued to finance capital projects that will generate revenue upon their completion, are limited to 1.15 times the average of selected tax revenues for fiscal years 2014, 2015, and 2016. The current debt limitation for the Commonwealth is $5.9 billion, $18.3 billion, and $17.9 billion, respectively, for the 9(a), 9(b), and 9(c) general obligation bond issues. These limits significantly exceed the Commonwealth’s outstanding general obligation debt. Currently, there is no 9(a) debt outstanding.
Figure 17Outstanding Debt as of June 30, 2016
General Obligation Bonds(Dollars in Thousands)
General obligation bonds9(b) $ 571,915 $ - $ 571,915 $ -9(c) 29,717 - 29,717 877,118
Total $ 601,632 $ - $ 601,632 $ 877,118
ComponentUnits
Primary GovernmentGovernmental
ActivitiesBusiness-type
Activities Total

Commonwealth of Virginia 37
Economic Factors and Review
During fiscal year 2016, the Commonwealth’s economy continued to improve at a faster rate than at the national level. The Commonwealth experienced a higher job growth rate than at the national level (2.3 percent at the state level versus 1.9 percent nationally), closing the gap between the Commonwealth’s job growth rate and that of the nation during the last fiscal year. Personal income growth reached 4.1 percent during fiscal year 2016, compared to 4.8 percent in fiscal year 2015. During the fiscal year, the Commonwealth outpaced the nation (3.8 percent) in personal income growth for the first time since 2012. Unemployment in the Commonwealth and at the national level continued to decline during the fiscal year, reaching 4.1 percent and 5.0 percent,respectively. Total taxable sales growth in the Commonwealth experienced a slight decline from 3.9 percent to 3.2 percent compared to fiscal year 2015. Economic indicators show that during fiscal year 2016, the housing market in the Commonwealthimproved slightly to 7.6 percent compared to 5.5 percent in fiscal year 2015. Additionally, housing prices in the Commonwealthagain showed a positive change for fiscal year 2016, with an increase of approximately 3.6 percent, compared to just over 5.8percent at the national level. Many major economic indicators show that the Commonwealth outperformed the nation as a whole. Employment growth and higher salaries will continue to support consumer spending, which point toward continued moderate economic growth at both the state and national levels.
Requests for Information
This financial report is designed to provide a general overview of the Commonwealth’s finances for all those with an interest in the government’s finances. Questions concerning any of the information provided in this report or requests for additional financial information should be addressed to the State Comptroller’s Office, Commonwealth of Virginia, P. O. Box 1971, Richmond, Virginia23218. This report is also available for download at www.doa.virginia.gov.
The Commonwealth’s component units issue their own separate financial statements. Contact information regarding each component unit is provided in Note 1.B.

38 Commonwealth of Virginia

Commonwealth of Virginia 39
Government-wide Financial Statements

40 Commonwealth of Virginia
Statement of Net PositionJune 30, 2016(Dollars in Thousands)
Assets and Deferred Outflows of ResourcesCash and Cash Equivalents (Notes 1 and 6) $ 2,994,867 $ 1,332,604 $ 4,327,471 $ 2,349,757Investments (Notes 1 and 6) 1,662,537 2,485,156 4,147,693 10,576,028Receivables, Net (Notes 1 and 7) 3,265,849 437,717 3,703,566 15,670,066Contributions Receivable, Net (Notes 1 and 8) - - - 386,320Internal Balances (Note 1) 116,250 (116,250) - -Due from Primary Government (Note 9) - - - 87,387Due from Component Units (Note 9) 49,517 - 49,517 123,212Due from External Parties (Fiduciary Funds) (Note 9) 14,056 - 14,056 -Inventory (Note 1) 183,597 76,924 260,521 130,431Prepaid Items (Note 1) 111,625 4,233 115,858 155,098Other Assets (Notes 1 and 10) 4,835 210 5,045 103,316Loans Receivable from Primary Government (Notes 1 and 9) - - - 193,865Loans Receivable from Component Units (Notes 1 and 9) 18,905 - 18,905 -Restricted Cash and Cash Equivalents (Notes 6 and 11) 338,454 - 338,454 2,597,363Restricted Investments (Notes 6 and 11) - - - 5,277,186Other Restricted Assets (Note 11) - - - 270,474Nondepreciable Capital Assets (Notes 1 and 12) 7,869,828 3,517 7,873,345 2,519,470Depreciable Capital Assets, Net (Notes 1 and 12) 22,545,559 34,802 22,580,361 15,255,894
Total Assets 39,175,879 4,258,913 43,434,792 55,695,867
Deferred Outflows of Resources (Notes 1, 13, 14, and 15) 731,279 17,903 749,182 806,905Total Assets and Deferred Outf low s of Resources 39,907,158 4,276,816 44,183,974 56,502,772
Liabilities and Deferred Inflows of ResourcesAccounts Payable (Notes 1 and 24) 986,034 87,028 1,073,062 1,181,815Amounts Due to Other Governments 945,653 7,161 952,814 116,793Due to Primary Government (Note 9) - - - 49,517Due to Component Units (Note 9) 87,387 - 87,387 123,212Due to External Parties (Fiduciary Funds) (Note 9) 29,335 902 30,237 38,561Unearned Revenue (Note 1) 289,783 5,454 295,237 367,367Obligations Under Securities Lending Program (Notes 1 and 6) 30,374 36,308 66,682 3,864Other Liabilities (Notes 1, 14, and 25) 1,538,892 124,866 1,663,758 1,597,690Loans Payable to Primary Government (Notes 1 and 9) - - - 18,905Loans Payable to Component Units (Notes 1 and 9) 193,865 - 193,865 -Claims Payable (Notes 1 and 23):
Due Within One Year 198,369 46,558 244,927 90,466Due in More Than One Year 760,299 25,818 786,117 41,161
Long-term Liabilities (Notes 1, 21, 22, and 26):Due Within One Year 603,913 270,143 874,056 1,834,751Due in More Than One Year 11,554,083 2,076,357 13,630,440 26,472,284
Total Liabilities 17,217,987 2,680,595 19,898,582 31,936,386
Deferred Inflows of Resources (Notes 1, 13, 14, 15, and 36) 2,574,935 9,967 2,584,902 347,161Total Liabilities and Deferred Inflow s of Resources 19,792,922 2,690,562 22,483,484 32,283,547
TotalComponent
Units
Primary GovernmentGovernmental
ActivitiesBusiness-type
Activities
The accompanying notes are an integral part of this financial statement.

Commonwealth of Virginia 41
Net PositionNet Investment in Capital Assets 24,308,954 32,960 24,341,914 10,776,947Restricted For:
Nonexpendable:Higher Education - - - 3,364,043Permanent Funds 34,055 - 34,055 -Other - - - 161,771
Expendable:Agriculture and Forestry 1,379 - 1,379 -Bond Indenture - - - 2,825,966Capital Projects/Construction/Capital Acquisition 42 - 42 1,743,041Contract and Debt Administration 4,448 4,448Debt Service 21,752 - 21,752 67,816Economic and Technological Development 13 - 13 -Educational and Training Programs 8,633 - 8,633 -Environmental Quality and Natural Resource Preservation 16,567 - 16,567 -Gifts and Grants 147,063 - 147,063 139,393Health and Public Safety 73,733 - 73,733 -Higher Education - - - 5,606,819Literary Fund 73,267 - 73,267 -Lottery Proceeds Fund 62,086 - 62,086 -Permanent Funds 1,406 - 1,406 -Revenue Stabilization Fund 841,057 - 841,057 -Transportation Activities 73,022 - 73,022 -Unemployment Compensation Trust Fund - 1,044,558 1,044,558 -Virginia Pooled Investment Program - - - 7,749Virginia Water Supply Assistance Grant Fund 5,060 - 5,060 -Other 1,677 - 1,677 13,704
Unrestricted (5,559,978) 508,736 (5,051,242) (488,024)Total Net Position $ 20,114,236 $ 1,586,254 $ 21,700,490 $ 24,219,225
Activities Activities Total Units
Primary GovernmentGovernmental Business-type Component

42 Commonwealth of Virginia
Statement of ActivitiesFor the Fiscal Year Ended June 30, 2016(Dollars in Thousands)
Functions/ProgramsPrimary Government
Governmental ActivitiesGeneral Government $ 3,229,507 $ 306,100 $ 161,711 $ 8,943Education 10,178,231 563,206 840,018 9,773Transportation 4,528,605 675,270 59,968 1,436,884Resources and Economic Development 1,007,607 374,492 153,461 10,770Individual and Family Services 14,024,213 364,422 7,902,358 91Administration of Justice 2,921,635 284,226 29,891 466Interest and Charges on Long-term Debt 240,007 - - -Total Governmental Activities 36,129,805 2,567,716 9,147,407 1,466,927
Business-type ActivitiesVirginia Lottery 1,415,154 2,006,934 - -Virginia College Savings Plan 103,307 146,453 - -Unemployment Compensation 390,441 593,971 - -Alcoholic Beverage Control 614,641 771,521 430 -Risk Management 14,281 8,736 - -Local Choice Health Care 411,656 392,784 - -Route 460 Funding Corporation of Virginia 1,461 - - -Virginia Industries for the Blind 41,860 42,038 - -Consolidated Laboratory 10,016 9,484 - -eVA Procurement System 22,573 21,169 - -Department of Environmental Quality Title V 11,135 10,631 - -Wireless E-911 41,851 58,131 - -Museum and Library Gift Shops 6,676 6,774 - -Behavioral Health Canteen and Work Activity 451 437 - -Total Business-type Activities 3,085,503 4,069,063 430 -
Total Primary Government $ 39,215,308 $ 6,636,779 $ 9,147,837 $ 1,466,927
Component UnitsVirginia Housing Development Authority $ 402,477 $ 430,758 $ 123,589 $ -Virginia Public School Authority 133,226 133,372 8,236 -Virginia Resources Authority 154,788 148,047 - 50,857Virginia College Building Authority 745,625 71,730 42,363 472Nonmajor 14,484,951 9,956,107 2,012,681 682,829Total Component Units $ 15,921,067 $ 10,740,014 $ 2,186,869 $ 734,158
Program Revenues
ExpensesCharges for
Services
OperatingGrants and
Contributions
CapitalGrants and
Contributions
The accompanying notes are an integral part of this financial statement.

Commonwealth of Virginia 43
$ (2,752,753) $ - $ (2,752,753) $ -(8,765,234) - (8,765,234) -(2,356,483) - (2,356,483) -
(468,884) - (468,884) -(5,757,342) - (5,757,342) -(2,607,052) - (2,607,052) -
(240,007) - (240,007) -(22,947,755) - (22,947,755) -
- 591,780 591,780 -- 43,146 43,146 -- 203,530 203,530 -- 157,310 157,310 -- (5,545) (5,545) -- (18,872) (18,872) -- (1,461) (1,461) -- 178 178 -- (532) (532) -- (1,404) (1,404) -- (504) (504) -- 16,280 16,280 -- 98 98 -- (14) (14) -- 983,990 983,990 -
(22,947,755) 983,990 (21,963,765) -
- - - 151,870- - - 8,382- - - 44,116- - - (631,060)- - - (1,833,334)- - - (2,260,026)
ComponentUnits
Net (Expense) Revenue and Changes in Net PositionPrimary Government
GovernmentalActivities
Business-typeActivities Total
Continued on next page

44 Commonwealth of Virginia
Statement of Activities (Continued from previous page)For the Fiscal Year Ended June 30, 2016(Dollars in Thousands)
General RevenuesTaxes
Individual and Fiduciary Income 12,685,001 - 12,685,001 -Sales and Use 4,993,762 - 4,993,762 -Corporation Income 772,639 - 772,639 -Motor Fuel 975,851 - 975,851 -Motor Vehicle Sales and Use 909,617 - 909,617 -Communications Sales and Use 405,576 - 405,576 -Deeds, Contracts, Wills, and Suits 470,644 - 470,644 -Premiums of Insurance Companies 485,018 - 485,018 -Alcoholic Beverage Sales 147,813 - 147,813 -Tobacco Products 176,401 - 176,401 -Estate 175 - 175 -Public Service Corporations 108,158 - 108,158 -Beer and Beverage Excise 43,185 - 43,185 -Wine and Spirits/ABC Liter 26,442 - 26,442 -Bank Stock 17,796 - 17,796 -Other Taxes 118,288 9,141 127,429 -
Operating Appropriations from Primary Government - - - 2,221,096Unrestricted Grants and Contributions 48,031 - 48,031 91,256Investment Earnings 63,397 900 64,297 (55,113)Miscellaneous 281,562 175 281,737 111,452
Transfers 787,414 (787,414) - -Contributions to Permanent and Term Endow ments - - - 174,813
Total General Revenues, Transfers, and Contributions 23,516,770 (777,198) 22,739,572 2,543,504 Change in Net Position 569,015 206,792 775,807 283,478
Net Position, July 1, as restated (Note 2) 19,545,221 1,379,462 20,924,683 23,935,747Net Position, June 30 $ 20,114,236 $ 1,586,254 $ 21,700,490 $ 24,219,225
Activities Activities Total Units
Net (Expense) Revenue and Changes in Net PositionPrimary Government
Governmental Business-type Component
The accompanying notes are an integral part of this financial statement.

Commonwealth of Virginia 45
Governmental Funds
General Fund
The General Fund accounts for transactions related to resources received and used for those services traditionally provided by a state government, which are not accounted for in any other fund.
Special Revenue Funds
Special Revenue Funds account for specific revenue sources that are restricted or committed to finance particular functions and activities of the Commonwealth.
The Commonwealth Transportation Fund accounts for the revenues and expenditures associated with highway operations, maintenance, construction, and other transportation related activities. Funding for these programs is provided from highway user taxes, fees, and funds received from the federal government.
The Federal Trust Fund accounts for all federal dollars received by the Commonwealth except those received by the Commonwealth Transportation Fund, the Unemployment Compensation Fund, certain Medicaid reimbursements recorded in the General Fund, and institutions of higher education. The entire fund is restricted pursuant to federal regulations.
The Literary Fund accounts for revenues from fines, forfeitures, and proceeds from unclaimed property used primarily to support public education in the Commonwealth. This fund provides low interest loans to school divisions for construction, renovations, and expansion of school buildings.
Nonmajor Governmental Funds include those Special Revenue, Debt Service, Capital Projects, and Permanent Funds listed on page 203 in the Combining and Individual Fund Statements and Schedules section of this report.

46 Commonwealth of Virginia
Balance Sheet – Governmental FundsJune 30, 2016(Dollars in Thousands)
Assets and Deferred Outflows of ResourcesCash and Cash Equivalents (Notes 1 and 6) $ 17,079 $ 1,728,835 $ 144,715 $ 96,374Investments (Notes 1 and 6) 1,589,202 - 18,719 -Receivables, Net (Notes 1 and 7) 1,760,362 454,102 811,496 171,583Due from Other Funds (Note 9) 77,181 - 2,762 -Due from External Parties (Fiduciary Funds) (Note 9) 1 - - -Interfund Receivable (Note 9) - - - -Inventory (Note 1) 41,325 85,918 32,582 -Prepaid Items (Note 1) 73,040 12,288 2,643 -Other Assets (Notes 1 and 10) 809 415 1,867 -Loans Receivable from Component Units (Notes 1 and 9) - - - -Restricted Cash and Cash Equivalents (Notes 6 and 11) - 265,472 - -Total Assets 3,558,999 2,547,030 1,014,784 267,957
Deferred Outflows of Resources (Notes 1 and 13) - - - -Total Assets and Deferred Outf low s of Resources $ 3,558,999 $ 2,547,030 $ 1,014,784 $ 267,957
Liabilities, Deferred Inflows of Resources, and Fund BalancesAccounts Payable (Notes 1 and 24) $ 269,179 $ 356,786 $ 75,296 $ 2Amounts Due to Other Governments 464,889 54,117 277,359 -Due to Other Funds (Note 9) 29,522 11,062 9,647 -Due to Component Units (Note 9) 4,136 - 3,955 -Due to External Parties (Fiduciary Funds) (Note 9) 18,559 5,020 2,627 -Interfund Payable (Note 9) - - 23,135 -Unearned Revenue (Note 1) - 127,186 39,341 -Obligations Under Securities Lending Program (Notes 1 and 6) 16,046 9,502 298 823Other Liabilities (Notes 1 and 25) 1,077,264 5,683 368,555 -Loans Payable to Component Units (Notes 1 and 9) - - - 193,865Long-term Liabilities Due Within One Year (Notes 1, 21, and 26) 1,297 238 116 -Total Liabilities 1,880,892 569,594 800,329 194,690
Deferred Inflows of Resources (Notes 1 and 13) 967,818 49,020 85,467 22,452Total Liabilities and Deferred Inflow s of Resources 2,848,710 618,614 885,796 217,142
Fund Balances (Note 3): Nonspendable 114,365 98,206 35,225 - Restricted 908,203 331,096 93,763 50,815 Committed 397,011 1,498,607 - - Assigned - 507 - - Unassigned (709,290) - - -Total Fund Balances 710,289 1,928,416 128,988 50,815Total Liabilities, Deferred Inflow s of Resources, and Fund Balances $ 3,558,999 $ 2,547,030 $ 1,014,784 $ 267,957
TrustTransportation
Special Revenue
GeneralCommonwealth Federal
Literary
The accompanying notes are an integral part of this financial statement.

Commonwealth of Virginia 47
$ 637,774 $ 2,624,77754,616 1,662,53758,629 3,256,1726,822 86,765
168 169157,909 157,909
5,045 164,87020,272 108,2431,714 4,805
18,905 18,905- 265,472
961,854 8,350,624
- -$ 961,854 $ 8,350,624
$ 57,069 $ 758,3322,720 799,0855,050 55,281
39 8,1302,738 28,944
- 23,1356,984 173,5111,743 28,4124,905 1,456,407
- 193,865207 1,858
81,455 3,526,960
26,971 1,151,728108,426 4,678,688
59,316 307,112169,725 1,553,602595,632 2,491,25028,755 29,262
- (709,290)853,428 3,671,936
$ 961,854 $ 8,350,624
TotalGovernmental
FundsFundsGovernmental
Nonmajor

48 Commonwealth of Virginia
Reconciliation of the Balance Sheet – Governmental Funds to the Government-wide Statement of Net PositionJune 30, 2016(Dollars in Thousands)
Total fund balances - governmental funds (see Balance Sheet - Governmental Funds) $ 3,671,936
When capital assets (land, buildings, equipment, construction-in-progress, intangible assets, and/or infrastructure) that are to be used in governmental activities are purchased or constructed, the costs of those assets are reported as expenditures in governmental funds. How ever, the Statement of Net Position includes those capital assets among the assets of the primary government as a w hole.
Nondepreciable Capital Assets 7,801,473Depreciable Capital Assets 22,459,059
Deferred outf low s associated w ith pension related costs are long-term in nature and therefore not reported in the funds. 648,888Deferred outf low s associated w ith loss on debt refundings are long-term in nature and therefore not reported in the funds. 75,896
Long-term liabilities applicable to the primary government's governmental activities are not due and payable in the current period and, accordingly, are not reported as fund liabilities. All liabilities, both current and long-term, are reported in the Statement of Net Position. Pension Liability (4,353,417) OPEB Liability (723,233) Capital Leases (27,768) Installment Purchases (78,125) Compensated Absences (310,611) Uninsured Employer's Fund (29,311) Bonds (6,428,430) Notes (114) Accrued Interest Payable (81,267) Other Obligations (63,059) Pollution Remediation Liability (11,308)
Internal service funds are used by the primary government to charge costs to individual funds. The assets and liabilities of internal service funds are included in governmental activities in the Statement of Net Position. (685,722)
Other long-term payables are not due and payable in the current period and, therefore, are not reported in the funds. (333,264)
Other long-term assets are not available to pay for current period expenditures and, therefore, are deferred in the funds. 1,151,728
Deferred inflow s associated w ith Service Concession Arrangements are long-term in nature and therefore not reported in the funds. (2,142,066)
Deferred inflow s associated w ith pension related costs are long-term in nature and therefore not reported in the funds. (427,049)
Net position of governmental activities (see Government-w ide Statement of Net Position) $ 20,114,236
The accompanying notes are an integral part of this financial statement.

Commonwealth of Virginia 49

50 Commonwealth of Virginia
Statement of Revenues, Expenditures, and Changes in Fund Balances – Governmental FundsFor the Fiscal Year Ended June 30, 2016(Dollars in Thousands)
RevenuesTaxes $ 18,711,531 $ 3,505,086 $ - $ -Rights and Privileges 84,736 567,331 - 564Institutional Revenue 37,276 - - -Interest, Dividends, Rents, and Other Investment Income 87,384 18,780 591 11,811Federal Grants and Contracts 3,901 1,238,169 8,642,784 -Other (Note 27) 554,450 204,554 185,838 158,830Total Revenues 19,479,278 5,533,920 8,829,213 171,205
ExpendituresCurrent:General Government 2,498,952 54,119 115,474 9Education 8,095,809 1,045 1,013,019 238,805Transportation 328 5,795,286 14,600 -Resources and Economic Development 413,492 12,181 148,777 -Individual and Family Services 6,271,670 - 7,452,074 -Administration of Justice 2,681,754 9,771 42,247 -Capital Outlay 29,085 29,631 14,464 -Debt Service:Principal Retirement - - - -Interest and Charges - - - -Total Expenditures 19,991,090 5,902,033 8,800,655 238,814Revenues Over (Under) Expenditures (511,812) (368,113) 28,558 (67,609)
Other Financing Sources (Uses)Transfers In (Note 31) 834,957 109,015 7,015 5,902Transfers Out (Note 31) (464,559) (340,028) (27,666) -Notes Issued 476 - - -Insurance Recoveries 116 24 23 -Capital Leases Issued 379 - 403 -Bonds Issued - 273,740 - -Premium on Debt Issuance - 27,236 - -Refunding Bonds Issued - - - -Sale of Capital Assets 2,376 6,741 - -Payment to Refunded Bond Escrow Agents - - - -Total Other Financing Sources (Uses) 373,745 76,728 (20,225) 5,902
Net Change in Fund Balances (138,067) (291,385) 8,333 (61,707)Fund Balance, July 1, as restated (Note 2) 848,356 2,219,801 120,655 112,522Fund Balance, June 30 $ 710,289 $ 1,928,416 $ 128,988 $ 50,815
TrustTransportation
Special Revenue
GeneralCommonwealth Federal
Literary
The accompanying notes are an integral part of this financial statement.

Commonwealth of Virginia 51
$ 79,093 $ 22,295,710324,983 977,614229,811 267,08715,434 134,000
- 9,884,854431,593 1,535,265
1,080,914 35,094,530
153,003 2,821,55724,369 9,373,0477,250 5,817,464
340,587 915,037462,693 14,186,43766,883 2,800,655
257,584 330,764
423,629 423,629281,632 281,632
2,017,630 36,950,222(936,716) (1,855,692)
716,310 1,673,199(51,520) (883,773)
3,586 4,062410 573185 967
- 273,74018,034 45,27075,825 75,8255,893 15,010
(93,315) (93,315)675,408 1,111,558
(261,308) (744,134)1,114,736 4,416,070
$ 853,428 $ 3,671,936
TotalGovernmental
FundsFundsGovernmental
Nonmajor

52 Commonwealth of Virginia
Reconciliation of the Statement of Revenues, Expenditures, and Changes inFund Balances – Governmental Funds to the Government-wide Statement of ActivitiesFor the Fiscal Year Ended June 30, 2016(Dollars in Thousands)
Net Change in fund balances - total government funds (See Statement of Revenues, Expenditures, and Changes in Fund Balances - Governmental Funds) $ (744,134)
When capital assets that are to be used in governmental activities are purchased or constructed, the resources expended for those assets are reported as expenditures in governmental funds. How ever, in the Statement of Activities, the cost of those assets is allocated over their estimated useful lives and reported as depreciation expense. As a result, fund balance decreases by the amount of f inancial resources expended, w hereas net position decreases by the amount of depreciation expense charged for the year.
Nondepreciable Capital Assets Constructed/Acquired 2,159,562 Nondepreciable Capital Assets Disposed (75,452) Depreciable Capital Assets Acquired 328,209 Depreciable Capital Assets Disposed (288,799) Depreciation Expense (1,074,438)
Debt proceeds provide current f inancial resources to governmental funds by issuing debt, w hich increases long-term debt in the Statement of Net Position.
Debt Issuance (273,740) Capital Lease Proceeds (967) Bond Premiums (45,270) Refunding Bonds Issued (75,825) Installment Purchase Proceeds (4,062)
Repayment of debt principal is an expenditure in the governmental funds, but the repayment reduces long-term debt in the Statement of Net Position.
Debt Service Fund Repayment of Debt Principal 423,629
Payment to Refunded Bond Escrow Agent is an expenditure in the governmental funds, but the refunding reduces long-term debt in the Statement of Net Position. 93,315
Revenues in the Statement of Activities that do not provide current f inancial resources are not reported as revenues in the funds. 61,154
Increases/decreases of expenses reported in the Statement of Activities that do not require the use of, or provide, current f inancial resources and, therefore, are not reported in the governmental funds.
Decrease in Pension Liability 136,588 Increase in OPEB Liability (79,564) Increase in Other Long-term Liabilities (14,225) Increase in Compensated Absences (6,652) Decrease in Interest Expense, Amortization of Long-term Debt premium and discounts, and Accrued Interest Liability 56,449 Decrease in Other Liabilities 71,006
Net Increase in Due to Component Units for Capital and Other Projects resulting from appropriation reductions or amounts due to Federal Governments for interest and rebate repayments, w hich are not reported as expenditures in the fund statements. (11,333)
Net revenue (expenses) of certain activities of internal service funds is reported w ithin governmental activities. (216,130)
Deferred inflow s and outf low s associated w ith pension costs are not included in the funds. 120,808
Amortization of deferred inflow s and outf low s associated w ith Service Concession Arrangements are not included in the funds. 28,886
Change in net position of governmental activities (See Government-w ide Statement of Activities) $ 569,015
The accompanying notes are an integral part of this financial statement.

Commonwealth of Virginia 53
Proprietary Funds
The Proprietary Funds account for operations that are financed and operated in a manner similar to private business enterprises. It is the intent that the cost of providing such goods or services will be recovered through user charges.
Major Enterprise Funds
The Virginia Lottery accounts for all receipts and expenses from the operations of the Virginia Lottery.
The Virginia College Savings Plan administers the Virginia529 prePAID Program, which is a defined benefit program that offers contracts, for actuarially determined amounts, that provide for full future tuition and mandatory fee payments at Virginia’s higher education institutions and differing payouts at private or out-of-state institutions. The fund accounts for the actuarially determined contributions and payments for approved expenses.
The Unemployment Compensation Fund administers the temporary partial income replacement payments to unemployed covered workers.
Nonmajor Enterprise Funds include those operations of state agencies which are listed on page 215 in the Combining and Individual Fund Statements and Schedules section of this report.
Internal Service Funds include those operations of state agencies which are listed on page 231 in the Combining and Individual Fund Statements and Schedules section of this report.

54 Commonwealth of Virginia
Statement of Fund Net Position – Proprietary FundsJune 30, 2016(Dollars in Thousands)
Business-type ActivitiesEnterprise Funds
Assets and Deferred Outflows of ResourcesCurrent Assets:
Cash and Cash Equivalents (Notes 1 and 6) $ 111,186 $ 77,210 $ 978,866 $ 165,342Investments (Notes 1 and 6) 13,422 - - -Receivables, Net (Notes 1 and 7) 63,070 62,944 108,078 51,620Due from Other Funds (Note 9) - - 494 808Due from External Parties (Fiduciary Funds) (Note 9) - - - -Due from Component Units (Note 9) - - - -Inventory (Note 1) 4,677 - - 72,247Prepaid Items (Note 1) 676 147 - 3,410Other Assets (Notes 1 and 10) 1 - - 209
Total Current Assets 193,032 140,301 1,087,438 293,636Noncurrent Assets:
Investments (Notes 1 and 6) 116,473 2,355,261 - -Receivables, Net (Notes 1 and 7) - 152,005 - -Nondepreciable Capital Assets (Notes 1 and 12) - - - 3,517Depreciable Capital Assets, Net (Notes 1 and 12) 7,007 8,702 - 19,093
Total Noncurrent Assets 123,480 2,515,968 - 22,610 Total Assets 316,512 2,656,269 1,087,438 316,246
Deferred Outflows of Resources (Notes 1, 13, 14, and 15) 4,454 1,833 - 11,616Total Assets and Deferred Outf low s of Resources 320,966 2,658,102 1,087,438 327,862
Liabilities and Deferred Inflows of ResourcesCurrent Liabilities:
Accounts Payable (Notes 1 and 24) 17,410 817 104 68,697Amounts Due to Other Governments - - 4,864 2,297Due to Other Funds (Note 9) 53,922 67 2,833 25,020Due to External Parties (Fiduciary Funds) (Note 9) 184 68 - 650Interfund Payable (Note 9) - - - 29,749Unearned Revenue (Note 1) 2,711 - - 2,743Obligations Under Securities Lending Program (Notes 1 and 6) 35,359 19 - 930Other Liabilities (Notes 1 and 25) 74,955 14,559 35,079 273Claims Payable Due Within One Year (Notes 1 and 23) - - - 46,558Long-term Liabilities Due Within One Year (Notes 1, 21, and 26) 14,635 251,221 - 4,287
Total Current Liabilities 199,176 266,751 42,880 181,204
Noncurrent Liabilities:Interfund Payable (Note 9) - - - -Claims Payable Due in More Than One Year (Notes 1 and 23) - - - 25,818Long-term Liabilities Due in More Than One Year (Notes 1, 21, and 26) 150,679 1,802,882 - 122,796
Total Noncurrent Liabilities 150,679 1,802,882 - 148,614 Total Liabilities 349,855 2,069,633 42,880 329,818
Deferred Inflows of Resources (Notes 1, 13, 14, and 15) 2,026 758 - 7,183Total Liabilities and Deferred Inflow s of Resources 351,881 2,070,391 42,880 337,001
Net PositionNet Investment in Capital Assets 7,007 3,343 - 22,610Restricted for Unemployment Compensation - - 1,044,558 -Unrestricted (37,922) 584,368 - (31,749)
Total Net Position (Deficit) (Note 4) $ (30,915) $ 587,711 $ 1,044,558 $ (9,139)
Some amounts reported for business-type activities in the Statementof Net Position are different because certain internal service fund assetsand liabilities are included in business-type activities. Net position of business-type activities
CompensationLottery NonmajorUnemployment
VirginiaCollegeSavings
PlanVirginia
The accompanying notes are an integral part of this financial statement.

Commonwealth of Virginia 55
$ 1,332,604 $ 443,07213,422 -
285,712 9,6771,302 50,970
- 13,887- 18,715
76,924 18,7274,233 3,382
210 13,0541,714,407 571,484
2,471,734 -152,005 -
3,517 68,35534,802 86,500
2,662,058 154,8554,376,465 726,339
17,903 6,4954,394,368 732,834
87,028 102,0297,161 981
81,842 1,914902 391
29,749 34,6795,454 116,272
36,308 1,962124,866 43346,558 198,369
270,143 8,850690,011 465,880
- 70,34625,818 760,299
2,076,357 122,1722,102,175 952,8172,792,186 1,418,697
9,967 5,8202,802,153 1,424,517
32,960 116,8631,044,558 -
514,697 (808,546)$ 1,592,215 $ (691,683)
(5,961)$ 1,586,254
ServiceInternal
FundsTotal
GovernmentalActivities
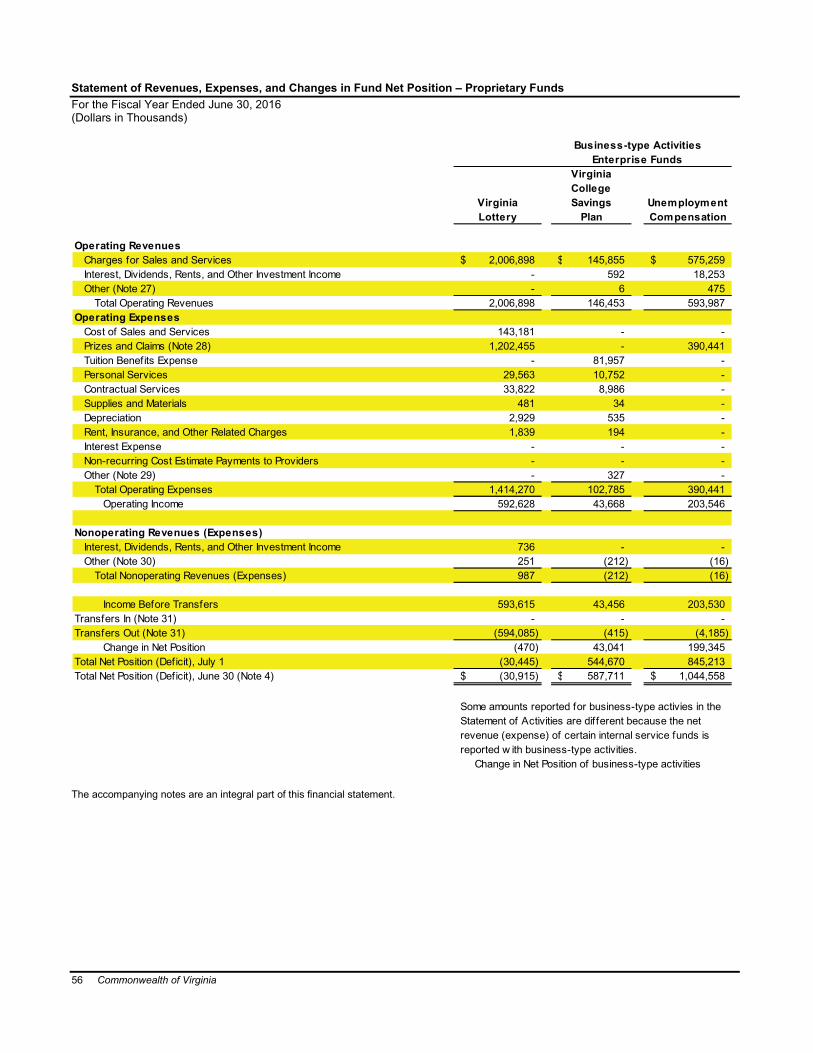
56 Commonwealth of Virginia
Statement of Revenues, Expenses, and Changes in Fund Net Position – Proprietary FundsFor the Fiscal Year Ended June 30, 2016(Dollars in Thousands)
Business-type ActivitiesEnterprise Funds
Operating RevenuesCharges for Sales and Services $ 2,006,898 $ 145,855 $ 575,259Interest, Dividends, Rents, and Other Investment Income - 592 18,253Other (Note 27) - 6 475
Total Operating Revenues 2,006,898 146,453 593,987Operating Expenses
Cost of Sales and Services 143,181 - -Prizes and Claims (Note 28) 1,202,455 - 390,441Tuition Benefits Expense - 81,957 -Personal Services 29,563 10,752 -Contractual Services 33,822 8,986 -Supplies and Materials 481 34 -Depreciation 2,929 535 -Rent, Insurance, and Other Related Charges 1,839 194 -Interest Expense - - -Non-recurring Cost Estimate Payments to Providers - - -Other (Note 29) - 327 -
Total Operating Expenses 1,414,270 102,785 390,441Operating Income 592,628 43,668 203,546
Nonoperating Revenues (Expenses)Interest, Dividends, Rents, and Other Investment Income 736 - -Other (Note 30) 251 (212) (16)
Total Nonoperating Revenues (Expenses) 987 (212) (16)
Income Before Transfers 593,615 43,456 203,530Transfers In (Note 31) - - -Transfers Out (Note 31) (594,085) (415) (4,185)
Change in Net Position (470) 43,041 199,345Total Net Position (Deficit), July 1 (30,445) 544,670 845,213Total Net Position (Deficit), June 30 (Note 4) $ (30,915) $ 587,711 $ 1,044,558
Some amounts reported for business-type activies in the Statement of Activities are different because the net revenue (expense) of certain internal service funds is reported w ith business-type activities. Change in Net Position of business-type activities
VirginiaLottery
VirginiaCollegeSavings
PlanUnemploymentCompensation
The accompanying notes are an integral part of this financial statement.
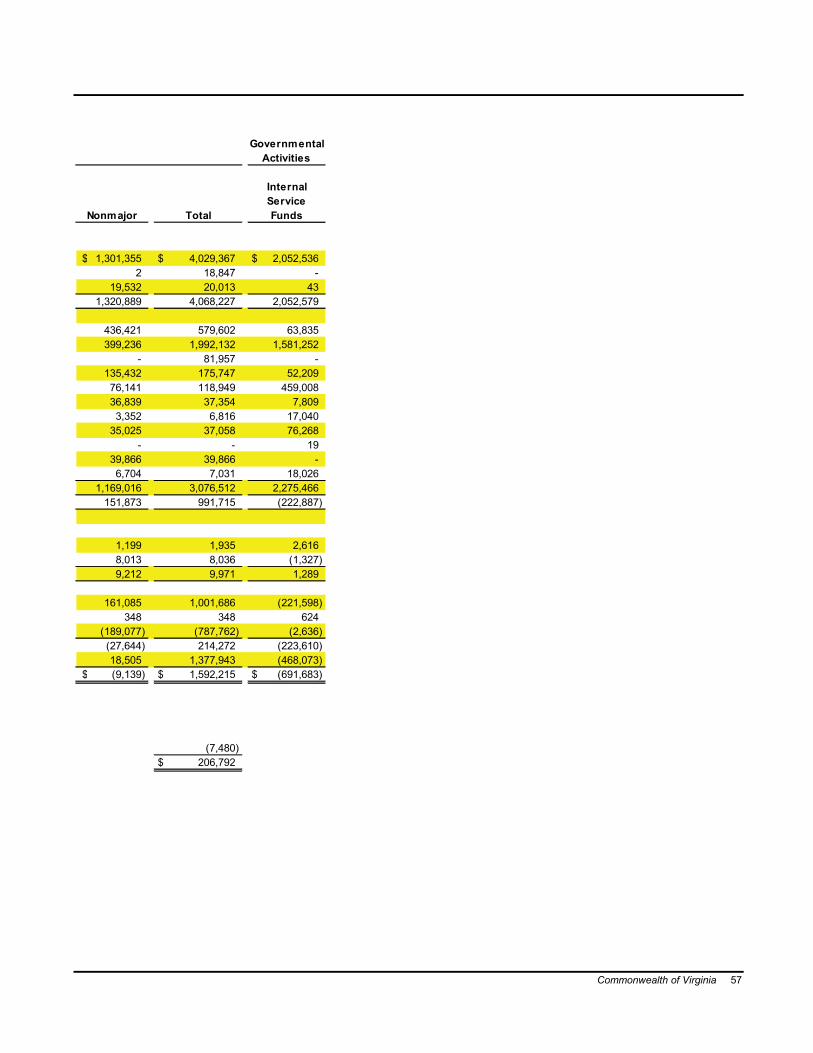
Commonwealth of Virginia 57
$ 1,301,355 $ 4,029,367 $ 2,052,5362 18,847 -
19,532 20,013 431,320,889 4,068,227 2,052,579
436,421 579,602 63,835399,236 1,992,132 1,581,252
- 81,957 -135,432 175,747 52,20976,141 118,949 459,00836,839 37,354 7,8093,352 6,816 17,040
35,025 37,058 76,268- - 19
39,866 39,866 -6,704 7,031 18,026
1,169,016 3,076,512 2,275,466151,873 991,715 (222,887)
1,199 1,935 2,6168,013 8,036 (1,327)9,212 9,971 1,289
161,085 1,001,686 (221,598)348 348 624
(189,077) (787,762) (2,636)(27,644) 214,272 (223,610)18,505 1,377,943 (468,073)
$ (9,139) $ 1,592,215 $ (691,683)
(7,480)$ 206,792
GovernmentalActivities
ServiceFunds
Internal
Nonmajor Total

58 Commonwealth of Virginia
Statement of Cash Flows – Proprietary FundsFor the Fiscal Year Ended June 30, 2016(Dollars in Thousands)
Business-type ActivitiesEnterprise Funds
Cash Flows from Operating ActivitiesReceipts for Sales and Services $ 2,016,916 $ 159,703 $ 602,767 $ 1,305,458Receipts from Investments - - 18,401 -Internal Activity-Receipts from Other Funds - 5 7,104 9,448Internal Activity-Payments to Other Funds - (336) - (2,980)Payments to Suppliers for Goods and Services (145,701) (482) - (492,375)Payments for Contractual Services (24,127) (9,001) - (74,789)Payments for Prizes, Claims, and Loss Control (Note 34) (1,209,781) - (407,866) (385,364)Payments for Tuition Benefits - (163,550) - -Payments to Employees (29,453) (10,342) - (135,334)Payments to Providers for Non-recurring Cost Estimates - - - (40,853)Payments for Interest - - - -Other Operating Revenue (Note 34) - - 92 5,721Other Operating Expense (Note 34) - (55) - (4,510)
Net Cash Provided by Operating Activities 607,854 (24,058) 220,498 184,422
Cash Flows from Noncapital Financing ActivitiesTransfers In from Other Funds - - - 348Transfers Out to Other Funds (544,854) (415) (4,279) (395,939)Other Noncapital Financing Receipt Activities (Note 34) 310 - 40 249,145Other Noncapital Financing Disbursement Activities (Note 34) - - - (31,289)
Net Cash Used for Noncapital Financing Activities (544,544) (415) (4,239) (177,735)
Cash Flows from Capital and Related Financing ActivitiesAcquisition of Capital Assets (3,436) (93) - (1,626)Payment of Principal and Interest on Bonds and Notes - (561) - (326,124)Proceeds from Sale of Capital Assets 4 - - 2Other Capital and Related Financing Receipt Activities (Note 34) - - - 165,862Other Capital and Related Financing Disbursement Activities (Note 34) - - - (730)
Net Cash Used for Capital and Related Financing Activities (3,432) (654) - (162,616)
Cash Flows from Investing ActivitiesPurchase of Investments (6,128) (1,166,643) - -Proceeds from Sales or Maturities of Investments 18,417 1,131,390 - 25,623Investment Income on Cash, Cash Equivalents, and Investments 678 54,220 - 1,239
Net Cash Provided by (Used for) Investing Activities 12,967 18,967 - 26,862Net Increase (Decrease) in Cash and Cash Equivalents 72,845 (6,160) 216,259 (129,067)
Cash and Cash Equivalents, July 1 2,983 83,351 762,607 293,688Cash and Cash Equivalents, June 30 $ 75,828 $ 77,191 $ 978,866 $ 164,621
Reconciliation of Cash and Cash Equivalents Per the Statement of Net Position: Cash and Cash Equivalents $ 111,186 $ 77,210 $ 978,866 $ 165,342 Cash and Travel Advances 1 - - 209 Less: Securities Lending Cash Equivalents (35,359) (19) - (930) Cash and Cash Equivalents per the Statement of Cash Flow s $ 75,828 $ 77,191 $ 978,866 $ 164,621
VirginiaLottery
VirginiaCollegeSavings
PlanUnemploymentCompensation Nonmajor
The accompanying notes are an integral part of this financial statement.
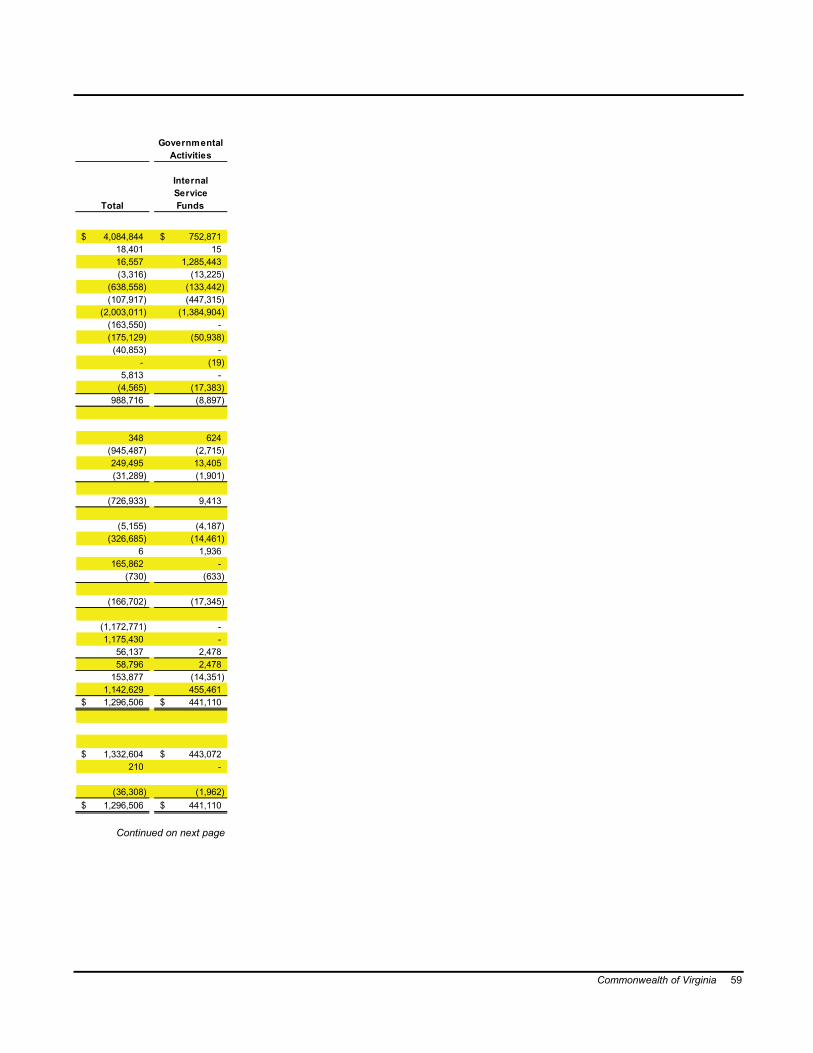
Commonwealth of Virginia 59
$ 4,084,844 $ 752,87118,401 1516,557 1,285,443(3,316) (13,225)
(638,558) (133,442)(107,917) (447,315)
(2,003,011) (1,384,904)(163,550) -(175,129) (50,938)(40,853) -
- (19)5,813 -
(4,565) (17,383)988,716 (8,897)
348 624(945,487) (2,715)249,495 13,405(31,289) (1,901)
(726,933) 9,413
(5,155) (4,187)(326,685) (14,461)
6 1,936165,862 -
(730) (633)
(166,702) (17,345)
(1,172,771) -1,175,430 -
56,137 2,47858,796 2,478
153,877 (14,351)1,142,629 455,461
$ 1,296,506 $ 441,110
$ 1,332,604 $ 443,072210 -
(36,308) (1,962)$ 1,296,506 $ 441,110
GovernmentalActivities
ServiceFunds
Internal
Total
Continued on next page

60 Commonwealth of Virginia
Statement of Cash Flows – Proprietary Funds (Continued from previous page)For the Fiscal Year Ended June 30, 2016(Dollars in Thousands)
Business-type ActivitiesEnterprise Funds
Reconciliation of Operating Income To Net Cash Provided by (Used for) Operating Activities:Operating Income (Loss) $ 592,628 $ 43,668 $ 203,546 $ 151,873Adjustments to Reconcile Operating Income to Net Cash Provided by (Used for) Operating Activities:Depreciation 2,929 535 - 3,352Interest, Dividends, Rents, and Other Investment Income (5,962) (592) - -Miscellaneous Nonoperating Income - - 37 248Other (196) 42 - 118Change in Assets, Deferred Outf low s of Resources, Liabilities, and Deferred Inflow s of Resources
(Increase) Decrease in Accounts Receivable 9,274 13,847 19,734 (1,019)(Increase) Decrease in Due from Other Funds - - 188 (74)(Increase) Decrease in Due from External Parties (Fiduciary Funds) - - - -(Increase) Decrease in Due from Component Units - - - -(Increase) Decrease in Other Assets - - - -(Increase) Decrease in Inventory (2,519) - - (6,315)(Increase) Decrease in Prepaid Items (11) 25 - (1,782)(Increase) Decrease in Deferred Outf low s of Resources (1,848) (766) - (2,001)Increase (Decrease) in Accounts Payable 5,445 (125) 27 22,808Increase (Decrease) in Amounts Due to Other Governments - - (291) 12Increase (Decrease) in Due to Other Funds 250 4 (159) 9,295Increase (Decrease) in Due to External Parties (Fiduciary Funds) 29 9 - 87Increase (Decrease) in Interfund Payables - - - (7,316)Increase (Decrease) in Unearned Revenue 744 - - 816Increase (Decrease) in Other Liabilities 10,861 (304) (2,584) (43)Increase (Decrease) in Claims Payable: Due Within One Year - - - 7,290Increase (Decrease) in Claims Payable: Due in More Than One Year - - - 3,975Increase (Decrease) in Long-term Liabilities: Due Within One Year (4,541) 11,322 - 275Increase (Decrease) in Long-term Liabilities: Due in More Than One Year 3,037 (90,900) - 11,138Increase (Decrease) in Deferred Inflow s of Resources (2,266) (823) - (8,315)
Net Cash Provided by (Used for) Operating Activities $ 607,854 $ (24,058) $ 220,498 $ 184,422
Noncash Investing, Capital, and Financing Activities:The follow ing transactions occurred prior to the Statement of Net Position date:Installment Purchases Used to Finance Capital Assets $ - $ - $ - $ -Change in Fair Value of Investments - (53,628) - -Capital Asset Addition Included in Accounts Payable - - - -
Total Noncash, Investing, Capital, and Financing Activities $ - $ (53,628) $ - $ -
Savings
VirginiaCollege
NonmajorVirginiaLottery Plan Compensation
Unemployment
The accompanying notes are an integral part of this financial statement.

Commonwealth of Virginia 61
$ 991,715 $ (222,887)
6,816 17,040(6,554) -
285 23(36) 80
41,836 (685)114 1,116
- (13,685)- 625- (1,995)
(8,834) (419)(1,768) 2,417(4,615) (1,022)28,155 22,148
(279) 929,390 (94)
125 48(7,316) -1,560 1297,930 (784)7,290 (2,866)3,975 192,1097,056 (668)
(76,725) 5,735(11,404) (5,354)
$ 988,716 $ (8,897)
$ - $ 9,183(53,628) -
- 111$ (53,628) $ 9,294
Service
GovernmentalActivities
Internal
Total Funds

62 Commonwealth of Virginia

Commonwealth of Virginia 63
Fiduciary Funds
Private Purpose Trust Funds
Private Purpose Trust Funds are trust arrangements that benefit individuals, private organizations, or other governments.
Pension and Other Employee Benefit Trust Funds
Pension and Other Employee Benefit Trust Funds reflect the activities of the retirement systems and postemployment benefits administered by the Virginia Retirement System or the Department of Human Resource Management.
Investment Trust Fund
Investment Trust Fund reflects the external portion of the Local Government Investment Pool sponsored by the Commonwealth.
Agency Funds
Agency Funds report those funds for which the Commonwealth acts solely in a custodial capacity.
A listing of all Fiduciary Funds is located on pages 240-241 in the Combining and Individual Fund Statements and Schedules section of this report. Combining financial statements for all Fiduciary Funds begin on page 242.

64 Commonwealth of Virginia
Statement of Fiduciary Net Position – Fiduciary FundsJune 30, 2016(Dollars in Thousands)
Assets and Deferred Outflows of ResourcesCash and Cash Equivalents (Notes 1 and 6) $ 182,763 $ 479,216 $ 1,964,139 $ 382,695Investments (Notes 1 and 6): Bonds and Mortgage Securities 96,932 20,812,431 130,284 - Stocks 252,349 21,229,198 - - Fixed Income Commingled Funds 1,156 1,179,229 - - Index and Pooled Funds 1,789,890 8,481,970 - - Real Estate 1,719 7,666,278 - - Private Equity - 9,053,853 - - Mutual and Money Market Funds 737,745 - - - Short-term Investments - 138,912 1,247,254 73,663 Hybrid Defined Contribution Investments - 73,913 - - Other 671,856 5,023,017 - 332,623 Total Investments 3,551,647 73,658,801 1,377,538 406,286Receivables, Net (Notes 1 and 7): Accounts 95 - - 57,008 Contributions - 236,774 - - Interest and Dividends 2,282 219,464 1,097 - Security Transactions - 1,211,865 - - Other Receivables 308 327,144 - - Total Receivables 2,685 1,995,247 1,097 57,008Due from Other Funds (Note 9) - 25 - -Due from Internal Parties (Governmental Funds and Business-type Activities) (Note 9) - 30,237 - -Due from Component Units (Note 9) - 38,561 - -Prepaid Items (Note 1) 57 - - -Other Assets (Notes 1 and 10) - - - 49Furniture and Equipment (Note 1) 946 32,097 - - Total Assets 3,738,098 76,234,184 3,342,774 846,038Deferred Outflows of Resources (Notes 1, 13, 14, and 15) 506 - - - Total Assets and Deferred Outf low s of Resources 3,738,604 76,234,184 3,342,774 846,038
Liabilities and Deferred Inflows of ResourcesAccounts Payable and Accrued Expenses (Notes 1 and 24) 2,082 44,721 - 6,900Amounts Due to Other Governments - - - 261,364Due to Other Funds (Note 9) 25 - - -Due to Internal Parties (Governmental Funds and Business-type Activities) (Note 9) 65 13,822 1 168Obligations Under Securities Lending Program (Notes 1 and 6) 32 5,023,020 - 150Other Liabilities (Notes 1 and 25) 4,656 385,398 - 577,311Retirement Benefits Payable - 334,817 - -Refunds Payable - 5,420 - -Compensated Absences Payable (Notes 1 and 21) 299 2,455 - -Insurance Premiums and Claims Payable - 64,856 - 145Payable for Security Transactions - 2,095,503 - -Net Pension Liability 3,674 - - -Other Postemployment Benefits (OPEB) Liability 669 - - - Total Liabilities 11,502 7,970,012 1 846,038Deferred Inflows of Resources (Notes 1, 13, 14, and 15) 258 - - - Total Liabilities and Deferred Inflow s of Resources 11,760 7,970,012 1 846,038
Net Position Restricted for Pensions/ Other Employment Benefits, Pool Participants, and Other Purposes $ 3,726,844 $ 68,264,172 $ 3,342,773 $ -
Pension
EmployeeBenefit
AgencyFunds
TrustFunds
TrustFund
Investment
Funds
PrivatePurpose
Trust
and Other
The accompanying notes are an integral part of this financial statement.

Commonwealth of Virginia 65
Statement of Changes in Fiduciary Net Position – Fiduciary FundsFor the Fiscal Year Ended June 30, 2016(Dollars in Thousands)
Additions:Investment Income: Interest, Dividends, and Other Investment Income $ 34,072 $ 1,576,024 $ 7,653 Distributions to Shareholders from Net Investment Income - - (7,653) Total Investment Income 34,072 1,576,024 - Less Investment Expenses 4,703 405,954 - Net Investment Income 29,369 1,170,070 -Proceeds from Unclaimed Property 88,488 - -Contributions: Participants 434,473 - - Member - 997,240 - Employer - 2,782,256 - Total Contributions 434,473 3,779,496 -Shares Sold - - 4,891,925Reinvested Distributions - - 7,657Other Revenue (Note 27) 19 2,458 - Total Additions 552,349 4,952,024 4,899,582Deductions:Loan Servicing Payments 22 - -Educational Expense Benefits 203,429 - -Retirement Benefits - 4,357,852 -Refunds to Former Members - 104,618 -Retiree Health Insurance Credits - 153,914 -Insurance Premiums and Claims 40,523 182,575 -Trust Payments 6,978 - -Administrative Expenses 7,428 43,167 -Other Expenses (Note 29) - 4,031 -Shares Redeemed 23,616 - 4,284,738Long-term Disability Benefits - 39,309 - Total Deductions 281,996 4,885,466 4,284,738Net Increase 270,353 66,558 614,844Net Position Restricted for Pensions/ Other Employment Benefits, Pool Participants, and Other PurposesJuly 1, as restated (Note 2) 3,456,491 68,197,614 2,727,929June 30 $ 3,726,844 $ 68,264,172 $ 3,342,773
and OtherPension
Benefit
Funds
PrivatePurpose
Trust
EmployeeInvestment
TrustFunds
TrustFund
The accompanying notes are an integral part of this financial statement.

66 Commonwealth of Virginia

Commonwealth of Virginia 67
Component Units
Component Units are organizations that are legally separate from the primary government. Each discrete component unit servesor benefits those outside of the primary government.
The Virginia Housing Development Authority provides investment in and stimulates construction of low to moderate income housing for the citizens of the Commonwealth.
The Virginia Public School Authority provides financing to cities and counties for capital construction of primary and secondary schools.
The Virginia Resources Authority provides financing for the construction of local water supply and wastewater treatment facilities and other local infrastructure projects.
The Virginia College Building Authority provides financing of capital projects and equipment purchases by state-supported colleges and universities.
Nonmajor Component Units include those listed on pages 264-265 in the Combining and Individual Fund Statements andSchedules section of this report.

68 Commonwealth of Virginia
Statement of Net Position – Component UnitsJune 30, 2016(Dollars in Thousands)
Assets and Deferred Outflows of ResourcesCash and Cash Equivalents (Notes 1 and 6) $ 3,294 $ 22,558 $ 10,719Investments (Notes 1 and 6) 7,475 - 4,549Receivables, Net (Notes 1 and 7) 6,419,226 3,465,326 4,422,487Contributions Receivable, Net (Notes 1 and 8) - - -Due from Primary Government (Note 9) - - -Due from Component Units (Note 9) - - -Inventory (Note 1) - - -Prepaid Items (Note 1) 3,010 - 46Other Assets (Notes 1 and 10) 13,952 - 299Loans Receivable from Primary Government (Notes 1 and 9) - 193,865 -Restricted Cash and Cash Equivalents (Notes 6 and 11) 1,024,267 174,220 292,597Restricted Investments (Notes 6 and 11) 504,898 - 394,132Other Restricted Assets (Note 11) 23,434 - -Nondepreciable Capital Assets (Notes 1 and 12) 3,531 - -Depreciable Capital Assets, Net (Notes 1 and 12) 21,845 - 103
Total Assets 8,024,932 3,855,969 5,124,932Deferred Outflows of Resources (Notes 1, 13, 14, and 15) - 138,112 83,101
Total Assets and Deferred Outf low s of Resources 8,024,932 3,994,081 5,208,033
Liabilities and Deferred Inflows of ResourcesAccounts Payable (Notes 1 and 24) 40,304 305 322Amounts Due to Other Governments - 111,032 -Due to Primary Government (Note 9) - - -Due to Component Units (Note 9) - - -Due to External Parties (Fiduciary Funds) (Note 9) - - -Unearned Revenue (Note 1) - - -Obligations Under Securities Lending Program (Notes 1 and 6) - - -Other Liabilities (Notes 1, 14 and 25) 497,967 55,802 42,009Loans Payable to Primary Government (Notes 1 and 9) - - -Claims Payable (Notes 1 and 23):
Due Within One Year - - -Due in More Than One Year - - -
Long-term Liabilities (Notes 1, 21, and 26):Due Within One Year 492,167 297,443 175,819Due in More Than One Year 4,002,551 3,552,336 3,435,931Total Liabilities 5,032,989 4,016,918 3,654,081
Deferred Inflows of Resources (Notes 1, 13, 14, 15, and 36) - - 26,808Total Liabilities and Deferred Inflow s of Resources 5,032,989 4,016,918 3,680,889
Net PositionNet Investment in Capital Assets 14,356 - 103Restricted For:
Nonexpendable:Higher Education - - -Other - - -
Expendable:Bond Indenture 2,825,966 - -Capital Projects/Construction/Capital Acquisition - - 1,504,353Debt Service - - -Gifts and Grants - - -Higher Education - - -Virginia Pooled Investment Program - - 7,749Other - - -
Unrestricted 151,621 (22,837) 14,939Total Net Position (Deficit) (Note 4) $ 2,991,943 $ (22,837) $ 1,527,144
VirginiaHousing
DevelopmentAuthority
VirginiaPublicSchool
Authority
VirginiaResourcesAuthority
The accompanying notes are an integral part of this financial statement.

Commonwealth of Virginia 69
$ 2,378 $ 2,310,808 $ 2,349,757- 10,564,004 10,576,028
24,252 1,338,775 15,670,066- 386,320 386,320
3,955 83,432 87,387- 123,212 123,212- 130,431 130,431- 152,042 155,098- 89,065 103,316- - 193,865
373,388 732,891 2,597,363- 4,378,156 5,277,186- 247,040 270,474- 2,515,939 2,519,470- 15,233,946 15,255,894
403,973 38,286,061 55,695,86727,544 558,148 806,905
431,517 38,844,209 56,502,772
- 1,140,884 1,181,815- 5,761 116,793- 49,517 49,517
119,987 3,225 123,212- 38,561 38,561- 367,367 367,367- 3,864 3,864
88,488 913,424 1,597,690- 18,905 18,905
- 90,466 90,466- 41,161 41,161
255,895 613,427 1,834,7513,793,165 11,688,301 26,472,2844,257,535 14,974,863 31,936,386
- 320,353 347,1614,257,535 15,295,216 32,283,547
- 10,762,488 10,776,947
- 3,364,043 3,364,043- 161,771 161,771
- - 2,825,966- 238,688 1,743,041- 67,816 67,816- 139,393 139,393
251,882 5,354,937 5,606,819- - 7,749- 13,704 13,704
(4,077,900) 3,446,153 (488,024)$ (3,826,018) $ 23,548,993 $ 24,219,225
Total
VirginiaCollegeBuilding
NonmajorComponent
UnitsAuthority

70 Commonwealth of Virginia
Statement of Activities – Component UnitsFor the Fiscal Year Ended June 30, 2016(Dollars in Thousands)
Program Revenues
Virginia Housing Development Authority $ 402,477 $ 430,758 $ 123,589 $ - $ 151,870Virginia Public School Authority 133,226 133,372 8,236 - 8,382Virginia Resources Authority 154,788 148,047 - 50,857 44,116Virginia College Building Authority 745,625 71,730 42,363 472 (631,060)
Total Major Component Units 1,436,116 783,907 174,188 51,329 (426,692)
Nonmajor Component Units:Higher Education 13,593,806 9,239,982 1,998,278 640,449 (1,715,097)Other 891,145 716,125 14,403 42,380 (118,237)
Total Nonmajor Component Units 14,484,951 9,956,107 2,012,681 682,829 (1,833,334)Total Component Units $ 15,921,067 $ 10,740,014 $ 2,186,869 $ 734,158 $ (2,260,026)
Grants and CapitalOperating
Grants andRevenueExpenses Services
Net (Expenses)Charges for(Note 1)
ContributionsContributions
The accompanying notes are an integral part of this financial statement.

Commonwealth of Virginia 71
$ - $ - $ 19,788 $ - $ - $ 171,658 $ 2,820,285 $ 2,991,943- - 334 246 - 8,962 (31,799) (22,837)- - - - - 44,116 1,483,028 1,527,144
318,431 - - - - (312,629) (3,513,389) (3,826,018)318,431 - 20,122 246 - (87,893) 758,125 670,232
1,783,496 71,296 (96,912) 103,205 158,500 304,488 21,146,432 21,450,920119,169 19,960 21,677 8,001 16,313 66,883 2,031,190 2,098,073
1,902,665 91,256 (75,235) 111,206 174,813 371,371 23,177,622 23,548,993$ 2,221,096 $ 91,256 $ (55,113) $ 111,452 $ 174,813 $ 283,478 $ 23,935,747 $ 24,219,225
Net Position(Deficit)July 1,June 30Change in
Appropriations Unrestricted
Net PositionGeneral RevenuesContributions
ContributionsInvestmentGrants and
MiscellaneousGovernment Earningsfrom Primary
(Note 4)Endowments (Note 2)Net Positionas restated
Operatingto Permanent
(Deficit)
and Term

72 Commonwealth of Virginia

Commonwealth of Virginia 73
Index to the Notes to the Financial Statements1. Summary of Significant Accounting Policies
A. Basis of Presentation.......................................... 74B. Reporting Entity .................................................. 74C. Government-wide and Fund Financial
Statements ...................................................... 81D. Measurement Focus, Basis of Accounting,
and Financial Statement Presentation ............. 81E. Budgetary Process ............................................. 83F. Cash, Cash Equivalents, Investments,
and Derivatives ................................................ 83G. Receivables ........................................................ 84H. Contributions Receivable, Net ............................ 84I. Internal Balances ................................................ 84J. Inventory ............................................................ 84K. Prepaid Items ..................................................... 85L. Interfund Loans Receivable/Payable .................. 85M. Other Assets....................................................... 85N. Capital Assets..................................................... 85O. Deferred Outflows of Resources......................... 86P. Accounts Payable ............................................... 86Q. Unearned Revenue............................................. 86R. Unearned Taxes ................................................. 86S. Obligations Under Securities Lending
Program........................................................... 86T. Other Liabilities................................................... 86U. Claims Payable................................................... 86V. Long-term Liabilities............................................ 86W. Deferred Inflows of Resources............................ 87X. Nonspendable Fund Balances............................ 87Y. Restricted Fund Balances................................... 87Z. Committed Fund Balances.................................. 87AA. Assigned Fund Balances .................................... 87BB. Unassigned Fund Balances ................................ 87CC. Cash Management Improvement Act.................. 87DD. Investment Income ............................................. 87EE. Intrafund Eliminations ......................................... 88FF. Interfund Activity ................................................. 88
2. Restatement of Beginning Balances .......................... 883. Net Position/Fund Balance Classifications ................. 904. Deficit Fund Balances/Net Position ............................ 925. Revenue Stabilization Fund ....................................... 926. Cash, Cash Equivalents, and Investments ................. 937. Receivables ..............................................................1048. Contributions Receivable, Net ...................................1069. Interfund and Inter-Entity Assets/Liabilities................106
10. Other Assets .............................................................11011. Restricted Assets ......................................................11112. Capital Assets ...........................................................11213. Deferred Outflows and Deferred Inflows
of Resources ..........................................................11514. Derivatives ................................................................11715. Retirement and Pension Systems
A. Administration....................................................125B. Summary of Significant Accounting
Policies (Virginia Retirement System).............125C. Plan Description ................................................126D. Funding Policy ...................................................127E. Changes in Net Pension Liability .......................127F. Changes to and Sensitivity of
Discount Rate .................................................129G. Pension Related Deferred Outflows
and Deferred Inflows.......................................130H. Defined Contribution Plan for
Political Appointees ........................................132
I. Defined Contribution Plan for PublicSchool Superintendents .................................132
J. Virginia Supplemental Retirement Plan .............132K. Higher Education (Nonmajor Component
Units)..............................................................132L. Other Component Units.....................................133
16. Other Employment Benefits ......................................13417. Other Postemployment Benefits (OPEB)
A. Virginia Retirement System (The System)Administered Plans.........................................135
B. Pre-Medicare Retiree Healthcare ......................136C. Annual OPEB Cost and Net OPEB
Obligation .......................................................136D. Funded Status and Funding Progress ...............138E. Higher Education (Nonmajor Component
Unit)................................................................139F. Other Component Units.....................................139
18. Deferred Compensation Plans ..................................13919. State Non-Arbitrage Pool ..........................................14020. Commitments
A. Construction Projects ........................................140B. Operating Leases ..............................................141C. Investment Commitments – Virginia
Retirement System.........................................141D. Virginia Transportation Infrastructure
Bank ...............................................................141E. Tobacco Grants.................................................142F. Other Commitments ..........................................142
21. Accrued Liability for Compensated Absences ...............................................................142
22. Pollution Remediation Obligations ............................14323. Insurance
A. Self-Insurance ...................................................143B. Public Entity Risk Pools.....................................144
24. Accounts Payable .....................................................14625. Other Liabilities .........................................................14726. Long-term Liabilities..................................................14927. Other Revenue..........................................................16528. Prizes and Claims .....................................................16629. Other Expenses ........................................................16630. Other Non-Operating Revenue/Expenses.................16731. Transfers...................................................................16832. On-Behalf Payments.................................................16933. Endowments .............................................................16934. Cash Flows – Additional Detailed
Information.............................................................17035. Tobacco Settlement and Securitization.....................17136. Service Concession Arrangements ...........................17237. Information Technology Infrastructure
Partnership – Northrop Grumman ..........................17338. Contingencies
A. Grants and Contracts ........................................174B. Litigation ...........................................................174C. Subject to Appropriation ....................................174D. Bailment Inventory.............................................174E. Loan Guarantees...............................................175F. Regional Wet Weather Management Plan.........175
39. Pending Governmental Accounting Standards Board Statement ...................................176
40. Subsequent Events...................................................176

74 Commonwealth of Virginia
Notes to the Financial StatementsJune 30, 2016
1. SUMMARY OF SIGNIFICANT ACCOUNTING POLICIES
A. Basis of Presentation
The accompanying financial statements have been prepared in conformance with accounting principles generally accepted in the United States of America as prescribed by the Governmental Accounting Standards Board (GASB) and the Financial Accounting Standards Board (FASB).
B. Reporting Entity
For financial reporting purposes, the Commonwealth of Virginia's (the Commonwealth’s) reporting entity consists of (1) the primary government, (2) component unit organizations for which the primary government is financially accountable (blended component units), and (3) other component unit organizations for which the nature and significance of their relationship with the primary government is such that exclusion would cause the reporting entity’s financial statements to be misleading, and they are financially accountable to the primary government (discrete component units). The funds of all agencies, boards, commissions, foundations, and authorities that have been identified as part of the primary government or a component unit have been included. GASB standards require the inclusion of numerous organizations that raise and hold funds for the direct benefit of the primary government.
Section 2100 of the GASB Codification of Governmental Accounting and Financial Reporting Standards (GASB Codification) describes the criteria for determining which organizations, functions, and activities should be considered part of the Commonwealth for financial reporting purposes. The basic criteria include appointing a voting majority of an organization’s governing body, and the Commonwealth’s ability to impose its will on that organization or the potential for the organization to provide specific financial benefits to, or impose specific financial burdens on, the Commonwealth. Additionally, in instances where the voting majority is not appointed, the above benefit/burden criteria apply. If the organization’s assets are also held for, or can be accessed by, the Commonwealth, the organization is considered part of the reporting entity.
(1) Primary Government – A primary government consists of all the organizations that make up its legal entity. All funds, organizations, institutions, agencies, and departments are, for financial reporting purposes, part of the primary government.
(2) Blended Component Units – Though legally separate entities, these component units are, in substance, part of the primary government’s operations. The blended component unitsserve or benefit the primary government almost exclusively. Financial information from these units is combined with that of the primary government. The Commonwealth’s blended component units are:
Virginia Public Building Authority (VPBA)(nonmajor governmental fund) – The Authority was created as a body politic and corporate and is fiscally independent. A government instrumentality, the Authority finances the acquisition and construction of buildings for the use of the Commonwealth and other approved purposes. The Governor appoints the 7-member board, and the primary government is able to impose its will on the Authority. The Auditor of Public Accounts audits the Authority, and a separate report is issued from the Department of the Treasury, Post Office Box 1879, Richmond, Virginia 23218-1879.
Route 460 Funding Corporation of Virginia(nonmajor enterprise) – The Corporation, a private, non-stock nonprofit corporation was created to develop, construct, and provide financing for the U.S. Route 460 Corridor Improvements Project. The Corporation was ablended component unit of the Virginia Department of Transportation (VDOT) (primary government) because it was fiscally dependent on the primary government, and there was afinancial benefit/burden relationship between the primary government and the Corporation. The corporate offices of the Corporation werelocated at VDOT, 1401 East Broad Street, Richmond, Virginia 23219. Dixon Hughes Goodman, LLP audited the Corporation, and a separate report is available from VDOT. The continuing operations of the Corporationceased during fiscal year 2016.
(3) Discrete Component Units – Discretely presented component units are reported in a separate column in the government-wide financial statements to emphasize that they are legally separate from the primary government. They are financially accountable to the primary government, or have relationships with the primary government such that exclusion would cause the reporting entity’s financial statements to be misleading. These discrete component units serve or benefit those outside of the primary government.
GASB statements generally require any organization that raises and holds economic

Commonwealth of Virginia 75
resources for the direct benefit of thesereporting entity to be reported as a component unit, even if the reporting entity is not financially accountable for the organization. The entities are included in the Commonwealth’s reporting entity as nonprofitcharitable organizations and exist solely to support the Commonwealth’s higher education institutions and certain state agencies. The higher education institution nonprofitorganizations are included in the applicable higher education institution’s column in the accompanying financial statements. In all instances where separate disclosure of these nonprofit organizations is required in the accompanying footnotes, the entities’ totals are aggregated and disclosed as “foundations.”
The criteria for reporting certain component units as major component units focuses on the nature and significance of the component unit’s relationship to the primary government versus other component units.
Discretely presented component units are:
Virginia Housing Development Authority (VHDA) (major) – The Authority was created as a political subdivision and instrumentality of the Commonwealth and is granted both politic and corporate powers by the Code of Virginia.The Governor appoints a majority of the Authority’s board members and the remaining board members are ex-officio. The Commonwealth may make grants to the Authority including, but not limited to, reserve funds, which is a potential financial benefit/burden to the primary government. The Commonwealth is not legally obligated by the debt of the Authority. The Authority was created in the public interest to provide investment in and stimulate construction of low to moderate income housing which benefits the citizens of the Commonwealth. The administrative offices of the Authority are located at 601 South Belvidere Street, Richmond, Virginia 23220. KPMG, LLP audits the Authority, and a separate report is issued.
Virginia Public School Authority (VPSA)(major) – The Authority was created as a public body corporate, and an agency and instrumentality of the Commonwealth to finance capital projects of city and county school boards. The Governor appoints the board members, who serve at his pleasure. Therefore, the primary government is able to impose its will on the Authority. The Auditor of Public Accounts audits the Authority, and a separate report is issued from the Department of the Treasury, Post Office Box 1879, Richmond, Virginia 23218-1879.
Virginia Resources Authority (VRA) (major) – The Authority was created as a public body corporate and a political subdivision of the Commonwealth to provide financing of infrastructure projects for water supply, wastewater, storm water, solid waste treatment, airports, public safety, brownfields remediation and redevelopment, and recycling. The Governor appoints the 11-member board and the Executive Director of the Authority. The primary government is able to impose its will on the Authority, and there is a financial benefit/burden to the primary government. The Commonwealth does not guarantee any bonds issued by the Virginia Resources Authority. The administrative offices of the Authority are located at 1111 East Main Street, Suite 1920, Richmond, Virginia 23219. Brown, Edwards and Company, LLP audits the Authority, and a separate report is issued.
Virginia College Building Authority (VCBA)(major) – The Authority was created as a public body corporate, a political subdivision, and an agency and instrumentality of the Commonwealth. The Governor appoints a majority of the board and members serve at his pleasure. Therefore, the primary government is able to impose its will on the Authority. The Authority finances certain capital projects and equipment purchases of state-supported colleges and universities. The Auditor of Public Accounts audits the Authority, and a separate report is issued from the Department of the Treasury, Post Office Box 1879, Richmond, Virginia 23218-1879.
Only the activity of the Authority that relates to the financing of capital projects and equipment purchases by state-supported colleges and universities is included in the accompanying financial statements. The state-supported colleges and universities reported revenue from the Authority of $468.3 million as Program Revenue Capital Grants and Contributions for the 21st Century Program and $71.2 million as Program Revenue Operating Grants and Contributions for equipment. The Authority reported Operating Appropriations from Primary Government of approximately $318.4million. In addition, the Authority reported approximately $30.0 million in payments from the state-supported colleges and universities for 21st Century and Equipment Program debt service costs and approximately $12.3 million in interest on Build America Bonds. The Authority assists private institutions of higher education in the financing and refinancing of a broad range of facilities. The Authority is authorized to issue obligations and lend the proceeds to private institutions; however, such financings or refinancings are not obligations of the primary government nor the Authority, but are payable solely from the revenues pledged by the respective private institution. This indebtedness, totaling $817.4 million, is not

76 Commonwealth of Virginia
included in the accompanying financial statements.
Higher Education Institutions (nonmajor) –The Commonwealth’s higher education institutions are granted broad corporate powers by state statutes. The Governor appoints the members of each institution’s board of trustees. In addition to the annual appropriations to support the institutions’ operations, the Commonwealth provides funding for, and construction of, major academic plant facilities for the institutions. Institutions reported Operating Appropriations from Primary Government of approximately $1.8 billion and Program Revenue Capital Grants and Contributions of approximately $96.9 million from the primary government.Therefore, there is a financial benefit/burden to the primary government. The higher education institutions are: the University of Virginia, including the University of Virginia Medical Center and the University of Virginia’s Collegeat Wise; Virginia Polytechnic Institute and State University; Virginia Commonwealth University, including the Virginia Commonwealth University Health System Authority, the College of William & Mary, including Richard Bland College and the Virginia Institute of Marine Science; Virginia Military Institute; Virginia State University; Norfolk State University; University of Mary Washington; James Madison University; Radford University; Old Dominion University; George Mason University; Virginia Community CollegeSystem; Christopher Newport University; and Longwood University. The Southwest Virginia Higher Education Center, Roanoke Higher Education Authority, Institute for Advanced Learning and Research, Southern Virginia Higher Education Center, and New CollegeInstitute are also included as higher education institutions. The colleges and universities are funded through state appropriations, tuition, federal grants, and private donations and grants. As previously noted, certain foundations are considered component units of the higher education institutions, and are included in the accompanying financial statements as well as the higher education institutions’ individually published financial statements. The Auditor of Public Accounts (APA) does not audit the Roanoke Higher Education Authority, the Institute for Advanced Learning and Research, and the component units of the higher education institutions, including foundations, but relies on the reports issued by other auditors to render her opinion.
The APA audits the colleges and universities, and individual reports are issued under separate cover. Complete financial statements for each institution may be obtained from their respective administrative offices. The addresses for these institutions may be obtained from the Department of Accounts,
101 North 14th Street, Richmond, Virginia 23219-3638.
Innovation and Entrepreneurship Investment Authority (IEIA) (nonmajor) – The Authority is granted corporate powers by the Code of Virginia. The Authority serves to facilitate the marketing, organization, and development of scientific research and technology by the state’s institutions of higher education and private industry in the Commonwealth. In addition, the Authority serves to promote the economic development of the Commonwealth by attracting and retaining high technology jobs and businesses in Virginia. The Governor and General Assembly appoint the 17-member board, and there is a financial benefit/burden to the primary government. The Authority’s combined financial statements include the accounts of the Center for Innovative Technology (CIT) and subsidiaries after elimination of all significant intercompany balances and transactions. CIT is a non-stock, not-for-profit corporation, which acts as the operating arm of the Authority. The address for the administrative offices of the Authority is CIT Building, Suite 600, 2214 Rock Hill Road, Herndon, Virginia 20170-4228. The Auditor of Public Accounts audits the Authority, and a separate report is issued.
Virginia Economic Development Partnership (VEDP) (nonmajor) – The Partnership was created as a body corporate and operates to encourage, stimulate, and support the development and expansion of commerce in the Commonwealth. The Governor appoints the 15-member board, and there is a financial benefit/burden to the primary government. The administrative offices are located at 901 East Cary Street, Suite 900, Richmond, Virginia 23219. The Auditor of Public Accounts audits the Partnership, and a separate report is issued.
Virginia Outdoors Foundation (nonmajor) –The Foundation was created as a body politic and is administratively assigned to the Department of Conservation and Recreation (part of primary government) and charged with promoting preservation through the acceptance of donated conservation easements and raising funds for the purchase of preservation land. The Governor appoints the 7-member board of trustees, and the primary government can impose its will on the Foundation. The administrative offices of the Foundation are located at 39 Garrett Street, Suite 200, Warrenton, VA 20186. Hicok, Fern & Company CPAs audits the Foundation, and a separate report is issued.

Commonwealth of Virginia 77
Virginia Port Authority (VPA) (nonmajor) –The Authority was established as a corporate body and operates to serve the citizens and promote commerce through the harbors and ports of Virginia. The Governor appoints a majority of the 12-member board, and the primary government is able to impose its will on the Authority. There is also a financial benefit/burden to the primary government. The administrative offices of the Authority are located at 701 Town Center Drive, Suite 900, Newport News, Virginia 23606. PBMares, LLP, audits the Authority, and a separate report is issued.
Virginia Tourism Authority (nonmajor) – The Authority was created as a public body corporate and as a political subdivision of the Commonwealth. The Authority encourages, stimulates, and promotes tourism and film production industries of the Commonwealth. The Governor appoints all of the board members, and there is a financial benefit/burden to the primary government. The administrative offices are located at 901 East Cary Street, Suite 900, Richmond, Virginia 23219. The Auditor of Public Accounts audits the Authority, and a separate report is issued.
Virginia Foundation for Healthy Youth (nonmajor) – The Foundation was created as a body corporate and as a political subdivision of the Commonwealth. The Foundation was established to determine the appropriate recipients of monies in the Virginia Tobacco Settlement Fund and to distribute monies in this fund for such efforts as restricting the use of tobacco products by minors and the enforcement of laws restricting the distribution of tobacco products to minors. The Governor appoints the majority of the board, and there is a financial benefit/burden to the primary government. The administrative offices are located at 701 East Franklin Street, Suite 500,Richmond, Virginia 23219. The Auditor of Public Accounts audits the Foundation, and a separate report is issued.
Tobacco Region Revitalization Commission(formerly Tobacco Indemnification and Revitalization Commission) (nonmajor) – The Commission was created as a body corporate and as a political subdivision of the Commonwealth. The Commission was established to determine the appropriate recipients of the monies in the Tobacco Indemnification and Community Revitalization Fund. This fund is to provide payments to tobacco farmers as compensation for the adverse economic effects resulting from loss of investment in specialized tobacco equipment and barns, as well as lost tobacco production opportunities. It also provides monies to revitalize tobacco dependent communities. The Governor appoints the majority of the board, and there is a financial benefit/burden to the
primary government. The administrative offices are located at 701 East Franklin Street, Suite 501, Richmond, Virginia 23219. The Auditor of Public Accounts audits the Commission, and a separate report is issued.
Hampton Roads Sanitation District Commission (nonmajor) – The Commission was established as a political subdivision of the Commonwealth and a government instrumentality. The Commission, which is the governing board of the district, was granted corporate powers by the Code of Virginia. The Governor appoints the Commission members, who serve at his pleasure. Therefore, the primary government is able to impose its will on the Commission. The Commonwealth is not obligated by the debt of the Commission. The Commission was established to benefit the inhabitants of the district and operates a sewage system for 17 localities in the Chesapeake Bay area. The address for the administrative offices of the Commission is 1434 Air Rail Avenue, Virginia Beach, Virginia 23455. KPMG, LLP, audits the Commission, and a separate report is issued.
Virginia Biotechnology Research Partnership Authority (nonmajor) – The Authority is a legally separate, political subdivision of the Commonwealth created by the General Assembly to assist in the development of a biotechnology research park. The Governor appoints the board members of the Authority, and there is a potential financial benefit/burden to the primary government. The administrative offices of the Authority are located at 800 East Leigh Street, Richmond, Virginia 23219. The Auditor of Public Accounts audits the Authority, and a separate report is issued.
The Authority issued the 2002 Series, the 2013B Series, and the 2013A Series of revenue bonds for specific customers. The 2002 Series variable rate revenue bonds were for a facility built specifically for the United Network for Organ Sharing. The 2013B Series variable rate revenue bonds were for the Virginia Blood Services project. The 2013A Series variable rate revenue bonds were to assist the Institute for Transfusion Medicine (ITxM). The bonds are secured by a letter of credit and are payable solely from the payments made by the borrower under the loan agreement. None of these bonds constitutes a debt or pledge of the Authority or the Commonwealth. Accordingly, the bonds are not reported as liabilities in the accompanying financial statements.
Virginia Small Business Financing Authority (VSBFA) (nonmajor) – Section 2.2-2280 of the Code of Virginia established the Authority as a public body corporate and a political subdivision of the Commonwealth. The

78 Commonwealth of Virginia
Governor appoints the 11-member board, and the primary government is able to impose its will on the Authority. The Authority was created to assist small businesses in the Commonwealth in obtaining financing for new businesses or the expansion of existing businesses. The Authority can provide financial assistance to small businesses by providing loans, guarantees, insurance, and other assistance, thereby encouraging the investment of private capital in small businesses in the Commonwealth. The Authority can loan money to local governments as defined by the Code of Virginia for economic development purposes. The Authority also guarantees loans made to small businesses by banks. The administrative offices of the Authority are located at 101 North14th Street, 11th Floor, Richmond, Virginia 23218-0446. The Auditor of Public Accounts audits the Authority, and a separate report is issued.
The Authority has issued Industrial Development Revenue Bonds to provide financial assistance to private sector entities for the acquisition and construction of industrial and commercial facilities deemed to be in the public interest. The bonds are secured by the property financed and are payable solely from payments received on the underlying mortgage loans. Upon repayment of the bonds, ownership of the acquired facilities transfers to the private sector entity served by the bond issuance. Neither the Authority nor the Commonwealth is obligated in any manner for repayment of the bonds. Accordingly, the bonds are not reported as liabilities on the accompanying financial statements.
Virginia School for the Deaf and Blind Foundation (nonmajor) – The Foundation operates as a nonprofit educational and fundraising organization solely in connection with, and exclusively for the benefit of, the Virginia School for the Deaf and Blind (part of primary government). The Foundation uses a December 31 calendar year-end. The administrative offices are located at Post Office Box 2069, Staunton, Virginia 24402.
Science Museum of Virginia Foundation(nonmajor) – The Foundation is a non-stock, nonprofit corporation established to implement and fund programs, projects, and operations that are authorized and approved by the trustees of the Science Museum of Virginia (part of primary government). There is a financial benefit/burden relationship to the primary government, and the economic resources of the Foundation are entirely for the direct benefit of the Commonwealth and its citizens. The administrative offices of the Foundation are located at 2500 West Broad Street, Richmond, Virginia, 23220. Cherry
Bekaert, LLP, audits the Foundation, and a separate report is issued.
Virginia Commercial Space Flight Authority (VCSFA) (nonmajor) – The Authority is a legally separate political subdivision of the Commonwealth created by the General Assembly to facilitate and coordinate scientific and technological research and development and to promote the industrial and economic development of the Commonwealth. The Governor appoints the 9-member board and there is a potential financial benefit/burden to the primary government. The Commonwealth provided $26.0 million in bond offerings through the Virginia Public Building Authority (nonmajor) to the VCSFA in fiscal year 2009. The Commonwealth provided $25.6 million in capital contributions through a memorandum of understanding in September 2012. The Commonwealth provided an additional $10.0 million of capital contributions through a settlement agreement by and among the VCSFA, the Commonwealth, and Orbital Sciences Corporation to the VCSFA in January 2014. The Commonwealth approved the conversion of a $5.0 million interest-free note to repair Pad 0A into a grant in March 2015.The administrative offices of the Authority are located at 4111 Monarch Way, Suite 303,Norfolk, Virginia 23508. Dixon Hughes Goodman, LLP, audits the Authority, and a separate report is issued.
Danville Science Center, Inc. (nonmajor) –The Center is a nonprofit corporation formed for the purpose of implementing and funding those programs, projects and operations which are authorized and approved by the trustees of the Science Museum of Virginia (part of primary government). There is a financial benefit/burden to the primary government, and the economic resources of the Center are entirely for the direct benefit of the Commonwealth and its citizens. The administrative offices of the Center are located at 677 Craghead Street, Danville, Virginia 24541. Kania & Associates, LLP, audits the Center, and a separate report is issued.
Virginia Museum of Fine Arts Foundation(nonmajor) – The Foundation operates as a nonprofit corporation under the laws of Virginia to fund exhibitions, programs, and capital asset expansion to ensure that the Virginia Museum of Fine Arts (part of primary government) has the space and resources for art to help improve the quality of life for many. There is a financial benefit/burden to the primary government, and the economic resources of the Foundation are entirely for the direct benefit of the Commonwealth and its citizens. The administrative offices of the Foundation are located at 200 North Boulevard, Richmond, Virginia 23220. Dixon Hughes Goodman, LLP,

Commonwealth of Virginia 79
audits the Foundation, and a separate report is issued.
A. L. Philpott Manufacturing Extension Partnership (nonmajor) – The Partnership has the mission to foster economic growth by enhancing the competitiveness of Virginia's manufacturers. The Partnership provides manufacturing firms with fee-based technology consulting services, access to business modernization resources, and support for interfirm collaboration. Further, the Partnership provides direct assistance to increase sales, decrease costs, and improve quality, productivity, and competitiveness. The Partnership has a 24-member board of trustees. The board consists of the presidents of two public four-year institutions of higher education; three community college presidents; one president of a private four-year institution of higher education; the director of Virginia's Center for Innovative Technology; Virginia's Secretary of Commerce and Trade; Virginia's Secretary of Technology; and 15 citizen members, representing manufacturing industries, appointed by the Governor. There is also a financial benefit/burden to the primary government. The administrative office is located at 32 Bridge Street South, Suite 200B,Martinsville, VA 24112-6216. The Auditor of Public Accounts audits the Partnership, and a separate report is issued.
Virginia University Research Partnership(nonmajor) – The Partnership was created as a nonprofit, non-stock corporation to receive grant monies appropriated by the General Assembly. The Partnership oversaw the administration of those grant payments for use by a nonprofit, public benefit research institute that conducted research and development for government agencies, commercial businesses, foundations, and other organizations. Due to the primary government being the sole source of funding, it was able to impose its will on the Partnership. The administrative offices werelocated at 901 East Byrd Street, Post Office Box 798, Richmond, Virginia 23218-0798. The Partnership ceased operations during fiscalyear 2016.
Fort Monroe Authority (nonmajor) – The Authority is a legally separate, political subdivision of the Commonwealth created by the General Assembly to assist in formulating a reuse plan for Fort Monroe. The Governor appoints a majority of the 17-member board,and there is a potential financial benefit/burden to the primary government. The administrative offices of the Authority are located at 20 Ingalls Road, Fort Monroe, Virginia 23651. Cherry Bekaert, LLP, audits the Authority, and a separate report is issued.
Assistive Technology Loan Fund Authority (nonmajor) – The Authority was
created as a political subdivision and public body corporate by the Code of Virginia. TheGovernor appoints the board of directors as directed by the Code and the primary government is able to impose its will on the Authority. The Authority manages a fund to provide loans to individuals to acquire assistive technology, other equipment, or other authorized purposes designed to help disabled individuals become more independent. The administrative offices are located at 1602 Rolling Hills Drive, Suite 107, Richmond,Virginia 23229. The Auditor of Public Accounts audits the Authority, and a separate report is issued.
Virginia Sesquicentennial of the American Civil War Foundation (nonmajor) – The Foundation was established to prepare for and commemorate the sesquicentennial of Virginia's participation in the American Civil War. The Foundation was formed under the Virginia Nonstock Corporation Act. The economic resources received or held by the Foundation are entirely, or almost entirely, for the direct benefit of the primary government. The administrative offices are located at the General Assembly Building, 2nd Floor, 201 North 9th Street, Richmond, VA 23219. Brown, Edwards & Company, LLP, audits the Foundation, and a separate report is issued.
Virginia Land Conservation Foundation(nonmajor) – The Foundation was created as a body politic and corporate to serve the Department of Conservation and Recreation (part of primary government) by acquiring interests in preservation land and providing grants to other entities to acquire interests in preservation land. The Governor appoints the 18-member board, and the primary government can impose its will on the Foundation. The administrative offices of the Foundation are located at 600 East Main Street, 24th Floor, Richmond, VA 23219. The Auditor of Public Accounts audits the Foundation as part of the Department of Conservation and Recreation (part of primary government) and discloses its existence in that report.
Virginia Arts Foundation (nonmajor) – The Foundation was created as a body politic and corporate to serve the Virginia Commission for the Arts (part of primary government) by promoting the arts in the Commonwealth. The Governor appoints the board of trustees for the Virginia Commission for the Arts, which also serves as the board for the Virginia Arts Foundation. The Director of the Virginia Commission for the Arts serves as the board chairman. In addition, the primary government can impose its will on the Foundation. The administrative offices of the Foundation are located at 1001 East Broad Street, Suite 330,Richmond, VA 23219. The Auditor of Public

80 Commonwealth of Virginia
Accounts audits the Foundation as part of theVirginia Commission for the Arts.
Library of Virginia Foundation (nonmajor) –The Foundation was created as a private, nonprofit 501(c)(3) corporation supporting the Library of Virginia (part of primary government). The Foundation was established upon receipt of a major bequest. The articles of incorporation stipulate that the Foundation shall at all times be operated solely in connection with, and exclusively for the benefit of, the Library of Virginia. The Foundation is governed by a separate board of directors, and promotes and supports the Library of Virginia in all activities. The administrative offices of the Foundation are located at 800 East Broad Street, Richmond, Virginia 23219. Frank Bercalow, CPA, P.L.L.C., audits the Foundation, and a separate report is issued.
Virginia Health Workforce Development Authority (nonmajor) – The Authority is a legally separate public body corporate and a political subdivision of the Commonwealth created by the General Assembly. The Authority facilitates the development of a statewide health professions pipeline. The Governor appoints a majority of the board members, and the primary government is able to impose its will on the Authority. The administrative offices of the Authority are located at 3831 Westerre Parkway, Suite 2, Henrico, VA 23233. The Auditor of Public Accounts audits the Authority, and a separate report is issued.
(4) Related Organizations – Organizations for which the primary government appoints a majority of the board, but is not financially accountable, are related organizations. Related organizations are:
Tobacco Settlement Financing Corporation – The Corporation was created by the Tobacco Settlement Financing Corporation Act, Chapters 482 and 488 of the Acts of the General Assembly during the 2002 General Assembly Session. The Corporation is a public body corporate entity and an independent instrumentality of the Commonwealth, managed by a 6-member board, including the State Treasurer. The Corporation purchased all of the future tobacco settlement revenue allocated to the Tobacco Region Community Revitalization Commission (formerly Tobacco Indemnification and Revitalization Commission) (nonmajorcomponent unit). Neither the Commonwealth’s nor the Virginia Foundation for Healthy Youth’s (nonmajor component unit) tobacco revenue was securitized. The administrative offices of the Corporation are located at 101 North 14th
Street, 3rd Floor, Post Office Box 1879,Richmond, Virginia 23218-1879. Brown,
Edwards, and Company, LLP audits the Corporation, and a separate report is issued.
Virginia Recreational Facilities Authority –The Authority was created as a political subdivision and instrumentality of the Commonwealth and given separate corporate powers by the Code of Virginia. The Governor appoints the 13-member board of directors. The Authority operates educational programs, tourism, and commerce in the Roanoke Valley. The address for the administrative offices of the Authority is 5204 Bernard Drive SW, Post Office Box 29800, Roanoke, Virginia 24018.Robinson, Farmer, Cox Associates audits the Authority and a separate report is issued.
Jamestown-Yorktown Foundation, Inc. –The nonprofit corporation was created by the Code of Virginia to assist the Jamestown-Yorktown Foundation (Foundation). The corporation board consists of five members selected from the Foundation’s board of trustees. Several Commonwealth officials serve as ex-officio members of the Foundation's board, and the Governor appoints 12 members. The Corporation’s basic activities consist of soliciting and collecting contributions, purchasing artifacts, sponsoring events and exhibits, and overseeing investments. The administrative offices of the Corporation are located at Post Office Box 3605, Williamsburg, Virginia 23187. Dixon Hughes Goodman, LLP, audits the Corporation, and a separate report is issued.
Jamestown-Yorktown Educational Trust –The Trust was created as a nonprofitcorporation by the Code of Virginia to assist the Jamestown-Yorktown Foundation (Foundation). The Trust board consists of six members selected from the Foundation's board of trustees. Several Commonwealth officials serve as ex-officio members of the Foundation's board, and the Governor appoints 12 members. The Trust operates the Jamestown Settlement and Yorktown Victory Centers' gift shops and café. The address for the administrative offices of the Trust is Post Office Box 3605, Williamsburg, Virginia 23187. Keiter Certified Public Accountants audits the Trust, and a separate report is issued.
Virginia Birth-Related Neurological Injury Compensation Program – The Program was created to provide a no-fault alternative for birth-related neurological injuries. The Governor appoints the 9-member board. The administrative offices of the Program are located at 7501 Boulders View Drive, Suite 210, Richmond, Virginia 23225. KPMG, LLP, audits the Program, and a separate report is issued.

Commonwealth of Virginia 81
Chesapeake Bay Bridge and Tunnel Commission – The Commission was created to establish policy and administer operations of the Chesapeake Bay Bridge Tunnel District. Any of the 11 members of the Commission appointed or reappointed on or after July 1, 1998, shall be appointed by the Governor, subject to confirmation by each house of the General Assembly. The administrative offices of the Commission are located at 32386 Lankford Highway, Cape Charles, Virginia 23310. KPMG, LLP, audits the Commission, and a separate report is issued.
C. Government-wide and Fund Financial Statements
The government-wide financial statements, the Statement of Net Position and the Statement of Activities, report information on all nonfiduciary activities of the primary government and component units. For the most part, the effect of interfund activity has been removed from these statements. Governmental activities, which are normally supported by taxes and intergovernmental revenues, are reported separately from business-type activities, which rely to a significant extent on fees and charges for support. Also, the primary government activity is reported separately from the legally separate component units for which the Commonwealth is financially accountable.
The Statement of Activities demonstrates the degree to which direct expenses of a specific function or segment are offset by program revenues. Direct expenses are those that are clearly identifiable with a specific function, segment, or component unit. In addition, to the extent that indirect costs are allocated to the various functions, the program expenses will include both direct and indirect costs. Program revenues include charges to customers who purchase, use, or directly benefit from goods or services provided by a given function, segment, or component unit, as well as investment income generated by operations. Program revenues also include grants, contributions, and investment income that are restricted to meeting the operational or capital requirements of a particular function, segment, or component unit. Taxes and other items properly excluded from program revenues are reported as general revenues.
Fund equity is restricted when constraints are placed on them that are imposed by external parties or constitutional provisions. When both restricted and unrestricted resources are available for use, the Commonwealth’s policy is to use the restricted resources first. Some institutions of higher education may follow a different policy. When committed, assigned, and unassigned resources are available for use, the Commonwealth’s policy is to use the committed resources first, assigned resources next, and unassigned resources last.
Separate financial statements are provided for governmental funds, proprietary funds, fiduciary funds, and component units. However, fiduciary funds are not included in the government-wide statements. Major governmental funds, enterprise funds, and component units are reported inseparate columns in the fund financial statements, with nonmajor funds being aggregated into a single column.
D. Measurement Focus, Basis of Accounting, and Financial Statement Presentation
Government-wide Financial Statements – The government-wide financial statements are reported using the economic resources measurement focus and the full accrual basis of accounting. Revenues are recorded when earned and expenses are recognized when a liability is incurred, regardless of the timing of related cash flows. Grants and similar items are recognized as revenue as soon as all eligibility requirements imposed by the provider have been met.
Governmental Fund Financial Statements – The governmental fund financial statements are reported using the current financial resources measurement focus and the modified accrual basis of accounting. Revenues are recognized as soon as they are both measurable and available. Revenues are considered to be available when they are collectible within the current period or soon enough thereafter to pay liabilities of the current period. For this purpose, the primary government considers revenues to be available if they are collected within 60 days of the end of the current fiscal year (or one year for Medicaid). Significant revenues subject to accrual include federal grants and income and sales taxes. Income tax revenues for tax underpayments are only recognized to the extent of the primary government’s estimated refunds for tax overpayments received. Revenues that the primary government earns by incurring obligations are recognized in the same period as when the obligations are recognized.
Expenditures generally are recorded when a liability is incurred, as under full accrual accounting. However, expenditures related to debt service, compensated absences, and claims and judgments are recorded only when the payment is due.
The primary government reports the following major governmental funds:
General Fund – Accounts for the transactions related to resources received and used for those services traditionally provided by a state government, and which are not accounted for in any other fund. These services include general government, legislative and judicial activities, public safety, health and behavioral health programs, resources and economic development, licensing and regulation, and primary and secondary education.

82 Commonwealth of Virginia
Commonwealth Transportation Special Revenue Fund – Accounts for the revenues and expenditures associated with highway operations, maintenance, construction, and other transportation related activities. Funding for these programs is received from highway user taxes, fees, and funds received from the federal government.
Federal Trust Special Revenue Fund –Accounts for all federal dollars received by the Commonwealth except those received by the Commonwealth Transportation Fund, the Unemployment Compensation Fund, certain Medicaid reimbursements recorded in the General Fund, and component units.
Literary Fund Special Revenue Fund –Accounts for revenues from fines, forfeitures, and proceeds from unclaimed property used primarily to support public education in the Commonwealth. This fund provides low interest loans to school divisions for construction, renovations, and expansion of school buildings.
Proprietary Funds, Fiduciary Funds, and Component Units Financial Statements – The financial statements of the proprietary funds, fiduciary funds, and component units are reported using the economic resources measurement focus and the full accrual basis of accounting. As with the government-wide statements, revenues are recorded when earned and expenses are recognized when a liability is incurred, regardless of the timing of related cash flows. Grants and similar items are recognized as revenue as soon as all eligibility requirements imposed by the provider have been met. Agency funds have no measurement focus since they only report assets and liabilities.
Proprietary funds distinguish operating revenues and expenses from nonoperating items. Operating revenues and expenses generally result from providing services and producing and delivering goods in connection with a proprietary fund’s principal ongoing operations. Revenues and expenses not meeting this definition are reported as nonoperating.
Foundations’ (component units) financial statements are prepared using the economic resources measurement focus and the full accrual basis of accounting. The financial statements are prepared under FASB rather than GASB standards. In some instances, activities of the foundations (component units) are reported separately within the footnotes because of the different reporting standards. Also, some foundations (component units) have a December 31st or March 31st year-end rather than a fiscal year-end. Foundations (component units) with different year-ends are included in these financial statements for the year ending December 31, 2015, or March 31, 2016.Significant intrafund activity/balances between each
higher education institution and their foundations have been eliminated.
The following amounts could not be eliminated due to the differing year-ends:
� University of Virginia (nonmajor component unit):o institution assets of $468,365o institution liabilities of $32,259o institution revenue of $8.2 milliono foundation assets of $952,323o foundation liabilities of $641,895o foundation expenses of $7.7 million
� Old Dominion University (nonmajor component unit):o institution liabilities of $59.6 milliono institution revenue of $1.6 milliono institution expenses of $636,555o foundation assets of $53.7 million
The primary government reports the following major enterprise funds:
Virginia Lottery Fund – Accounts for all receipts and expenses of the Virginia Lottery.
Virginia College Savings Plan Fund –Administers the Virginia529 prePAID Program.
Unemployment Compensation Fund –Accounts for receipts from employers and expenses incurred to provide benefits to eligible unemployed workers.
Additionally, the primary government reports the following fund types:
Governmental Fund Types:
Special Revenue Funds – Account for transactions related to resources received and used for restricted, committed, or specific purposes.
Debt Service Funds – Account for transactions related to resources retained and used for the payment of interest and principal on long-term obligations.
Capital Project Funds – Account for transactions related to resources received and used for the acquisition, construction, or improvement of capital facilities not reported in the other governmental or proprietary funds. The primary resource for these funds is the proceeds of bond issues and energy performance contracts. Principal uses are for construction and improvement of state office buildings, correctional and behavioral healthfacilities, and parks.

Commonwealth of Virginia 83
Permanent Funds – Account for transactions of the Commonwealth Health Research Fund and the Behavioral Health Endowment Funds whose principal must remain intact and whose income is used to benefit the Commonwealth’s citizens and behavioral health patients.
Proprietary Fund Types:
Enterprise Funds – Account for transactions related to resources received and used for financing self-supporting activities of the primary government that offer products and services on a user-charge basis to external users.
Internal Service Funds – Account for transactions related to the financing and sale of goods or services provided by the agencies of the primary government to other agencies and institutions of the Commonwealth. Activities include the provision of information technology, manufacturing activities, insurance programs, fleet services, facilities and property management, engineering and payroll services.
Fiduciary Fund Types:
Private Purpose Trust Funds – Account for transactions of all other trust arrangements in which the principal and income benefit individuals, private organizations, or other governments. These trusts include those for escheat property, educational savings plan, and others.
Pension and Other Employee Benefit Trust Funds – Account for transactions of the Commonwealth administered retirement systems and other employment benefits.
Investment Trust Fund – Accounts for the external portion of the Local Government Investment Pool that is sponsored by the Commonwealth.
Agency Funds – Account for amounts held in trust by the primary government for others. Agency funds include those funds established to account for the collection of taxes and fees for distribution to localities and other states, employee benefits, deposits of insurance carriers, child support collections and other miscellaneous accounts.
E. Budgetary Process
Budgetary amounts shown in the Required Supplementary Information and Combining and Individual Fund Statements and Schedules Sections represent the total of the original budgeted amounts and all supplemental appropriations. The Commonwealth's budget is prepared principally on a cash basis and represents appropriations as authorized by the General Assembly. Unexpended
appropriations at the end of the fiscal year generally lapse. However, they may be reappropriated for expenditure in the following fiscal year. The Governor, as required by the Code of Virginia,submits a budget composed of all proposed expenditures for the Commonwealth, and of estimated revenues and borrowing for a biennium, to the General Assembly. Budgets are adopted forthe General and Special Revenue Funds, except for the Literary Fund (major special revenue). Formal budgetary integration is not employed for the Capital Projects (nonmajor governmental), Debt Service (nonmajor governmental), Permanent Funds (nonmajor governmental), and the Literary (major special revenue) Funds because effective budgetary control is alternatively achieved through the General Fund and the remaining Special Revenue Funds.
The budget is prepared on a biennial basis; however, the budgets of the General and Special Revenue Funds contain separate appropriations for each year within the biennial budget, as approved by the General Assembly and signed into law by the Governor. For management control purposes, the budget is controlled at the program level. The Governor may transfer an appropriation within a state agency or from one state agency to another, provided that total fund appropriations, as contained within the budget, are not exceeded. Increases in General Fund appropriations must be approved by the General Assembly.
Appropriations for programs funded from Special Revenue Funds may allow expenditures in excess of the original appropriations to the extent that revenues of the funds exceed original budget estimates and such additional expenditures are approved by the Governor through supplemental appropriations.
F. Cash, Cash Equivalents, Investments, and Derivatives
Cash
In order to maximize the Commonwealth's earning potential, the majority of the primary government's cash balances are pooled together in the general account for investment purposes. The amounts required for operations are liquidated as needed. Since all amounts not required for operations are held in investment securities, it is possible that the cash balances could be negative due to timing differences in liquidating the investments.
As of June 30, 2016, the General Fund had a negative cash balance of $3.9 billion. In order to properly reflect the general account position, this negative cash balance has been eliminated in the accompanying statements and offset against the primary government's cash equivalents and investments (see Note 6).

84 Commonwealth of Virginia
Cash Equivalents
Cash equivalents are investments with an original maturity of 90 days or less.
Investments
Investments are principally comprised of monies held by component units, Pension and Other Employee Benefit Trust Funds, and monies held by the State Treasurer in both the general account and other fiduciary accounts.
Governmental and proprietary funds, both primary government and component units, report investments in money market and in the Commonwealth sponsored investment pools at amortized cost which approximates fair value. Additionally, the Virginia College Savings Plan Fund (major enterprise) reports certain investments at net asset value. All other investments are reported at fair value, in accordance with GASB Statement No. 31, Accounting and Financial Reporting for Certain Investments and for External Investment Pools, as amended by GASB Statement No. 72, Fair Value Measurement and Application.GASB Statement No. 72 provides guidance for determining fair value measurements using the level of fair value hierarchy and valuation techniques (see Note 6).
Investments administered by the Virginia Retire-ment System (the System) are reported at fair value, except for certain investments reported at net asset value. The cost of investments sold is the average cost of the aggregate holding of the specific investment sold. Investments in affiliated organizations are accounted for on the equity method of accounting and the System’s share of their earnings (losses) for the period is included in investment income using the equity method.
Investments of higher education institutions (nonmajor component units) are reported at fair value, except for money market investments and investments in the Commonwealth sponsored investment pools, which are reported at amortized cost.
Derivatives
Derivative instruments are financial contracts whose values depend on the values of one or more underlying assets, reference rates, or financial indexes (see Note 14).
G. Receivables
Receivables in the governmental funds consist primarily of the accrual of taxes, as well as receivables of the primary government's Medicaid program. Receivables in the proprietary funds consist primarily of tuition contribution receivables and unemployment compensation. Receivables of fiduciary funds are primarily the accrual of security transactions in the Pension and Other Employee Benefit Trust Funds. Receivables of the
component units consist primarily of mortgage receivables, loans receivable, local school bonds receivable, patient receivables, and student receivables. Receivables are recorded net of allowances for doubtful accounts (see Note 7).
H. Contributions Receivable, Net
Contributions Receivable reported by the foundations (component units) represents pledges or unconditional promises to give that have been discounted (see Note 8).
I. Internal Balances
Interfund receivables and payables have been eliminated from the Statement of Net Position,except for the residual amounts due between governmental and business-type activities (see Note 9).
J. Inventory
Inventories consist of materials and supplies and are reported as expenditures when consumed. These assets are classified as nonspendable fund balance. Inventories exceeding $1.0 million of the General and the Special Revenue Funds are maintained at cost using the first-in, first-out (FIFO) methodology, except for the following:
� Department of State Police (VSP)� Virginia Department of Transportation (VDOT)
VSP inventories are recorded in the General (major) and Other Special Revenue (nonmajor) Funds using the average cost methodology and are maintained at cost. VDOT inventories are recorded in the Commonwealth Transportation Fund (majorspecial revenue) using the FIFO and average cost methodologies and are maintained at either cost or average cost.
In addition to inventories maintained as stated above, the following agencies reported donated inventory balances on hand at June 30, 2016:
� Department of Corrections (VADOC)� Department of Behavioral Health and
Developmental Services (DBHDS)� Department of Health (VDH)� Department of Juvenile Justice (DJJ)� Department of Transportation (VDOT)
Inventories maintained by the Virginia Museum of Fine Arts (nonmajor enterprise fund), the Science Museum of Virginia (nonmajor enterprise fund), andthe Consolidated Laboratory (nonmajor enterprisefund) are stated at cost using FIFO.
Inventories maintained by the Department of Alcoholic Beverage Control (nonmajor enterprise fund) are stated at average cost using FIFO.

Commonwealth of Virginia 85
Inventories maintained by the Virginia Lottery (major enterprise fund) and the Virginia Industries for the Blind (nonmajor enterprise fund) are statedat cost using the average cost methodology.
Inventories maintained by Correctional Enterprises (internal service fund) are stated at the lower of cost or market using FIFO. Inventories maintained by the internal service funds except for Correctional Enterprises are stated at cost using FIFO.
Institutions of higher education (nonmajor component units) use several methods for inventory valuations, including cost using FIFO, the lower of cost or market using FIFO, or weighted average methods. Inventories maintained by the Virginia Port Authority (nonmajor component unit), the Hampton Roads Sanitation District Commission (nonmajor component unit), and the Danville Science Center (nonmajor component unit) are reported using the moving average unit cost methodology. Inventories at the gift shop run by the Library of Virginia Foundation (nonmajor component unit) are stated at lower of cost or market using FIFO.
K. Prepaid Items
Prepaid assets for rent, insurance, and similar items are recognized when purchased and expensed when used.
L. Interfund Loans Receivable/Payable
Loans Receivable/Payable represents working capital advances from one fund to another (see Note 9).
M. Other Assets
Other Assets include those balances of a miscellaneous nature that are not specifically classified elsewhere (see Note 10).
N. Capital Assets
Capital assets of governmental funds are recorded as expenditures at the time of purchase and capitalized in the governmental activities column of the Government-wide Statement of Net Position.Capital assets of the other funds and component units are capitalized in the fund in which they are utilized. All depreciable capital assets aredepreciated on the straight-line basis over their useful lives (see Note 12).
Capital assets are stated at historical cost or, in some instances, estimated historical cost. Donated capital assets from entities external to the reporting entity are stated at acquisition value at the time of donation. Asset transfers or donations from within the reporting entity are recorded at the carrying value of the transferring entity as required by GASB Statement No. 48, Sales and Pledges of Receivables and Future Revenues and Intra-Entity Transfers of Assets and Future Revenues. The
primary government capitalizes all equipment that has a cost or value greater than $50,000 and expected useful life of greater than two years. The primary government capitalizes all land, water rights/easements, buildings, infrastructure, and software that have a cost or value greater than $100,000 and an expected useful life of greater than two years. Selected agencies, business-type entities, and component units utilize a capitalization limit lower or higher than the primary government’s established thresholds for various reasons. Accordingly, reported capital assets may include some items that cost less than those thresholds. Infrastructure, including highways, bridges, and rights-of-way, is capitalized using the historical approach and includes any assets acquired prior to fiscal year 1980.
The primary government's capitalization policy regarding works of art/historical treasures is that capitalization is encouraged, but not required, for works of art/historical treasures that meet the following conditions:
� The collection is held for public exhibition, education, or research in furtherance of public service, rather than financial gain;
� The collection is protected, kept unencumbered, cared for and preserved; and,
� The collection is subject to an organizational policy that requires the proceeds from sales of collection items to be used to acquire other items for the collection.
The primary government capitalizes construction-in-progress when project expenditures, including construction of intangible assets, exceed $100,000. Interest incurred during construction is not capitalized in governmental funds. Interest incurred during the construction of proprietary fund assets is included in the capitalized value of the asset. The total interest cost incurred during the fiscal year was $3.7 million. None of the interest cost incurred this fiscal year was capitalized.
Expenditures are classified as construction-in-progress if:
(1) They extend the asset life, improve productivity, or improve the quality of service; and,
(2) They fall into the planning, acquisition, construction, improvement, renovation, repair, replacement, relocation, or demolition phase of the asset life.
The estimated lives of capital assets are as follows:
Years
Buildings 10–75Equipment 2–50Infrastructure 5–50Software 5–35

86 Commonwealth of Virginia
Selected agencies, business-type entities, and component units may utilize estimated lives and policies that differ from the above for various reasons.
O. Deferred Outflows of Resources
Deferred outflows of resources are a consumption of assets by the government that is applicable to a future reporting period. Deferred outflows have a natural debit balance and, therefore increase net position similar to assets (see Notes 13, 14, and 15).
P. Accounts Payable
Accounts payable represent amounts, including salaries and wages, owed for goods and services received prior to year-end. In accordance withGASB Statement No. 33, Accounting and Financial Reporting for Nonexchange Transactions, accounts payable also includes payments for nonexchangetransactions that met eligibility requirements prior to fiscal year-end (see Note 24).
Q. Unearned Revenue
Unearned revenue represents monies received or revenues accrued but not earned as of June 30, 2016. The majority of unearned revenue is reported by higher education institutions (nonmajor component units), where it is primarily composed of revenue for student tuition accrued in advance of the semester and advance payments on grants and contracts. In the special revenue funds, unearned revenue is composed primarily of prepaid toll revenue, contributions from localities and private sectors for highway construction projects, and multi-year vehicle registrations recorded in the Commonwealth Transportation Special Revenue Fund (major governmental). In the enterprise funds, a majority of unearned revenue represents online ticket monies received by the Virginia Lottery(major enterprise) for which corresponding drawings have not been held.
Unearned revenue in the internal service funds primarily represents unearned premiums in the Risk Management Fund; the transfer and purchase of assets for transition agencies, as well as advanced customer receipts in the Virginia Information Technologies Agency Fund; and prepaid rent and work orders in the Property Management Fund.
Unearned revenues in the other component units consist primarily of fees related to various activities.
R. Unearned Taxes
Unearned taxes represent income taxes related tothe period January through June 2016. This amount is the estimate to be refunded (overpayments by taxpayers) reduced by the estimate to be received (underpayments from taxpayers) that will be finalized when income tax returns are filed in subsequent years. Individual income tax estimated
overpayments total $857.6 million and estimated underpayments total $911.8 million. When underpayments exceed overpayments, revenue on the fund statements is only recognized to the extent of estimated overpayments. Since underpayments exceed overpayments for the individual income taxes, the unearned tax amount is zero for the fiscal year.
Corporate income tax estimated overpayments total $41.1 million and estimated underpayments total $58.3 million. When underpayments exceed overpayments, revenue on the fund statements is only recognized to the extent of estimated overpayments. Since underpayments exceed overpayments for the corporate income taxes, the unearned tax amount is zero for the fiscal year.
S. Obligations Under Securities Lending Program
In accordance with GASB Statement No. 28, Accounting and Financial Reporting for Securities Lending Transactions, liabilities resulting from these transactions have been recorded as obligations under securities lending transactions.
T. Other Liabilities
Other liabilities represent amounts owed for various governmental and proprietary activities. Some of these amounts will be paid shortly after fiscal year-end (see Note 25).
U. Claims Payable
Claims payable, reported in the proprietary funds of the primary government, represent both health and liability insurance claims payable at June 30, 2016.This includes both actual claims submitted, as well as actuarially determined claims incurred but not reported. Claims relating to the primary government’s liability insurance programs are reported in the Risk Management – internal service fund and the Risk Management – nonmajor enterprise fund. Also, health insurance claims are reported in the Health Care – internal service fund and the Local Choice Health Care – nonmajor enterprise fund (see Notes 23.A. and 23.B.). Claims payable reported by the Virginia Commonwealth University Health System Authority (a blended component unit of the Virginia Commonwealth University – nonmajor component unit) represents estimated malpractice, workers’ compensation, and medical claims payable amounts.
V. Long-term Liabilities
In the government-wide financial statements, long-term debt and other long-term obligations are reported as liabilities in the applicable governmental activities or business-type activities column. The governmental fund statements reflect the portion of long-term liabilities that will be paid from expendable resources that represent payments to employees for separations that occurred prior to

Commonwealth of Virginia 87
June 30. The proprietary fund statements and discrete component unit statements reflect total long-term liabilities and distinguish between those portions payable within one year and those payable in future years (see Note 26).
Bond premiums and discounts are amortized over the life of the bond. Bonds payable are reported net of the applicable bond premium or discount. Bond issuance costs, excluding prepaid insurance,are expensed.
Expenditures for principal and interest payments for governmental fund general obligation bonds and revenue bonds are recognized in the Debt Service Fund (nonmajor) when due. In these fund statements, governmental fund types recognize bond premiums and discounts, as well as bond issuance costs, during the current period. The face amount of debt issued is reported as other financing sources. Premiums received on debt issuances are reported as other financing sources while discounts on debt issuance are reported as other financing uses. Issuance costs, whether or not withheld from the actual debt proceeds received, are reported as debt service expenditures (see Note 26).
W. Deferred Inflows of Resources
Deferred inflows of resources are an acquisition of assets by the government that is applicable to a future reporting period. Deferred inflows have a natural credit balance and, therefore decrease net position similar to liabilities (see Notes 13, 14, 15, and 36).
X. Nonspendable Fund Balances
Nonspendable fund balances indicate that portion of fund balance that cannot be spent because it is either not in spendable form or is legally or contractually required to be maintained intact.
Y. Restricted Fund Balances
Restricted fund balances are amounts that have constraints placed on the use of resources that are either (a) externally imposed by creditors (such as through debt covenants), grantors, contributors, or laws or regulations of other governments, or (b) imposed by law through constitutional provisions or enabling legislation.
Z. Committed Fund Balances
Committed fund balance includes amounts that must be spent for specific purposes that have been legislatively mandated by the Governor and General Assembly.
AA. Assigned Fund Balances
Assigned fund balances are amounts that are constrained by the government’s intent to be used for specific purposes, but are neither restricted nor committed. Assignments are identified by Commonwealth management pursuant to the delegation of authority granted by the General Assembly and Governor specified in the Appropriation Act.
BB. Unassigned Fund Balances
Unassigned fund balance is the amount of fund balance that has not been assigned to other funds and has not been restricted, committed or assigned to specific purposes with the General Fund.
CC. Cash Management Improvement Act
Included in Amounts Due to Other Governments is the Commonwealth’s Cash Management Improvement Act (CMIA) interest liability to the federal government, which is calculated in accordance with the interest calculation and exchange provisions of the Federal Cash Management Improvement Act of 1990. The Commonwealth’s interest liability is subject to review and final confirmation by the Bureau of the Fiscal Service (BFS) of the U.S. Treasury. Ifrequired, the payment is to be made on March 31 of the following year. Payment will be made from a sum sufficient appropriation authorized for this purpose by the Appropriation Act. The CMIA interest rate of exchange is based by law on the average of the bond equivalent rates of 13-week Treasury Bills auctioned during the annual reporting period as calculated by BFS.
DD. Investment Income
In accordance with GASB Statement No. 31, Accounting and Financial Reporting for Certain Investments and for External Investment Pools, all investment income reported in the accompanying financial statements include changes in the fair value of investments and the amount reported may be negative. Additionally, the Commonwealth’s policy is to record all unrealized gains or losses for the State Treasurer’s Portfolio in the General Fund.

88 Commonwealth of Virginia
EE. Intrafund Eliminations
Eliminations have been incorporated into the report to eliminate intrafund transactions within the related fund type. These eliminations prevent overstatement of financial activity.
FF. Interfund Activity
Generally, the effect of interfund activity has been eliminated from the government-wide statements. Exceptions to this rule are 1) activities between funds reported as governmental activities and funds reported as business-type activities, and 2) activities between funds that are reported in different functional categories in either the governmental or business-type activities column. Elimination of these activities would distort the direct costs and program revenues for the functions.
In the fund financial statements, transfers represent the movement of resources between funds. For example, transfers are recorded when a fund receives revenue and subsequently disburses the resources to another fund for expenditure.
2. RESTATEMENT OF BEGINNING BALANCES
The government-wide beginning balance restatements resulted from the following:
Government-wide Activities
Governmental Activities
The Governmental Activities were restated for the following:
� The Commonwealth Transportation (major special revenue) has been restated by $51.3 million as a result of unearned revenue associated with multi-year vehicle registrations being understated.
� The Literary Fund (major special revenue) has been restated by $150.0 million as a result of a change in the investment liquidation management strategy related to the Private Purpose Trust Fund that increased beginning cash balances of the Literary Fund as discussed below.
� Capital Asset balances were restated by $9.7million due to errors that resulted in an understatement of previous balances.
Fund Statements
The fund statement beginning balance restatements resulted from the following:
� The Commonwealth Transportation (major special revenue) has been restated by $51.3 million as discussed previously.
� The Federal Trust (major special revenue) and Other (nonmajor special revenue) beginning balances were restated by $5.2 million due to clarified federal reporting guidance for the Equitable Sharing program.
� The Literary Fund (major special revenue) has been restated by $150.0 million discussed previously.
� Private Purpose Trust Funds have been restated by $150.0 million as a result of a change made to the investment liquidation management strategy related to the Unclaimed Property Trust Fund. The strategy modification to liquidate all securities not claimed by the owner after three years increased the cash available to the fund. The Unclaimed Property Trust Fund should only report assets that will not revert to the Literary Fund (major special revenue).
Component Units
The government-wide and fund statements were restated for the following.
� The University of Virginia has restated balances by $39.6 million for the liability to beneficiaries related to irrevocable split-interest agreements previously omitted.

Commonwealth of Virginia 89
(Dollars in Thousands)
Government-w ide Activities:Primary Government:
Governmental Activities $ 19,436,857 $ 150,000 $ - $ (41,636) $ 19,545,221Business-type Activities 1,379,462 - - - 1,379,462 Total Primary Government $ 20,816,319 $ 150,000 $ - $ (41,636) $ 20,924,683
Component Units $ 23,975,343 $ - $ - $ (39,596) $ 23,935,747
Fund Statements: Governmental Funds Major Governmental Funds:
General $ 848,356 $ - $ - $ - $ 848,356Special Revenue Funds:
Commonw ealth Transportation 2,271,107 - - (51,306) 2,219,801Federal Trust 115,436 - 5,219 - 120,655Literary (37,478) 150,000 - - 112,522
Nonmajor Governmental Funds 1,119,955 - (5,219) - 1,114,736Total Governmental Funds $ 4,317,376 $ 150,000 $ - $ (51,306) $ 4,416,070
Fiduciary FundsPrivate Purpose Trust Funds $ 3,606,491 $ (150,000) $ - $ - $ 3,456,491
Pension and Other Employee Benefit Trust Funds $ 68,197,614 $ - $ - $ - $ 68,197,614
Investment Trust Funds $ 2,727,929 $ - $ - $ - $ 2,727,929
Component Units:Virginia Housing Development Authority $ 2,820,285 $ - $ - $ - $ 2,820,285Virginia Public School Authority (31,799) - - - (31,799)Virginia Resources Authority 1,483,028 - - - 1,483,028Virginia College Building Authority (3,513,389) - - - (3,513,389)Nonmajor Component Units 23,217,218 - - (39,596) 23,177,622
Total Component Units $ 23,975,343 $ - $ - $ (39,596) $ 23,935,747
Correction
Reporting YearInvestmentof PriorChange in
Beginning Balance Restatement
Balance BalanceJune 30,as of Clarified
2015 GuidanceJune 30,
Liquidation Errors as restated2015

90 Commonwealth of Virginia
3. NET POSITION/FUND BALANCE CLASSIFICATIONS
Fund Balance
GASB Statement No. 54, Fund Balance Reporting and Governmental Fund Type Definitions, improved the reporting of fund balance so that classifications are more easily understood and can be applied consistently between information reported in the government-wide financial statements and the governmental fund financial statements. The governmental fund balance classifications defined in GASB Statement No. 54 are: Nonspendable, Restricted, Committed, Assigned, and Unassigned.
Nonspendable fund balance includes inventories, prepaid items, and the principal of a permanent fund. These funds are not available for expenditure in the current or following period.
Restricted fund balance includes amounts that have constraints placed on the use of resources by the Constitution of Virginia or a party external to the Commonwealth.
Committed fund balance includes amounts that must be spent for specific purposes that have been legislatively mandated by the Governor and General Assembly.
Assigned fund balance represents amounts that the Commonwealth has identified for planned purposes but for which the intended use is not legislatively mandated. The assignments are identified by Commonwealth management pursuant to the delegation of authority granted by the General Assembly and Governorspecified in the Appropriation Act. The following schedule includes committed and assigned amounts that share the same purpose and title. The distinction between these classifications results from whether there is a statutory restriction on certain amounts contained within the fund.
Unassigned fund balance for the General Fund (major) is the residual classification. A negative amount indicates that restricted and committed amounts exceed the available modified accrual basis fund balance.
The governmental fund balance classifications and amounts at June 30, 2016, are shown in the following table.

Commonwealth of Virginia 91
(Dollars in Thousands)
NonspendableInventory $ 41,325 $ 85,918 $ 32,582 $ - $ 4,989 $ 164,814Prepaid Items 73,040 12,288 2,643 - 20,272 108,243Permanent Funds - - - - 34,055 34,055
Total Nonspendable 114,365 98,206 35,225 - 59,316 307,112
RestrictedAgriculture and Forestry - - - - 1,382 1,382Capital Projects/Construction/Capital Acquisition - - - - 39,662 39,662Contract and Debt Administration - 3,205 - - 1,243 4,448Debt Service - - - - 21,752 21,752Economic and Technological
Development - - - - 13 13Educational and Training Programs - - - - 8,633 8,633Environmental Quality and Natural
Resource Preservation - - - - 16,567 16,567Gifts and Grants - 7,775 93,763 - 2,285 103,823Government Operations:
Legislative Services - - - - 5 5Administrative Services - - - - 1,672 1,672
Health and Public Safety - - - - 76,511 76,511Literary Fund - - - 50,815 - 50,815Lottery Proceeds Fund 62,086 - - - - 62,086Revenue Stabilization Fund 841,057 - - - - 841,057Transportation Activities - 320,116 - - - 320,116Virginia Water Supply Assistance Grant Fund 5,060 - - - - 5,060
Total Restricted 908,203 331,096 93,763 50,815 169,725 1,553,602
CommittedAgriculture and Forestry 92 - - - 23,203 23,295Amount Required for Mandatory
Reappropriation 58,465 - - - - 58,465Amount Required for Reappropriation
of 2016 Unexpended Balances for Capital Outlay 141,890 - - - - 141,890
Capital Projects/Construction/Capital Acquisition 1,036 - - - 688 1,724Central Capital Planning Fund 10,197 - - - - 10,197Commonw ealth's Development Opportunity Fund 24,957 - - - - 24,957Communications Sales and Use Tax 2,599 - - - - 2,599Contract and Debt Administration - 10,860 - - 330 11,190Economic and Technological
Development 45,045 - - - 50,976 96,021Educational and Training Programs 1,250 1,204 - - 6,484 8,938Environmental Quality and Natural
Resource Preservation 11,376 - - - 107,182 118,558Government Operations:
Legislative Services - - - - 74 74Administrative Services 97 - - - 70,361 70,458
Health and Public Safety 13,200 3,545 - - 199,341 216,086Natural Disaster Sum Suff icient 25,573 - - - - 25,573Regulatory Oversight - - - - 132,934 132,934Transportation Activities - 1,482,998 - - 4,059 1,487,057Virginia Health Care Fund 45,461 - - - - 45,461Virginia Water Quality Improvement Fund 15,773 - - - - 15,773
Total Committed 397,011 1,498,607 - - 595,632 2,491,250
AssignedEconomic and Technological Development - - - - 1,849 1,849Educational and Training Programs - - - - 5,611 5,611Environmental Quality and Natural Resource
Preservation - - - - 7,926 7,926Government Operations:
Administrative Services - - - - 348 348Health and Public Safety - - - - 13,021 13,021Transportation Activities - 507 - - - 507
Total Assigned - 507 - - 28,755 29,262
Unassigned (709,290) - - - - (709,290)
Total Fund Balance $ 710,289 $ 1,928,416 $ 128,988 $ 50,815 $ 853,428 $ 3,671,936
CommonwealthTransportation
FederalTrust Total
Governmental Fund Balance Classifications
Literary GovernmentalNonmajor
General Fund

92 Commonwealth of Virginia
4. DEFICIT FUND BALANCES/NET POSITION
The Virginia Lottery (major enterprise fund), the Department of Alcoholic Beverage Control (nonmajor enterprise fund), the Department of General Services’ Consolidated Laboratory Services Fund (nonmajor enterprise fund), the Department of Environmental Quality’s Title V Air Pollution Permit Fund (nonmajor enterprise fund), and the Payroll Service Bureau (internal service fund) ended the year with deficit net positions of $30.9 million, $86.1 million, $2.0 million,$8.8 million, and $2.4 million, respectively. This was solely attributable to the net pension liability resulting from GASB Statement No. 68, Accounting and Financial Reporting for Pensions – an amendment of GASB Statement No. 27, and the net other postemployment benefits (OPEB) obligation resulting from GASB Statement No. 45, Accounting and Financial Reporting by Employers for Postemployment Benefits Other Than Pensions.
The Risk Management Fund (nonmajor enterprise fund) ended the year with a deficit net position balance of $19.4 million. The deficit was a result of increasing claims liability for constitutional officers’ programs.
The Virginia Information Technologies Agency (internal service fund) ended the year with a deficit net positionbalance of $37.4 million. The deficit was a result of adecline in revenue associated with service usage and fixed operating expenses to Northrop Grumman, and noncurrent liabilities related to net pension liabilities and other postemployment benefit obligations.
The Enterprise Application Fund (internal service fund) ended the year with a deficit net position balance of $7.9million. This deficit was the result of a working capital advance liability for the implementation of the Cardinal project, coupled with noncurrent liabilities related to net pension liabilities and other postemployment benefit obligations.
The Property Management Fund (internal service fund) ended the year with a deficit net position balance of $21.6 million. This deficit was the result of the purchase of a leasehold interest in a state-owned building in fiscal year 2006. Also, the Property Management Fund incurred additional capital lease liabilities due to transfers of leases from other state agencies in fiscal year 2009. Additionally, in fiscal year 2012, the Property Management Fund entered into three energy leases where the asset is reported in the governmental fund and the liability is recorded in the internal service fund. Further, there are noncurrent liabilities related to net pension liabilities and other postemployment benefit obligations.
The Risk Management Fund (internal service fund) ended the year with a deficit net position balance of $692.6 million. The deficit was the result of the Worker’s Compensation Program having estimated claims payable exceeding the available equity in the fund. Claims are paid on a pay-as-you-go basis. To the extent that claims exceed current resources, they will ultimately become a liability of the fund from which the claim originated.
The Virginia Public School Authority (major component unit) ended the year with a deficit net position balance of $22.8 million. This deficit is the result of an accrued credit against future debt service payments on Local School Bonds due from the localities subsequent to June 30.
The Virginia College Building Authority (major component unit) ended the year with a deficit net position balance of $3.8 billion. This deficit occursbecause the Authority issued bonds for the 21st Century College and Equipment programs subject to future appropriations from the General Fund of the Commonwealth without any other security. These future appropriations are not included as assets of the Authority.
The Southern Virginia Higher Education Center (nonmajor component unit) ended the year with a deficit net position balance of $642,132. This was solely attributable to the entries for the net pension liability resulting from GASB Statement No. 68, Accounting and Financial Reporting for Pensions – an amendment of GASB Statement No. 27 and the net other postemployment benefits (OPEB) obligation resulting from GASB Statement No. 45, Accounting and Financial Reporting by Employers for Postemployment Benefits Other Than Pensions.
The Virginia Economic Development Partnership (nonmajor component unit) ended the year with a deficit net position balance of $9.8 million. This deficit occurs because the partnership’s Statement of Net Position reflects $14.8 million in non-current liabilities related to compensated absences, net pension liabilities, and net other postemployment benefit obligation. The Partnership is funded mainly by state appropriations, which show current funding only.
The Virginia Tourism Authority (nonmajor component unit) ended the year with a deficit net position balance of $1.9 million. This deficit occurs because the Authority’s Statement of Net Position reflects $8.3 million in non-current liabilities related to compensated absences, net pension liabilities, and net other postemployment benefit obligation.
5. REVENUE STABILIZATION FUND
In accordance with Article X, Section 8 of the Constitution of Virginia, the amount estimated as required for deposit to the Revenue Stabilization Fund must be appropriated for that purpose by the General Assembly. During fiscal year 2016, in accordance with the provisions of Article X, Section 8 of the Constitution of Virginia and Section 2.2-1830 of the Code of Virginia,a withdrawal of $235.5 million was made from the fund.
Under the provisions of Article X, Section 8 of the Constitution of Virginia, a deposit of $605.6 million is required during fiscal year 2017 based on fiscal year 2015 revenue collections. This required deposit is included as a restricted component of fund balance and includes the advance reservation of $129.5 million provided in Chapter 665, 2015 Acts of Assembly. No

Commonwealth of Virginia 93
deposit is required based on fiscal year 2016 revenue collections.
Section 2.2-1829(b) of the Code of Virginia requires an additional deposit into the Fund when specific criteria have been met. No such deposit is required since the specified criteria were not met for fiscal year 2016.
The Revenue Stabilization Fund has principal and interest on deposit of $235.5 million restricted as a part of General Fund balance. Pursuant to the constitutional amendment of Article X, Section 8, effective January 1, 2011, the amount on deposit cannot exceed 15.0percent of the Commonwealth’s average annual tax revenues derived from taxes on income and retail sales for the preceding three fiscal years. As of June 30, 2016, the Constitutional maximum is $2.5 billion.
6. CASH, CASH EQUIVALENTS, AND INVESTMENTS
At June 30, 2016, the carrying amount of cash for the primary government was $3.6 billion and the bank balance was $387.4 million. The carrying amount of cash for component units was $1.9 billion and the bank balance was $1.1 billion. Cash equivalents are investments with an original maturity of 90 days or less. Cash and cash equivalents for foundations (component units) totaled $366.1 million as of year-end. A portion of this amount and some balances during the year exceeded Federal Deposit Insurance Corporation (FDIC) insurance coverage. Foundation investments are disclosed in the Interest Rate Risk section of this note.Note 6 includes investment derivatives for the primary government and excludes derivatives for the component units. For additional information concerning derivative instruments, see Note 14.
For purposes of this note, primary government includes governmental, business-type activities, and fiduciary funds. The deposits of the primary government and the component units, excluding foundations (component units), are secured in accordance with the provisions of the Virginia Security for Public Deposits Act, Section 2.2-4400 of the Code of Virginia. The act requires any public depository that receives or holds public deposits to pledge collateral to the Treasury Board to cover public deposits in excess of Federal deposit insurance. The required collateral percentage is determined by the Treasury Board and ranges from 50.0 percent to 100.0 percent for financial institutions choosing the pooled method of collateralization, and from 105.0 percent to 130.0 percent for financial institutions choosing the dedicated method of collateralization. As stated in Note 1.DD, unrealized gains or losses for the State Treasurer’s Portfolio are recorded in the General Fund.
Certain deposits are held by trustees in accordance with the Trust Subsidiary Act, Section 6.2-1057 of the Code of Virginia. The act requires that cash held by trusteeswhile awaiting investment or distribution is not to be used by an affiliate bank of the trustee in the conduct of its business unless the affiliate bank delivers securities to the trust department as collateral that is at least equal to the fair value of the trust funds held on deposit in excess of amounts insured by the FDIC.
The Commonwealth is authorized, in accordance with the guidelines set forth in Section 2.2-4500 et seq. of the Code of Virginia, to invest public funds in the following:
� U.S. Treasury and agency securities� Corporate debt securities � Asset–backed securities� Mortgage–backed securities� Municipal securities� AAA rated obligations of foreign governments� Bankers’ acceptances and bank notes� Negotiable certificates of deposit� Repurchase agreements� Money market funds
Permitted investments include agency mortgage-backed securities, corporate or private label mortgage-backed securities, and asset-backed securities which by definition usually expose the investor to prepayment risk. Prepayment risk, or the prepayment option granted the borrower, can create uncertainty concerning cash flows, can affect the price of the security causing negative convexity, and can expose the investor to reinvestment risk. Similarly, many agency and corporate securities are callable after some predetermined date at a predetermined price. The call options in regular agency debentures and some corporate securities can be open ended and may significantly impact cash flows, security pricing, and reinvestment risks of these securities.
At June 30, 2016, the State Treasurer held no security that was in default as to principal or interest and had no securities that were out of compliance with guidelines.
Public funds held by the Commonwealth, public officers, municipal corporations, political subdivisions, and any other public body of the Commonwealth shall be held in trust for the citizens of the Commonwealth. Any investment of such funds pursuant to the provisions of this chapter shall be made solely in the interest of the citizens of the Commonwealth and with the care, skill, prudence, and diligence under the circumstances then prevailing that a prudent person acting in a like capacity and familiar with such matters would use in the conduct of an enterprise of a like character and with like aims.
Certain investments held in trust by the State Treasurer in accordance with bond indentures and resolutions may have more restrictive investment policies. Investment policies of institutions of higher education (component units) are established by the institutions’ governing boards.
The Board of Trustees of the Virginia Retirement System (the System) (part of primary government) has full power to invest and reinvest the trust funds in accordance with Section 51.1–124.30 of the Code of Virginia, as amended. This section requires the Board to discharge its duties solely in the interest of the beneficiaries and to invest the assets with the care, skill, prudence, and diligence under the circumstances then prevailing that a prudent person acting in a like capacity
94 Commonwealth of Virginia
and familiar with such matters would use in the conduct of an enterprise of a like character and with like aims. The Board must also diversify such investments so as to minimize the risk of large losses unless under the circumstances it is clearly prudent not to do so. The System does not have investment policies that place specific restrictions on investments related to custodial risk, interest rate risk, credit risk, or foreign currency risk. The System investment portfolio is intended to be managed through diversification and prudent judgment, rather than through specific policy restrictions.
The information presented for the external investment pool was obtained from audited financial statements. Copies of the Local Government Investment Pool (LGIP) report may be obtained by writing the Department of the Treasury, Post Office Box 1879, Richmond, Virginia 23218. Participation in this pool is voluntary.
Custodial Risk
Custodial credit risk is the risk that, in the event of the failure of the counterparty, the Commonwealth may not be able to recover the value of its investment or collateral securities that are in the possession of an outside party.
Policies related to custodial credit risk pertaining to theCommonwealth’s securities lending program are found in the securities lending section of this note.
As of June 30, 2016, the primary government had $3.1 million in cash balances that were uninsured and uncollateralized, and $40.1 million in cash balances that were uninsured and collateralized with securities held by the pledging financial institution. In addition, the primary government had $1.1 billion of cash equivalents and investments that were exposed to custodial risk as uninsured and uncollateralized. The majority of this amount, held by the System, consisted of various types of debt and equity securities that were held by counterparties’ trust departments or agents, but not in the System’s name. Common and preferred stocks represented $889.1 million of the total. The remainder was for various types of debt securities.
As of June 30, 2016, component units had $17.5 million in cash balances that were uninsured and uncollateralized, and $19.8 million in cash balances that were uninsured and collateralized with securities held by the pledging financial institution.
As of June 30, 2016, the investments of the Pension and Other Employee Benefit Trust Funds were approximately 81.3 percent of the primary government investments. Of the total primary government investments exposed to custodial risk, 99.8 percent were investments of the Pension and Other Employee Benefit Trust Funds.
Interest Rate Risk
Interest rate risk is the risk that changes in interest rates of debt investments will adversely affect the fair value of an investment. The Commonwealth has elected the Segmented Time Distribution method of disclosure.
The State Treasurer’s guidelines limit the following maximum durations for any single security of the following investment types:
Security Type Maximum Duration
Corporate Security 15 yearsAsset-Backed Securities 5 yearsSovereign Government
Obligations (excluding U.S.) 5 yearsNegotiable Certificates of Deposit
and Negotiable Bank Notes 5 years
The State Treasurer’s guidelines further describe target durations for the overall general account portfolio of 1.7 years.
The System manages the risk within the portfolio using the effective duration or option-adjusted methodology. It is widely used in the management of fixed income portfolios in that it quantifies, to a much greater degree, the risk of interest rate changes. The methodology takes into account optionality on bonds and scales the risk of price changes on bonds depending upon the degree of change in rates and the slope of the yield curve. All of the System’s fixed income portfolios are managed in accordance with the System’s investment guidelines, most of which are specific as to the degree of interest rate risk that can be taken.
As of June 30, 2016, the System’s investments included $2.6 billion, primarily in Corporate Bonds and Notes, U.S. Treasury and Agency Securities, Agency Unsecured Bonds and Notes, and Other Debt Securities, which are highly sensitive to interest rate fluctuations in that they are subject to early payment in a period of declining interest rates and/or because they have an option adjusted duration of greater than ten years. The resulting reduction in expected total cash flows affects the fair value of these securities. As of June 30, 2016, the College of William and Mary (nonmajor component unit) had $26.9 million in Mutual and Money Market Funds that have fair values that are highly sensitive to changes in interest rates due to the long term maturity of these securities.
At June 30, 2016, the Commonwealth had the following investments and maturities:

Commonwealth of Virginia 95
Investment Type Less More June 30, 2016 Than 1 1-5 6-10 Than 10
Debt SecuritiesU. S. Treasury and Agency Securities $ 4,934,803 $ 370,260 $ 2,834,471 $ 1,086,245 $ 643,827Corporate Bonds and Notes 12,392,363 3,843,642 4,102,900 2,896,420 1,549,401Supranational and Non-U.S. Government Bonds and Notes 2,225,330 242,405 586,372 967,246 429,307Commercial Paper 3,879,288 3,879,288 - - -Negotiable Certif icates of Deposit 3,529,830 3,514,557 15,273 - -Repurchase Agreements 1,433,076 1,433,076 - - -Municipal Securities 272,295 2,897 47,418 69,030 152,950Asset-Backed Securities 886,592 113,255 395,503 213,662 164,172Agency Mortgage-Backed Securities 2,976,174 320,211 1,844,060 669,126 142,777Agency Unsecured Bonds and Notes 2,890,951 1,787,477 758,685 53,850 290,939Mutual and Money Market Funds (Includes SNAP) 1,847,268 1,847,268 - - -The Boston Company Pooled Employee Trust Fund 62,519 62,519 - - -Guaranteed Investment Contracts 786,361 - 786,361 - -Fixed Income and Commingled Funds 1,698,777 106,956 1,402,473 189,348 -Investments held by broker-dealers under securities loans
U. S. Government and Agency Securities 322 104 218 - -Corporate Bonds 1,355 203 733 419 -
Other 639,534 6,029 201,226 420,978 11,301
Total $ 40,456,838 $ 17,530,147 $ 12,975,693 $ 6,566,324 $ 3,384,674
Investment Maturities (in years)
Primary Government Investments (Dollars in Thousands)
Investment Type Less More June 30, 2016 Than 1 1-5 6-10 Than 10
Debt SecuritiesU. S. Treasury and Agency Securities $ 1,184,640 $ 181,439 $ 238,081 $ 56,254 $ 708,866Corporate Bonds and Notes 393,399 98,637 269,704 20,327 4,731Commercial Paper 376,961 376,961 - - -Negotiable Certif icates of Deposit 171,179 122,277 48,902 - -Repurchase Agreements 52,167 52,167 - - -Reverse Repurchase Agreements 500,000 500,000 - - -Municipal Securities 217,064 13,203 87,208 82,367 34,286Asset-Backed Securities 146,607 15,012 107,071 4,246 20,278Agency Unsecured Bonds and Notes 245,082 124,911 114,879 5,292 -Agency Mortgage-Backed Securities 138,704 20,958 54,062 6,906 56,778Mutual and Money Market Funds (Includes SNAP) 823,952 776,068 18,741 25,137 4,006Guaranteed Investment Contracts 45,442 2,220 12,147 16,761 14,314Fixed Income and Commingled Funds 90,110 5,390 1,372 83,348 -Other 7,423 3,779 3,613 31 -
Total $ 4,392,730 $ 2,293,022 $ 955,780 $ 300,669 $ 843,259
Investment Maturities (in years)
Component Unit Investments(Dollars in Thousands)

96 Commonwealth of Virginia
Investment TypeU.S. Treasury and Agency Securities $ 1,302,193Common & Preferred Stocks 832,104Corporate Bonds and Notes 249,675Negotiable Certif icates of Deposit 18,284Municipal Securities 6,262Repurchase Agreements 385Asset Backed Securities 1,261Agency Mortgage Backed 5,104Mutual and Money Market Funds 521,090Real Estate 569,080Index Funds 179,610Hedge Funds 2,169,525Partnerships 1,616,341Venture Capital 824,841Other 3,731,863Total $ 12,027,618
Foundation Investments(Dollars in Thousands)
Fair Value
Note: Foundations represent FASB reporting entities defined in Note 1.B. A portion of these amounts are reported at cost rather than fair value because fair value was not available or readily determinable.
Credit Risk
Credit risk is the risk that an issuer or other counterparty to an investment will not fulfill its obligations. The State Treasurer places emphasis on securities of high credit quality and marketability. At the time of purchase, the following limitations are in place:
� Bankers acceptances: P-1, Moody’s Investors Service (Moody’s) and A-1, Standard & Poor’s (S&P)
� Negotiable CDs and bank notes:o maturities of one year or less: P-1, Moody’s
and A-1, S&Po maturities over one year: Aa, Moody’s and AA,
S&P� Commercial paper: P-1, Moody’s and A-1, S&P� Corporate Notes and Bonds: A3/A- or equivalent by
two nationally recognized rating agencies, one of which must be Moody’s or S&P. However, each external investment manager may invest up to 10.0 percent of their portfolio in Baa2/BBB rated bonds which, at a minimum, must be rated Baa2/BBB by two nationally recognized rating agencies, one of which must be either Moody’s or S&P.
� Municipal Bonds: A3/A- or equivalent by two nationally recognized rating agencies, one of which must be Moody’s or S&P
� Asset-backed securities: AAA by two nationally recognized rating agencies, one of which must be Moody’s or S&P
� Dollar denominated obligations of sovereign governments: Aaa, Moody’s and AAA, S&P
� Commercial Mortgage-Backed Securities (CMBS) and Collateralized Mortgage Obligations (CMOs): AAA by two nationally recognized rating agencies, one of which must be Moody’s or S&P
The following tables present the credit ratings for the majority of the investments of the primary government and component units as of June 30, 2016. The ratings presented are using S&P and Moody’s rating scales. Within the primary government, the investments presented in the table represented 79.9 percent of the total debt securities. Within the component units, the investments presented in the table represented 84.5percent of the total debt securities.
Credit risk for derivative instruments held by the Commonwealth results from counterparty risk assumed by the Commonwealth. This is essentially the risk that the borrower will be unable to meet its obligation. Information regarding the Commonwealth’s credit risk related to derivatives is found in Note 14.
Policies related to credit risk pertaining to the Commonwealth’s securities lending program are found in the Securities Lending section of this note.

Commonwealth of Virginia 97
PercentInvestment Rating Agency Rating of Portfolio
U. S. Treasury and Agency Securities (1) $ 4,934,737 N/A N/A 12.2%Commercial Paper 2,634,489 Moody's P-1 6.5%Agency Unsecured Bonds and Notes 2,335,669 Standard & Poor's AA+ 5.8%Agency Mortgage Backed Securities 2,024,230 Moody's Aaa 5.0%Negotiable Certif icates of Deposit 1,882,474 Moody's P-1 4.7%Corporate Bonds and Notes 1,413,640 Moody's Aa3 3.5%Negotiable Certif icates of Deposit 1,296,241 Standard & Poor's A-1 3.2%Corporate Bonds and Notes 1,216,856 Moody's NR 3.0%Corporate Bonds and Notes 1,072,893 Moody's A1 2.7%Corporate Bonds and Notes 1,018,044 Moody's Aa2 2.5%Corporate Bonds and Notes 983,522 Moody's Baa1 2.4%Mutual and Money Market Funds (Include SNAP) 891,460 Standard & Poor's AAA 2.2%Repurchase Agreements 862,327 Moody's NR 2.1%Mutual and Money Market Funds (Include SNAP) 838,391 Moody's Aaa 2.1%Fixed Income and Commingled Funds 832,148 Moody's Baa1 2.1%Guaranteed Investment Contracts 786,361 N/A N/A 1.9%Agency Mortgage Backed Securities 729,271 Moody's NR 1.8%Corporate Bonds and Notes 722,080 Moody's A3 1.8%Corporate Bonds and Notes 720,155 Moody's Baa3 1.8%Corporate Bonds and Notes 659,397 Moody's A2 1.6%Corporate Bonds and Notes 655,795 Moody's Baa2 1.6%Commercial Paper 650,296 Moody's P-2 1.6%Commercial Paper 594,503 Standard & Poor's A-1 1.5%Agency Unsecured Bonds and Notes 553,617 Moody's Aaa 1.4%Fixed Income and Commingled Funds 518,079 N/A N/A 1.3%Corporate Bonds and Notes 507,629 Moody's Ba3 1.3%Repurchase Agreements 500,000 Standard & Poor's AA+ 1.2%Other Debt Securities 456,699 Moody's Aaa 1.1%
Amount
Credit Rating - Primary Government(Dollars in Thousands)
PercentInvestment Rating Agency Rating of Portfolio
U. S. Treasury and Agency Securities (1) $ 1,184,640 N/A N/A 27.0%Mutual and Money Market Funds (Include SNAP) 440,401 Standard & Poor's AAA 10.0%Commercial Paper 303,246 Moody's P-1 6.9%Reverse Repurchase Agreements 300,000 Standard & Poor's BBB- 6.8%Mutual and Money Market Funds (Include SNAP) 289,618 N/A N/A 6.6%Reverse Repurchase Agreements 200,000 Moody's Baa2 4.6%Agency Unsecured Bonds and Notes 199,301 Moody's Aaa 4.5%Negotiable Certif icates of Deposit 120,001 Moody's P-1 2.7%Fixed Income and Commingled Funds 90,110 N/A N/A 2.1%Mutual and Money Market Funds (Include SNAP) 84,880 Moody's Aaa 1.9%Asset Backed Securities 76,922 Moody's Aaa 1.8%Corporate Bonds and Notes 60,151 Moody's A1 1.4%Agency Mortgage Backed Securities 60,041 Moody's Aaa 1.4%Agency Mortgage Backed Securities 54,071 Standard & Poor's AA+ 1.2%Corporate Bonds and Notes 52,425 Moody's A2 1.2%Commercial Paper 50,958 N/A N/A 1.2%Asset Backed Securities 48,435 Standard & Poor's AAA 1.1%Repurchase Agreements 48,405 N/A N/A 1.1%Guaranteed Investment Contracts 45,442 Standard & Poor's AA- 1.0%
Amount
Credit Rating - Component Units(Dollars in Thousands)
(1) Obligations of the U. S. Government or obligations explicitly guaranteed by the U. S. Government are not considered to have credit risk.
Concentration of Credit Risk
Concentration of credit risk is related to the risk of loss that may be attributed to the magnitude of a government’s investment in a single issuer. The Commonwealth holds no investment in the securities of a single issuer that is more than 5.0 percent of the total
market value of its investments. In addition, the StateTreasury and the System have individual investment policies limiting the amounts that may be invested in any single issuer.
It is the State Treasurer’s policy that each portfolio will be diversified with no more than 4.0 percent of the value

98 Commonwealth of Virginia
of the fund invested in the securities of any single issuer. This limitation shall not apply to the U.S. Government, or agency thereof, or U.S. Government sponsored corporation securities and fully insured and/or collateralized certificates of deposit. Certain portfolios are limited to amounts less than 4.0 percent of the value of the fund invested in the securities of any single issuer.
The System investment guidelines for each specific portfolio also limit investments in any corporate entity to no more than 5.0 percent of the market value of the account for both the internally and externally managed portfolios. There is no concentration of investments in any one organization that represents 5.0 percent or more of plan net position available for benefits.
Foreign Currency Risk
Primary Government
Foreign currency risk is the risk that changes in exchange rates will adversely impact the fair value of an
investment. All primary government investments exposed to foreign currency risk were part of the System, the Virginia College Savings Plan, and the Unclaimed Property portfolios at June 30, 2016.
Foreign currency risk exposure, or exchange rate risk, primarily exists in the international and global equity investment holdings. From time to time, external managers may hedge their portfolios’ foreign currency exposures with currency forward contracts. This will depend upon their views about a specific foreign currency relative to the U.S. dollar. Exposure to foreign currency risk is highlighted in the following table.
Component Units
All nonmajor component unit investments exposed to foreign currency risk were part of the College of William and Mary, James Madison University, and the Virginia Economic Development Partnership at June 30, 2016.
Currency Cash & Cash Equivalents Equity
Fixed Income Private Equity Real Estate
Corporate Bonds
International Funds Total
U.S. Dollar -$ 1,991$ -$ 2,145$ -$ -$ 1,286,111$ 1,290,247$Euro Currency Unit (1,395,029) 1,744,423 38,173 652,675 220,516 27,801 - 1,288,559Japanese Yen (695,834) 1,611,536 - - 1,682 7,899 - 925,283Hong Kong Dollar (124,791) 742,777 - - 4,033 1,291 - 623,310British Pound Sterling (781,060) 1,202,631 1,869 - 116,085 3,267 - 542,792South Korean Won 3,269 382,154 - - - - - 385,423Canadian Dollar (462,405) 752,811 - - 29,392 2,510 - 322,308Sw iss Franc (360,779) 625,023 - - 1,997 1,742 - 267,983Indian Rupee 14,253 221,543 7,045 - - - - 242,841S African Comm Rand (4,552) 141,710 60,163 - - - - 197,321Australian Dollar (294,750) 463,709 - - 10,951 - - 179,910New Taiw an Dollar (10,760) 185,345 - - - - - 174,585Brazil Real (40,709) 102,309 103,005 - - - - 164,605Turkish Lira 3,066 80,516 46,604 - - - - 130,186Mexican New Peso 38,597 45,891 44,147 - 847 - - 129,482Malaysian Ringgit 26,356 62,394 39,352 - - - - 128,102Thailand Baht 17,896 70,112 16,562 - - - - 104,570Sw edish Krona (99,523) 196,387 - - - - - 96,864Indonesian Rupiah (608) 33,934 57,512 - - - - 90,838Polish Zloty 9,294 18,839 42,869 - - - - 71,002Danish Krone (69,486) 131,549 - - - - - 62,063Russian Ruble (New ) 18,717 18,922 21,525 - - - - 59,164Colombian Peso 10,072 1,797 26,545 - - - - 38,414Chilean Peso (2,150) 37,566 - - - - - 35,416Norw egian Krone (65,897) 93,835 - - - - - 27,938Philippines Peso 8,274 13,050 2,087 - - - - 23,411Hungarian Forint (9,204) 8,019 14,884 - - - - 13,699Moroccan Dirham 12,479 - - - - - - 12,479Romanian Leu (1,436) - 13,734 - - - - 12,298Peruvian Nuevo Sol 3,353 - 7,855 - - - - 11,208Egyptian Pound 259 4,632 - - - - - 4,891UAE Dirham 144 3,772 - - - - - 3,916Argentina Peso 3,595 - - - - - - 3,595Ghanaian Cedi - - 3,390 - - - - 3,390Qatari Riyal 716 2,668 - - - - - 3,384Nigerian Naira - - 736 - - - - 736Saudi Arabia Riyal (5,572) - - - - - - (5,572)Czech Koruna (23,392) 310 - - - - - (23,082)Israeli Shekel (69,767) 44,607 - - - - - (25,160)New Zealand Dollar (58,977) 26,703 - - 608 - - (31,666)Chinese Yuan Renminbi (46,331) 104 - - - - - (46,227)Singapore Dollar (189,425) 120,402 - - - - - (69,023)
Total $ (4,642,097) $ 9,193,971 $ 548,057 $ 654,820 $ 386,111 $ 44,510 $ 1,286,111 7,471,483$
Foreign Currency Exposures by Asset Class - Primary Government(Dollars in Thousands)

Commonwealth of Virginia 99
Currency Cash & Cash Equivalents Equity Fixed Income Private Equity Real Estate
International Funds Total
British Pound Sterling 1,046$ -$ -$ -$ -$ -$ 1,046$Euro Currency Unit 2,815 - - - - - 2,815Other 13 - - - - - 13
Total $ 3,874 $ - $ - $ - $ - $ - 3,874$
Foreign Currency Exposures by Asset Class - Component Units(Dollars in Thousands)
Fair Value Measurements
Primary Government
The Commonwealth implemented GASB Statement No. 72, Fair Value Measurement and Application, during fiscal year 2016. This Statement requires disclosures to be made about fair value measurements, the level of fair value hierarchy, and valuation techniques. The fair value hierarchy is based on the valuation inputs used to measure the fair value of assets.
� Level 1 inputs are quoted prices in active markets for identical assets;
� Level 2 inputs are significant other observable inputs and may include quoted prices for similar assets in active markets, quoted prices for identical or similar assets in inactive markets, or model-driven valuations;
� Level 3 inputs are derived using valuation techniques that have significant unobservable inputs.
Investments that do not have a readily determinable fair value are excluded from the fair value hierarchy and instead are valued by using the net asset value (NAV) per share (or its equivalent). In instances where inputs used to measure fair value fall into different levels in the fair value hierarchy, fair value measurements in their entirety are categorized based on the lowest level input that is significant in the valuation.
The following table summarizes cash equivalents and investments reported at fair value by the primary government as of June 30, 2016.

100 Commonwealth of Virginia
Fair value measured using fair value hierarchyDebt Securities (1)U. S. Treasury and Agency Securities $ 4,602,784 $ 4,066,089 $ 536,695 $ -Corporate Bonds and Notes 9,100,701 1,102 9,097,443 2,156Supranational and Non-U.S. Government Bonds and Notes 2,149,134 10,281 2,138,853 -Commercial Paper 1,021,317 - 1,021,317 -Negotiable Certif icates of Deposit 1,611,416 2,034 1,609,382 -Repurchase Agreements 70,749 - 70,749 -Municipal Securities 272,296 6,788 265,508 -Asset-Backed Securities 886,593 23 886,570 -Agency Mortgage-Backed Securities 2,976,173 303 2,975,870 -Agency Unsecured Bonds and Notes 1,780,207 7,669 1,772,538 -Mutual and Money Market Funds 205,641 205,368 273 -Fixed Income and Commingled Funds 265,503 68,655 - 196,848Investments held by broker-dealers under securities loans
U. S. Government and Agency Securities 322 322 - -Corporate Bonds 1,355 1,355 - -
Other 639,533 2,671 636,862 -Total Debt Securities 25,583,724 4,372,660 21,012,060 199,004
Equity Securities (2)Common and Preferred Stocks 21,710,001 21,581,265 128,025 711Foreign Currencies 2,910 720 2,190 -Equity Index and Pooled Funds 67,588 67,583 5 -Index Funds 1,847,078 1,847,078 - -Real Estate 3,252,978 1,933 - 3,251,045Other 1,995,874 1,081,788 - 914,086
Total Equity Securities 28,876,429 24,580,367 130,220 4,165,842Total by Fair Value Level $ 54,460,153 $ 28,953,027 $ 21,142,280 $ 4,364,846
Fair value established using the net asset value (NAV) (3)Mutual and Money Market Funds 12,514Fixed Income and Commingled Funds 1,433,274Equity Index and Pooled Funds 8,490,961Real Estate 4,507,388Other Equity Securities 8,521,634
Total Fair Value established using NAV 22,965,771
Total Fair Value $ 77,425,924
In ActiveQuoted Prices
Fair Value Measurements - Primary Government(Dollars in Thousands)
Significant
Fair Value (Level 1) (Level 2) (Level 3)
SignificantUnobservable
InputsInputsObservable
Other
AssetsIdentical
Markets for
(1) Debt securities are classified as follows:
� Level 1 - valued using unadjusted quoted prices in active markets for those securities.
� Level 2 - valued using a proprietary matrix pricing technique. This pricing technique defines the primary source and secondary sources to be used if the primary pricing source does not provide a value. The valuation techniques may include market participant’s assumptions, quoted prices for similar securities, benchmark yield curves including but not limited to treasury benchmarks, LIBOR and swap curves, market corroborated inputs, and other data inputs.
� Level 3 - valued using proprietary information.
(2) Equity securities are classified as follows:
� Level 1 - valued using unadjusted quoted prices in active markets for those securities.
� Level 2 - valued using bid evaluations.
� Level 3 – valued using proprietary information and independent appraisals. This results in using one or more valuation techniques, such as the market approach and or the income approach, for those securities for which sufficient and reliable data is available. Within this level, the use of the market approach generally consists of using comparable market transactions or other data, while the use of the income approach generally consists of the net present value of estimated future cash flows.
(3) Investments reported at fair value established using the NAV were all part of the System and the Virginia College Savings Plan Fund (major enterprise).
� Additional information is available in the System’s separately issued financial statements, which may be obtained from the Virginia Retirement System at P.O. Box 2500, Richmond, Virginia 23218-2500.
� Additional information regarding the Virginia 529 prePAID assets is available in the Virginia529 individually published financial statements, which may be obtained by writing to Virginia529, 9001 Arboretum Parkway, North Chesterfield, Virginia 23236.

Commonwealth of Virginia 101
Component Units
The following table summarizes cash equivalents and investments reported at fair value by the component units as of June 30, 2016. The table excludes cash equivalents and investments measured at fair value by the foundations that follow FASB standards.
Fair value measured using fair value hierarchyDebt Securities (1)U. S. Treasury and Agency Securities $ 1,134,669 $ 518,571 $ 616,098 $ -Corporate Bonds and Notes 392,517 5,101 387,416 -Commercial Paper 63,586 16,962 46,624 -Negotiable Certif icates of Deposit 49,899 29,907 19,992 -Repurchase Agreements 52,167 26,881 25,286 -Municipal Securities 211,437 309 211,128 -Asset-Backed Securities 146,607 - 146,607 -Agency Mortgage-Backed Securities 138,704 660 138,044 -Agency Unsecured Bonds and Notes 245,082 330 244,752 -Mutual and Money Market Funds 238,183 157,422 76,001 4,760Fixed Income and Commingled Funds 4,726 4,726 - -Other 3,646 54 3,592 -
Total Debt Securities 2,681,223 760,923 1,915,540 4,760
Equity Securities (2)Common and Preferred Stocks 68,863 68,863 - -Equity Index and Pooled Funds 34,514 34,514 - -Index Funds 13,611 13,611 - -Real Estate 2,347 2,313 - 34Other 519,779 515,493 1,576 2,710
Total Equity Securities 639,114 634,794 1,576 2,744Total by Fair Value Level $ 3,320,337 $ 1,395,717 $ 1,917,116 $ 7,504
Fair value established using the net asset value (NAV) (3)Mutual and Money Market Funds 20,344Guaranteed Investment Contracts 45,442Fixed Income and Commingled Funds 85,384Equity Index and Pooled Funds 130,375Index Funds 5,973Real Estate 21,101Other Equity Securities 462,316
Total Fair Value established using NAV 770,935
Total Fair Value $ 4,091,272
Markets for Other Significant
Fair Value Measurements - Component Units(Dollars in Thousands)
Quoted PricesIn Active Significant
Fair Value (Level 1) (Level 2) (Level 3)
Identical Observable UnobservableAssets Inputs Inputs
(1) Debt securities are classified as follows:
� Level 1 - valued using unadjusted quoted prices in active markets for those securities using the market approach.
� Level 2 - valued based on quoted prices for similar securities in active market or quoted prices for identical or similar securities inmarkets that are not active and a matrix pricing technique. The valuation techniques may include securities’ relationship to benchmark quoted prices and market corroborated inputs.
� Level 3 - valued based on a market comparable companies technique where inputs are obtained from various sources including market participants, dealers, and brokers.
(2) Equity securities are classified as follows:
� Level 1 - valued using unadjusted quoted prices in active markets for those securities using the market approach.
� Level 2 - valued using significant other observable inputs.
� Level 3 – valued using unobservable inputs and may include assumptions of management. They are valued based on long-dated commodity swaps whose forward pace curve was correlated with observable market data or shares of a privately held company whose value was based on projected cash flows.
(3) Virginia Resources Authority (major) and the following nonmajor component units reported investments at fair value established using the NAV: Virginia Polytechnic Institute and State University, Virginia Commonwealth University (VCU), Virginia Commonwealth University Health System Authority (blended component unit of VCU), College of William and Mary, Virginia Military Institute, and Virginia Biotechnology Research Partnership Authority. Additional information is available in the individually published financial statements.

102 Commonwealth of Virginia
Securities Lending
The State Treasury’s securities lending program is managed by Deutsche Bank AG, New York (Deutsche Bank), under a contract dated March 28, 2014. The enabling legislation for the securities lending program is Section 2.2-4506 of Chapter 45 of the Code of Virginia,as amended. No violations of legal or contractual provisions were noted during the year. The general account participated in a securities lending program for the entire year.
All securities lending loans are on an open-ended or one-day basis and may be terminated by the State Treasury with a 24-hour notice or are term loans with the right of substitution. While all securities may be recalled on a daily basis, securities are often on loan for much longer periods. Generally cash reinvestments security maturities do not match the maturities of loans. Per the contract with Deutsche Bank, all cash collateral reinvestment securities attributable to loans made on the Commonwealth’s behalf shall be maintained by Deutsche Bank, and the State Treasury cannot pledge or sell such collateral absent a default.
The State Treasury’s contract with Deutsche Bank provides for loss indemnification against insolvency default with respect to lending transactions and in the case of reverse transactions (Repurchase Agreements)as defined in the applicable Agency Securities Lending and Repurchase Agreement. Additionally, Deutsche Bank AG is liable for any losses experienced from reinvestment of cash collateral in investments not authorized by the provisions of the investment guidelines for the Commonwealth of Virginia agreed upon by both parties and made a part of the Agency Securities Lending and Repurchase Agreement. There were no realized losses resulting from default during this reporting period.
When securities are loaned, the collateral received is at least 100.0 percent of fair value of the securities loaned and must be maintained at 100.0 percent or greater. There are no stated restrictions on the amount of securities that may be loaned, but the basic composition of the general account portfolio effectively restricts the maximum percentage of the portfolio that may be loaned. During the past fiscal year, approximately 4.3percent of the general account securities were on loan.
During the past year, a combination of U.S. Treasury, agency, agency mortgage and corporate securities have been loaned, with the majority of the loaned securities being U.S. Treasury and agency securities. At June 30, 2016, all collateral received was in the form of cash.
Securities loaned for the State Treasurer’s cash collateral reinvestment pool, which consisted of 50.6percent general account funds and 49.4 percent Virginia Lottery funds as of June 30, 2016, had a carrying value of $50.0 million and a fair value of $69.4 million. The fair value of the collateral received was $70.7 million providing for coverage of 101.9 percent. At year-end, the State Treasury’s securities lending program had no credit risk exposure to borrowers because the amounts it owed the borrowers exceeded the amounts the
borrowers owed Treasury’s securities lending program.All securities are marked to market daily. The carrying value of the cash collateral reinvestment pool received was $70.7 million and the fair value of the investments purchased with the cash collateral was $70.7 million. As of June 30, 2016, the State Treasurer’s cash collateral reinvestment pool had an unrealized gain of $262, and is recorded in the General Fund as stated in Note 1.DD. This amount is included in the total State Treasurer’s Portfolio discussed earlier in this note.
Cash collateral reinvestment guidelines were amended effective April 16, 2014. Approved investment instruments include Indemnified Repurchase Agreements marked to market daily and preapproved Government Money Market Funds. Term repurchase agreements are limited to 93 days. At June 30, 2016,100.0 percent of cash collateral reinvestments were in indemnified repurchase agreements.
At June 30, 2016, the cash collateral reinvestment portfolio had a weighted average maturity, expected maturity and final maturity of one day.
At June 30, 2016 the cash collateral reinvestmentportfolio was in compliance with the State Treasury’s current cash collateral reinvestment guidelines. During the fiscal year, Treasury received final pay downs on all securities that were out of compliance due to various security ratings downgrades during the past few years and the adoption of more restrictive reinvestment guidelines in 2014.
Under authorization of the Board, the Virginia Retirement System (the System) lends its fixed income and equity securities to various broker-dealers on a temporary basis. This program is administered through an agreement with the System’s custodial agent bank. All security loan agreements are collateralized by cash, securities, or an irrevocable letter of credit issued by a major bank, and have a market value equal to at least 102.0 percent of the market value for domestic securities and 105.0 percent for international securities. Securities received as collateral cannot be pledged or sold by the System unless the borrower defaults.Contracts require the lending agents to indemnify the System if the borrowers fail to return the securities lent and related distributions and if the collateral is inadequate to replace the securities lent. All securities loans can be terminated on demand by either the System or the borrowers. The majority of loans are open loans, meaning the rebate is set daily. This results in a maturity of one or two days on average, although securities are often on loan for longer periods. The maturity of loans generally does not match the maturity of collateral investments, which averages 14 days. At year-end, the System has no credit risk exposure to borrowers because the amounts it owes the borrowers exceeded the amounts the borrowers owe the System.All securities are marked to market daily and carried at market value. The market value of securities on loan at June 30, 2016, was $8.3 billion. The June 30, 2016,balance was composed of U.S. Government and agency securities of $2.6 billion, corporate and other bonds of $1.7 billion and common and preferred stocks

Commonwealth of Virginia 103
of $4.0 billion. The value of collateral (cash and non-cash) at June 30, 2016, was $8.7 billion.
At June 30, 2016, the invested cash collateral had a cost of $5.0 billion and was composed of time deposits of $85.1 million, floating rate notes of $3.3 billion, mutual and money market funds of $872.2 million, and repurchase agreements of $774.1 million.

104 Commonwealth of Virginia
7. RECEIVABLES
The following schedule (dollars in thousands) details the accounts, loans, local school bonds, interest, taxes, prepaid tuition contributions, security transactions, and other receivables presented in the major funds, aggregated nonmajor funds by type, internal service funds, fiduciary funds, major component units, and aggregated nonmajor component units, as of June 30, 2016.
Primary Government: General $ 1,050,212 $ 233 $ - $ 373,255 $ 1,873,833 Major Special Revenue Funds: Commonw ealth Transportation 143,493 160,134 - - 184,587 Federal Trust 818,946 228 - - - Literary 289,044 137,359 - 38,463 - Nonmajor Governmental Funds 126,544 35 - 13,525 7,239 Major Enterprise Funds: Virginia Lottery 63,070 - - - - Virginia College Savings Plan 11,853 - - 4,337 - Unemployment Compensation 136,092 - - - - Nonmajor Enterprise Funds 52,720 - - - - Internal Service Funds 10,292 - - - - Private Purpose Trust Funds 93 2 - 2,282 - Pension and Other Employee Benefit Trust Funds (1) 236,774 - - 219,464 - Investment Trust Fund - - - 1,097 - Agency Funds 602 - - - 108,327 Total Primary Government (2) $ 2,939,735 $ 297,991 $ - $ 652,423 $ 2,173,986
Discrete Component Units: Virginia Housing Development Authority (3) $ - $ 6,554,553 $ - $ 30,803 $ - Virginia Public School Authority (4) - - 3,402,283 63,043 - Virginia Resources Authority - 4,391,211 - 29,834 - Virginia College Building Authority - - - 24,252 - Nonmajor Component Units (5) 1,692,914 154,794 - 5,472 7,504 Total Component Units $ 1,692,914 $ 11,100,558 $ 3,402,283 $ 153,404 $ 7,504
AccountsReceivable
TaxesReceivable
MortgageReceivable
Loans / Interest
ReceivableBonds
Receivable
SchoolLocal
Note (1): In the Pension and Other Employee Benefit Trust Funds, Interest Receivable of $219,464 (dollars in thousands) also includes dividends receivable. Additionally, Other Receivables of $327,144 (dollars in thousands) are made up of $319,098 (dollars in thousands) in pending investment transactions, which includes $282,903 (dollars in thousands) in futures margins receivable,$32,881 (dollars in thousands) in futures contracts receivable, and $3,314 (dollars in thousands) in securities lending; and $8,046(dollars in thousands) in other receivables related to benefit plans.
Note (2): Fiduciary net receivables in the amount of $2,056,037 (dollars in thousands) are not included in the Government-wide Statement of Net Position.
Note (3): The Virginia Housing Development Authority (major component unit) reports $6,284,707 (dollars in thousands) as Restricted Loans Receivable, $28,995 (dollars in thousands) as Restricted Interest Receivable, and $1,584 (dollars in thousands) as Restricted Other Receivables.
Note (4): The Virginia Public School Authority (major component unit) reports $3,402,283 (dollars in thousands) as Local School Bonds Receivable. This amount will be used to repay the Authority’s bonds.
Note (5): Other Receivables of the nonmajor component units are primarily comprised of pledges receivable of $15,840 (dollars in thousands) reported by the University of Virginia; sponsors accounts receivable of $27,433 (dollars in thousands) reported by Virginia Commonwealth University; premium receivables of $84,918 (dollars in thousands) and third-party settlements and non-patient receivables of $45,095 (dollars in thousands) reported by Virginia Commonwealth University Health System Authority (blended component unit of Virginia Commonwealth University), and $54,932 (dollars in thousands) reported by foundations of the higher education institutions representing FASB reporting entities defined in Note 1.B.; and $24,725 (dollars in thousands) reported by the Virginia Biotechnology Research Partnership Authority.

Commonwealth of Virginia 105
$ - $ - $ - $ (1,537,171) $ 1,760,362 $ 401,143
- - - (34,112) 454,102 164,494- - - (7,678) 811,496 180- - - (293,283) 171,583 120,950- - - (88,714) 58,629 424
- - - - 63,070 -198,759 - - - 214,949 152,005
- - - (28,014) 108,078 -- - 13 (1,113) 51,620 -- - - (615) 9,677 -- - 308 - 2,685 -- 1,211,865 327,144 - 1,995,247 -- - - - 1,097 -- - - (51,921) 57,008 8,290
$ 198,759 $ 1,211,865 $ 327,465 $ (2,042,621) $ 5,759,603 $ 847,486
$ - $ - $ 11,992 $ (178,122) $ 6,419,226 $ 6,026,690- - - - 3,465,326 3,146,746- - 1,768 (326) 4,422,487 4,120,639- - - - 24,252 -- - 350,100 (872,009) 1,338,775 216,871
$ - $ - $ 363,860 $ (1,050,457) $ 15,670,066 $ 13,510,946
SecurityTransactions
TuitionContributions
ReceivableAccounts
Receivable
Amountsto be Collected
Greater thanOne Year
OtherReceivables
forDoubtfulAccounts
AllowanceNet
Prepaid

106 Commonwealth of Virginia
8. CONTRIBUTIONS RECEIVABLE, NET
The following schedule details the contributions receivable for foundations(1) included with the nonmajor component units, as of June 30, 2016. The major component units reported no contributions receivable for fiscal year 2016.
(Dollars in Thousands)
Discrete Component Units: Nonmajor Component Units $ 152,158 $ 221,020 $ 61,069 $ 434,247 $ (23,069) $ (24,858) $ 386,320 Total Component Units $ 152,158 $ 221,020 $ 61,069 $ 434,247 $ (23,069) $ (24,858) $ 386,320
Due
Subtotal
Allowance
Accounts
Due inMore Than Five Years
Between
NetDiscount (2)
for Contributions Value Doubtful Receivable,
PresentDue in
One YearLess Than
Five YearsOne and
Note (1): Foundations represent FASB reporting entities defined in Note 1.B.Note (2): The discount rate used to determine present value ranges from 0.1 percent to 6.0 percent.
9. INTERFUND AND INTER-ENTITY ASSETS / LIABILITIES
Due from/to Other Funds
Due from Other Funds are amounts to be received from one fund by another fund for goods sold or services rendered. Due to Other Funds are amounts owed by one fund to another fund for goods purchased or services obtained.
The following line items are included in the category “Due from Other Funds”:
� Due from Other Funds� Due from Internal Parties (Governmental Funds
and Business-type Activities)� Due from External Parties (Fiduciary Funds)
The following line items are included in the category “Due to Other Funds”:
� Due to Other Funds� Due to Internal Parties (Governmental Funds and
Business-type Activities)� Due to External Parties (Fiduciary Funds)
The following schedule shows the Due from/to Other Funds as of June 30, 2016.

Commonwealth of Virginia 107
(Dollars in Thousands)
Due From Due To
Primary Government Primary Government
General Fund $ 77,181 Major Special Revenue Funds:Federal Trust $ 145
Major Enterprise Funds:Virginia Lottery 53,486
Nonmajor Enterprise Funds 22,439Internal Service Funds 1,111
Major Special Revenue Funds:Federal Trust 2,762 General Fund 78
Major Enterprise Funds:Unemployment Compensation 2,684
Nonmajor Governmental Funds 6,822 Major Special Revenue Funds:Commonw ealth Transportation 2,349Federal Trust 2,974
Nonmajor Governmental Funds 900Major Enterprise Funds:
Unemployment Compensation 149Nonmajor Enterprise Funds 446Internal Service Funds 4
Major Enterprise Funds:Unemployment Compensation 494 General Fund 315
Major Special Revenue Funds:Commonw ealth Transportation 9Federal Trust 92
Nonmajor Governmental Funds 73Major Enterprise Funds:
Virginia Lottery 1Nonmajor Enterprise Funds 4
Nonmajor Enterprise Funds 808 General Fund 124Major Special Revenue Funds:
Commonw ealth Transportation 416Federal Trust 110
Nonmajor Governmental Funds 121Nonmajor Enterprise Funds 23Internal Service Funds 14
Internal Service Funds 50,970 General Fund 29,005Major Special Revenue Funds:
Commonw ealth Transportation 8,288Federal Trust 6,326
Nonmajor Governmental Funds 3,956Major Enterprise Funds:
Virginia Lottery 435Virginia College Savings Plan 67
Nonmajor Enterprise Funds 2,108Internal Service Funds 785
Pension and Other Employee Benefit Trust Funds 25 Private Purpose Trust Funds 25Total Primary Government $ 139,062 Total Primary Government $ 139,062
Schedule of Due from/to Other FundsJune 30, 2016
Amount Amount

108 Commonwealth of Virginia
(Dollars in Thousands)
Due From Due To
Primary Government Primary Government
General Fund $ 1 Investment Trust Fund $ 1
Nonmajor Governmental Funds 168 Agency Funds 168
Internal Service Funds 13,887 Private Purpose Trust Funds 65Pension and Other Employee Benefit Trust Funds 13,822
Pension and Other Employee Benefit Trust Funds 30,237 General Fund 18,559Major Special Revenue Funds:
Commonw ealth Transportation 5,020Federal Trust 2,627
Nonmajor Governmental Funds 2,738Major Enterprise Funds:
Virginia Lottery 184Virginia College Savings Plan 68
Nonmajor Enterprise Funds 650Internal Service Funds 391
Total Primary Government $ 44,293 Total Primary Government $ 44,293
June 30, 2016
Amount Amount
Schedule of Due from/to Internal/External Parties
Interfund Receivables/Payables
Interfund Receivables/Payables are loans made by one fund to another.
The following schedule shows the Interfund Receivables/Payables for the primary government as of June 30, 2016. There were no Interfund Receivables/Payables for the component units as of June 30, 2016.
(Dollars in Thousands)
Receivable From: Payable To:Primary Government Primary Government
Nonmajor Governmental Funds $ 157,909 Major Special Revenue Funds:Federal Trust $ 23,135
Nonmajor Enterprise Funds 29,749Internal Service Funds 105,025
Total Primary Government $ 157,909 Total Primary Government $ 157,909
June 30, 2016
Amount Amount
Interfund Receivables/Payables

Commonwealth of Virginia 109
Due from/to Primary Government and Component Units
Included in this category is activity between the Commonwealth and its component units, as well as activity between component units.
A due from primary government amount that is due from the Federal Trust Fund (major special revenue) to the Virginia College Building Authority (major component unit) of $4.0 million is for interest on Build America Bonds (BABs).
An $83.4 million due from primary government amount that is due from the General Fund (major governmental) to the higher education institutions (nonmajor component units) is for the following: appropriationsavailable for capital projects and other programs of $83.1 million, and payments awaiting disbursements of $316,098. The General Fund reports $4.1 million in the fund financial statements and an additional $79.3 million in the government-wide financial statements.
A $38,591 due from primary government amount represents an amount due from a nonmajor governmental fund related to the Department of the Treasury’s reimbursement programs to the Virginia Community College System (nonmajor component unit).
A $30.0 million due from component units is due from the University of Virginia (nonmajor component unit) inthe amount of $15.5 million, and the Virginia Commonwealth University Health System Authority (blended component unit of Virginia Commonwealth University – nonmajor component unit) in the amount of $14.5 million, to the Department of Medical Assistance Services regarding a federal disallowance amount, and the entire General Fund amount is in the government-wide financial statements.
An $18.7 million due from component units in the Health Care Fund (internal service fund) represents amounts due from the nonmajor component units.
A $773,521 due from component units represents monies owed for administrative and project expenses from the Science Museum of Virginia Foundation (nonmajor component unit) to a nonmajor governmental fund. The entire nonmajor governmental amount is reported in the government-wide financial statements.
The $120.0 million due from component units amount represents amounts due from the Virginia College Building Authority (major component unit) for the Department of the Treasury’s reimbursement programs to higher education institutions (nonmajor component units). There is a due to component units of $3.2 million from a foundation of the Old Dominion University (nonmajor component unit) to the Virginia Commercial Space Flight Authority (nonmajor component unit).
Due from/to Component Units and Fiduciary Funds
A $38.6 million due from component units in the Pension and Other Employee Benefit Trust Funds (fiduciary funds) represents amounts due from nonmajor component units.
Loans Receivable/Payable Between Primary Government and Component Units
The College of William and Mary (nonmajor component unit) loan of $2.0 million was used to fund a capital project until bonds were issued. The George Mason University (nonmajor component unit) and the Virginia Community College System (nonmajor component unit)loans of $12.5 million and $4.4 million were used to advance fund federally-funded programs. These amounts are due to a nonmajor governmental fund.
The $193.9 million in loans receivable from primary government represents loans from the Virginia Public School Authority (VPSA) (major component unit) to the Literary Special Revenue Fund (major governmental fund). The VPSA makes grants to local school divisions to finance the purchase of educational technology equipment. The VPSA makes these grants using the proceeds of notes issued for that purpose, which will be repaid from appropriations to be made by the Virginia General Assembly from the Literary Special Revenue Fund (major governmental fund).

110 Commonwealth of Virginia
10. OTHER ASSETS
The following table summarizes Other Assets as of June 30, 2016.
(Dollars in Thousands)
TotalOther Other
Assets AssetsPrimary Government: General $ 809 $ - $ 809 Major Special Revenue Funds: Commonw ealth Transportation 415 - 415 Federal Trust 1,867 - 1,867 Nonmajor Governmental Funds 692 1,022 1,714 Major Enterprise Funds: Virginia Lottery 1 - 1 Nonmajor Enterprise Funds 209 - 209 Internal Service Funds (1) - 13,054 13,054 Agency Funds (2) - 49 49 Total Primary Government $ 3,993 $ 14,125 $ 18,118
Discrete Component Units: Virginia Housing Development Authority $ - $ 13,952 $ 13,952 Virginia Resources Authority - 299 299 Nonmajor Component Units (3) 2,521 86,544 89,065 Total Component Units $ 2,521 $ 100,795 $ 103,316
Cash andTravel
Advances
Note (1): Of the $13,054 (dollars in thousands) shown above, $11,915 (dollars in thousands) and $1,109 (dollars in thousands) represent Virginia Information Technologies Agency and Virginia Correctional Enterprises, respectively, amounts due from various governmental funds that will not be received within 60 days. These amounts are reclassified to an internal balance onthe Government-wide Statement of Net Position.
Note (2): Other Assets of the Agency Funds represent prepaid expenses and advances to third party agents. The $49 (dollars in thousands) shown above is not included in the Government-wide Statement of Net Position.
Note (3): Other Assets of the nonmajor component units are primarily comprised of debt issuance costs, goodwill, a derivative asset, and other miscellaneous items spread among the higher education institutions and related foundations.

Commonwealth of Virginia 111
11. RESTRICTED ASSETS
Restricted assets represent monies or other resources that must be used for specific legal or contractual requirements. The Commonwealth Transportation Fund (major special revenue), Debt Service Fund (nonmajor governmental), and Capital Project Fund (nonmajor governmental) reported $338.5 million in restricted assets related to bond agreements.
The Virginia Housing Development Authority, the Virginia Public School Authority, and the Virginia College Building Authority (all major component units) reported restricted assets totaling $1.6 billion, $174.2 million, and $373.4 million, respectively. These major component units’ assets are restricted for debt service under a bond indenture or other agreement, or for construction and equipment.
The Virginia Resources Authority (major component unit) reported restricted assets of $686.7 million. Of this amount, $679.0 million is restricted for loans to local governments, bond indentures, or federal and state regulations for various revolving funds, and $7.7 million is restricted for the Operating Reserve Fund for the Virginia Pooled Financing Program.
The Virginia Port Authority (nonmajor component unit) reported restricted assets of $148.2 million primarily for debt service under bond agreements, construction and other project funds.
The Tobacco Region Revitalization Commission (nonmajor component unit) reported restricted assets of $215.4 million to be used for financial aid to tobacco growers and to foster community economic growth.
The Hampton Roads Sanitation District Commission (nonmajor component unit) reported restricted assets of $91.6 million. Of this amount, $23.8 million is for debt service and $67.8 million is revenue bond construction funds.
The Virginia Small Business Financing Authority (nonmajor component unit) reported restricted assets of $37.7 million for gifts and grants.
The higher education institutions (nonmajor component units) reported restricted assets totaling approximately $4.6 billion primarily for endowment and other contractual obligations. Included in this amount is approximately $4.0 billion of foundations’ restricted assets. The two museum foundations, the Virginia Museum of Fine Arts Foundation (nonmajor component unit) and the Science Museum of Virginia Foundation (nonmajor component unit) had restricted assets of $244.0 million and $21.4 million, respectively, primarily for donor-imposed restricted endowments.
The remaining $5.2 million is spread among the following nonmajor component units: the Virginia Outdoors Foundation, the Danville Science Center, the Fort Monroe Authority, the Virginia Arts Foundation, and the Library of Virginia Foundation.

112 Commonwealth of Virginia
12. CAPITAL ASSETS
The following schedule presents the changes in the Capital Assets as of June 30, 2016.
Governmental Activities(Dollars in Thousands)
Increases DecreasesNondepreciable Capital Assets:Land $ 2,940,964 $ 211,460 $ (50,836) $ 3,101,588Water Rights and/or Easements 69,770 5,558 - 75,328Infrastructure 322,741 - - 322,741Construction-in-Progress 4,001,765 1,958,541 (1,590,135) 4,370,171 Total Nondepreciable Capital Assets 7,335,240 2,175,559 (1,640,971) 7,869,828
Depreciable Capital Assets:Buildings 4,022,494 20,031 (17,212) 4,025,313Equipment 1,163,187 59,757 (25,781) 1,197,163Infrastructure 32,695,809 1,797,719 (299,329) 34,194,199Softw are 499,043 27,151 - 526,194 Total Capital Assets being Depreciated 38,380,533 1,904,658 (342,322) 39,942,869
Less Accumulated Depreciation for:Buildings 1,389,551 95,078 (12,186) 1,472,443Equipment 677,019 56,665 (19,017) 714,667Infrastructure 14,038,825 906,282 (19,668) 14,925,439Softw are 252,825 33,453 (1,517) 284,761 Total Accumulated Depreciation 16,358,220 1,091,478 (52,388) 17,397,310
Total Depreciable Capital Assets, Net 22,022,313 813,180 (289,934) 22,545,559
Total Capital Assets, Net $ 29,357,553 $ 2,988,739 $ (1,930,905) $ 30,415,387
Schedule of Changes in Capital Assets
June 30Balance
BalanceJuly 1,
as restated (1)
Note (1): Beginning balances have been restated by $9.7 million as discussed in Note 2.
(Dollars in Thousands)
Governmental Activities:General Government $ 28,498Education 12,679Transportation 937,019Resources and Economic Development 24,745Individual and Family Services 25,403Administration of Justice 46,094Capital Assets held by the Internal Service Funds are charged to various functions 17,040 Total $ 1,091,478
Depreciation Expense Charged to Functions of the Primary GovernmentJune 30, 2016

Commonwealth of Virginia 113
(Dollars in Thousands)
Increases DecreasesNondepreciable Capital Assets:Land $ 1,977 $ - $ - $ 1,977Construction-in-Progress 4,602 789 (3,851) 1,540 Total Nondepreciable Capital Assets 6,579 789 (3,851) 3,517
Depreciable Capital Assets:Buildings 30,784 78 (112) 30,750Equipment 65,580 3,830 (1,958) 67,452Softw are 7,039 4,304 (181) 11,162 Total Capital Assets being Depreciated 103,403 8,212 (2,251) 109,364
Less Accumulated Depreciation for:Buildings 13,146 572 - 13,718Equipment 53,431 4,656 (1,942) 56,145Softw are 3,178 1,588 (67) 4,699 Total Accumulated Depreciation 69,755 6,816 (2,009) 74,562
Total Depreciable Capital Assets, Net 33,648 1,396 (242) 34,802
Total Capital Assets, Net $ 40,227 $ 2,185 $ (4,093) $ 38,319
Schedule of Changes in Capital AssetsBusiness-type Activities
BalanceJune 30July 1
Balance

114 Commonwealth of Virginia
(Dollars in Thousands)
Increases DecreasesNondepreciable Capital Assets:Land $ 600,210 $ 16,490 $ (5,345) $ 611,355 $ 294,959 $ 906,314Construction-in-Progress 1,671,305 1,366,995 (1,566,508) 1,471,792 37,991 1,509,783Inexhaustible Works of Art/Historical Treasures 78,508 2,490 - 80,998 19,713 100,711Livestock 1,168 - (571) 597 2,065 2,662 Total Nondepreciable Capital Assets 2,351,191 1,385,975 (1,572,424) 2,164,742 354,728 2,519,470
Depreciable Capital Assets:Buildings 14,741,600 1,189,587 (33,665) 15,897,522 1,212,396 17,109,918Infrastructure 3,311,062 256,657 (5,928) 3,561,791 6,196 3,567,987Equipment 3,421,861 289,461 (220,351) 3,490,971 156,023 3,646,994Improvements Other Than Buildings 509,677 29,436 (3,116) 535,997 80,773 616,770Library Books 833,428 24,260 (10,833) 846,855 - 846,855Softw are 436,779 40,356 (1,499) 475,636 - 475,636Other Intangible Assets 2,000 - - 2,000 - 2,000 Total Capital Assets being Depreciated 23,256,407 1,829,757 (275,392) 24,810,772 1,455,388 26,266,160
Less Accumulated Depreciation for:Buildings 4,715,850 422,115 (21,212) 5,116,753 330,777 5,447,530Infrastructure 1,504,299 93,124 (5,666) 1,591,757 3,215 1,594,972Equipment 2,302,726 248,559 (166,183) 2,385,102 106,120 2,491,222Improvements Other Than Buildings 302,852 21,720 (1,841) 322,731 53,010 375,741Library Books 707,498 30,516 (8,635) 729,379 - 729,379Softw are 326,847 44,451 (1,476) 369,822 - 369,822Other Intangible Assets 1,467 133 - 1,600 - 1,600 Total Accumulated Depreciation 9,861,539 860,618 (205,013) 10,517,144 493,122 11,010,266
Total Depreciable Capital Assets, Net 13,394,868 969,139 (70,379) 14,293,628 962,266 15,255,894
Total Capital Assets, Net $ 15,746,059 $ 2,355,114 $ (1,642,803) $ 16,458,370 $ 1,316,994 $ 17,775,364
Schedule of Changes in Capital Assets
June 30Total
Foundations (2)
Component Units
SubtotalJune 30
BalanceJuly 1 (1)
Note (1): There have been reclassifications in beginning balances of certain line items above. Note (2): Foundations represent FASB reporting entities defined in Note 1.B. Since foundations follow FASB rather than GASB reporting
requirements, no amounts are reported in the software and other intangible assets categories for foundations.

Commonwealth of Virginia 115
13. DEFERRED OUTFLOWS AND DEFERRED INFLOWS OF RESOURCES
GASB Statement No. 65, Items Previously Reported as Assets and Liabilities, requires certain items to be classified as either deferred outflows or deferred inflows of resources. Additionally, deferred outflows or deferred inflows of resources are also required by other GASB statements. While all deferred outflows or deferred inflows of resources applicable to the Commonwealth are listed below, see Notes 14, 15, and 36 for additionalinformation regarding these items.
Deferred Outflows
Deferred outflows of resources are a consumption of assets by the government that is applicable to a future reporting period.
Deferred Inflows
Deferred inflows of resources are an acquisition of assets by the government that is applicable to a future reporting period.
The following tables summarize deferred outflows and deferred inflows of resources as of June 30, 2016.
Government-wide Statements
(Dollars in Thousands)
Deferred Outflows of ResourcesEffective Hedges in a Loss Position $ - $ - $ - $ 22,933Loss on Refunding of Debt 75,896 - 75,896 433,468Pension Related 655,383 17,903 673,286 350,504
Total Deferred Outf low s of Resources $ 731,279 $ 17,903 $ 749,182 $ 806,905
Deferred Inflows of ResourcesEffective Hedges in a Gain Position $ - $ - $ - $ 2,466Service Concession Arrangements 2,142,066 - 2,142,066 70,161Gain on Refunding of Debt - - - 35,035Pension Related 432,869 9,967 442,836 239,499
Total Deferred Inflow s of Resources $ 2,574,935 $ 9,967 $ 2,584,902 $ 347,161
UnitsBusiness-type Component
TotalGovernmental
Primary Government
Activities Activities Total
Fund Statements
(Dollars in Thousands)
Deferred Outflows of Resources Total Deferred Outf low s of Resources $ - $ - $ - $ - $ - $ -
Deferred Inflows of ResourcesRevenues Considered Unavailable $ 967,818 $ 49,020 $ 85,467 $ 22,452 $ 26,971 $ 1,151,728
Total Deferred Inflow s of Resources $ 967,818 $ 49,020 $ 85,467 $ 22,452 $ 26,971 $ 1,151,728
Nonmajor
Literary
Primary Government - Governmental Funds
Total
General Transportation Trust Funds FundsCommonwealth Federal Governmental Governmental
(Continued on next page)

116 Commonwealth of Virginia
Fund Statements (continued from previous page)
(Dollars in Thousands)
Deferred Outflows of ResourcesEffective Hedges in a Loss Position $ - $ - $ - $ - $ - $ -Loss on Refunding of Debt - - - - - -Pension Related 4,454 1,833 11,616 17,903 6,495 506
Total Deferred Outf low s of Resources $ 4,454 $ 1,833 $ 11,616 $ 17,903 $ 6,495 $ 506
Deferred Inflows of ResourcesEffective Hedges in a Gain Position $ - $ - $ - $ - $ - $ -Service Concession Arrangements - - - - - -Gain on Refunding of Debt - - - - - -Pension Related 2,026 758 7,183 9,967 5,820 258
Total Deferred Inflow s of Resources $ 2,026 $ 758 $ 7,183 $ 9,967 $ 5,820 $ 258
College Business- InternalService
Lottery Plan Nonmajor ActivitiesVirginia Savings type
Virginia Total PrivatePurpose
TrustFundsFunds
Business-type ActivitiesEnterprise Funds
(Dollars in Thousands)
Deferred Outflows of ResourcesEffective Hedges in a Loss Position $ - $ - $ - $ 22,933 $ 22,933Loss on Refunding of Debt 138,112 83,002 27,544 184,810 433,468Pension Related - 99 - 350,405 350,504
Total Deferred Outf low s of Resources $ 138,112 $ 83,101 $ 27,544 $ 558,148 $ 806,905
Deferred Inflows of ResourcesEffective Hedges in a Gain Position $ - $ - $ - $ 2,466 $ 2,466Service Concession Arrangements - - - 70,161 70,161Gain on Refunding of Debt - 26,778 - 8,257 35,035Pension Related - 30 - 239,469 239,499
Total Deferred Inflow s of Resources $ - $ 26,808 $ - $ 320,353 $ 347,161
UnitsSchool Resources Building Component Component
Authority Authority Authority Units
Component UnitsVirginia VirginiaPublic Virginia College Nonmajor Total

Commonwealth of Virginia 117
14. DERIVATIVES
GASB Statement No. 53, Accounting and Financial Reporting for Derivative Instruments, requires additional reporting and disclosures for derivative instruments.
Primary Government
Derivative instruments are financial contracts whose values depend on the values of one or more underlying assets, reference rates or financial indexes. They include futures, forwards, options and swap contracts. Some traditional securities, such as structured notes, can have derivative-like characteristics. In this case, the return may be linked to one or more indexes and asset-backed securities, such as collateralized mortgage obligations (CMOs), which are sensitive to changes in interest rates and pre-payments. Futures, forwards, options and swaps generally are not recorded on the financial statements, whereas structured notes and asset-backed investments generally are recorded.
Virginia College Savings Plan (Virginia529)
GASB Statement No. 53 defines stable value investment vehicles as synthetic guaranteed investment contracts. Stable value funds are invested in a high quality, diversified, intermediate term, fixed income portfolio that is protected against interest rate volatility by wrap or investment contracts from banks and insurance companies that guarantee the payment of benefits at book value (cost plus accrued interest), which enables the entire investment to be carried at its book value. The Virginia529 utilizes stable value investments in both the Virginia529 prePAID Program (major enterprise fund) and Virginia529 inVEST Fund (Private Purpose Trust Fund). Virginia529’s stable value investments meet the definition of fully benefit-responsive synthetic guaranteed investment contracts and are reported at contract value. At June 30, 2016,Virginia529 had the following stable value investments outstanding (dollars in thousands) in the respective programs as shown in the table below.
Fund Wrap Provider Effective
Date Maturity Date Credit
Rate Enterprise American General Life $ 28,391 2/21/2014 Open ended 1.7% $ 118,683 $ 120,898
RGA 28,376 6/22/2016 Open ended 2.3%Voya Retirement & Annuity 29,420 12/3/2002 Open ended 2.4%State Street Bank 28,375 5/1/2002 Open ended 2.7%
Private Purpose American General Life $ 133,505 1/16/2014 Open ended 1.4% $ 690,820 $ 666,733Voya Retirement & Annuity 27,490 12/3/2002 Open ended 3.2%Voya Retirement & Annuity 107,734 10/5/2012 Open ended 1.6%Prudential Retirement Insurance & Annuity 134,869 1/30/2014 Open ended 2.1%RGA 133,498 8/28/2015 Open ended 2.0%State Street Bank 134,702 5/1/2002 Open ended 2.1%
Notional Amount
June 30, 2016Fair Value
June 30, 2015Fair Value
Stable Value Investments
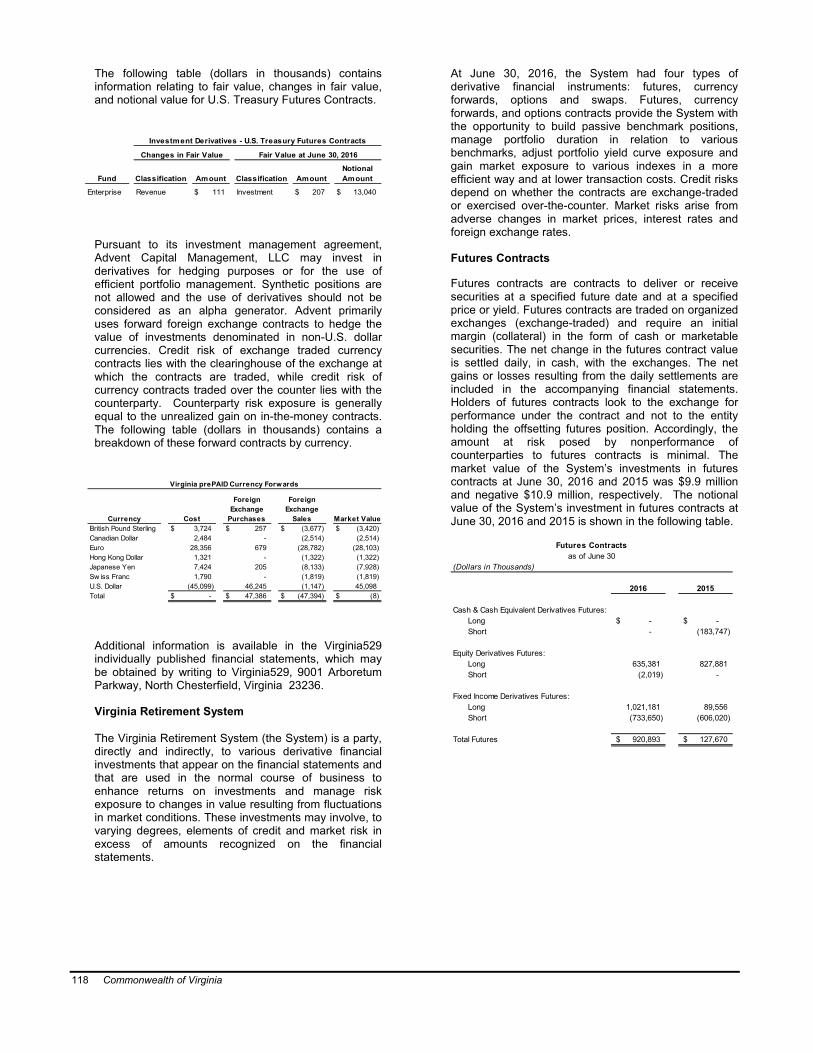
118 Commonwealth of Virginia
The following table (dollars in thousands) contains information relating to fair value, changes in fair value, and notional value for U.S. Treasury Futures Contracts.
Fund Classification Classification
Enterprise Revenue $ 111 Investment $ 207 $ 13,040
Changes in Fair Value
Amount Amount
Fair Value at June 30, 2016
Investment Derivatives - U.S. Treasury Futures Contracts
Notional Amount
Pursuant to its investment management agreement, Advent Capital Management, LLC may invest in derivatives for hedging purposes or for the use of efficient portfolio management. Synthetic positions are not allowed and the use of derivatives should not be considered as an alpha generator. Advent primarily uses forward foreign exchange contracts to hedge the value of investments denominated in non-U.S. dollar currencies. Credit risk of exchange traded currency contracts lies with the clearinghouse of the exchange at which the contracts are traded, while credit risk of currency contracts traded over the counter lies with the counterparty. Counterparty risk exposure is generally equal to the unrealized gain on in-the-money contracts. The following table (dollars in thousands) contains a breakdown of these forward contracts by currency.
CurrencyBritish Pound Sterling $ 3,724 $ 257 $ (3,677) $ (3,420)Canadian Dollar 2,484 - (2,514) (2,514)Euro 28,356 679 (28,782) (28,103)Hong Kong Dollar 1,321 - (1,322) (1,322)Japanese Yen 7,424 205 (8,133) (7,928)Sw iss Franc 1,790 - (1,819) (1,819)U.S. Dollar (45,099) 46,245 (1,147) 45,098Total $ - $ 47,386 $ (47,394) $ (8)
Virginia prePAID Currency Forwards
Cost
Foreign Exchange
Purchases Market Value
Foreign Exchange
Sales
Additional information is available in the Virginia529 individually published financial statements, which may be obtained by writing to Virginia529, 9001 Arboretum Parkway, North Chesterfield, Virginia 23236.
Virginia Retirement System
The Virginia Retirement System (the System) is a party, directly and indirectly, to various derivative financial investments that appear on the financial statements and that are used in the normal course of business toenhance returns on investments and manage risk exposure to changes in value resulting from fluctuations in market conditions. These investments may involve, to varying degrees, elements of credit and market risk in excess of amounts recognized on the financial statements.
At June 30, 2016, the System had four types of derivative financial instruments: futures, currency forwards, options and swaps. Futures, currency forwards, and options contracts provide the System with the opportunity to build passive benchmark positions, manage portfolio duration in relation to various benchmarks, adjust portfolio yield curve exposure and gain market exposure to various indexes in a more efficient way and at lower transaction costs. Credit risks depend on whether the contracts are exchange-traded or exercised over-the-counter. Market risks arise from adverse changes in market prices, interest rates and foreign exchange rates.
Futures Contracts
Futures contracts are contracts to deliver or receive securities at a specified future date and at a specified price or yield. Futures contracts are traded on organized exchanges (exchange-traded) and require an initial margin (collateral) in the form of cash or marketable securities. The net change in the futures contract value is settled daily, in cash, with the exchanges. The net gains or losses resulting from the daily settlements are included in the accompanying financial statements. Holders of futures contracts look to the exchange for performance under the contract and not to the entity holding the offsetting futures position. Accordingly, the amount at risk posed by nonperformance of counterparties to futures contracts is minimal. The market value of the System’s investments in futures contracts at June 30, 2016 and 2015 was $9.9 million and negative $10.9 million, respectively. The notional value of the System’s investment in futures contracts at June 30, 2016 and 2015 is shown in the following table.
(Dollars in Thousands)
2016 2015
Cash & Cash Equivalent Derivatives Futures:Long -$ -$Short - (183,747)
Equity Derivatives Futures:Long 635,381 827,881Short (2,019) -
Fixed Income Derivatives Futures:Long 1,021,181 89,556Short (733,650) (606,020)
Total Futures 920,893$ 127,670$
Futures Contractsas of June 30

Commonwealth of Virginia 119
Currency Forwards
Currency forwards represent foreign exchange contracts and are used by the System to effect settlements and to protect the base currency ($US) value of portfolio assets denominated in foreign currencies against fluctuations in the exchange rates of those currencies. A forward foreign currency exchange contract is a commitment to purchase or sell a foreign currency at a future date at a negotiated price. The credit risk of currency contracts that are exchange-traded lies with the clearinghouse of
the exchange where the contracts are traded. The credit risk of currency contracts traded over-the-counter lies with the counterparty, and exposure usually is equal to the unrealized profit on in-the-money contracts. The market risk in foreign currency contracts is related to adverse movements in currency exchange rates. Information on the System’s currency forwards contracts at June 30, 2016 and 2015 is shown in the following table.
(Dollars in Thousands)Pending PendingForeign Foreign Exchange Exchange Fair Value Fair Value
Currency Cost Purchases Sales 2016 2015Argentine Peso 2,320$ 2,302$ -$ 2,302$ -$Australian Dollar (292,607) 182,514 (473,459) (290,945) (222,487)Brazil Real (40,627) 9,773 (52,000) (42,227) (57,527)British Pound Sterling (832,753) 363,019 (1,168,566) (805,547) (1,050,547)Canadian Dollar (473,519) 205,071 (678,116) (473,045) (566,277)Chilean Peso (3,282) 1,606 (4,964) (3,358) 319Chinese Yuan Renminbi (46,791) 638 (46,969) (46,331) -Colombian Peso 8,385 8,918 (194) 8,724 (7,814)Czech Koruna (23,683) - (23,679) (23,679) -Danish Krone (69,336) 52,808 (121,681) (68,873) (94,319)Euro Currency Unit (1,417,991) 395,667 (1,793,541) (1,397,874) (1,037,892)Hong Kong Dollar (126,132) 13,546 (139,681) (126,135) (166,460)Hungarian Forint (14,200) 8,120 (22,431) (14,311) 1,083Indian Rupee 12,449 25,553 (13,122) 12,431 19,477Indonesian Rupiah 1,431 9,785 (11,112) (1,327) 1,057Israeli Shekel (68,884) 10,140 (79,210) (69,070) (69,449)Japanese Yen (697,641) 278,767 (972,110) (693,343) (1,052,403)Malaysian Ringgit 24,839 28,117 (2,581) 25,536 15,840Mexican Peso 32,716 44,500 (11,215) 33,285 10,738Moroccan Dirham 12,417 12,478 - 12,478 -New Taiw an Dollar (10,780) - (10,961) (10,961) -New Turkish Lira 1,591 12,936 (11,262) 1,674 4,646New Zealand Dollar (58,895) 104,421 (164,592) (60,171) (127,251)Norw egian Krone (69,448) 166,245 (235,000) (68,755) 68,428Peruvian Nuevo Sol 3,338 3,345 - 3,345 2,345Philippine Peso 7,624 8,237 (616) 7,621 8,733Polish Zloty 8,217 31,372 (23,941) 7,431 7,278Romanian Leu (1,663) 80 (1,719) (1,639) (1,630)Russian Ruble 17,402 20,938 (3,187) 17,751 (5,981)Saudi Arabian Riyal (5,462) - (5,572) (5,572) -Singapore Dollar (188,111) 157,502 (347,958) (190,456) (253,062)South African Rand (5,542) 15,351 (21,129) (5,778) (2,081)South Korean Won 686 11,883 (11,452) 431 (23,077)Sw edish Krona (101,805) 117,325 (218,539) (101,214) (158,286)Sw iss Franc (369,479) 10,415 (379,769) (369,354) (293,002)Thai Baht 17,782 20,642 (2,887) 17,755 7,426U.S. Dollar 4,770,298 7,039,144 (2,268,846) 4,770,298 5,037,287
Total Forw ards Subject to Foreign Currency Risk 51,097$ (4,888)$
Currency Forwardsas of June 30
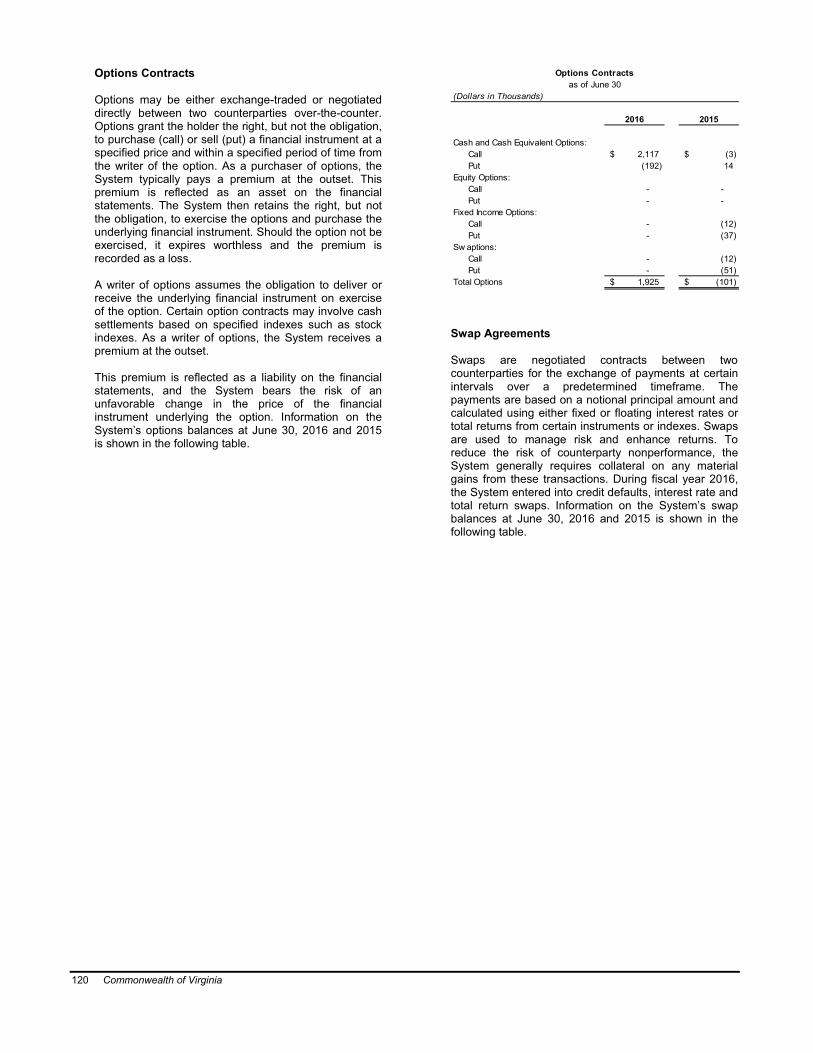
120 Commonwealth of Virginia
Options Contracts
Options may be either exchange-traded or negotiated directly between two counterparties over-the-counter. Options grant the holder the right, but not the obligation, to purchase (call) or sell (put) a financial instrument at a specified price and within a specified period of time from the writer of the option. As a purchaser of options, the System typically pays a premium at the outset. This premium is reflected as an asset on the financial statements. The System then retains the right, but not the obligation, to exercise the options and purchase the underlying financial instrument. Should the option not be exercised, it expires worthless and the premium is recorded as a loss.
A writer of options assumes the obligation to deliver or receive the underlying financial instrument on exercise of the option. Certain option contracts may involve cash settlements based on specified indexes such as stock indexes. As a writer of options, the System receives a premium at the outset.
This premium is reflected as a liability on the financial statements, and the System bears the risk of an unfavorable change in the price of the financial instrument underlying the option. Information on the System’s options balances at June 30, 2016 and 2015is shown in the following table.
(Dollars in Thousands)
2016 2015
Cash and Cash Equivalent Options:Call 2,117$ (3)$Put (192) 14
Equity Options:Call - -Put - -
Fixed Income Options:Call - (12)Put - (37)
Sw aptions:Call - (12)Put - (51)
Total Options 1,925$ (101)$
Options Contractsas of June 30
Swap Agreements
Swaps are negotiated contracts between two counterparties for the exchange of payments at certain intervals over a predetermined timeframe. The payments are based on a notional principal amount and calculated using either fixed or floating interest rates or total returns from certain instruments or indexes. Swapsare used to manage risk and enhance returns. To reduce the risk of counterparty nonperformance, the System generally requires collateral on any material gains from these transactions. During fiscal year 2016,the System entered into credit defaults, interest rate and total return swaps. Information on the System’s swap balances at June 30, 2016 and 2015 is shown in the following table.
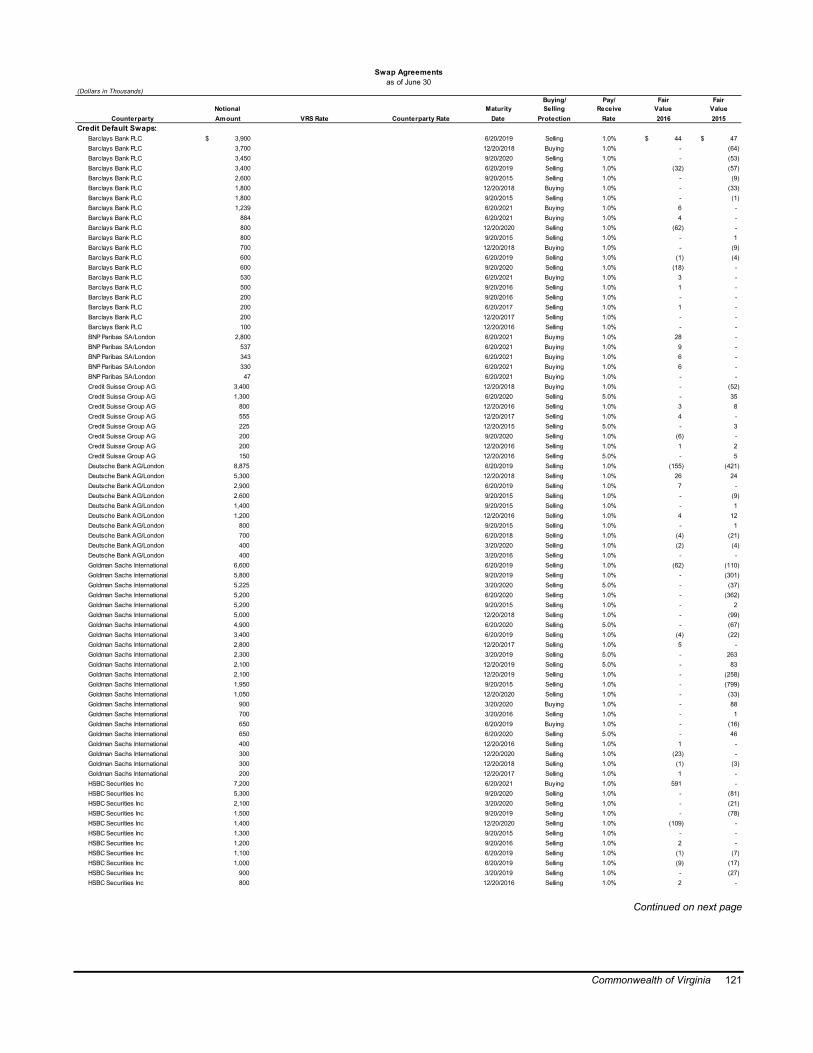
Commonwealth of Virginia 121
(Dollars in Thousands)Buying/ Pay/ Fair Fair
Notional Maturity Selling Receive Value Value Amount VRS Rate Counterparty Rate Date Protection Rate 2016 2015
Credit Default Swaps:Barclays Bank PLC $ 3,900 6/20/2019 Selling 1.0% 44$ 47$Barclays Bank PLC 3,700 12/20/2018 Buying 1.0% - (64)Barclays Bank PLC 3,450 9/20/2020 Selling 1.0% - (53)Barclays Bank PLC 3,400 6/20/2019 Selling 1.0% (32) (57)Barclays Bank PLC 2,600 9/20/2015 Selling 1.0% - (9)Barclays Bank PLC 1,800 12/20/2018 Buying 1.0% - (33)Barclays Bank PLC 1,800 9/20/2015 Selling 1.0% - (1)Barclays Bank PLC 1,239 6/20/2021 Buying 1.0% 6 -Barclays Bank PLC 884 6/20/2021 Buying 1.0% 4 -Barclays Bank PLC 800 12/20/2020 Selling 1.0% (62) -Barclays Bank PLC 800 9/20/2015 Selling 1.0% - 1Barclays Bank PLC 700 12/20/2018 Buying 1.0% - (9)Barclays Bank PLC 600 6/20/2019 Selling 1.0% (1) (4)Barclays Bank PLC 600 9/20/2020 Selling 1.0% (18) -Barclays Bank PLC 530 6/20/2021 Buying 1.0% 3 -Barclays Bank PLC 500 9/20/2016 Selling 1.0% 1 -Barclays Bank PLC 200 9/20/2016 Selling 1.0% - -Barclays Bank PLC 200 6/20/2017 Selling 1.0% 1 -Barclays Bank PLC 200 12/20/2017 Selling 1.0% - -Barclays Bank PLC 100 12/20/2016 Selling 1.0% - -BNP Paribas SA/London 2,800 6/20/2021 Buying 1.0% 28 -BNP Paribas SA/London 537 6/20/2021 Buying 1.0% 9 -BNP Paribas SA/London 343 6/20/2021 Buying 1.0% 6 -BNP Paribas SA/London 330 6/20/2021 Buying 1.0% 6 -BNP Paribas SA/London 47 6/20/2021 Buying 1.0% - -Credit Suisse Group AG 3,400 12/20/2018 Buying 1.0% - (52)Credit Suisse Group AG 1,300 6/20/2020 Selling 5.0% - 35Credit Suisse Group AG 800 12/20/2016 Selling 1.0% 3 8Credit Suisse Group AG 555 12/20/2017 Selling 1.0% 4 -Credit Suisse Group AG 225 12/20/2015 Selling 5.0% - 3Credit Suisse Group AG 200 9/20/2020 Selling 1.0% (6) -Credit Suisse Group AG 200 12/20/2016 Selling 1.0% 1 2Credit Suisse Group AG 150 12/20/2016 Selling 5.0% - 5Deutsche Bank AG/London 8,875 6/20/2019 Selling 1.0% (155) (421)Deutsche Bank AG/London 5,300 12/20/2018 Selling 1.0% 26 24Deutsche Bank AG/London 2,900 6/20/2019 Selling 1.0% 7 -Deutsche Bank AG/London 2,600 9/20/2015 Selling 1.0% - (9)Deutsche Bank AG/London 1,400 9/20/2015 Selling 1.0% - 1Deutsche Bank AG/London 1,200 12/20/2016 Selling 1.0% 4 12Deutsche Bank AG/London 800 9/20/2015 Selling 1.0% - 1Deutsche Bank AG/London 700 6/20/2018 Selling 1.0% (4) (21)Deutsche Bank AG/London 400 3/20/2020 Selling 1.0% (2) (4)Deutsche Bank AG/London 400 3/20/2016 Selling 1.0% - -Goldman Sachs International 6,600 6/20/2019 Selling 1.0% (62) (110)Goldman Sachs International 5,800 9/20/2019 Selling 1.0% - (301)Goldman Sachs International 5,225 3/20/2020 Selling 5.0% - (37)Goldman Sachs International 5,200 6/20/2020 Selling 1.0% - (362)Goldman Sachs International 5,200 9/20/2015 Selling 1.0% - 2Goldman Sachs International 5,000 12/20/2018 Selling 1.0% - (99)Goldman Sachs International 4,900 6/20/2020 Selling 5.0% - (67)Goldman Sachs International 3,400 6/20/2019 Selling 1.0% (4) (22)Goldman Sachs International 2,800 12/20/2017 Selling 1.0% 5 -Goldman Sachs International 2,300 3/20/2019 Selling 5.0% - 263Goldman Sachs International 2,100 12/20/2019 Selling 5.0% - 83Goldman Sachs International 2,100 12/20/2019 Selling 1.0% - (258)Goldman Sachs International 1,950 9/20/2015 Selling 1.0% - (799)Goldman Sachs International 1,050 12/20/2020 Selling 1.0% - (33)Goldman Sachs International 900 3/20/2020 Buying 1.0% - 88Goldman Sachs International 700 3/20/2016 Selling 1.0% - 1Goldman Sachs International 650 6/20/2019 Buying 1.0% - (16)Goldman Sachs International 650 6/20/2020 Selling 5.0% - 46Goldman Sachs International 400 12/20/2016 Selling 1.0% 1 -Goldman Sachs International 300 12/20/2020 Selling 1.0% (23) -Goldman Sachs International 300 12/20/2018 Selling 1.0% (1) (3)Goldman Sachs International 200 12/20/2017 Selling 1.0% 1 -HSBC Securities Inc 7,200 6/20/2021 Buying 1.0% 591 -HSBC Securities Inc 5,300 9/20/2020 Selling 1.0% - (81)HSBC Securities Inc 2,100 3/20/2020 Selling 1.0% - (21)HSBC Securities Inc 1,500 9/20/2019 Selling 1.0% - (78)HSBC Securities Inc 1,400 12/20/2020 Selling 1.0% (109) -HSBC Securities Inc 1,300 9/20/2015 Selling 1.0% - -HSBC Securities Inc 1,200 9/20/2016 Selling 1.0% 2 -HSBC Securities Inc 1,100 6/20/2019 Selling 1.0% (1) (7)HSBC Securities Inc 1,000 6/20/2019 Selling 1.0% (9) (17)HSBC Securities Inc 900 3/20/2019 Selling 1.0% - (27)HSBC Securities Inc 800 12/20/2016 Selling 1.0% 2 -
Swap Agreementsas of June 30
Counterparty
Continued on next page

122 Commonwealth of Virginia
(Dollars in Thousands)Buying/ Pay/ Fair Fair
Notional Maturity Selling Receive Value Value Amount VRS Rate Counterparty Rate Date Protection Rate 2016 2015
Credit Default Swaps (continued) :HSBC Securities Inc 700 6/20/2018 Selling 1.0% (4) (21)HSBC Securities Inc 400 3/20/2019 Selling 1.0% - (12)HSBC Securities Inc 400 6/20/2019 Selling 1.0% - (11)HSBC Securities Inc 200 3/20/2023 Selling 1.0% - (19)HSBC Securities Inc 200 12/20/2016 Selling 1.0% 1 -HSBC Securities Inc 100 3/20/2023 Selling 1.0% - (10)Intercontinental Exchange Holdings 26,159 6/20/2020 Selling 5.0% - 1,633Intercontinental Exchange Holdings 18,300 6/20/2020 Selling 1.0% - (1,685)Intercontinental Exchange Holdings 10,000 6/20/2021 Selling 1.0% (757) -Intercontinental Exchange Holdings 5,000 6/20/2020 Selling 5.0% - 346Totals-Credit Default Swaps 206,449 (494) (2,232)
Interest Rate Swaps:Banque Nationale de Paris 89,000 Brazil Cetip Interbank Deposit 13.5% 1/2/2017 - (155)Barclays Bank PLC 2,372 12.2% Brazil Cetip Interbank Deposit 1/4/2021 19 -Barclays Bank PLC 2,123 12.3% Brazil Cetip Interbank Deposit 1/4/2021 (5) -Barclays Bank PLC 1,481 Brazil Cetip Interbank Deposit 13.8% 1/4/2016 - (2)Barclays Bank PLC 1,288 Brazil Cetip Interbank Deposit 12.4% 1/2/2018 - (17)Barclays Bank PLC 999 Brazil Cetip Interbank Deposit 16.0% 1/2/2019 69 -Barclays Bank PLC 608 3-month Johannesburg (JIBAR) 8.0% 12/18/2023 (6) (8)Barclays Bank PLC 650 Mexico Interbank 28-day Index 5.0% 2/26/2018 - 9Barclays Bank PLC 335 3-month Johannesburg (JIBAR) 7.5% 12/17/2019 (3) (2)BlackRock Inc 553 Mexico Interbank 28-day Index 5.0% 2/26/2018 - -Chicago Mercantile Exchange Inc 183,813 3-month LIBOR 1.5% 9/15/2017 - 1,663Chicago Mercantile Exchange Inc 140,213 3-month LIBOR 1.5% 9/15/2017 - 1,268Chicago Mercantile Exchange Inc 73,271 2.8% 3-month LIBOR + 500 bps 9/21/2046 (15,295) -Chicago Mercantile Exchange Inc 50,159 2.3% 3-month LIBOR + 500 bps 9/21/2026 (3,891) -Chicago Mercantile Exchange Inc 12,813 6-month EURIBOR +100 bps 0.8% 9/16/2025 - 571Chicago Mercantile Exchange Inc 10,397 3.0% 3-month LIBOR 9/15/2045 (2,802) (72)Chicago Mercantile Exchange Inc 8,300 1.3% 3-month LIBOR 5/6/2017 - (12)Chicago Mercantile Exchange Inc 7,400 2.0% 3-month LIBOR 12/16/2019 - (56)Chicago Mercantile Exchange Inc 6,290 Mexico Interbank 28-day Index 5.6% 7/7/2021 - (16)Chicago Mercantile Exchange Inc 5,209 1.0% 6-month LIBOR - Japanese Yen 9/18/2023 - (208)Chicago Mercantile Exchange Inc 4,246 2.0% 6-month LIBOR - British Pound 9/16/2025 - 82Chicago Mercantile Exchange Inc 3,617 3.0% 6-month LIBOR - British Pound 9/17/2024 - (274)Chicago Mercantile Exchange Inc 1,785 Mexico Interbank 28-day Index 5.8% 6/5/2023 - (41)Chicago Mercantile Exchange Inc 1,651 Mexico Interbank 28-day Index + 100 bps 6.2% 1/3/2035 - (168)Chicago Mercantile Exchange Inc 1,553 1.0% 6-month LIBOR - Japanese Yen 9/20/2024 - (10)Chicago Mercantile Exchange Inc 1,262 Mexico Interbank 28-day Index 5.6% 11/10/2021 - (13)Chicago Mercantile Exchange Inc 1,114 6-month EURIBOR 0.8% 9/16/2025 - 50Chicago Mercantile Exchange Inc 1,114 1.5% 6-month EURIBOR 3/16/2046 - 68Chicago Mercantile Exchange Inc 196 0.5% 6-month LIBOR - Japanese Yen 9/17/2021 - (2)Chicago Mercantile Exchange Inc 134 Mexico Interbank 28-day Index + 100 bps 5.5% 2/22/2023 - (5)Credit Suisse AG 4,682 13.4% Brazil Cetip Interbank Deposit 1/2/2018 (6) -Credit Suisse AG 3,496 Brazil Cetip Interbank Deposit 16.0% 1/2/2019 241 -Credit Suisse AG 3,058 Brazil Cetip Interbank Deposit 12.2% 1/4/2021 - (5)Credit Suisse AG 1,661 14.7% Brazil Cetip Interbank Deposit 1/2/2018 (41) -Credit Suisse AG 716 Thai Baht 6-month f ixing range 2.8% 9/23/2025 50 -Deutsche Bank AG/London 13,484 Brazil Cetip Interbank Deposit 12.8% 1/4/2021 237 148Deutsche Bank AG/London 11,267 Brazil Cetip Interbank Deposit 13.9% 1/2/2017 - (2)Deutsche Bank AG/London 6,664 10.9% Brazil Cetip Interbank Deposit 1/2/2017 - 202Deutsche Bank AG/London 6,503 12.3% Brazil Cetip Interbank Deposit 1/2/2017 - 45Deutsche Bank AG/London 4,744 16.2% Brazil Cetip Interbank Deposit 1/4/2021 (546) -Deutsche Bank AG/London 4,603 Brazil Cetip Interbank Deposit 11.7% 1/4/2021 - (97)Deutsche Bank AG/London 4,370 Brazil Cetip Interbank Deposit 12.4% 1/2/2019 9 -Deutsche Bank AG/London 3,153 16.6% Brazil Cetip Interbank Deposit 1/2/2018 (159) -Deutsche Bank AG/London 1,385 Colombia IBR Overnight Interbank 5.3% 8/29/2019 (43) 10Deutsche Bank AG/London 1,451 Brazil Cetip Interbank Deposit 12.9% 4/1/2021 47 34Deutsche Bank AG/London 1,215 Klibor Interbank Offered Rate 3.3% 4/19/2018 (4) (13)Deutsche Bank AG/London 1,035 Mexico Interbank 28-day Index 5.0% 10/10/2019 (9) (6)Deutsche Bank AG/London 1,109 Thai Baht 6-month f ixing range 1.9% 2/26/2021 11 -Deutsche Bank AG/London 817 Colombia IBR Overnight Interbank 6.1% 10/16/2024 (33) (6)Deutsche Bank AG/London 749 Brazil Cetip Interbank Deposit 13.3% 1/4/2021 26 -Deutsche Bank AG/London 596 5.3% Mexican Interbank Equilibrium 9/6/2019 - 4Deutsche Bank AG/London 618 Thai Baht 6-month f ixing range 2.6% 10/19/2025 32 -Deutsche Bank AG/London 541 Thai Baht 6-month f ixing range 2.0% 8/17/2020 8 -Deutsche Bank AG/London 333 Thai Baht 6-month f ixing range 2.2% 11/23/2020 7 -Deutsche Bank AG/London 2,469 Brazil Cetip Interbank Deposit 12.4% 1/2/2018 46 (6)Deutsche Bank AG/London 324 6-month LIBOR-Thai Baht 2.6% 1/29/2025 17 (5)Deutsche Bank AG/London 206 Colombia IBR Overnight Interbank 5.3% 3/17/2020 (7) 1Deutsche Bank AG/London 142 Thai Baht 6-month f ixing range 3.4% 1/15/2021 11 9Deutsche Bank AG/London 142 Thai Baht 6-month f ixing range 3.4% 1/21/2021 11 9Deutsche Bank AG/London 57 Thai Baht 6-month f ixing range 3.4% 11/19/2018 3 3Deutsche Bank AG/London 28 Thai Baht 6-month f ixing range 3.4% 11/14/2018 1 1Deutsche Bank AG/London 17 Thai Baht 6-month f ixing range 2.2% 1/29/2020 - -
Counterparty
(Continued from previous page)
Swap Agreementsas of June 30
Continued on next page

Commonwealth of Virginia 123
(Dollars in Thousands)Buying/ Pay/ Fair Fair
Notional Maturity Selling Receive Value Value Amount VRS Rate Counterparty Rate Date Protection Rate 2016 2015
Interest Rate Swaps (continued) :Goldman Sachs International 16,356 14.1% Brazil Cetip Interbank Deposit 8/1/2016 - -Goldman Sachs International 4,058 3-month New Zealand Bank Bill 5.0% 12/17/2024 - 360Goldman Sachs International 1,017 3-month Johannesburg (JIBAR) 8.5% 9/21/2021 22 -Goldman Sachs International 404 3-month Johannesburg (JIBAR) 7.5% 12/17/2019 - (2)HSBC Securities Inc 968 14.1% Brazil Cetip Interbank Deposit 1/2/2018 (14) -HSBC Securities Inc 11,611 13.8% Brazil Cetip Interbank Deposit 1/2/2017 29 12HSBC Securities Inc 11,330 13.3% Brazil Cetip Interbank Deposit 1/4/2021 (398) -HSBC Securities Inc 7,304 12.4% Brazil Cetip Interbank Deposit 1/2/2018 135 -HSBC Securities Inc 6,555 Brazil Cetip Interbank Deposit 15.5% 1/2/2018 245 -HSBC Securities Inc 6,535 13.9% Brazil Cetip Interbank Deposit 1/6/2017 - (1)HSBC Securities Inc 4,245 12.2% Brazil Cetip Interbank Deposit 1/4/2021 (11) (8)HSBC Securities Inc 3,465 Brazil Cetip Interbank Deposit 13.4% 1/2/2018 4 -HSBC Securities Inc 2,189 Brazil Cetip Interbank Deposit 13.8% 4/1/2016 - (7)HSBC Securities Inc 2,134 Thai Baht 6-month f ixing range 2.0% 8/17/2020 32 -HSBC Securities Inc 687 Brazil Cetip Interbank Deposit 14.5% 1/1/2019 26 -HSBC Securities Inc 485 3-month Johannesburg (JIBAR) 7.5% 12/17/2024 (22) (29)HSBC Securities Inc 562 Brazil Cetip Interbank Deposit 12.8% 1/4/2021 10 6HSBC Securities Inc 483 Brazil Cetip Interbank Deposit 11.5% 1/4/2021 - (14)HSBC Securities Inc 458 Thai Baht 6-month f ixing range 2.5% 1/28/2025 21 (10)HSBC Securities Inc 395 Colombia IBR Overnight Interbank 6.2% 3/21/2024 (12) 3HSBC Securities Inc 325 Mexico Interbank 28-day Index 5.5% 2/22/2023 (5) (13)HSBC Securities Inc 281 Brazil Cetip Interbank Deposit 12.1% 1/4/2021 (1) (2)HSBC Securities Inc 239 3-month Johannesburg (JIBAR) 8.8% 9/21/2026 6 -HSBC Securities Inc 177 6-month Warsaw Interbank 2.8% 12/17/2024 9 (3)HSBC Securities Inc 134 6.4% Colombia IBR Overnight Interbank 7/2/2025 4 (1)HSBC Securities Inc 105 Thai Baht 6-month f ixing range 2.1% 1/28/2020 4 2HSBC Securities Inc 51 Thai Baht 6-month f ixing range 2.2% 11/23/2020 1 -UBS AG 10,769 Brazil Cetip Interbank Deposit 12.6% 1/4/2021 197 125UBS AG 1,654 10.9% Brazil Cetip Interbank Deposit 1/2/2017 59 268UBS AG 3,402 11.7% Brazil Cetip Interbank Deposit 1/4/2021 73 74UBS AG 2,716 Brazil Cetip Interbank Deposit 11.6% 1/2/2018 (100) (83)UBS AG 1,165 Mexico Interbank 28-day Index 5.6% 10/11/2021 3 (9)UBS AG 936 Brazil Cetip Interbank Deposit 9.1% 1/2/2017 (74) (66)UBS AG 661 Mexico Interbank 28-day Index 5.2% 10/21/2020 (6) -UBS AG 163 5.3% Mexican Interbank Equilibrium 9/6/2019 - 1UBS AG 5,565 Brazil Cetip Interbank Deposit 12.4% 1/2/2018 (103) (88)Total Interest Rate Swaps 805,165 (21,871) 3,491
Total Return Swaps:Barclays Bank PLC 50,000 1-month LIBOR - 5 bps Barclays Capital US Aggregate Index 8/1/2017 - - Barclays Bank PLC 25,000 1-month LIBOR - 10 bps Barclays Capital US Aggregate Index 10/1/2016 - -Barclays Bank PLC 25,000 1-month LIBOR Barclays Capital US Aggregate Index 7/1/2017 - -Barclays Bank PLC 25,000 1-month LIBOR Barclays Capital US Aggregate Index 2/1/2017 - -Barclays Bank PLC 20,000 1-month LIBOR + 10 bps Barclays Capital US Aggregate Index 6/1/2017 - -Barclays Bank PLC 20,000 1-month LIBOR + 15 bps Barclays Capital US Aggregate Index 8/1/2016 - -Deutsche Bank AG/London 250,000 3-month LIBOR + 42 bps MSCI ACWI IMI 7/18/2016 - -Deutsche Bank AG/London 25,000 1-month LIBOR + 15 bps Barclays Capital US Aggregate Index 7/1/2016 - -Deutsche Bank AG/London 18,000 1-month LIBOR + 3 bps Barclays Capital US Aggregate Index 9/1/2016 - -Deutsche Bank AG/London 1 3-month LIBOR + 42 bps MSCI ACWI IMI 7/16/2016 - -Goldman Sachs Group Inc 250,101 3-month LIBOR + 42 bps MSCI ACWI 7/16/2015 (100) -Goldman Sachs Group Inc 186,653 3-month LIBOR + 42 bps MSCI ACWI 7/16/2015 - (5,306)Goldman Sachs Group Inc 2 3-month LIBOR + 42 bps MSCI ACWI IMI 7/18/2016 - -Goldman Sachs Group Inc 226,219 3-month LIBOR + 42 bps MSCI ACWI 7/16/2015 - (6,430)Goldman Sachs Group Inc 150,616 3-month LIBOR + 42 bps MSCI ACWI IMI 7/16/2015 - (4,281)Goldman Sachs Group Inc 150,120 3-month LIBOR + 42 bps MSCI ACWI IMI 7/16/2015 - (2,832)Total Return Swaps 1,421,712 (100) (18,849)
Total Swaps 2,433,326$ (22,465)$ (17,590)$
Swap Agreements
Counterparty
as of June 30(Continued from previous page)

124 Commonwealth of Virginia
Derivative instruments are classified in Level 1 and Level 2 in the fair value hierarchy. Derivative instruments classified as Level 1 of the Fair Value Hierarchy are valued using price quoted in active markets for those securities. The derivative instruments in Level 1 consist of futures contracts on U.S. Treasury bond and notes and futures contracts on U.S. equity indexes. Derivative instruments classified as Level 2 of the fair value hierarchy are valued using a number of modeling approaches that take into account observable market levels, benchmark rates, and foreign exchange rates.
Additional information is available in the System’s separately issued financial statements, which may be obtained from the Virginia Retirement System at P.O. Box 2500, Richmond, Virginia 23218-2500.
Component Units
Investment Derivative Instruments
The Virginia Housing Development Authority (major component unit) enters into forward sales contracts for the delivery of GNMA and FNMA securities in order to lock in the sales price for the securitization of certain single-family mortgage loans. The contracts offset changes in interest rates between the time of the loan reservations and the securitization of such loans into GNMA and FNMA securities. These contracts are considered investment derivative instruments, such that their change in fair value is reported as investment derivative gains or losses on the statement of revenues, expenses, and changes in net position. Fair values of the forwards are based on observable market prices for similar instruments traded on the secondary mortgage loan markets. The Authority’s portfolio of investment derivatives are classified as Level 2 in the fair value hierarchy. The outstanding forward contracts, summarized by counterparty rating as of June 30, 2016, were as follows:
CounterpartyRating Concentration
A-1/AA+ $ 166,000,000 40.4% $ 169,521,836 $ 171,443,437 $ (1,921,601)A-1/AA- 140,000,000 34.0% 143,191,836 144,922,188 (1,730,352)A-1/A 97,000,000 23.4% 99,554,141 100,820,312 (1,266,171)Baa2/BBB 9,000,000 2.2% 9,177,539 9,348,750 (171,211)
$ 412,000,000 100.0% $ 421,445,352 $ 426,534,687 $ (5,089,335)
Asset(Liability)
Fair Value
ParNotionalAmount
MarketValue
Investment Derivative Instruments – Ineffective Hedges
During fiscal year 2015, the University of Virginia (UVA) (nonmajor) refunded the Series 2003A bonds and the commercial paper associated with the fixed-payer interest rate swaps which terminated hedge accounting.The fixed-payer interest rate swaps were no longer effective hedges. At June 30, 2016, the negative fair value of the swaps of $43.0 million is included in other liabilities and the change in fair value of negative $14.2 million was reported as investment earnings in the accompanying financial statements. During fiscal year 2015, UVA established two fixed-receiver interest rate swaps with a total notional amount of $128.0 million to provide a hedge against fixed interest rates on Series 2015B bonds. These swaps were reevaluated as of
June 30, 2016, and determined to no longer be effective hedges. The deferred outflows of resources balance of $648,468 was reported as investment earnings upon reclassification in the accompanying financial statements. At June 30, 2016, the positive fair value of the fixed-receiver interest rate swaps of $3.6 million is included in other assets and the change in fair value of $4.3 million is included in investment earnings in the accompanying financial statements. The derivative instruments are classified as Level 2 of the fair value hierarchy. Additional information regarding derivative instruments is available in the institution’s individually published financial statements.
Hedging Derivative Instruments
At June 30, 2016, the Virginia Commonwealth University (VCU) (nonmajor) had two fixed-payer interest rate swaps with a notional amount of $57.6million, which declines to $4.8 million at the termination date of November 1, 2030. The swaps are used as cash flow hedges by VCU in order to provide a hedge against changes in interest rates on variable rate Series 2012A and 2012B bonds. The Series 2012A and 2012B bonds refunded prior Series 2006A and 2006B bonds that resulted in the termination of the prior hedging relationship between the interest rate swaps and the 2006A and 2006B bonds. At the time of the refunding in November 2012, the accumulated change in fair value of the interest rate swaps was negative $14.1 million and was included in the calculation of the deferred loss on refunding. There was also a reestablishment of hedge accounting on the new debt. At June 30, 2016, the negative fair value of VCU’s swaps of $11.6 million is included in other liabilities and the cumulative change in fair value of VCU’s swaps since reestablishing hedge accounting of $2.5 million is included in deferred inflows of resources in the accompanying financial statements. The derivative instruments are classified as Level 2 of the fair value hierarchy.
At June 30, 2016, the Medical College of Virginia Hospitals (MCVH), which is a division of the Virginia Commonwealth University Health System Authority (a blended component unit of VCU), had two interest rate swap agreements with a notional amount of $119.0million and another interest rate swap agreement with a notional amount of $59.5 million. The swaps are used as cash flow hedges by MCVH in order to provide a hedge against changes in interest rates on variable rate Series 2013A and 2013B bonds. The Series 2013A and 2013B bonds refunded prior Series 2005 and 2008 bonds that resulted in the termination of the prior hedging relationship between the interest rate swaps and the Series 2005 and 2008 bonds. At the time of the refunding in June 2013, the accumulated change in fair value of the interest rate swaps was negative $42.1 million and was included in the calculation of the deferred loss on refunding. There was also a reestablishment of hedge accounting on the new debt. At June 30, 2016, the negative fair value of MCVH’s swaps of $65.0 million is included in other liabilities and the cumulative change in fair value of MCVH’s swaps of $22.9 million is included in deferred outflows of resources in the accompanying financial statements.

Commonwealth of Virginia 125
The derivative instruments are classified as Level 2 of the fair value hierarchy.
The following schedule shows debt service requirements of VCU and MCVH bonds payable hedgeddebt of $243.5 million and net receipts/payments on associated derivative instruments. These amounts assume that current variable and reference rates on the hedging instruments will remain the same for their terms. As these rates vary, net receipt/payments on the hedging instruments will vary. Additional information is available in the individually published financial statements of the higher education institution.
Maturity
2017 $ 5,690,000 $ 2,191,675 $ 8,149,489 $ 16,031,1642018 5,920,000 2,135,950 7,966,088 16,022,0382019 6,085,000 2,078,571 7,775,236 15,938,8072020 6,385,000 2,018,427 7,579,229 15,982,6562021 6,615,000 1,956,040 7,373,398 15,944,438
2022-2026 45,675,000 8,627,027 33,354,581 87,656,6082027-2031 68,760,000 5,658,172 24,183,497 98,601,6692032-2036 67,540,000 2,418,663 12,802,211 82,760,8742037-2041 30,815,000 129,030 1,645,763 32,589,793
Total $ 243,485,000 $ 27,213,555 $ 110,829,492 $ 381,528,047
Instruments, Principal Interest Net Total
Derivative
Various foundations of higher education institutions have derivative instruments. The foundations follow FASB rather than GASB reporting requirements. Disclosures for the foundations’ derivatives can be found in the individually published financial statements of the foundations.
15. RETIREMENT AND PENSION SYSTEMS
A separately issued financial report that includes financial statements and required supplemental information for each of the individual plans discussed below is publicly available. Copies may be obtained by writing to Virginia Retirement System, P. O. Box 2500, Richmond, Virginia 23218-2500.
A. Administration
GASB Statement No. 82, Pension Issues, an amendment of GASB Statements No. 67, No. 68, and No. 73, addressed certain issues that were raised during the implementation of these Standards. Specifically, the Statement addressed the issues regarding (1) the presentation of payroll-related measures in the required supplementary information, (2) the selection of assumptions and the treatment of deviations from guidance in an Actuarial Standard of Practice for financial reporting purposes, and (3) the classification of payments made by employers to satisfy employee (plan member) contribution requirements. While this Statement was effective for reporting periods beginning after June 15, 2016, the Virginia Retirement System (the System) has elected to implement it early and provided disclosure guidance to participating employers based on this Statement.
The System is an independent agency of the Commonwealth that administers pension plans, other employee benefit plans, and other funds for Commonwealth employees, teachers, political subdivision employees, and other qualifying employees. The Board of Trustees is responsible for the general administration and operation of the plans. The Board consists of five members appointed by the Governor and four members appointed by the Joint Rules Committee, all subject to confirmation by the General Assembly. The Board of Trustees appoints a director to serve as the chief administrative officer of the System and a chief investment officer to direct, manage, and administer the investment of the System’s funds. The Board of Trustees has appointed BNY Mellon as the custodian of designated assets of the System.
The System administers four pension trust funds: the Virginia Retirement System (VRS); State Police Officers’ Retirement System (SPORS); Virginia Law Officers’ Retirement System (VaLORS); and the Judicial Retirement System (JRS). In addition to the pension plans, the System administers five Other Employee Benefit Plans: Group Life Insurance Fund; Retiree Health Insurance Credit Fund; the Virginia Sickness and Disability Program (VSDP); the Line of Duty Act Trust Fund; and the Virginia Local Disability Program (VLDP).
B. Summary of Significant Accounting Policies (Virginia Retirement System)
Basis of Accounting
The financial statements of the pension and other employee benefit trust funds are prepared using the flow of economic resources measurement focus and the accrual basis of accounting consistent with the plans. Employee and employer contributions are recognized when due, pursuant to formal commitments, as well as statutory or contractual requirements. Investment income is recognized as earned by the plans. Benefits and refunds are recognized when due and payable in accordance with the terms of the plans.
Method Used to Value Investments
Investments are reported at fair value as determined by the System’s master custodian, BNY Mellon, from its Global Pricing System. This pricing system assigns a price source, based on asset type and the vendor pricing products to which the master custodian subscribes, for every security held immediately following its acquisition. Prices supplied by these sources are monitored on a daily basis by the master custodian.
When a pricing source is unable to provide a price, quotes are sought from major investment brokers and market-making dealers; or internal calculations are applied if feasible. As a last resort, the master custodian will contact investment managers for a price. The master custodian prices commingled funds, partnerships, and real estate assets from

126 Commonwealth of Virginia
statements received from the funds, partnerships, or investment managers.
The pricing sources utilized by the master custodian provide daily prices for equity securities, corporate, government and mortgage-backed fixed income securities, private placement securities, futures and options on futures, open-ended funds, and foreign exchange rates. Depending on the vendor, collateralized mortgage obligations (CMOs), adjustable rate mortgages (ARMs) and asset-backed securities are priced daily, weekly or twice a month and at month-end. Municipal fixed income securities and options on Treasury/Government National Mortgage Association securities are priced at month-end.
The System’s investment guidelines for each specific portfolio limits investments in any corporate entity to no more than 5.0 percent of the market value of the account for both the internally and externally managed portfolios. There is no concentration of investments in any one organization that represents 5.0 percent or more of plan net position available for benefits.
C. Plan Description
The Virginia Retirement System (VRS) is a qualified governmental retirement plan that administers three retirement benefit structures: Plan 1, Plan 2, and Hybrid Plan, for state employees, public school board employees, employees of participating political subdivisions, and other qualifying employees. VRS is a combination of mixed-agent and cost-sharing, multiple-employer retirement plans. Each plan’s accumulated assets may legally be used to pay all the plan benefits provided to any of the plan’s members, retirees, and beneficiaries. Contributions for fiscal year 2016 were $3.2 billion with a reserve balance available for benefits of $64.0 billion. The current year contributions include $162.4 million as an additional contribution from the Commonwealth representing an expedited payment of the deferred contribution from the 2010-2012 biennium. At June 30, 2016, the VRS had 827 contributing employers.
The Commonwealth also administers the following single-employer retirement plans and benefit structures:
� State Police Officers’ Retirement System (SPORS) – Plan 1 and Plan 2
� Virginia Law Officers’ Retirement System (VaLORS) – Plan 1 and Plan 2
� Judicial Retirement System (JRS) – Plan 1, Plan 2, and Hybrid Plan
All full-time, salaried permanent employees of VRS participating employers are automatically covered under VRS, SPORS, VaLORS or JRS with the following exceptions: (1) certain full-time faculty and administrative staff of public colleges and universities; and (2) eligible classified employees of the two state teaching hospitals. These employees have the option to elect not to participate in the Virginia Retirement System. Benefit provisions and
all other requirements are established by Title 51.1 of the Code of Virginia, as amended.
Benefits vest for all plans after five years of service credit. Vested VRS members in the VRS Plan 1 are eligible for an unreduced retirement benefit at age 65 with at least five years of service credit or age 50 with at least 30 years of service credit as elected by the employer. Vested VRS members in the VRS Plan 2 and the Hybrid Plan are eligible for unreduced retirement benefits at normal social security retirement age with at least five years of service credit or when age and service credit equal 90. Vested SPORS and VaLORS members in both the VRS Plan 1 and the VRS Plan 2 are eligible for an unreduced benefit at age 60 with at least five years of hazardous duty service credit or age 50 with at least 25 years of total service credit.
Annual retirement benefits are payable monthly for life in an amount equal to 1.7 percent of eligible members’ average final compensation (AFC) for each year of service credit. Under the VRS Plan 2, the multiplier for general employees was reduced to 1.65 percent beginning January 1, 2013. Under the Hybrid Plan, the multiplier for the defined benefit component is 1.0 percent. AFC is the average of the member’s 36 consecutive months of highest creditable compensation for members under the VRS Plan 1. Under the VRS Plan 2 and the Hybrid Plan, a member’s AFC is the average of the member’s 60 consecutive months of highest creditable compensation. The benefit for members of SPORS is calculated using a 1.85 percent multiplier. Members of SPORS also are eligible for a hazardous duty supplement, paid monthly, until they reach full Social Security retirement age.
Members of VaLORS hired before July 1, 2001, were allowed to make a one-time election to increase the multiplier from 1.7 to 2.0 percent instead of receiving a monthly hazardous duty supplement. VaLORS members who elected to retain the 1.7 percent multiplier are eligible for the supplement until age 65. Members of VaLORS hired after June 20, 2001, have their benefit computed using the 2.0 percent multiplier and are not eligible for the supplement.
Members of JRS receive weighted years of service credit for each year of actual service under JRS. VRS, SPORS, VaLORS, and JRS also provide death and disability benefits.
A cost-of-living allowance (COLA), based on changes in the Consumer Price Index and limited to 5.0 percent per year for VRS Plan 1 and 3.0 percent for VRS Plan 2 and Hybrid Plan, is granted on July 1 of the second calendar year after retirement and is effective each July 1 thereafter. Beginning January 2013, a member who retires with less than 20 years of service must receive an allowance for one full calendar year after reaching unreduced retirement age to be eligible for a COLA. Members within five years of eligibility for an unreduced benefit as of January 1, 2013 were grandfathered.

Commonwealth of Virginia 127
Benefits for all vested members are actuarially reduced if they retire before becoming eligible for an unreduced retirement benefit, provided they meet age requirements for a reduced retirement benefit.
As required by Title 51.1 of the Code of Virginia, as amended, members contribute 5.0 percent of their annual compensation to the retirement plans. Employers may assume the 5.0 percent member contribution. If a member leaves covered employment, the accumulated contributions plus earned interest may be refunded to the member. Each participating employer is required by state statute to contribute the remaining amounts necessary to fund the retirement plans using the entry age normal actuarial cost method adopted by the Board of Trustees. Contributions for fiscal year 2016 were $39.4 million, $45.4 million, and $97.0 million, and reserved balances available for benefits were $730.7 million, $468.3 million, and $1.2 billion,for SPORS, JRS, and VaLORS, respectively. The
current year contributions include $2.1 million, $8.5 million, and $16.5 million, respectively, as additional contributions from the Commonwealth representing an expedited payment of the deferred contributionfrom the 2010-2012 biennium. State statute may be amended only by the General Assembly. To the extent that the employer’s long-term obligation to provide pension benefits (total pension liability) is larger than the value of the assets available in the plan to pay these benefits (fiduciary net position), there is a net pension liability which is reported in the accompanying financial statements as a component of Long-term Liabilities Due in More than One Year.
Further information about the benefits provided in these retirement plans and their different benefit structures can be found in the Virginia Retirement System’s Comprehensive Annual Financial Report.
The following table provides participant information.
VRS SPORS VaLORS JRSRetirees and Beneficiaries Receiving Benefits 54,034 1,242 4,066 504Terminated Employees Entitled to Benefits but not Receiving Them 10,947 100 655 2
64,981 1,342 4,721 506
Active Members: Vested 54,828 1,525 5,532 324 Non-Vested 22,823 422 3,615 94Total 77,651 1,947 9,147 418
Total
D. Funding Policy
The funding policy of the retirement plans provides for periodic employer contributions at actuarially determined rates, which will remain relatively level over time as a percentage of payroll and will accumulate sufficient assets to meet the cost of all basic benefits when due. Contribution rates are developed using the entry age normal cost method for both normal cost and amortization of the unfunded actuarial accrued liability. Gains and losses are reflected in the unfunded actuarial accrued liability that is being amortized as a level percentage of payroll within 30 years or less.
The System’s actuary, Cavanaugh MacDonald Consulting, LLC, computed the amount of contributions to be provided by state agency employers, state police and other Virginia law employers. The contribution rates for fiscal year 2016 were based on the actuary’s valuation as of June 30, 2013. Employer contributions by the Commonwealth to VRS, SPORS, VaLORS, and JRS were 12.3 percent, 25.8 percent, 17.7 percent, and 49.6 percent, respectively in July 2015; 13.3 percent, 26.8 percent, 18.3 percent, and 49.8 percent, respectively in August 2015; and 14.2 percent, 27.8 percent, 19.0 percent, and 50.0 percent, respectively for the remainder of the fiscal
year. These rates were lower than the actuary’s recommended rates to VRS, SPORS, VaLORS, and JRS of 15.8 percent, 30.8 percent, 21.1 percent, and 55.5 percent, respectively.
In addition to determining contribution requirements, the actuarial computations present an estimate of the discounted present value of the prospective accrued liability contributions that employers will have to pay in the future so that such contributions, together with the assets on hand, the normal contributions to be made in the future by employers and members and the income earned by investing funds, will be sufficient to provide all benefits to be paid to present members in the future as well as the annuitants and their designated beneficiaries.
E. Changes in Net Pension Liability
The total pension liability was determined based on the actuarial valuation as of June 30, 2014, using updated actuarial assumptions, applied to all periods included in the measurement and rolled forward to the measurement date of June 30, 2015.The following tables (dollars in thousands) show the Commonwealth’s total pension liability, plan fiduciary net position, and net pension liability for

128 Commonwealth of Virginia
the VRS, SPORS, JRS, and VaLORS for the current and prior year.
Primary Government
Balances at June 30, 2015 $ 12,249,869 $ 9,099,234 $ 3,150,635 $ 1,031,856 $ 720,990 $ 310,866Changes for the year
Service cost 125,726 - 125,726 18,847 - 18,847Interest 496,994 - 496,994 70,350 - 70,350Differences betw een actual
and expected experience 20,082 - 20,082 (2,890) - (2,890)Contributions - employer - 9,301 (9,301) - 28,427 (28,427)Contributions - member - 3,786 (3,786) - 5,680 (5,680)Net investment income - 14,089 (14,089) - 32,466 (32,466)Benefit payments, including refunds (390,042) (22,522) (367,520) (53,713) (53,713) -Administrative expense - (200) 200 - (471) 471Other changes - (2) 2 - (27) 27
Net changes 252,760 4,452 248,308 32,594 12,362 20,232Balances at June 30, 2016 $ 12,502,629 $ 9,103,686 $ 3,398,943 $ 1,064,450 $ 733,352 $ 331,098
Balances at June 30, 2015 $ 616,680 $ 442,194 $ 174,486 $ 1,693,538 $ 1,067,826 $ 625,712Changes for the year
Service cost 23,254 - 23,254 40,230 - 40,230Interest 41,759 - 41,759 105,444 - 105,444Differences betw een actual
and expected experience (9,107) - (9,107) (4,105) - (4,105)Contributions - employer - 31,503 (31,503) - 51,602 (51,602)Contributions - member - 3,015 (3,015) - 14,197 (14,197)Net investment income - 20,051 (20,051) - 43,480 (43,480)Benefit payments, including refunds (40,205) (40,205) - (75,996) (74,629) (1,367)Administrative expense - (283) 283 - (617) 617Other changes - (17) 17 - (37) 37
Net changes 15,701 14,064 1,637 65,573 33,996 31,577Balances at June 30, 2016 $ 632,381 $ 456,258 $ 176,123 $ 1,759,111 $ 1,101,822 $ 657,289
Increase (Decrease)
(a) - (b)
Total PensionLiability
(a) (b)Net Position
Fiduciary
(a)
PlanFiduciary
Net Position(b)
Total PensionLiability
Net PensionLiability
PlanNet Pension
Liability
Increase (Decrease)
(a) - (b)
VRSIncrease (Decrease)
JRSIncrease (Decrease)
VaLORS
SPORS
Total PensionLiability
(a)
PlanFiduciary
Net Position(b)
Net PensionLiability(a) - (b)
Net PensionTotal PensionLiability
(a)
PlanFiduciary
Net Position Liability(a) - (b)(b)
Component Units
Balances at June 30, 2015 $ 9,517,064 $ 7,069,300 $ 2,447,764 $ 131,039 $ 82,624 $ 48,415Changes for the year
Service cost 249,423 - 249,423 7,301 - 7,301Interest 985,957 - 985,957 19,135 - 19,135
Differences betw een actualand expected experience 39,841 - 39,841 (744) - (744)
Contributions - employer - 471,356 (471,356) - 10,482 (10,482)Contributions - member - 191,796 (191,796) - 2,884 (2,884)Net investment income - 713,994 (713,994) - 8,832 (8,832)Benefit payments, including refunds (773,784) (1,141,304) 367,520 (13,791) (15,158) 1,367Administrative expense - (10,101) 10,101 - (126) 126Other changes - (152) 152 - (7) 7
Net changes 501,437 225,589 275,848 11,901 6,907 4,994Balances at June 30, 2016 $ 10,018,501 $ 7,294,889 $ 2,723,612 $ 142,940 $ 89,531 $ 53,409
Net Pension
VRS VaLORSIncrease (Decrease) Increase (Decrease)
Plan PlanTotal Pension Fiduciary Net Pension Total Pension Fiduciary
(a) - (b)Liability Net Position Liability Liability Net Position Liability
(a) (b) (a) - (b) (a) (b)

Commonwealth of Virginia 129
The amounts in the previous tables include governmental, business-type, and component unit activity for the Commonwealth’s VRS State Plan. The table excludes the non-VRS State Plan net pension liability of $44.3 million for all other component units and includes the fiduciary net pension liability of $3.7 million.
The 2014 actuarial valuations were prepared using the entry age normal cost method. The actuarial assumptions included (a) 7.0 percent investment rate of return, per year compounded annually; (b) projected salary increases ranging from 3.5 percent to 6.0 percent, including a 2.5 percent inflation component and (c) COLA of 2.5 percent for Plan 1 and 2.3 percent for Plan 2. The projection of benefits for financial reporting purposes does not explicitly incorporate the potential effects of legal or contractual funding limitations.
For more detailed actuarial information, refer to the Virginia Retirement System’s financial statements, including mortality rates shown in the “Actuarial Assumptions and Methods – Pension Plans” schedule.
F. Changes to and Sensitivity of Discount Rate
The discount rate used to measure the total pension liability was 7.0 percent. The projection of cash flows used to determine the discount rate assumed that contributions from participating employers will be based on the actuarially determined rates based on the Board’s funding policy, which certifies the required rates under Title 51.1 of the Code of Virginia (1950), as amended. Based on those assumptions, the fiduciary net position was projected to be available to make all of the projected future benefit payments of current plan members. Therefore the long-term expected rate of return on pension plan investments was applied to all periods of the projected benefit payments to determine the total pension liability. In accordance with GASB Statement No. 67, Financial Reporting for Pension Plans – an amendment of GASB Statement No. 25, regarding the disclosure of the sensitivity of the net pension liability to changes in the discount rate, the table below presents the employers’ net pension liability for each of the plans calculated using the discount rate of 7.0 percent, as well as what the employers’ net pension liability would be if it were calculated using a discount rate that is 1.0 percent lower (6.0 percent) or 1.0 percent higher (8.0 percent) than the current rate. The following table (dollars in thousands) shows the Commonwealth’s changes in the discount rate.
Primary Government
$ 4,881,905 $ 3,398,943 $ 2,155,357 $ 458,781 $ 331,098 $ 224,093
$ 234,187 $ 176,123 $ 125,757 $ 893,614 $ 657,289 $ 462,817
Current Discount Rate 1% Increase1% Decrease
Current Discount Rate 1% Increase 1% Decrease
Net Pension Liability
VaLORSJRS
SPORS
(6%) (7%) (8%)
(6%) (7%) (8%)(6%) (7%) (8%)
(6%)
1% DecreaseCurrent
Discount Rate 1% Increase
Net Pension Liability
Net Pension Liability
(8%)(7%)
VRS
Net Pension Liability
1% DecreaseCurrent
Discount Rate 1% Increase
Component Units
$ 3,911,926 $ 2,723,612 $ 1,727,112 $ 72,612 $ 53,409 $ 37,607
VRS VaLORS
Net Pension Liability Net Pension Liability
1% DecreaseCurrent
Discount Rate 1% Increase 1% DecreaseCurrent
Discount Rate 1% Increase(8%)(6%) (7%) (8%) (6%) (7%)

130 Commonwealth of Virginia
The long-term expected rate of return on the System’s investments was determined using a building-block method in which best-estimate ranges of expected future real rates of return (expected returns, net of investment expense and inflation) are developed for each major asset class. These ranges are combined to produce the long-term expected rate of return by weighting the expected future real rates of return by the target asset allocation percentage and by adding expected inflation. The target allocations are based on the Strategic Asset Allocation Implementation Schedule and Allowable Ranges document, which was approved by the VRS Board of Trustees on June 20, 2013. Best estimates of arithmetic real rates of return for each major asset class included in the System’s target asset allocation are summarized in the following table.
Arithmetic Weighted AverageLong-Term Long-Term
Target Expected ExpectedAsset Class (Strategy) Allocation Rate of Return Rate of Return
U.S. Equity 19.5% 6.5% 1.3%Developed Non U.S Equity 16.5% 6.3% 1.0%Emerging Market Equity 6.0% 10.0% 0.6%Fixed Income 15.0% 0.1% 0.0%Emerging Debt 3.0% 3.5% 0.1%Rate Sensitive Credit 4.5% 3.5% 0.2%Non Rate Sensitive Credit 4.5% 5.0% 0.2%Convertibles 3.0% 4.8% 0.1%Public Real Estate 2.2% 6.1% 0.1%Private Real Estate 12.8% 7.1% 0.9%Private Equity 12.0% 10.4% 1.3%Cash 1.0% -1.5% 0.0%
Total 100.0% 5.8%
Inflation 2.5%Expected arithmetic nominal return 8.3%
The allocation in the previous table provides a one-year expected return of 8.3 percent. However, one-year returns do not take into account the volatility present in each of the asset classes. In setting the long-term expected return for the pension system, stochastic projections are employed to model future returns under various economic conditions. The results provide a range of returns over various time periods that ultimately provide a median return of 7.4 percent, including expected inflation of 2.5 percent.
G. Pension Related Deferred Outflows and Deferred Inflows
GASB Statement No. 68, Accounting and Financial Reporting for Pensions – an amendment of GASB Statement No. 27, requires certain pension related items to be reported as either deferred outflows or deferred inflows of resources. The following table (dollars in thousands) summarizes these amounts as of June 30, 2016.

Commonwealth of Virginia 131
Primary Government (1) (3)
Differences betw een expected and actual experience $ 24,466 $ - $ - $ 2,405Changes of assumptions - - - -Net difference betw een projected and actual earnings on plan investments - 244,493 - 19,166Changes in proportion and difference betw een employer contributions and proportionate share of contributions 69,779 105,656 - -Employer contributions subsequent to the Measurement Date 312,433 - 31,561 -
Total $ 406,678 $ 350,149 $ 31,561 $ 21,571
Differences betw een expected and actual experience $ - $ 5,819 $ - $ 3,195Changes of assumptions - - - -Net difference betw een projected and actual earnings on plan investments - 11,773 - 27,855Changes in proportion and difference betw een employer contributions and proportionate share of contributions - - 21,589 22,732Employer contributions subsequent to the Measurement Date 33,291 - 60,887 -
Total $ 33,291 $ 17,592 $ 82,476 $ 53,782
VRS
JRS
SPORS
Deferred Inflows of Resources
Deferred Inflows of Resources
Deferred Outflows of Resources
Deferred Inflows of Resources
Deferred Outflows of Resources
Deferred Outflows of Resources
Deferred Inflows of Resources
Deferred Outflows of Resources
VaLORS
Component Units (2) (3)
Differences betw een expected and actual experience $ 19,604 $ - $ - $ 261Changes of assumptions - - - -Net difference betw een projected and actual earnings on plan investments - 195,915 - 2,261Changes in proportion and difference betw een employer contributions and proportionate share of contributions 61,857 25,980 2,984 1,842Employer contributions subsequent to the Measurement Date 244,034 - 4,904 -
Total $ 325,495 $ 221,895 $ 7,888 $ 4,364
VRS VaLORSDeferred
Outflows of Resources
Deferred Inflows of Resources
Deferred Outflows of Resources
Deferred Inflows of Resources
(1) During fiscal year 2016, the primary government made an expedited payment of the deferred contribution from the 2010-2012 biennium of $119,786 (dollars in thousands) to the System. This amount is reflected as a deferred outflow of resources for the primary government in the accompanying financial statements and is excluded from the above amounts.
(2) The component unit amounts include deferred outflows of resources and deferred inflows of resources of $17,121 (dollars in thousands) and $13,240 (dollars in thousands), respectively, not related to the VRS State Plan.
(3) Additionally, during fiscal year 2016, the Commonwealth recognized pension expense for the primary government and component units of $315,272 (dollars in thousands) and $198,885 (dollars in thousands), respectively.

132 Commonwealth of Virginia
Deferred Amounts to be Recognized in Fiscal Years Following Reporting Date
The following tables (dollars in thousands) provide the net estimated amount of the deferred inflows and deferred outflows of resources that will be recognized in the Commonwealth’s pension expense for each of the next five fiscal years.
Primary Government
VRS SPORS JRS VaLORS2017 (86,994)$ (8,026)$ (7,924)$ (12,288)$2018 (86,994) (8,026) (7,167) (12,288)2019 (88,929) (8,028) (4,638) (11,621)2020 42,890 2,974 2,137 5,1472021 - (465) - -
Component Units
VRS VaLORS2017 (69,709)$ (998)$2018 (69,709) (998)2019 (71,261) (944)2020 34,368 4182021 - -
H. Defined Contribution Plan for Political Appointees
Officers appointed by the Governor, officers elected by popular vote or the General Assembly, and executive branch chief deputies and confidential assistants may participate in the deferred contribution plan for Political Appointees, rather than the VRS. This optional retirement plan is authorized by the Code of Virginia and offered through the ICMARC. This is a defined contribution plan where the retirement benefits are based upon the Commonwealth’s 12.3 percent and the employee’s (5.0 percent) contributions, plus interest and dividends. The Commonwealth pays the required employee contributions. During the year ended June 30, 2016, the total contributions to this plan were $1.4 million.
The summary of significant accounting policies for the plan is in accordance with those discussed in Note 15. B.
I. Defined Contribution Plan for Public School Superintendents
The Public School Superintendent Plan is a defined contribution pension plan that provides optional postemployment benefits for school superintendents. This plan is authorized by the Code of Virginia. The Board of Trustees of the System manages the investments of the fund as custodian. School boards may elect to offer this plan as an option to the standard VRS plan that is available for school board members. Contributions are provided by the school board for credit to the member. At June 30, 2016, there were three
participants in this plan. Total contributions to the plan for fiscal year 2016 were $40,117.
J. Virginia Supplemental Retirement Plan
The Public School Teacher Supplemental Retirement Plan is a defined contribution pension plan established by the Department of Education to provide an optional postemployment benefit plan for turnaround specialists in the public school system. This plan is utilized as an incentive to attract highly skilled teachers for participating public schools pursuant to the Code of Virginia by Title 51.1-617. The Board of Trustees of the System manages the investments of the fund as custodian. School boards may elect to offer this plan as an option to the standard VRS plan that is available for school board members. Contributions are provided by the school boards for credit to the members. At June 30, 2016, there were two participants in this plan. There were no contributions to the plan for fiscal year 2016.
K. Higher Education (Nonmajor Component Units)
The Commonwealth’s colleges and universities participate in the retirement plans administered by VRS. In addition, full-time faculty and certain administrative staff of the Commonwealth’s colleges and universities may participate in optional retirement plans as authorized by Section 51.1-126 of the Code of Virginia rather than the VRS retirement plans. These optional retirement plans are defined contribution plans offered through Teachers Insurance and Annuity Association –College Retirement Equities Fund (TIAA-CREF), and Fidelity Investments Tax-Exempt Services Company. There are two defined contribution plans. Plan 1 is for employees hired prior to July 1, 2010, and retirement benefits received are based upon the employer’s 10.4 percent contributions, plus net investment gains. Plan 2 is for employees hired on or after July 1, 2010, and retirement benefits received are based upon the employer’s 8.5 percent not to exceed 8.9 percent contribution and the employee’s 5.0 percent contribution, plus net investment gains. For Plan 2, the employer contributions for fiscal year 2016 were 8.5 percent except the employer contributions for the University of Virginia (nonmajor) were 8.9 percent. Vesting is full and immediate for both employer and employee contributions. For fiscal year 2016, total pension expense recognized was $143.5 million andcontributions were calculated using the base salary amount of $1.5 billion. As of June 30, 2016, the Commonwealth’s colleges and universities had accrued $9.5 million in employer liabilities related to these plans.
University of Virginia Medical Center (part of the University of Virginia – nonmajor) employees hired after July 1, 1999, cannot participate in Plan 1 or Plan 2 noted above but have the option of participating in the Medical Center's Optional Retirement Plan. For information regarding this

Commonwealth of Virginia 133
plan, see the institution’s individually published financial statements.
Certain employees of Virginia Commonwealth University (nonmajor) are participating in The Select Plan, which is a 401(a) defined contribution plan. Participation is limited to executives by invitation. For information regarding this plan, see the University’s individually published financial statements.
Prior to July 1, 1997, certain employees of the Virginia Commonwealth University Health System Authority (Authority) (a blended component unit of Virginia Commonwealth University – nonmajor) were eligible to participate in the VRS defined benefit pension plan. Effective July 1, 1997, the Authority established the Virginia Commonwealth University Health System Authority Defined Contribution Plan (VCUHS 401(a) Plan) and the Virginia Commonwealth University Health System Authority Health Care Providers Defined Contribution Plan (HCP Plan). The Authority and component units, MCV Associated Physicians (MCVAP), VCU Community Memorial Hospital (CMH), and the Children’s Hospital (Children’s), participate in the VCUHS 401(a) as well as sponsor the VCUHS Savings Plan (VCUHS 457(b) Plan). Health care providers hired between July 1, 1993 and July 1, 1997, are eligible to participate in the HCP Plan. MCVAP also sponsors the MCVAP 401(a) Retirement Plan. VA Premier (a component of the Authority) adopted a 401(k) Plan. For information regarding these plans, see the Authority’s individually published financial statements.
Effective January 1, 1997, James Madison University (nonmajor) established a Supplemental Retirement Plan for tenured faculty members. The plan is a qualified plan within the meaning of section 401(c) of the Internal Revenue Code of 1986 (the Code) and is a governmental plan within the meaning of section 414(d) of the Code. For information regarding this plan, see the University’s individually published financial statements.
The Center for Innovative Technology (CIT) is a blended component unit of the Innovation and Entrepreneurship Investment Authority (nonmajor). The CIT has a defined contribution retirement plan covering substantially all employees. Under the plan, CIT makes contributions fixed at a percentageof each employee’s compensation to pay premiums for individual retirement annuity contracts written by TIAA-CREF. For information regarding this plan, see the Authority’s individually published financial statements.
L. Other Component Units
Note 1.B. outlines the component units included in the Commonwealth’s reporting entity. The Virginia Public Building Authority (blended - primary government), the Virginia Public School Authority (major), the Virginia College Building Authority (major), the Virginia University Research
Partnership (nonmajor), and the Virginia School for the Deaf and Blind Foundation (nonmajor) have no employees. Virginia Resources Authority (major) and the following nonmajor component units participate in the retirement plans administered by VRS: the Virginia Economic Development Partnership, the Virginia Small Business Financing Authority, the Hampton Roads Sanitation District Commission, the Virginia Biotechnology Research Partnership Authority, the Virginia Tourism Authority, the Tobacco Region Revitalization Commission, the Virginia Foundation for Healthy Youth, and the Fort Monroe Authority.
The Virginia Housing Development Authority (major) has two defined contribution plans and incurs employment retirement savings expense under these plans equal to between 8.0 and 11.0 percent of full-time employees’ compensation. For additional information regarding these plans, see the Authority’s individually published financial statements.
The Virginia Outdoors Foundation (nonmajor) maintains a 401(k) contribution plan and provides an employer contribution to all eligible employees of 2.0 percent of their salary. Employees can contribute to the plan up to the IRS limit and the Foundation will match up to an additional 2.0 percent for a maximum of 4.0 percent of an employees’ contribution. For information regarding this plan, see the Foundation’s individually published financial statements.
The Virginia Commercial Space Flight Authority (nonmajor) maintains a 401(a) contribution plan and provides an employer contribution to all eligible employees of 11.0 percent of their base salary. For information regarding this plan, see the Authority’s individually published financial statements.
The Virginia Port Authority (VPA) (nonmajor) maintains two defined benefit plans for its employees. Employees of record on July 1, 1997, had the option of continuing to maintain their benefit status as a State employee, and their benefits maintained under the VRS, or elect to be covered under a newly created pension plan (the VPA Defined Benefit Plan). The VPA Defined Benefit Plan covers all employees hired between July 1, 1997 and February 1, 2014. Employees hired after February 1, 2014 are eligible for a defined contribution plan only. The Virginia International Terminals (VIT) (a blended component unit of VPA – nonmajor) has a Virginia International Terminals, LLC Pension Plan that is a single employer, noncontributory defined benefit pension plan administered by VIT. VIT also sponsors noncontributory supplemental plans covering certain key employees. For information regarding these plans, see the Authority’s individually published financial statements.
Employees of the Virginia Museum of Fine Arts Foundation (nonmajor) who are age 21 or older are eligible to participate in the Employee’s Savings Plan, a 401(k) defined contribution profit sharing

134 Commonwealth of Virginia
plan. Also, the Foundation entered into a supplemental retirement agreement to pay a key employee of the Museum upon retirement the difference between the amount accrued under the VRS retirement plan, based on salary, and the amount based on the supplemental salary. For additional information regarding these plans, see the Foundation’s individually published financial statements.
The Science Museum of Virginia Foundation (nonmajor) has a 403(b) defined contribution pension plan through the Teachers Insurance and Annuity Association (TIAA) and the College Retirement Equities Fund (CREF) Retirement Plan for employees meeting age and service requirements. For additional information regarding this plan, see the Foundation’s individually published financial statements.
16. OTHER EMPLOYMENT BENEFITS
In addition to the pension plans, the Commonwealth participates in two other employment benefit plans, Group Life Insurance and the Virginia Sickness and Disability Program, which are administered by the Virginia Retirement System (the System). The System administers a third other employment benefit plan, the Volunteer Firefighters’ and Rescue Squad Workers’ Fund, in which the Commonwealth does not participate, but may provide funding. The significant accounting policies for all three plans are the same as those described in Note 15 for pension plans. A separately issued financial report that includes financial statements for the Group Life Insurance and Virginia Sickness and Disability Program is publicly available. Copies may be obtained by writing to the Virginia Retirement System, P. O. Box 2500, Richmond, Virginia 23218-2500.
Group Life Insurance
The Group Life Insurance Plan was established for Commonwealth employees, teachers, employees of political subdivisions participating in the VRS, state police officers, other state law enforcement and correctional officers, judges, and other qualifying employees. The program provides life insurance for natural death coverage equal to a member’s annual compensation rounded to the next highest $1,000 and then doubled. Accidental death coverage is double the natural death benefit. The program also provides coverage for accidental dismemberment and accidental blindness, a safety belt benefit, a repatriation benefit, a felonious assault benefit and an accelerated death benefit for terminal conditions. Approximately 359,679members participate in the program at June 30, 2016.
Participating employers and their covered employees are required by Title 51.1 of the Code of Virginia, as amended, to contribute to the cost of group life insurance benefits. Employers may assume the employees’ contributions.
An optional Group Life Insurance Fund was established for members covered under the group life program as a supplement to that plan. Members may purchase
optional life insurance coverage for themselves, their spouses and/or their dependent children. The optional program provides natural death coverage equal to one, two, three or four times the member’s annual compensation rounded to the next highest $1,000, up to a maximum of $750,000. Spouse coverage is available for up to one-half of the member’s optional insurance amount. Minor children who are at least 15 days old can be insured for $10,000, $20,000 or $30,000, depending on the option chosen by the member. An additional accidental death and dismemberment benefit is payable for death or bodily injuries. Approximately 67,493 members were covered under this program at June 30, 2016.
Optional group life insurance coverage ends for members when they retire or terminate their employment, or when their basic coverage ends. Optional life insurance amounts begin to reduce by 25.0 percent based on the retiree’s age, beginning with the retiree’s normal retirement age under his or her plan ending at age 80. Retirees may elect to continue coverage within 31 days of retirement. Spouse coverage terminates should a couple divorce or when the member leaves employment. Children’s coverage ends with the termination of the member’s coverage or when the child marries or turns 21 years of age (25 years of age for full-time college students).
Employers of members who elect optional life insurance coverage deduct the premiums from the members’ paychecks, as required by Title 51.1 of the Code of Virginia, as amended. Premiums are based on the member’s age and determined by the Board of Trustees. Because optional life insurance is an insured product, the carrier bills each employer directly, and the employer makes the contribution payments to the carrier. Any differences and adjustments are settled between the employer and the carrier.
Virginia Sickness and Disability Program
The System administers the Virginia Sickness and Disability Program (VSDP) to provide income protection in the event of a disability for eligible state employees hired on or after January 1, 1999. State agencies are required by Title 51.1 of the Code of Virginia to contribute to the cost of providing long-term disability benefits and administering the program.
VSDP benefits include sick, family and personal leave and short-term and long-term disability benefits. After a seven-calendar day waiting period following the first day of disability, eligible employees receive short-term disability benefits from 60.0 percent to 100.0 percent of their compensation. After 125 work days of short-term disability, eligible employees receive long-term disability benefits equal to 60.0 percent of their compensation. If the employee’s condition becomes catastrophic, income replacement increases to 80.0 percent until the condition is no longer catastrophic. Long-term disability benefits continue until employees return to work, retire or reach age 65 (age 60 for state police officers and other state law enforcement and correctional officers) or die.
Commonwealth of Virginia 135
Full-time permanent salaried state employees, including state police officers and other Virginia law and correctional officers, are automatically enrolled in the VSDP. Part-time permanent salaried state employees who work at least 20 hours a week and accrue leave also are automatically enrolled. Teaching, administrative and research faculty of Virginia publiccolleges and universities who elect VRS as their retirement plan must make an irrevocable election to participate in either the VSDP or the institution’s disability program. If there is no institution program, the faculty member is covered under VSDP.
Eligible state employees and state police officers employed before January 1, 1999, had the option to elect to participate in the VSDP or remain under the Commonwealth’s existing sick leave program and retain their eligibility for disability retirement benefits under VRS and SPORS. (Members of VaLORS have been automatically enrolled in the VSDP since October 1,1999, when VaLORS was created.) Eligible employees enrolled in the VSDP are not eligible for disability retirement benefits under VRS, SPORS, or VaLORS. Employees hired or rehired on or after July 1, 2009, must satisfy eligibility periods before becoming eligible for non-work related short-term disability coverage and certain income replacement levels. Approximately 74,657 members were covered under the program at June 30, 2016.
Volunteer Firefighters' and Rescue Squad Workers' Fund
Volunteer firefighters and rescue squad workers may participate in an optional employment benefit plan. This optional plan is authorized by the Code of Virginia. The Board of Trustees of the System manages the investments of the fund as custodian. Members of the plan contribute $30 per quarter. The Commonwealth will contribute an amount determined by the Board and appropriated by the General Assembly, if such funds are appropriated, for a period not to exceed 20 years. For fiscal year 2016, there were no monies appropriated for administration of the program. At June 30, 2016, there were 1,743 workers participating in the fund.
17. OTHER POSTEMPLOYMENT BENEFITS (OPEB)
A. Virginia Retirement System (The System) Administered Plans
The Governmental Accounting Standards Board (GASB) issued Statement No. 43, Financial Reporting for Postemployment Benefit Plans Other Than Pension Plans, which requires additional reporting and disclosures for OPEB plans. The statement became effective for System-administered OPEB plans beginning with the fiscal year ended June 30, 2007. The assets and actuarial accrued liabilities for the following other postemployment benefits were determined through an actuarial valuation performed as of June 30, 2015, by Cavanaugh MacDonald Consulting, LLC, and are presented in the Required Supplemental Schedule of Funding Progress for Other Postemployment Benefit Plans. The significant
accounting policies for all five plans are the same as those described in Note 15 for pension plans and a separately issued report is available as previously discussed.
Group Life Insurance Benefits
Employees who retire or terminate from service after age 50 with at least ten years of service credit or at age 55 with at least five years of service credit (age 50 for vested state police officers, other state law enforcement and correctional officers and hazardous duty employees of participating political subdivisions), or who retire because of disability, are entitled to postemployment group life insurance benefits. Employees enrolled in JRS who retire or terminate from service after age 60 with at least 30 years of service credit or at age 65 with at least five years of service credit are entitled to postemployment group life insurance benefits. At retirement or termination, accidental death benefits cease and natural death coverage reduces at a rate equal to 25.0 percent on January 1 of the first full calendar year following retirement or termination and on January 1 of each year thereafter, until it reaches 25.0 percent of its original value. These group life insurance benefit provisions and requirements are established by Title 51.1 of the Code of Virginia. There were approximately 169,786 retirees in the Basic Group Life Insurance Program and 2,874 retirees were covered under the Optional Group Life Insurance Program in fiscal year 2016.
Since 1960, when the group life insurance program was established, a portion of the premium contributions collected during members’ active careers has been placed in an advance premium deposit reserve. This reserve was established to pre-fund death benefits to members after retirement.
Employers providing life insurance benefits are part of a cost-sharing pool. Therefore, separate measurements of assets and actuarial accrued liabilities are not made for individual employers participating in the program.
Retiree Health Insurance Credit Program
The Retiree Health Insurance Credit Program was established on January 1, 1990, to provide benefits for retired state employees, state police officers, other state law enforcement and correctional officers and judges who have at least 15 years of service credit under the retirement plans. The program provides a credit reimbursement of $4 per month per year of service credit against the monthly health insurance premiums of eligible retirees.
A similar program was established on July 1, 1993,to provide a health insurance credit for retired teachers and employees of participating political subdivisions with at least 15 years of service credit under the retirement plans. Retired teachers are eligible for a monthly credit of $4 per month per year of service credit. Local government retirees

136 Commonwealth of Virginia
may receive a maximum credit of $1.50 per month per year of service with a maximum monthly credit of $45.
Benefit provisions and eligibility requirements are established by Title 51.1, Chapter 14 of the Code of Virginia. The amount required to fund all credits is financed by the employers based on contribution rates determined by the System’s actuary. Approximately 116,408 retired members were covered under this program at June 30, 2016. The Retiree Health Insurance Credit Program is anagent, multiple-employer defined benefit OPEB plan.
Disability Insurance Trust Fund
The Commonwealth provides OPEB disability insurance benefits, in accordance with state statutes, to eligible retired and terminated employees. State agencies are required by Title 51.1 of the Code of Virginia to contribute to the cost of providing long-term disability benefits and administering the program. There were approximately 2,844 former members receiving benefits from the program during fiscal year 2016. The Disability Insurance Trust Fund is a single-employer defined benefit OPEB plan.
Line of Duty Death and Disability
The Commonwealth provides death and health benefits to the beneficiaries of certain law enforcement and rescue personnel disabled or killed in the line of duty. A trust fund has been established to account for this activity. Benefit provisions and eligibility requirements are established by Title 9.1 Chapter 4 of the Code of Virginia. The significant accounting policies for this plan are the same as those described in Note 15 for pension plans. There were approximately 992 retirees and 936 other participants in the program in fiscal year 2016. The Line of Duty Death and Disability Program is a cost-sharing, multiple-employer defined benefit OPEB plan. The employer contribution rate was determined by the System’s actuary using the anticipated costs and the number of covered individuals associated with all of the covered employers. Additionally, the Department of Accounts provides certainadministrative support in claims administration.
Virginia Local Disability Program
The Virginia Local Disability Program (VLDP) was a new program for the System in fiscal year 2014. The program provides eligible local government employees who are members of the Hybrid retirement plan with sick, family and personal leave and short-term and long-term disability benefits for non-work-related and work-related illnesses and injuries. The System is responsible for administering the disability program and the payment of long-term disability benefits. Local employers are responsible for administering the
leave program and the payment of short-term disability benefits.
During fiscal year 2016, the System collected contributions for eligible employees and continued implementation of the structure for administering the program going forward. At June 30, 2016, there were 9,699 participants in the program.
B. Pre-Medicare Retiree Healthcare
The Commonwealth provides a healthcare plan established by Title 2.2, Chapter 28 of the Code of Virginia for retirees who are not yet eligible to participate in Medicare. For a retiree to participate in the Plan, the participant must be eligible for a monthly annuity from the VRS or a periodic benefit from one of the qualified Optional Retirement Plan (ORP) vendors, and:
� be receiving (not deferring) the annuity or periodic benefit immediately upon retirement;
� have his or her last employer before retirement be the state;
� be eligible for coverage as an active employeein the State Health Benefits Program until his or her retirement date (not including Extended Coverage); and,
� have submitted within 31 days of his or her retirement date an Enrollment Form to his or her Benefits Administrator to enroll.
This fund is reported as part of the Commonwealth’s Healthcare Internal Service Fund. The significant accounting policies for this plan are the same as those described in Note 15 for pension plans. Pre-Medicare Retiree Healthcare is a single-employer defined benefit OPEB plan and is administered by the Department of Human Resource Management. There were approximately 6,387 retirees in the program in fiscal year 2016.
C. Annual OPEB Cost and Net OPEB Obligation
The Governmental Accounting Standards Board (GASB) issued GASB Statement No. 45, Accounting and Financial Reporting by Employers for Postemployment Benefits Other Than Pensions,which required additional reporting and disclosures for OPEB plans beginning with the fiscal year ending June 30, 2008. The Commonwealth calculated an OPEB liability as of June 30, 2016 for each of the five OPEB plans covering Commonwealth employees. The Retiree Health Insurance Credit Fund, Disability Insurance Trust Fund, and Pre-Medicare Retiree Healthcare OPEB liabilities were $202.7 million, $207.1 million, and $1.3 billion, respectively. These amounts are reported in the accompanying financial statements as a component of Long-Term Liabilities Due in More than One Year. There is no liability for the Group Life Insurance Fund or Line of Duty Death and Disability.

Commonwealth of Virginia 137
The following table (dollars in thousands) shows the Commonwealth’s annual OPEB cost and net OPEB obligation for the current and prior years.
Annual required contribution $ 65,735 $ 63,778 $ 63,250 $ 84,832 $ 81,253 $ 72,322Interest on net OPEB obligation - - - 12,784 11,437 10,515Adjustment to annual required
contribution - - - (11,051) (9,911) (9,092)Annual OPEB cost 65,735 63,778 63,250 86,565 82,779 73,745Contributions made (65,735) (63,778) (63,250) (66,215) (64,025) (60,219)Increase in net OPEB obligation - - - 20,350 18,754 13,526Net OPEB obligation, beginning of year - - - 182,306 163,552 150,026Net OPEB obligation, end of year $ - $ - $ - $ 202,656 $ 182,306 $ 163,552Percentage of annual OPEB
cost contributed 100.0% 100.0% 100.0% 76.5% 77.3% 81.7%
Annual required contribution $ 38,675 $ 36,831 $ 30,302 $ 5,840 $ 6,122 $ 6,486Interest on net OPEB obligation 13,406 12,315 11,262 - - -Adjustment to annual required
contribution (11,586) (10,681) (9,763) - - -Annual OPEB cost 40,495 38,465 31,801 5,840 6,122 6,486Contributions made (24,495) (23,642) (16,644) (5,840) (6,122) (6,486)Increase in net OPEB obligation 16,000 14,823 15,157 - - -Net OPEB obligation, beginning of year 191,096 176,273 161,116 - - -Net OPEB obligation, end of year $ 207,096 $ 191,096 $ 176,273 $ - $ - $ -Percentage of annual OPEB
cost contributed 60.5% 61.5% 52.3% 100.0% 100.0% 100.0%
Annual required contribution $ 213,660 $ 206,590 $ 198,451Interest on net OPEB obligation 43,377 36,398 30,013Adjustment to annual required
contribution (44,829) (37,762) (31,007)Annual OPEB cost 212,208 205,226 197,457Contributions made (42,996) (35,028) (34,229)Increase in net OPEB obligation 169,212 170,198 163,228Net OPEB obligation, beginning of year 1,081,893 911,695 748,467Net OPEB obligation, end of year $ 1,251,105 $ 1,081,893 $ 911,695Percentage of annual OPEB
cost contributed 20.3% 17.1% 17.3%
2016 (3)2014
2016 2015
Line of Duty Death and Disability Disability Insurance Trust Fund
2014
2016 2015
Retiree Health Insurance Credit Fund
20142016
2014 (1)
2015
Group Life Insurance Fund
2015 (2)
2016 2015 2014
Pre-Medicare Retiree Healthcare
(1) During fiscal year 2014, the required annual contributions of $6.5 million were paid by the Commonwealth. Additionally, the loan decreased to $8.3 million that will be repaid in future periods with contributions received.
(2) During fiscal year 2015, the required annual contributions of $6.1 million were paid by the Commonwealth.
(3) During fiscal year 2016, the required annual contributions of $5.8 million were paid by the Commonwealth.

138 Commonwealth of Virginia
The amounts in the previous table include Governmental and Component Unit activity for which the Commonwealth is considered the employer. It does not include the OPEB liability for the following nonmajor component units: the Virginia Economic Development Partnership, the Virginia Tourism Authority, the Fort Monroe Authority, and the Virginia Outdoors Foundation of $2.2 million, $1.2 million, $368,220, and $57,719, respectively. The table also excludes non-Commonwealth sponsored OPEB liabilities of $57.1 million for all other component units and includes the fiduciary OPEB liability of $669,523.
The annual required contributions for the current year were determined during the actuarial valuations conducted as of June 30, 2013, as that is the most recent report that reflects the current funding policies. Employer contributions by the Commonwealth for Group Life Insurance, Retiree Health Insurance Credit and Disability Insurance were 1.2 percent, 1.0 percent, and 0.7 percent, respectively, of covered payrolls for fiscal year 2016. The valuations were prepared using the entry age normal cost method for all plans except for the Disability Insurance trust fund and the Line of Duty Act trust fund for which the Projected Unit Credit actuarial cost method was used. The Pre-Medicare Retiree Healthcare plan uses a 4.0 percent investment rate of return, per year compounded annually, which approximates the projected rate of return on the State Treasurer's Portfolio. The Group Life Insurance, Retiree Health
Insurance Credit and Disability Insurance use a 7.0 percent investment rate of return, per year compounded annually. The Line of Duty Act trust fund uses a 4.8 percent rate of return compounded annually. The actuarial assumptions for all but the Pre-Medicare Retiree Healthcare plan included a projected salary increase of 3.0 percent, including a 2.5 percent inflation component. Valuation techniques were applied to smooth the effects of short-term volatility in the market value of investments over a five year period. The actuarial assumptions for the Pre-Medicare Retiree Healthcare plan as to current claim cost, projected increases in health insurance costs, mortality, turnover, retirement, disability and discount rate include (a) projected salary increases ranging from 3.8 percent to 5.6 percent, including a 2.5 percent inflation component; and, (b) assumption that there is no liability associated with those retirees eligible for Medicare, as costs for members aged 65 and older are not subsidized by the active population (no implicit subsidy), participants pay 100.0 percent of the costs, and the liability associated with the health insurance credit is measured and held by the Virginia Retirement System. Initial healthcare costs trend rates used were 10.0 percent, 11.0 percent, and 6.0 percent for medical, pharmacy, and dental benefits, respectively. The ultimate trend rates used were 5.0 percent, 5.0 percent, and 4.0 percent for medical, pharmacy, and dental benefits, respectively. The remaining open amortization period at June 30, 2013, was 30 years.
D. Funded Status and Funding Progress
The funded status of the plan as of June 30, 2015, per the most recent actuarial valuation, was as follows:
(Dollars in Millions)UAAL as a
Actuarial PercentageValuation Unfunded Funded of Covered
Date AAL (UAAL) Ratio Covered PayrollJune 30 [b-a] [a/b] Payroll [c] [b-a]/[c]
2015 $ 1,129 $ 2,829 $ 1,700 39.9% $ 17,814 9.5%
2015 $ 174 $ 2,380 $ 2,206 7.3% $ 15,267 14.4%
2015 $ 398 $ 235 $ (163) 169.4% $ 3,627 (4.5%)
2015 $ - $ 245 $ 245 - N/A -
2015 $ - $ 1,309 $ 1,309 - $ 4,034 32.4%Pre-M edicare Retiree Healthcare
Actuarial
Group Life Insurance Fund
Retiree Health Insurance Credit Fund
Disability Insurance Trust Fund
Accrued
Line of Duty Death and Disability
Assets [a]Value ofActuarial
(AAL) [b]Liability

Commonwealth of Virginia 139
Actuarial valuations of ongoing plans involve estimates of the value of reported amounts and assumptions about the probability of occurrence of events far into the future and reflect a long-term perspective. Amounts determined regarding the funded status of the plans and the annual contributions of the employer are subject to continual revision as actual results are compared with past expectations and new estimates are made about the future. Calculations are based on the benefits provided under the terms of the substantive plan in effect at the time of eachvaluation and on the pattern of sharing costs between the employer and plan members to that point. The schedule of funding progress presented as required supplementary information following the notes to the financial statements presents multi-year trend information that shows whether the actuarial value of plan assets is increasing or decreasing over time relative to the actuarial accrued liabilities for benefits. The projection of benefits for financial reporting purposes does not explicitly incorporate the potential effects of legal or contractual funding limitations.
E. Higher Education (Nonmajor Component Unit)
The University of Virginia has a Retiree Health Plan that covers employees who retire before becoming eligible for Medicare until they reach age 65 and can then participate in the Commonwealth’s Medicare Supplement Plan. Additional information on this plan can be found in the individually published financial statements of the University.
F. Other Component Units
The Virginia Housing Development Authority (major) has a Retiree Health Care Plan, a single-employer defined benefit plan which is administered through the Virginia Housing Development Authority Retiree Health Care Plan Trust, an irrevocable trust to be used solely for providingbenefits to eligible participants. Effective January 1, 2006, eligible retirees must be at least 55 years of age with 15 years of service or at least 55 years of age with 10 years of service if employed by the Authority prior to such date. For the year ended June 30, 2016, the Authority’s Annual OPEB cost was $406,132; the percentage of Annual OPEB Cost Contributed was 313.8 percent; and theending Net OPEB asset was $4.0 million.
Hampton Roads Sanitation District Commission (nonmajor) provides other postemployment benefits for its employees through a single employer defined benefit plan. The plan was established and may be amended by the Commission. The plan furnishes health and dental benefits for life for all employees with at least 15 years of service and who also qualify for an unreduced retirement benefit through the VRS. The plan allows the retiree at their expense to cover their spouse and dependents under the Commission’s health care provider.Contribution requirements are actuarially determined and funding is subject to approval by
the Commission. The current rate is 6.0 percent of annual covered payroll. For 2016, the Commission’s annual OPEB cost was $2.2 million; the percentage of annual OPEB cost contributed was 100.0 percent.
18. DEFERRED COMPENSATION PLANS
The Commonwealth offers its employees a deferred compensation plan created in accordance with Internal Revenue Code Section 457(b). The Virginia Retirement System (the System) administers the deferred compensation plan, pursuant to the Government Employees Deferred Compensation Plan Act, Section 51.1, Chapter 6 et seq. of the Code of Virginia. The System contracts with private corporations or institutions subject to the standards set forth in the Code to provide investment products as well as any other goods and services related to the administration of the deferred compensation plan. The Department of Accounts is responsible for the accounting, reconciliation, payment to the plan through payroll deductions, and timely transfer of withheld funds to the trustee designated by the System for investment. The plan provides a number of investment options and is designed so that each participant retains investment control of his/her individual account. The plan, available to all state employees, permits them to defer a portion of their salary until future years. The deferred compensation is held in trust for the exclusive benefit of plan participants and their beneficiaries and is not available to employees until termination, retirement, death, unforeseeable emergency, or an in-service distribution at age 70 ½ or later. Since the System has no fiduciary relationship with plan participants, plan assets at June 30, 2016, of $2.2 billion are not included in the financial statements.
In addition, the Commonwealth provides a cash match under Internal Revenue Code Section 401(a) for employees participating in the deferred compensation plan. The match amount for an employee was established at 50.0 percent of the voluntary contributions to the deferred compensation plan. During the current fiscal year, the maximum match was $20 per pay period or $40 per month. The fair value of assets in the cash match savings plan at June 30, 2016, was $379.1 million, which is also excluded from the financial statements.
Most employees of the Commonwealth’s colleges and universities may participate in the Commonwealth’s deferred compensation plan in accordance with Internal Revenue Code Section 457(b) and/or the institution’s deferred compensation plan in accordance with Internal Revenue Code Section 403(b). Under either plan, the institution’s cash match under the Internal Revenue Code Section 401(a) during fiscal year 2016 was a maximum match up to $20 per pay period or $40 per month. This employer match is for either plan but not both plans. Employer contributions under these plans were approximately $13.3 million for fiscal year 2016.
The deferred compensation plan for the University of Virginia Medical Center (part of the University of Virginia – nonmajor component unit) employees hired
140 Commonwealth of Virginia
on or after September 30, 2002, allows employee contributions up to 4.0 percent of their salary and the employer match is 50.0 percent of the 4.0 percent deferral not to exceed 2.0 percent of the employees’ salary. Employer contributions under this plan were approximately $3.5 million for fiscal year 2016.
The Virginia Housing Development Authority (major component unit) and the Virginia Resources Authority (major component unit) have deferred compensation plans available to all employees created in accordance with Internal Revenue Section 457(b). The plan permits participants to defer a portion of their salary or wagesuntil future years. The deferred compensation is not available to employees until termination, retirement, or death. The assets of the plan are in an irrevocable trust with an external trustee and, accordingly, no assets or liabilities are reflected in the financial statements.
The Assistive Technology Loan Fund Authority (nonmajor component unit) employees contribute an amount of their choosing into Deferred Compensation Plans administered by the Virginia Retirement System and into a qualified 403(b) plan.
The Virginia Port Authority (VPA) (nonmajor component unit) offers three deferred compensation plans and twomatching savings plans under Internal Revenue Code Sections 457 and 401(a), respectively. For additional information, please refer to the VPA’s individually published financial statements.
19. STATE NON-ARBITRAGE POOL
The Commonwealth sponsors the Virginia State Non-Arbitrage Program (SNAP) for use by the Commonwealth and local governments to invest bond proceeds. The Commonwealth’s responsibility is limited to hiring service providers to manage SNAP. The investment manager and the custodian have the fiduciary responsibility for SNAP.
The SNAP fund is a class of the PFM Funds Prime Series, a money market mutual fund registered with the Securities and Exchange Commission. PFM Funds is a diversified, open-end management investment company organized as a Virginia business trust. Shares of the SNAP fund are solely available to investors participating in the SNAP program. The PFM Funds Board of Trustees has overall responsibility for supervising the SNAP fund’s business and affairs, including the oversight of organizations providing investment advisory, administration, and distribution services to the SNAP fund. PFM Asset Management LLC serves as the investment adviser of the SNAP fund. The SNAP individual investment portfolios are the responsibility of the SNAP investment manager and the governments investing proceeds in the portfolios. These investments are held solely in the SNAP participants’ names. Since the Commonwealth has no fiduciary relationship with local governmental entities participating in the plan, these assets of $2.2 billion are not included in the financial statements.
20. COMMITMENTS
A. Construction Projects
Primary Government
Highway Projects
At June 30, 2016, the Department of Transportationhad contractual commitments of approximately $3.2 billion for construction of various highway projects. Funding for these expenditures is expected to be provided as follows: (1) federal funds –approximately 26.0 percent or $832.0 million, (2) state funds – approximately 71.6 percent or $2.3 billion, and (3) Proceeds from Bonds –approximately 2.4 percent or $78.0 million.
Mass Transit Projects
At June 30, 2016, the Department of Rail and Public Transportation had contractual commitments of approximately $293.1 million for various public transportation, rail preservation, and rail enhancement projects. Funding of the future expenditures is expected to be as follows: 1) State funds – approximately 77.3 percent or $226.5 million, and 2) Federal funds – approximately 22.7 percent or $66.6 million.
Wastewater Treatment Projects
At June 30, 2016, the Department of Environmental Quality was committed to grant contracts with localities to reimburse a portion of construction costs for nutrient reduction facilities at wastewater treatment plants totaling $77.7 million provided by bond proceeds and the Water Quality Improvement Fund.
Other Construction Projects
At June 30, 2016, the Department of General Services had construction commitments of approximately $18.2 million for design work related to capitol complex infrastructure projects.
At June 30, 2016, the Department of Forensic Science had contractual commitments of approximately $13.5 million and non-contractual commitments of $430,700 for construction projects.
At June 30, 2016, the Department of Corrections had construction commitments of $11.8 million for operational and security upgrades.
At June 30, 2016, the Department of Military Affairs had construction commitments of approximately $8.7 million.
At June 30, 2016, the Department of Conservation and Recreation had contractual commitments of approximately $4.5 million and non-contractual commitments of $60,861 for construction projects.

Commonwealth of Virginia 141
At June 30, 2016, the Wilson Workforce and Rehabilitation Center had construction commitments of approximately $7.3 million.
Component Units
Port Projects
At June 30, 2016, the Virginia Port Authority (nonmajor) was committed to construction contracts totaling $145.4 million.
Wallops Island Project
At June 30, 2016, the Virginia Commercial Space Flight Authority (nonmajor) was committed to construction programs totaling $8.1 million.
Treatment Plant
At June 30, 2016, the Hampton Roads Sanitation District Commission (nonmajor) was committed to construction contracts totaling $161.1 million.
Higher Education Institutions
Colleges and universities (nonmajor) had contractual commitments as of June 30, 2016, of approximately $585.1 million primarily for construction contracts. Higher education foundations’ commitments total approximately $19.4 million and are primarily for construction contracts.
B. Operating Leases
The Commonwealth has entered into numerous agreements to lease land, buildings, and equipment. Most of the operating leases contain the provision that the Commonwealth may renew the operating leases at the expiration date of the lease on a month-to-month basis. In most cases, management expects that in the normal course of business, leases will be renewed or replaced by other leases of a similar nature. Rental expense for the primary government under these operating leases for the year ended June 30, 2016, was $69.4 million for governmental activities (includinginternal service funds) and $26.5 million for business-type activities. Rental expense for the discrete component units (excluding foundations) for the year ended June 30, 2016, was $148.6million. The Commonwealth has, as of June 30,2016, the following minimum rental payments due under the above leases (dollars in thousands):
Governmental Business-typeActivities Activities Units (1)
2017 $ 62,868 $ 22,478 $ 141,8792018 52,528 18,550 128,8622019 41,342 14,571 111,2172020 32,780 10,620 102,4932021 26,202 7,090 97,211
2022-2026 65,301 13,174 486,2312027-2031 3,320 - 430,3252032-2036 1,190 - 2,3292037-2041 23 - 8232042-2046 42 - 8232047-2051 - - 521
Total $ 285,596 $ 86,483 $ 1,502,714
ComponentPrimary Government
Note (1): The above amounts exclude operating lease obligations of foundations.
Foundations (2)
2017 $ 5,9502018 5,1282019 2,9182020 2,3722021 2,071
Thereafter 14,519Total $ 32,958
Note (2): Foundations represent FASB reporting entities defined in Note 1.B. Rental expense for the year ended June 30, 2016, was approximately $6.3 million.
Lease agreements are for various terms and contain nonappropriation clauses indicating that continuation of the lease is subject to funding by the General Assembly.
C. Investment Commitments – Virginia Retirement System
The Virginia Retirement System extends investment commitments in the normal course of business, which, at June 30, 2016, amounted to $10.2 billion.
D. Virginia Transportation Infrastructure Bank
Section 33.2-1500 of the Code of Virginia states the Virginia Transportation Infrastructure Bank is intended to help alleviate a critical financing need for present and future highways within the Commonwealth. This includes toll facilities; mass transit; freight, passenger, and commuter rail; and port, airport and other transportation facilities. As of June 30, 2016, the Department of Transportation had $135.1 million in outstanding loans to the City of Chesapeake for the Dominion Boulevard Project and Loudoun County for the Pacific Boulevard Project coordinated through the Virginia Resources Authority.

142 Commonwealth of Virginia
E. Tobacco Grants
The Tobacco Region Revitalization Commission (nonmajor component unit) had $126.8 million in grant award commitments not reflected in the accompanying financial statements since eligibility requirements were not met as of June 30, 2016, in accordance with GASB Statement No. 33.
The Virginia Foundation for Healthy Youth (nonmajor component unit) had $8.4 million in grant commitments and outstanding contracts not reflected in these statements since eligibility requirements were not met as of June 30, 2016, in accordance with GASB Statement No. 33.
F. Other Commitments
Primary Government
At June 30, 2016, the Department of BehavioralHealth and Developmental Services had contractual commitments of approximately $11.2 million.
At June 30, 2016, the Department of Corrections had contractual commitments of approximately $267.5 million and non-contractual commitments of approximately $531.8 million for detention services, medical care, and food services.
At June 30, 2016, the Virginia Department of Health had commitments of approximately $34.3 million to localities, trauma centers, trainers, grants to rescue squads, and water supply assistance grants.
At June 30, 2016, the Department of Motor Vehicles had contractual commitments of approximately $28.2 million for security technology services.
At June 30, 2016, the Virginia Employment Commission had contractual commitments of approximately $12.5 million and non-contractual commitments of approximately $7.5 million for information systems modernization projects. The agency also had $6.5 million in other contractual commitments.
At June 30, 2016, the Department of EnvironmentalQuality had commitments of approximately $16.3 million for reimbursement claims for cleanup of leaking underground storage tanks.
The Enterprise Applications (internal service fund) began an upgrade of the Cardinal Financial System in May 2016. At June 30, 2016, the upgrade had contractually obligated commitments of $9.0 million.
The Virginia College Savings Plan (major enterprise fund) administers the Virginia529 prePAID Program. At June 30, 2016, the Program had $157.3 million in private equity commitments.
The Virginia Wireless E-911 (nonmajor enterprise fund) had $6.0 million in outstanding grants
awarded but not yet disbursed to localities as of June 30, 2016, since all of the eligibility criteria have not been met in accordance with GASB Statement No. 33.
Component Units
The Virginia Housing Development Authority (major) had $703.5 million in commitments to fund new loans as of June 30, 2016, since all of the eligibility criteria have not been met in accordance with GASB Statement No. 33.
The Virginia Resources Authority (major) was obligated to disburse $126.6 million in loan commitments to various localities and other governmental entities in the Commonwealth of Virginia as of June 30, 2016, since all of the eligibility criteria have not been met in accordance with GASB Statement No. 33.
The Virginia Small Business Financing Authority (nonmajor) had $1.2 million in loan commitments to banks and borrowers as of June 30, 2016, since all of the eligibility criteria have not been met in accordance with GASB Statement No. 33.
21. ACCRUED LIABILITY FOR COMPENSATED ABSENCES
Employees accrue annual leave at a rate of four to nine hours semimonthly, depending on their length of service. The maximum leave accumulation is dependent upon years of service, but in no case may it exceed 432 hours at the end of the leave year. The maximum compensation for annual leave balances is also dependent upon years of service, but in no case may an employee be compensated for more than 336 hours upon separation.
All employees hired after January 1, 1999, are required to enroll in the Virginia Sickness and Disability Program (VSDP) (see Note 16). Under the VSDP, employees receive a specified number of sick and personal leave hours, depending on their length of service, and any balances at the end of the leave year revert. Individuals employed at January 1, 1999, had the option of converting to the VSDP or remaining in the traditional sick leave plan. If converting, the employee’s sick leave balance could be used to purchase retirement credits or be converted to disability credits. If an employee opted to remain in the traditional sick leave program, sick leave accrues at a rate of five hours semimonthly. Employees who leave state service after a minimum of five years employment receive the lesser of 25.0 percent of the value of their disability credits or accumulated sick leave at their current earnings rate or $5,000. All employees leaving state service are paid for accrued annual leave up to the maximum leave year limit at their current earnings rate.
In conformance with Section C60 of the GASB Codification, the monetary value of accumulated vacation, compensatory, overtime, recognition, and sick leave payable upon termination is included in the

Commonwealth of Virginia 143
accompanying financial statements and is reported as Compensated Absences. In the government-wide statements, proprietary fund statements, and discrete component unit fund statements, compensated absence amounts are segregated into two components – the amount due within one year and the amount due in more than one year. Compensated absences due within one year consist of an estimate of the amount that will be used by active employees for paid time off and/or paid upon termination, plus the actual amount paid after June 30 for employees terminating on or before June 30. In the governmental fund statements, amounts to be paid from expendable resources are recognized as fund liabilities in the applicable governmental fund types as long-term liabilities and represent payments to employees for separations that occurred on or before June 30. Amounts not payable from expendable resources are reflected in the governmental activities column in the Government-wide Statement of Net Position (see Note 26). All amountsrelated to the fiduciary funds are recognized in those funds.
The liability at June 30, 2016, was computed using salary rates effective at that date, and represents vacation, compensatory, overtime, recognition, and sick leave earned, or disability credits held by employees, up to the allowable ceilings.
22. POLLUTION REMEDIATION OBLIGATIONS
The Commonwealth has pollution remediation obligations of $11.3 million, of which $2.0 million is due within one year. With the exception of the Department of Environmental Quality (DEQ), agencies estimated future obligations based on professional consultant estimates and/or historical project expenses of similar projects; however, there is the potential for change in estimates due to price increases or reductions, technology, or applicable laws and regulations. Remediations for DEQ are not estimates but contractual obligations between the Commonwealth and the U.S. Environmental Protection Agency (EPA), and any change due to a reconciliation of incurred costs requires mutual consent and contract amendment.
The estimated Commonwealth pollution remediation liability relates to the anticipated cost of hazardous waste removal, cleanup relating to leakage of underground storage tanks, soil and groundwater contaminations, dump site cleanups, asbestos, lead contamination and remediation relating to superfund state contracts.
Agencies involved in remediation include:
� Department of Corrections (DOC)� Department of Emergency Management (VDEM)� Department of Environmental Quality (DEQ)� Department of Juvenile Justice (DJJ)� Department of Transportation (VDOT)
A Facility Lead Agreement was signed between the EPA and VDOT to resolve an issue concerning the storage of lab wastewater in an outdoor lined surface impoundment that operated between 1979 and 1983 for which contamination is present in soil and groundwater. DOC was fined by the EPA in September/October 2003. DOC proposed to conduct a Supplemental Environmental Project (SEP) which included the formation of the Pollution Prevention Section of the Environmental Services Unit, disclosure of all environmental deficiencies to both the EPA and DEQ and corrections of those deficiencies.
The following pollution remediation outlays could notreasonably be estimated as of June 30, 2016:
� VDEM relating to cleanup of an emergency fuel storage facility
� DEQ relating to groundwater treatment and landfill clean-up
� DJJ relating to petroleum storage tank removal� VDOT relating to groundwater contamination
23. INSURANCE
A. Self-Insurance
The Commonwealth maintains two types of self-insurance plans. The first type of self-insurance is a health care plan administered by the Department of Human Resource Management for Commonwealth employees. The plan is accounted for in the Health Care Internal Service Fund. Interfund premiums are accounted for as internal activity receipts from other funds. At June 30, 2016, $123.4 million is reported as the estimated claims payable for this fund, which is undiscounted as nearly all health care claims are current in nature. The estimated liability is based upon actual claims that have been submitted as well as actuarially determined claims incurred but not reported as described in Note 1.U.Changes in the balances of claims liabilities (dollars in thousands) during the current and prior fiscal years are as follows:
2015-2016 $ 118,005 $ 1,314,073 $ (1,308,693) $ 123,3852014-2015 $ 124,890 $ 1,215,569 $ (1,222,454) $ 118,005
BalanceJuly 1,
BalanceJune 30, (1)
CurrentYear Claimsand Changesin Estimates
ClaimPayments
(1) The entire ending balance shown above is due within one year.
The second type of plan, Risk Management, is administered by the Department of the Treasury, Division of Risk Management and the Departmentof Human Resource Management, Worker’s Compensation Program. These plans are accounted for in the Risk Management Internal Service Fund. The Department of the Treasury

144 Commonwealth of Virginia
administers risk management programs providing property, general (tort) liability, medical malpractice, automobile and surety bond exposures for the Commonwealth of Virginia as provided in Sections 2.2-1834 through 1838 and Section 2.2-1840 of the Code of Virginia. Established subject to the approval of the Governor, risk management plans provide state agencies with protection through purchased insurance, self-insurance or a combination thereof. Interfund premiums for the fund are accounted for as internal activity receipts from other funds. The claims payable is an estimated liability based upon actual claims that have been submitted as well as actuarially determined claims incurred but not reported. AtJune 30, 2016, $835.3 million is reported as the estimated claims payable for the risk management plan. This amount is discounted to present value at a rate of 1.4 percent. Undiscounted claims payable at June 30, 2016, is $1.0 billion. The estimated losses are based upon actual claims that have been submitted, as well as claims incurred but not reported. Changes in the balances of claims liabilities (dollars in thousands) during the current and prior fiscal years are as follows:
2015-2016 $ 651,421 $ 260,020 $ (76,158) $ 835,2832014-2015 $ 624,543 $ 98,941 $ (72,063) $ 651,421
CurrentYear Claims
July 1, in Estimates Payments June 30, (1)Balance and Changes Claim Balance
(1) Of the balance shown above, $75.0 million is due within one year.
For workers’ compensation, the Commonwealth assumes the full risk of claims filed. For tort and automobile, liability is assumed at a maximum of $2.0 million per occurrence. Medical malpractice is assumed at the maximum per occurrence recovery limited stated in Section 8.01-581.15 of the Code of Virginia. Risk Management purchases commercial insurance to protect state-owned property with deductibles as stated in the insurance policies.
The Commonwealth has not had any insurance settlements exceed the coverage during the past three years.
At June 30, 2016, the Virginia Commonwealth University Health System Authority (Authority) (a blended component unit of the Virginia Commonwealth University – nonmajor component unit) reports the following claims payable amounts: estimated workers’ compensation claims of $21.5 million and estimated losses on malpractice claims of $3.4 million. MCV Associated Physicians (component unit of the Authority) reports claims payable of $22.2 million for estimated losses on malpractice claims. Virginia Premier Health Plan (component unit of the Authority) reports claims payable of $84.5 million for estimated medical claims payable. Additional information on claims
payable can be found in the Authority’s individually published financial statements.
Virginia International Terminals, LLC (VIT) (a blended component unit of the Virginia Port Authority – nonmajor) is partially self-insured for certain workers’ compensation claims. The Authority maintains insurance coverage of $5.0 million per claim, but is obligated to pay the first $1.0 million of any individual’s claims per incident. The Authority bears some self-insurance risk for claims cost in excess of employee premiums/contributions received. Pursuant to a joint arrangement with the Virginia Port Authority, (VPA) (nonmajor) the entity carries stop loss insurance to mitigate exposure to significant claims. The stop loss policy is on a calendar year basis, with renewals effective each January 1. During the calendar years of 2015 and 2016, the individual claim cost limit (deductible) under the policy for the Authority was $125,000. The aggregate deductible for VIT and VPA combined claims in excess of the $125,000 individual limit was $7.0 million for calendar year 2016 and $6.8 million for calendar year 2015. As of June 30, 2016, the Authority had accrued $373,830 for claims incurred but not reported (IBNR).
B. Public Entity Risk Pools
The Commonwealth administers two types of public entity risk pools for the benefit of local governmental units: health care and risk management insurance. The Local Choice Health Care plan was established to make comprehensive health care insurance available to localities and political subdivisions at affordable rates and with stable premiums. During the fiscal year, there were 335 local government units participating in the pool. This includes 40 school districts, 40 counties, 125 cities/towns, and 130 other subdivisions. This program is accounted for in the Local Choice Health Care Enterprise Fund (nonmajor).
The Department of Human Resource Management, under Section 2.2-1204 of the Code of Virginia, has the authority to design, set rates, and administer the Local Choice Health Care fund. The pool’s standard contract period is one year. However, a member group may withdraw on the last day of any month with three month’s written notice. Contributions are based on the current necessary contribution and the amortization of experience adjustments in the pool. At June 30, 2016, $36.3 million is reported as the actuarially determined estimated claims payable for this fund based on claims incurred but not reported.
The actuarial liability is determined for the membership pool in total and then adjusted for each locality based on individual historic and demographic data. If the pool’s assets were to be exhausted, the program participants would share the responsibility for any liabilities or deficits.

Commonwealth of Virginia 145
The Department of the Treasury, Division of Risk Management administers the VARisk and VARisk2 risk management programs for political subdivisions, constitutional officers and others in accordance with Section 2.2-1839 of the Code of Virginia. These pools were established to provide an economical, low-cost alternative to the commercial insurance market for the Commonwealth’s political subdivisions. These risk programs are accounted for in the Risk Management Enterprise Fund (nonmajor). The pool is established subject to approval by the Governor. It may be insurance, self-insurance, or any combination thereof, and must provide protection and legal defense against liability. Participation is voluntary and open to those identified in Section 2.2-1839, Code of Virginia. As of June 30, 2016,there were 518 units of local government in the pool, including 1 city, 22 towns, and 28 counties. The remaining 467 units include a large variety of boards, commissions, authorities, and special districts.
The VARisk program is comprised of constitutional officers and regional jails, and participation is not mandated by the Code of Virginia. However, the Compensation Board (part of the primary government) requires participation by all constitutional officers.
The VARisk2 program is comprised of local governments and has a minimum membership period of one year. However, a member group can cancel membership and withdraw from the plan on their coverage anniversary date or at the end of the fiscal year with 30 days’ notice.
No excess insurance or reinsurance is provided. The risk assumed by the VARisk and VARisk2 pool for liability is $1.0 million per occurrence, with the exception of sheriffs and their deputies, which is $1.5 million per occurrence.
At June 30, 2016, $31.5 million and $4.6 million is reported as estimated claims payable for the VARisk and the VARisk2 programs, respectively.These figures are actuarially determined for the funds in total and are reported at gross. They do not reflect possible reimbursements for insurance recoveries.
The following schedule (dollars in thousands) shows the changes in claims liabilities for the past two fiscal years.
June 30, June 30,
Unpaid Claims and Claim Adjustment Expenses at Beginning of Fiscal Year (4) $ 31,839 $ 33,028 $ 29,272 $ 31,440
Incurred Claims and Claim Adjustment Expenses: Provision for Insured Events of the Current Fiscal Year (4) 383,850 327,910 11,799 8,875 Changes in Provision for Insured Events of Prior Fiscal Years (4) - - (94) (307)
Total Incurred Claims and Adjustment Expenses 383,850 327,910 11,705 8,568
Payments: Claims and Claim Adjustment Expenses Attributable to Insured Events of the Current Fiscal Year (4) 379,376 329,099 1,206 922 Claims and Claim Adjustment Expenses Attributable to Insured Events of the Prior Fiscal Year (4) - - 4,786 9,186
Total Payments 379,376 329,099 5,992 10,108
Change in Provision for Discounts - - 1,078 (628)
Total Unpaid Claims and Claim Adjustment Expenses at End of the Fiscal Year (Discounted) (1) (2) (3) $ 36,313 $ 31,839 $ 36,063 $ 29,272
Total Unpaid Claims and Claim Adjustment Expenses at End of the Fiscal Year (Undiscounted) $ 36,313 $ 31,839 $ 37,261 $ 31,551
Local Choice Health Care Risk ManagementJune 30,
2016June 30,
20152016 2015
Note (1): The entire balance for Local Choice Health Care, $36,313 (dollars in thousands) is due within one year.
Note (2): Of the balance shown above for Risk Management, $10,245 (dollars in thousands) is due within one year.
Note (3): The interest rate used for discounting is 1.4 percent.
Note (4): Fiscal year 2015 balances for Risk Management have been modified to agree to their actuary schedule.

146 Commonwealth of Virginia
24. ACCOUNTS PAYABLE
The following table (dollars in thousands) summarizes Accounts Payable as of June 30, 2016.
Salary/Vendor Wage Other Total
Primary Government: General $ 166,869 $ 102,254 $ 56 $ - $ - $ 269,179 Major Special Revenue Funds: Commonw ealth Transportation 320,079 32,916 3,791 - - 356,786 Federal Trust 54,926 17,254 3,116 - - 75,296 Literary 2 - - - - 2 Nonmajor Governmental Funds 33,616 18,061 4,947 445 - 57,069 Major Enterprise Funds: Virginia Lottery (2) 10,534 1,623 - 5,253 - 17,410 Virginia College Savings Plan (2) 312 479 - 26 - 817 Unemployment Compensation 104 - - - - 104 Nonmajor Enterprise Funds 62,853 5,844 - - - 68,697 Internal Service Funds 98,841 2,915 273 - - 102,029 Private Purpose Trust Funds 161 167 - 1,754 - 2,082 Pension and Other Employee Benefit Trust Funds (3) 1,044 2,422 - 41,255 - 44,721 Agency Funds 2,222 - - 4,678 - 6,900 Total Primary Government (4) $ 751,563 $ 183,935 $ 12,183 $ 53,411 $ - $ 1,001,092
Discrete Component Units: Virginia Housing Development Authority $ 2,353 $ 2,621 $ - $ 35,330 $ - $ 40,304 Virginia Public School Authority 305 - - - - 305 Virginia Resources Authority 315 7 - - - 322 Nonmajor Component Units 503,319 457,958 43,610 31,505 104,492 1,140,884 Total Component Units $ 506,292 $ 460,586 $ 43,610 $ 66,835 $ 104,492 $ 1,181,815
Retainage Foundations (1)
Note (1): Foundations represent FASB reporting entities defined in Note 1.B.
Note (2): Other Accounts Payable for the Virginia Lottery represents administrative costs payable. Other Accounts Payable for the Virginia College Savings Plan represents program distributions payable.
Note (3): Other Accounts Payable for the Pension and Other Employee Benefit Trust Fund consists of $24,955 (dollars in thousands) in investment management fees and $16,300 (dollars in thousands) in program benefit liabilities.
Note (4): Fiduciary liabilities of $53,703 (dollars in thousands) are not included in the Government-wide Statement of Net Position. In addition, governmental fund liabilities of $125,673 (dollars in thousands) are included in the Government-wide Statement of Net Position, but excluded from the above amounts.

Commonwealth of Virginia 147
25. OTHER LIABILITIES
The following table (dollars in thousands) summarizes Other Liabilities as of June 30, 2016.
Lottery Prizes Payable $ - $ - $ - $ - $ 74,955Due to Program Participants, Escrow s, and Providers - - - - -Medicaid Payable 367,440 - 358,676 - -Family Access to Medical Insurance Security Payable 1,345 - 9,879 - -Tax Refunds Payable 439,657 - - - -Insurance Carrier Surety Deposit - - - - -Deposits Pending Distribution 5,222 1,317 - 4,537 -Car Tax Payable 263,025 - - - -Other Liabilities 575 4,366 - 368 -
Total Other Liabilities $ 1,077,264 $ 5,683 $ 368,555 $ 4,905 $ 74,955
Transportation (1) FundsGeneralFederal
LotteryTrustCommonwealth VirginiaGovernmental
Primary Government
Nonmajor
Lottery Prizes Payable $ - $ - $ - $ - $ -Due to Program Participants, Escrow s, and Providers 754 35,079 - - 4,656Medicaid Payable - - - - -Family Access to Medical Insurance Security Payable - - - - -Tax Refunds Payable - - - - -Insurance Carrier Surety Deposit - - - - -Deposits Pending Distribution - - 178 433 -Car Tax Refund Payable - - - - -Other Liabilities 13,805 - 95 - -
Total Other Liabilities $ 14,559 $ 35,079 $ 273 $ 433 $ 4,656
Private
Funds Funds
VirginiaCollegeSavingsPlan (2) Compensation Funds
Unemployment TrustEnterprise
Primary Government
ServiceInternal PurposeNonmajor

148 Commonwealth of Virginia
Lottery Prizes Payable $ - $ - $ 74,955Due to Program Participants, Escrow s, and Providers - 42,571 83,060Medicaid Payable - - 726,116Family Access to Medical Insurance Security Payable - - 11,224Tax Refunds Payable - - 439,657Insurance Carrier Surety Deposit - 454,210 454,210Deposits Pending Distribution - 78,627 90,314Car Tax Refund Payable - - 263,025Other Liabilities 385,398 1,903 406,510
Total Other Liabilities $ 385,398 $ 577,311 $ 2,549,071
Trust Funds (3) Funds Government (4)Benefit Agency Primary
Primary Government
TotalEmployee
Pensionand Other
Note (1): Other Liabilities of $4,366 (dollars in thousands) reported by the Commonwealth Transportation Fund (major special revenue) is primarily related to the remaining balance of managing the construction of the Unmanned Aircraft Systems (UAS) runway project for the Virginia Commercial Space Flight Authority (nonmajor component unit).
Note (2): Other Liabilities of $13,805 (dollars in thousands) reported by the Virginia College Savings Plan represent amounts associated with pending investment trades.
Note (3): Other Liabilities of $385,398 (dollars in thousands) reported in Pension and Other Employee Benefit Trust Funds are made up of $35,226 (dollars in thousands) in funds held for the Commonwealth Health Research Fund; $18,793 (dollars in thousands) in funds held for the Commonwealth’s Attorneys Training Fund; $34,488 (dollars in thousands) in other funds managed by the System; $276,992 (dollars in thousands) in pending investment transactions, including $275,613 (dollars in thousands) in hedge fund funding and margin collateral, and $1,379 (dollars in thousands) in other investment payables; $16,718 (dollars in thousands) in other payables related to the System benefit plans; $2,362 (dollars in thousands) in foreign taxes payables related to the System benefit plans, and $819 (dollars in thousands) in dividends payable related to the System benefit plans.
Note (4): Fiduciary liabilities of $967,365 (dollars in thousands) are not included in the Government-wide Statement of Net Position. Governmental fund liabilities of $82,052 (dollars in thousands) are included in the Government-wide Statement of Net Position, but excluded from the above amounts.
Accrued Interest Payable $ 48,278 $ 55,802 $ 26,642 $ 85,719 $ 74,789 $ 291,230Other Liabilities 5,089 - 15,367 - 227,905 248,361Deposits Pending Distribution - - - 2,769 414,035 416,804Short-term Debt 444,600 - - - 192,670 637,270Grants Payable - - - - 4,025 4,025
Total Other Liabilities $ 497,967 $ 55,802 $ 42,009 $ 88,488 $ 913,424 $ 1,597,690
Units
TotalComponent
VirginiaVirginia Virginia
Resources BuildingAuthority UnitsAuthorityAuthority Authority
Component Units
NonmajorDevelopment
CollegeHousing PublicComponentSchool
Virginia

Commonwealth of Virginia 149
Medicaid Payable
Medicaid Payable represents services rendered but not billed by providers and potential liability resulting from cost reports not settled as of year-end. Providers subject to cost settlement are paid in the interim based on established per diem or diagnosis related group rates for services.
The Department of Medical Assistance Services (DMAS) estimates, based on past experience, the total amount of Medicaid claims that will be paid from the Medicaid program in the future which relate to services provided before year-end. At June 30, 2016, the estimated liability related to Medicaid claims totaled $726.1 million. Of this amount, $367.4 million is reflected in the General Fund (major governmental) and $358.7 million in the Federal Trust Special Revenue Fund (major governmental).
Family Access to Medical Insurance Security Payable
DMAS estimates the total amount of claims that will be paid from the Family Access to Medical Insurance Security program in the future which relate to services provided before year-end. At June 30, 2016, the estimated liability related to claims totaled $11.2 million. Of this amount, $1.3 million is reflected in the General Fund (major governmental) and $9.9 million in the Federal Trust Special Revenue Fund (major governmental).
Tax Refunds Payable
Tax refunds payable represent refunds due on individual tax returns filed for the calendar year ended on or before December 31, 2015, and on business tax returns filed for corporate fiscal years ending on or before June 30, 2016. The individual tax return filing deadline is May 1 of each year for the preceding calendar year. The corporate tax return filing deadline is the 15th day of the fourth month following the close of the corporate fiscal year.
Car Tax Refund Payable
During the year ended June 30, 1998, the General Assembly passed the Personal Property Tax Relief Act. Under the terms of this legislation, the Commonwealth assumed financial responsibility for a portion, ranging from 12.5 percent to 70.0 percent, of the personal property taxes assessed by localities.
During 2004, the General Assembly modified this legislation. Chapter 1 of Special Session 1 (2004) established a $950.0 million limit on the amount the Commonwealth would appropriate for personal property tax relief, beginning in tax year 2006. It further established that each county, city, and town would receive a fixed percentage of the $950.0 million, with payments to begin on or after July 1, 2006 (fiscal year 2007). The accrued liability amount of $263.0 million reflects payments owed to localities as of June 30 and paid in July.
Termination Benefits
During fiscal year 2016, the Commonwealth laid off 272employees. The affected employees had the option of volunteering for enhanced retirement benefits or severance benefits. The enhanced retirement benefits option was elected by 32 employees, and the remaining 240 employees elected severance benefits. The severance benefits include salary payments based on years of service and insurance premium payments for health and life insurance. All severance benefits were initiated during fiscal year 2016 and will end no later than June 30, 2017. The benefit cost expended and the outstanding liability as of June 30, 2016 for governmental funds, are $3.5 million and $1.4 million, respectively. Since the severance benefits last for a maximum of 12 months, discounting of future cash flows is unnecessary. Additionally, the estimated payments are calculated using the Department of Human Resources’ Termination Benefits Calculator and actual costs.
Short-term Debt
Short-term debt results from borrowings from anticipation notes, lines of credit, and similar loans with parties external to the primary government. The primary government’s policy is to disclose activity related to short-term borrowings occurring during the fiscal year.For fiscal year 2016, the primary government’s agencies did not participate in short-term borrowings with external parties.
Various higher education institutions and foundations (nonmajor component units) have short-term debt totaling $192.6 million. Of this amount, $167.1 million is primarily to provide bridge financing for capital projects. The remaining short-term debt is primarily for working capital, property acquisition, and operations. The Virginia Housing Development Authority (major component unit) has borrowing from lines of credit in the amount of $444.6 million. The Library of Virginia Foundation (nonmajor component unit) has a $30,000 note with a related party.
The balance of Other Liabilities is spread among various other funds.
26. LONG-TERM LIABILITIES
Commonwealth bonds are issued pursuant to Section 9 of Article X of the Constitution of Virginia. Section 9(a) bonds have been issued to redeem previous debt obligations. Section 9(b) bonds have been authorized by the citizens of Virginia through bond referenda to finance capital projects. These bonds are retired through the use of state appropriations. Section 9(c) bonds are issued to finance capital projects which, when completed, will generate revenue to repay the debt. Section 9(a), 9(b), and 9(c) bonds are tax-supported general obligation bonds and are backed by the full faith and credit of the Commonwealth. No other long-term debt obligations are backed by the full faith and credit of the Commonwealth.

150 Commonwealth of Virginia
Section 9(d) bonds are revenue bonds that are not backed by the full faith and credit of the Commonwealth. These bonds are not general obligation bonds and are not deemed to constitute a legal liability of the Commonwealth. However, this debt may be supported by state appropriations in whole or in part, as in the case of certain debt of the Virginia Port Authority (nonmajor component unit) and the Commonwealth Transportation Board (primary government). Other 9(d) revenue bonds are payable from general revenues of the component units, or from revenues of specific revenue-producing capital projects such as the teaching hospitals, dormitories, student centers, and dining halls at the various colleges and universities (nonmajor component units).
Certain 9(d) bonds are considered, with 9(a), 9(b), and 9(c) bonds, to be tax-supported debt of the Commonwealth. Tax-supported debt includes all bonds and short-term debt for which debt service payments are made or are ultimately pledged to be made from tax revenues (net of sinking fund requirements).
Other 9(d) revenue bonds are considered debt not supported by taxes. For this debt, the Commonwealth has no direct or indirect pledge of tax revenues. In certain limited cases, the Commonwealth has made a moral obligation pledge. A government’s moral obligation pledge provides a deficiency make-up for bondholders in the event pledged revenues prove to be insufficient. If a revenue deficiency exists, monies held in a debt service reserve fund are used to pay bondholders. The issuer then requests that the legislative body provide an appropriation to replenish the reserve fund before subsequent debt service is due. The legislative body may, but is not legally required to, replenish the reserve fund.
The following schedule presents the total long-term liabilities of the Commonwealth, and the portion of these amounts which are due within one year, as reported on the Government-wide Statement of Net Position.
(Dollars in Thousands)Primary Government:
Governmental Activities:(1)General Obligation Bonds: (2)
9(b) Public Facilities (3) $ 571,915 $ 53,1109(c) Parking Facilities (3) 15,155 8909(c) Transportation Facilities (3) 14,562 2,620
Total General Obligation Bonds 601,632 56,620Nongeneral Obligation Bonds - 9(d):
Transportation Debt (3) (4) 3,385,385 167,190Virginia Public Building Authority (3) 2,441,413 177,020
Total Nongeneral Obligation Bonds 5,826,798 344,210Other Long-term Obligations:
Net Pension Liability (9) 4,419,257 -OPEB Liability (11) 734,064 -Compensated Absences 317,053 167,612Capital Lease Obligations 46,524 7,024Pollution Remediation Obligations 11,308 2,012Notes Payable 114 114Installment Purchase Obligations 108,877 12,096Economic Development Authority Obligations (3) 44,712 5,870Other Liabilities 47,657 8,355
Total Other Long-term Obligations 5,729,566 203,083Total Governmental Activities (3) 12,157,996 603,913
Business-type Activities: (1) (5)Other Long-term Obligations:
Net Pension Liability 140,522 -OPEB Liability 25,113 -Compensated Absences 10,003 5,915Capital Lease Obligations 5,359 334Tuition Benefits Payable 2,035,608 250,472Lottery Prizes Payable 129,895 13,422
Total Other Long-term Obligations 2,346,500 270,143Total Business-type Activities 2,346,500 270,143
Total Primary Government 14,504,496 874,056
WithinOne Year
Total Long-term LiabilitiesJune 30, 2016
Amount DueBalanceAt
June 30

Commonwealth of Virginia 151
(Dollars in Thousands)Component Units:
General Obligation Bonds: (2)Higher Education Fund - 9(c) Bonds (3) 877,118 52,115
Nongeneral Obligation Bonds:Higher Education Institutions - 9(d) (3) (5) 2,081,823 22,457Virginia College Building Authority (3) 4,049,060 255,895Virginia Port Authority (3) (6) 527,887 17,070Virginia Housing Development Authority (3) (5) 4,320,935 456,903Virginia Resources Authority (3) (7) 3,611,530 175,652Virginia Public School Authority (3) (5) 3,655,914 237,348Hampton Roads Sanitation District Commission (3) (5) 879,294 76,477Virginia Biotechnology Research Partnership Authority (3) 26,743 3,665Foundations (5) (8) 966,746 47,681
Total Nongeneral Obligation Bonds 20,119,932 1,293,148Other Long-term Obligations:
Net Pension Liability (10) 2,821,359 -OPEB Liability (12) 961,908 -Compensated Absences 293,026 220,315Capital Lease Obligations 71,403 4,066Notes Payable (5) 2,041,726 166,471Installment Purchase Obligations 50,825 11,825Trust and Annuity Obligations (5) (13) 39,726 -Other Liabilities (5) 282,010 41,655
Total Other Long-term Obligations (Excluding Foundations) 6,561,983 444,332Other Long-term Obligations (Foundations): (5) (8)
Compensated Absences 15,855 11,732Capital Lease Obligations 95 64Notes Payable 304,389 10,312Trust and Annuity Obligations (13) 74,703 3,022Other Liabilities 352,960 20,026
Total Other Long-term Obligations - Foundations 748,002 45,156Total Other Long-term Obligations 7,309,985 489,488
Total Component Units 28,307,035 1,834,751Total Long-term Liabilities $ 42,811,531 $ 2,708,807
One Year
Total Long-term Liabilities
Amount DueWithin
June 30, 2016Balance
AtJune 30
1. Pursuant to GASB Statement No. 34, governmental activities include internal service funds. Business-type activities are considered enterprise funds.
2. Total general obligation debt of the Commonwealth is $1.5 billion.3. Amounts are net of any unamortized discounts and premiums.4. This debt includes $663.1 million that is not supported by taxes.5. This debt is not supported by taxes.6. This debt includes $252.6 million that is not supported by taxes.7. This debt is not supported by taxes; however, $907.2 million is considered moral obligation debt.8. Foundations represent FASB reporting entities defined in Note 1.B.9. This does not include net pension liabilities from fiduciary funds of $3.7 million. 10. This includes net pension liabilities that do not relate to the Virginia Retirement System’s State Plan from the Hampton Roads Sanitation
District Commission and the Virginia Port Authority of $26.1 million and $18.2 million, respectively. This debt is not supported by taxes. 11. This does not include OPEB obligations from fiduciary funds of $668,523.12. This includes OPEB obligations that do not relate to the Virginia Retirement System from University of Virginia of $55.7 million and Virginia
Port Authority of $1.3 million. 13. These generally represent split-interest agreements that represent donor contributed assets with the requirement that an annual distribution be
made to the donor or specified beneficiary. The annual distributions are usually for a fixed dollar amount or a fixed percentage of the trust's fair market value. The present value of these commitments is reported as Trust and Annuity Obligations.

152 Commonwealth of Virginia
Primary Government
Transportation Facilities Debt
Transportation Facilities Bonds include $14.6 million of Section 9(c) general obligation bonds and $3.4 billion of Transportation Facilities Section 9(d) debt. The Section 9(d) debt includes $2.7 billion of Section 9(d) revenue bonds and $663.1 million of Grant Anticipation Revenue Vehicles (GARVEES) in addition to the outstanding Section 9(d) revenue bonds. 9(c) principal and interest requirements for the current year totaled $3.2 million. 9(d) principal and interest requirements for the current year totaled $321.6 million. The Section 9(c) Transportation Facilities Bonds were issued to fund the construction and improvement of the George P. Coleman Bridge. The Section 9(d) Transportation Facilities Bonds were issued to fund the construction of State Route 28, U.S. Route 58, the Northern Virginia Transportation District Program, the Oak Grove Connector (Chesapeake), and costs of certain transportation projects in the Commonwealth. The GARVEES were issued to finance various Federal Aid Transportation projects throughout the Commonwealth. The interest rates for these bonds range from 1.0 percent to 5.0 percent and the issuance dates range from March 15, 2012 to November 21, 2013.
On February 24, 2016, the Commonwealth Transportation Board issued $75.9 million of Series 2016A Refunding, 2016B Refunding, and 2016C Refunding Revenue Bonds. Series 2016A, 2016B, and 2016C Refunding Revenue Bonds will be maturing in annual installments on May 15 in the years 2017 to 2026 and interest is payable on May 15 and November 15 at rates varying from 2.0 to 5.0 percent. The 2015A, 2016B, and 2016C Series bonds were issued to advance refund outstanding Series 2006A, 2006B and 2006C revenue bonds, respectively.
On May 17, 2016, the Commonwealth Transportation Board issued $273.7 million of Commonwealth of Virginia Capital Projects Transportation Revenue Bonds, Series 2016. Series 2016 will be maturing in annual installments on May 15 in the years 2017 to 2041 and interest is payable on May 15 and November 15 at rates varying from 3.0 to 5.0 percent. The net proceeds of the Series 2016 bonds will be used to pay for the costs of certain transportation projects in the Commonwealth and certain costs related to the issuance of the 2016 bonds.
The following schedules detail the annual funding requirements necessary to amortize Transportation Facilities 9(c) bonds and 9(d) debt. Pursuant to the American Recovery and Reinvestment Act, the Commonwealth expects to receive an interest subsidy to reimburse interest payments of $93.7 million for Build America Bonds (BABs) issued. The BABs are applicable to Commonwealth of Virginia Transportation Series 2010A Capital Project Revenue Bonds and Series 2009A Northern Virginia Transportation District Revenue Bonds.
M aturity Principal Interest Total
2017 $ 2,620,000 $ 568,200 $ 3,188,2002018 2,730,000 463,400 3,193,4002019 2,840,000 354,200 3,194,2002020 2,950,000 240,600 3,190,6002021 3,065,000 122,600 3,187,600Add:
Unamortized Premium 356,810 - 356,810Total $ 14,561,810 $ 1,749,000 $ 16,310,810
9(c) TRANSPORTATION FACILITIES BONDSDebt Service Requirements to Maturity
M aturity Principal Interest Total
2017 $ 167,190,000 $ 140,863,057 $ 308,053,0572018 174,120,000 132,938,044 307,058,0442019 172,925,483 125,082,626 298,008,1092020 155,598,337 116,854,146 272,452,4832021 156,765,956 109,440,871 266,206,827
2022-2026 791,044,196 436,063,589 1,227,107,7852027-2031 661,831,299 254,840,213 916,671,5122032-2036 618,380,000 109,790,939 728,170,9392037-2041 166,235,000 12,708,400 178,943,400
Less:Unamortized
Discount (90,804) - (90,804)Add:
Accretion on CapitalAppreciation
Bonds 25,634,032 - 25,634,032Unamortized Premium 295,751,410 - 295,751,410
Total $ 3,385,384,909 $ 1,438,581,885 $ 4,823,966,794
9(d) TRANSPORTATION FACILITIES DEBTDebt Service Requirements to Maturity
Fairfax Economic Development Authority Obligations
In fiscal year 2006, the Fairfax County Economic Development Authority (EDA) issued Section 9(d) revenue bonds to pay for the Commonwealth’s (VDOT) costs of the planning, design and construction of a transportation infrastructure and related public safety operations complex to be developed on the contiguous sites in the county commonly referred to as “Camp 30” for the joint use of VDOT and the county. In fiscal year 2014, Fairfax County EDA issued a series of revenue refunding bonds, which partially refunded Series 2006 revenue bonds. The Commonwealth's obligation is set out in a payment agreement between Fairfax County EDA and the Commonwealth of Virginia, Department of Transportation, in which the Commonwealth agrees to make payments equal to the debt service from amounts appropriated by the General Assembly. The interest rates for these bonds range from 1.0 percent to 5.0 percent and the issue date was March 26, 2014. The principal and interest requirements for the current year totaled $7.8 million. The following schedule details the annual funding requirements necessary to repay these bonds.

Commonwealth of Virginia 153
M aturity Principal Interest Total
2017 $ 5,870,000 $ 1,957,500 $ 7,827,5002018 6,165,000 1,664,000 7,829,0002019 6,470,000 1,355,750 7,825,7502020 6,795,000 1,032,250 7,827,2502021 7,135,000 692,500 7,827,500
2022-2026 6,715,000 335,750 7,050,750Add:
Unamortized Premium 5,562,360 - 5,562,360Total $ 44,712,360 $ 7,037,750 $ 51,750,110
Debt Service Requirements to MaturityFAIRFAX COUNTY ECONOMIC DEVELOPMENT AUTHORITY
Public Facilities Bonds
Section 9(b) general obligation bonds consist of Public Facilities Bonds, Series 2007A, Series 2007B, Series 2008A, Series 2008B, Series 2009A, Series 2009D Refunding, Series 2009E, Series 2012A Refunding, Series 2013B Refunding, Series 2014B Refunding, and Series 2015B Refunding. Bonds were issued to fund construction projects for higher educational institutions, behavioral health, and/or park facilities. The Series 2009D bonds were issued to advance refund outstanding Series 2004A, Series 2005A, and Series 2006B bonds. The Series 2012A bonds were issued to advance refund outstanding Series 2002, Series 2003A, Series 2004A, and Series 2005A bonds. The Series 2013B bonds were issued to advance refund outstanding Series 2005A, Series 2006B, Series 2007A, and Series 2007B. The Series 2014B bonds were issued to advance refund outstanding Series 2004B Refunding. The Series 2015B bonds were issued to advance refund certain maturities of outstanding Series 2007B, Series 2008A, and Series 2008B bonds. Principal and interest requirements for the current year totaled $87.2 million. The interest rates for all bonds range from 3.4 percent to 5.0 percent and the issuance dates range from June 20, 2007, to May 6, 2015. Thefollowing schedule details the annual funding requirements necessary to repay these bonds. Pursuant to the American Recovery and Reinvestment Act, the Commonwealth expects to receive an interest subsidy to reimburse interest payments of $3.5 million for Build America Bonds (BABs) issued. The BABs are applicable to Series 2009E Public Facilities Revenue Bonds.
M aturity Principal Interest Total
2017 $ 53,110,000 $ 23,565,345 $ 76,675,3452018 49,120,000 20,974,502 70,094,5022019 48,220,000 18,718,148 66,938,1482020 48,280,000 16,426,345 64,706,3452021 48,285,000 14,127,445 62,412,445
2022-2026 211,790,000 37,544,375 249,334,3752027-2031 47,720,000 3,544,200 51,264,200
Add:Unamortized Premium 65,389,990 - 65,389,990
Total $ 571,914,990 $ 134,900,360 $ 706,815,350
9(b) PUBLIC FACILITIES BONDSDebt Service Requirements to Maturity
Parking Facilities Bonds
Section 9(c) general obligation bonds consist of Parking Facilities Bonds, Series 2009B and 2009D Refunding, and 2012A Refunding. The Series 2009B bonds were issued to fund the construction of a new 1,000 vehicle parking structure at 7th and Franklin Streets. The Series 2009D Refunding bonds were issued to advance refund outstanding Series 2004A bonds. The Series 2012A Refunding bonds were issued to advance refund outstanding Series 2002 Refunding and Series 2004A bonds. The interest rate for these bonds is 5.0 percent, and the issuance dates range from October 21, 2009, to March 7, 2012. Current year principal and interest requirements totaled $1.4 million. The following schedule details the annual funding requirements necessary to repay these bonds.
M aturity Principal Interest Total
2017 $ 890,000 $ 667,611 $ 1,557,6112018 940,000 623,111 1,563,1112019 985,000 576,110 1,561,1102020 1,035,000 526,860 1,561,8602021 1,085,000 475,110 1,560,110
2022-2026 5,409,045 1,544,202 6,953,2472027-2031 3,090,000 314,000 3,404,000
Add:Unamortized Premium 1,721,040 - 1,721,040
Total $ 15,155,085 $ 4,727,004 $ 19,882,089
9(c) PARKING FACILITIES BONDSDebt Service Requirements to Maturity
Virginia Public Building Authority
Virginia Public Building Authority Section 9(d) bonds consist of 2005D, 2006A, 2006B, 2007A, 2008B, 2009A, 2009B, 2009C, 2009D Refunding, 2010A, 2010B-1, 2010B-2, 2010B-3 Refunding, 2011A, 2011B, 2012A Refunding, 2013A, 2013B Refunding, 2014A, 2014B, 2014C Refunding, 2015A, and 2015B Refunding. All bonds were issued for the purpose of constructing, improving, furnishing, maintaining, and acquiring public buildings for the use of the Commonwealth and also to reimburse localities, regional jail authorities or other combination of localities under the Regional Jail Financing Program. The Series 2009D bonds were issued to advance refund outstanding series 2001A and 2002A Revenue bonds. The Series 2010B-3 bonds were issued to advance refund outstanding series 2002A and 2004B Revenue bonds. The Series 2012A bonds were issued to advance refund outstanding series 2004B and 2005C Revenue bonds. The Series 2013B bonds were issued to advance refund 2006A and 2006B revenue bonds. The Series 2014C bonds were issued to advance refund outstanding Series 2004A Refunding, 2004B, 2004C Refunding, and 2004D Refunding bonds, and certain maturities of the 2005C, 2006A, 2006B, and 2007A bonds. The interest rates range from 0.4 percent to 5.9 percent and the issuance dates range from December 7, 2005, to June 9, 2015. The Series 2005D bonds are variable rate bonds and the rates are reset weekly by the remarketing agent. Current year principal and interest requirements totaled $262.0 million. The following schedule details the

154 Commonwealth of Virginia
annual funding requirements necessary to repay these bonds. Pursuant to the American Recovery and Reinvestment Act, the Commonwealth expects to receive an interest subsidy to reimburse interest payments of $73.1 million for Build America Bonds (BABs) issued. The BABs are applicable to Series 2010 Revenue Bonds.
M aturity Principal Interest Total
2017 $ 177,020,000 $ 99,496,360 $ 276,516,3602018 160,770,000 91,320,746 252,090,7462019 145,340,000 83,950,314 229,290,3142020 146,580,000 77,056,112 223,636,1122021 140,990,000 70,266,508 211,256,508
2022-2026 729,375,000 251,867,088 981,242,0882027-2031 582,900,000 96,788,538 679,688,5382032-2036 174,015,000 13,557,250 187,572,250
Add:Unamortized Premium 184,423,129 - 184,423,129
Total $ 2,441,413,129 $ 784,302,916 $ 3,225,716,045
Debt Service Requirements to Maturity9(d) VIRGINIA PUBLIC BUILDING AUTHORITY BONDS
Component Units
Higher Education Institution Bonds
Higher Education Institution Bonds are comprised of both 9(c) general obligation bonds and 9(d) revenue bonds. Section 9(d) bonds are from several sources as shown on the following schedule (dollars in thousands).
College and university bonds backed by pledgeof general revenue or revenue from specif icrevenue-producing capital projects $ 1,579,951
College and university debt backed exclusivelyby pledged revenues of an institution 501,872
Total Higher Education Institution 9(d) debt $ 2,081,823
The interest rates for these bonds range from 0.4 percent to 6.2 percent and the issuance dates range from March 15, 2006, to June 1, 2016. The Virginia College Building Authority Series 2006B and 2006C bonds, the Virginia Commonwealth University Series 2012A and 2012B bonds, and the Virginia Commonwealth University Health System Authority (a blended component unit of the Virginia Commonwealth University – nonmajor) Series 2013A and 2013B bonds are variable rate bonds and the rates are reset weekly by the remarketing agent.
The following schedules detail the annual funding requirements necessary to amortize Higher Education Institution 9(c) and 9(d) bonds. Pursuant to the American Recovery and Reinvestment Act, the Commonwealth expects to receive an interest subsidy to reimburse interest payments of $303.2 million for Build America Bonds (BABs) issued. The BABs are applicable to General Obligation Series 2010A Bonds, Series 2009F and 2010B 21st Century Virginia College Building Authority Education Facilities Bonds, and the
University of Virginia’s Series 2009 and 2010 General Revenue Bonds.
M aturity Principal Interest Total
2017 $ 52,115,000 $ 34,782,191 $ 86,897,1912018 49,200,000 32,406,271 81,606,2712019 49,400,000 30,206,921 79,606,9212020 49,120,000 28,005,901 77,125,9012021 51,085,000 25,864,783 76,949,783
2022-2026 255,160,955 95,655,042 350,815,9972027-2031 204,605,000 42,399,986 247,004,9862032-2036 83,390,000 9,994,709 93,384,7092037-2041 7,085,000 821,435 7,906,435
Add:Unamortized Premium 75,956,775 - 75,956,775
Total $ 877,117,730 $ 300,137,239 $ 1,177,254,969
9(c) HIGHER EDUCATION INSTITUTION BONDSDebt Service Requirements to Maturity
M aturity Principal Interest (1) Total
2017 $ 22,456,606 $ 86,689,159 $ 109,145,7652018 23,257,056 86,129,917 109,386,9732019 23,748,580 85,512,904 109,261,4842020 24,736,209 84,783,134 109,519,3432021 24,909,971 84,040,745 108,950,716
2022-2026 274,071,338 382,069,191 656,140,5292027-2031 161,569,554 355,215,072 516,784,6262032-2036 207,726,959 331,793,716 539,520,6752037-2041 782,050,000 243,835,759 1,025,885,7592042-2046 449,015,000 61,239,250 510,254,250
Add:Unamortized Premium 88,281,245 - 88,281,245
Total $ 2,081,822,518 $ 1,801,308,847 $ 3,883,131,365
9(d) HIGHER EDUCATION INSTITUTION BONDSDebt Service Requirements to Maturity
Note (1): The future interest requirements exclude any net payments associated with hedging derivative instruments. See Note 14 for more details on hedging derivative instruments.
M aturity Principal Interest Total
2017 $ 255,895,000 $ 153,561,566 $ 409,456,5662018 240,100,000 148,179,789 388,279,7892019 236,355,000 137,346,070 373,701,0702020 228,540,000 126,593,911 355,133,9112021 237,340,000 116,296,788 353,636,788
2022-2026 1,074,025,000 434,100,093 1,508,125,0932027-2031 989,705,000 212,669,792 1,202,374,7922032-2036 478,950,000 41,252,094 520,202,094
Add:Unamortized Premium 308,149,825 - 308,149,825
Total $ 4,049,059,825 $ 1,370,000,103 $ 5,419,059,928
9(d) VIRGINIA COLLEGE BUILDING AUTHORITY BONDSDebt Service Requirements to Maturity
Commonwealth of Virginia 155
Various higher education institutions’ foundations (component units) and a museum foundation (component unit) have bonds outstanding as of year-end. The purpose of a majority of these bonds is forconstruction, property acquisition, and defeasance of prior debt. The following schedule details the future principal payments.
M aturity Principal
2017 $ 46,949,224 (2)2018 53,422,4652019 104,207,3992020 28,350,1772021 44,680,949
Thereafter 689,135,328 Total $ 966,745,542
FOUNDATIONS' BONDS (1)Debt Service Requirements to Maturity
Note (1): Foundations represent FASB reporting entities defined in Note 1.B.
Note (2): This amount excludes $732,000 for demand bonds subject to remarketing agreements and classified as “due within one year” in the accompanying financial statements by a higher education institution foundation.
Virginia Port Authority
The Virginia Port Authority (VPA) (nonmajor) has issued Section 9(d) revenue bonds and notes pursuant to powers provided to its Board of Commissioners by theCode of Virginia. The interest rates for these bonds range from 0.7 percent to 5.5 percent, and the issuance dates range from April 6, 2006, to June 23, 2015. Series 2006A bonds were issued to advance refund $22.9 million of outstanding Series 1996 bonds. Series 2010 bonds were issued to currently refund in full the outstanding principal amount of the Authority’s Series 2009 Bond Anticipation Note. Series 2012 bonds were issued to currently refund in full the outstanding principal amount of the Authority’s Commonwealth Port Fund Revenue Bonds and to pay all or a portion of the expenses incurred with respect to the issuance of the Series 2012 Bonds and the refunding of the Series 2002 Bonds. Series 2012B and 2012C bonds were issued to pay the cost of refunding all or a portion of the Series 2005A and 2005B bonds, and to pay costs of issuance of the 2012B and 2012C bonds. Series 2013 bonds were issued to pay the costs of refunding all or a portion of Series 2003 and 2006 bonds and series 2013 issuance costs. Series 2015A bonds were issued to pay the costs of refunding all of the remaining Series 2003 and 2006 bonds, and to pay costs of issuance of the Series 2015A bonds. Series 2015B bonds were issued to pay the costs of refunding a portion of the remaining Series 2007 bonds, and to pay costs of issuance of the Series 2015B bonds. The following schedule details the annual funding requirements necessary to amortize VPA bonds.
M aturity Principal Interest Total
2017 $ 17,070,000 $ 19,990,624 $ 37,060,6242018 17,605,000 19,583,500 37,188,5002019 17,965,000 19,216,774 37,181,7742020 18,350,000 18,786,266 37,136,2662021 18,815,000 18,295,315 37,110,315
2022-2026 102,795,000 82,384,665 185,179,6652027-2031 121,330,000 62,179,961 183,509,9612032-2036 117,765,000 33,218,875 150,983,8752037-2041 74,650,000 8,150,250 82,800,250
Add:Unamortized Premium 21,542,431 - 21,542,431
Total $ 527,887,431 $ 281,806,230 $ 809,693,661
9(d) VIRGINIA PORT AUTHORITY DEBT Debt Service Requirements to Maturity
Virginia Housing Development Authority
The Virginia Housing Development Authority (VHDA) (major) issued Section 9(d) revenue bonds. The interest rates for these bonds range from 2.1 percent to 6.8 percent and the origination dates range from March 20, 2002, to June 9, 2016. The following schedule details the annual funding requirements necessary to amortize these bonds.
M aturity Principal Interest Total
2017 $ 456,902,903 $ 172,794,166 $ 629,697,0692018 168,950,000 156,039,081 324,989,0812019 188,115,000 149,924,488 338,039,4882020 196,540,000 142,909,339 339,449,3392021 163,365,000 135,864,949 299,229,949
2022-2026 581,430,000 608,499,474 1,189,929,4742027-2031 488,883,096 502,554,624 991,437,7202032-2036 557,409,842 393,721,757 951,131,5992037-2041 573,010,491 254,740,002 827,750,4932042-2046 943,928,652 63,339,235 1,007,267,8872047-2051 2,495,000 207,461 2,702,461
Less:Unamortized
Discount (1,953,454) - (1,953,454)Add:
UnamortizedPremium 1,858,788 - 1,858,788
Total $ 4,320,935,318 $ 2,580,594,576 $ 6,901,529,894
9(d) VIRGINIA HOUSING DEVELOPMENT AUTHORITY BONDSDebt Service Requirements to Maturity

156 Commonwealth of Virginia
Virginia Resources Authority
The Virginia Resources Authority (VRA) (major) issued Section 9(d) revenue bonds. The interest rates for these bonds range from 0.2 percent to 6.3 percent and the origination dates range from March 1, 2000, to June 30, 2016. The following schedule details the annual funding requirements necessary to amortize these bonds.
M aturity Principal Interest Total
2017 $ 175,651,581 $ 141,081,225 $ 316,732,8062018 186,754,941 134,285,290 321,040,2312019 170,551,440 126,324,203 296,875,6432020 175,166,941 118,630,246 293,797,1872021 179,278,442 110,598,557 289,876,999
2022-2026 867,409,771 433,307,615 1,300,717,3862027-2031 786,113,478 246,524,185 1,032,637,6632032-2036 465,710,000 115,570,718 581,280,7182037-2041 234,928,000 44,897,234 279,825,2342042-2046 91,690,000 7,806,217 99,496,217
Less:Unaccreted
CapitalAppreciation
Bonds (32,490,681) - (32,490,681)Add:
UnamortizedPremium 310,765,995 - 310,765,995
Total $ 3,611,529,908 $ 1,479,025,490 $ 5,090,555,398
Debt Service Requirements to Maturity9(d) VIRGINIA RESOURCES AUTHORITY BONDS
Virginia Public School Authority
The Virginia Public School Authority (VPSA) (major) issued Section 9(d) revenue bonds. The interest rates for these bonds range from 0.0 percent to 5.5 percent, and the origination dates range from December 31, 2002, to May 17, 2016. The following schedule details the annual funding requirements necessary to amortize these bonds. Pursuant to the American Recovery and Reinvestment Act, the Commonwealth expects to receive an interest subsidy to reimburse interest payments of $171.8 million for Qualified School Construction Bonds (QSCBs) issued. The QSCBs are applicable to Series 2010-1, 2011-1, 2011-2, and 2012-1 Revenue Bonds.
M aturity Principal Interest Total
2017 $ 237,348,003 $ 143,098,093 $ 380,446,0962018 242,405,000 134,089,692 376,494,6922019 233,195,000 122,659,413 355,854,4132020 229,765,000 111,819,031 341,584,0312021 219,855,000 101,292,097 321,147,097
2022-2026 962,611,000 360,848,714 1,323,459,7142027-2031 954,730,000 148,789,001 1,103,519,0012032-2036 299,790,000 31,323,713 331,113,7132037-2041 44,075,000 3,302,547 47,377,5472042-2046 3,330,000 224,697 3,554,697
Add:Unamortized Premium 228,810,080 - 228,810,080
Total $ 3,655,914,083 $ 1,157,446,998 $ 4,813,361,081
9(d) VIRGINIA PUBLIC SCHOOL AUTHORITY BONDSDebt Service Requirements to Maturity
Hampton Roads Sanitation District Commission
The Hampton Roads Sanitation District Commission (nonmajor) issued bonds under a Master Trust Indenture and a Trust Agreement dated December 1, 1993 and March 1, 2008. The interest cost for these bonds range from 0.3 percent to 5.9 percent. The following schedule details the annual funding requirements necessary to amortize these bonds. The fiscal year 2017 principal amount excludes $50.0 millionfor demand bonds, which are classified as “due within one year” in the accompanying financial statements.The schedule below reflects the debt service on these bonds at their stated maturities.
M aturity Principal Interest Total
2017 $ 26,477,000 $ 31,295,000 $ 57,772,0002018 25,798,000 31,729,000 57,527,0002019 26,485,000 30,674,000 57,159,0002020 27,485,000 29,637,000 57,122,0002021 27,821,000 28,555,000 56,376,000
2022-2026 153,967,000 124,456,000 278,423,0002027-2031 172,273,000 90,556,000 262,829,0002032-2036 164,389,000 52,091,000 216,480,0002037-2041 119,565,000 18,425,000 137,990,0002042-2046 53,565,000 3,157,000 56,722,0002047-2051 8,255,000 - 8,255,000
Add:Unamortized Premium 73,214,000 - 73,214,000
Total $ 879,294,000 $ 440,575,000 $ 1,319,869,000
HAMPTON ROADS SANITATION DISTRICT COMMISSIONDebt Service Requirements to Maturity

Commonwealth of Virginia 157
Virginia Biotechnology Research Partnership Authority
The Virginia Biotechnology Research Partnership Authority (nonmajor) consists of Series 2009 Commonwealth of Virginia Lease Revenue bonds. Coupon interest rates range from 3.0 percent to 5.0 percent.
M aturity Principal Interest Total
2017 $ 3,665,000 $ 1,088,150 $ 4,753,1502018 3,815,000 938,550 4,753,5502019 3,990,000 762,500 4,752,5002020 4,200,000 557,750 4,757,7502021 4,415,000 342,375 4,757,375
2022-2026 4,640,000 116,000 4,756,000Add:
Unamortized Premium 2,017,767 - 2,017,767Total $ 26,742,767 $ 3,805,325 $ 30,548,092
VIRGINIA BIOTECH RESEARCH PARTNERSHIP AUTHORITYDebt Service Requirements to Maturity
Total principal outstanding at June 30, 2016, on all component unit bonds amounted to $21.0 billion.

158 Commonwealth of Virginia
The following schedule summarizes the changes in long-term liabilities:
Schedule of Changes in Long-term Debt and Obligations (1) (2)(Dollars in Thousands)
Primary Government Governmental Activities: Long-term Debt Bearing the Pledge of the Full Faith and Credit of the Commonwealth: General Obligation Bonds - 9(b) and 9(c): Public Facilities Bonds $ 567,320 $ - $ (60,795) $ 506,525 Parking Facilities Bonds 14,156 - (722) 13,434 Transportation Facilities Bonds 16,725 - (2,520) 14,205 Add: Unamortized Premium 77,170 - (9,702) 67,468 Total General Obligation Bonds 675,371 - (73,739) 601,632 Long-term Debt/Obligations Not Bearing the Pledge of the Full Faith and Credit of the Commonwealth: Transportation Facilities Bonds 2,989,510 349,565 (274,985) 3,064,090 Virginia Public Building Authority Bonds 2,417,460 - (160,470) 2,256,990 Economic Development Authority Obligations 44,740 - (5,590) 39,150 Add: Unamortized Premium 488,264 45,270 (47,797) 485,737 Accretion on Capital Appreciation Bonds 23,139 2,495 - 25,634 Less: Unamortized Discount (96) 5 - (91) Installment Purchase Obligations 113,373 13,245 (17,741) 108,877 Notes Payable - Aviation 307 - (193) 114 Compensated Absences 311,406 184,228 (178,581) 317,053 Capital Lease Obligations 57,948 967 (12,391) 46,524 Net Pension Liability 4,133,117 286,140 - 4,419,257 OPEB Liability 654,173 80,396 (505) 734,064 Pollution Remediation Liability 11,954 210 (856) 11,308 Other 33,155 18,346 (3,844) 47,657 Total Long-term Debt/Obligations Not Bearing the Pledge of the Full Faith and Credit of the Commonw ealth 11,278,450 980,867 (702,953) 11,556,364 Total Governmental Activities 11,953,821 980,867 (776,692) 12,157,996
Business-type Activities: Long-term Debt/Obligations Not Bearing the Pledge of the Full Faith and Credit of the Commonwealth: Debt: Non-General Obligation Bonds - 9(d) Route 460 Funding Corporation of Virginia Bonds 445,865 - (445,865) - Add: Unamortized Premium 18,590 - (18,590) - Less: Unaccreted Capital Appreciation Bonds (144,345) 144,345 - - Capital Lease Obligations 5,708 - (349) 5,359 Compensated Absences 10,123 3,188 (3,308) 10,003 Net Pension Liability 125,294 15,228 - 140,522 OPEB Liability 22,051 3,073 (11) 25,113 Lottery Prizes Payable 136,222 6,128 (12,455) 129,895 Tuition Benefits Payable 2,116,769 81,957 (163,118) 2,035,608 Total Business-type Activities 2,736,277 253,919 (643,696) 2,346,500Total Primary Government $ 14,690,098 $ 1,234,786 $ (1,420,388) $ 14,504,496
and OtherIncreases June 30
SubtotalBalanceJuly 1
Issuances Retirementsand OtherDecreases

Commonwealth of Virginia 159
Due WithinOne Year
$ - $ 506,525 $ 53,110- 13,434 890- 14,205 2,620- 67,468 -- 601,632 56,620
- 3,064,090 167,190- 2,256,990 177,020- 39,150 5,870- 485,737 -- 25,634 -- (91) -- 108,877 12,096- 114 114- 317,053 167,612- 46,524 7,024- 4,419,257 -- 734,064 -- 11,308 2,012- 47,657 8,355
.- 11,556,364 547,293- 12,157,996 603,913
- - -- - -- - -- 5,359 334- 10,003 5,915- 140,522 -- 25,113 -- 129,895 13,422- 2,035,608 250,472- 2,346,500 270,143
$ - $ 14,504,496 $ 874,056
June 30Balance
Foundations (3)
Continued on next page

160 Commonwealth of Virginia
Schedule of Changes in Long-term Debt and Obligations (1) (2)(continued)
(Dollars in Thousands)
Component Units Long-term Debt Bearing the Pledge of the Full Faith and Credit of the Commonwealth: General Obligation Bonds - Higher Education 9(c) (5) $ 936,857 $ - $ (59,739) $ 877,118 Long-term Debt/Obligations Not Bearing the Pledge of the Full Faith and Credit of the Commonwealth: Bonds (5) 18,442,527 2,752,258 (2,041,599) 19,153,186 Installment Purchase Obligations 63,812 19 (13,006) 50,825 Capital Lease Obligations 77,456 19,985 (26,038) 71,403 Notes Payable 2,083,619 300,537 (342,430) 2,041,726 Compensated Absences 288,320 321,764 (317,058) 293,026 Net Pension Liability 2,537,695 299,508 (15,844) 2,821,359 OPEB Liability 830,507 131,949 (548) 961,908 Trust and Annuity Obligations 41,348 124 (1,746) 39,726 Other 293,098 763,048 (774,136) 282,010Total Component Units $ 25,595,239 $ 4,589,192 $ (3,592,144) $ 26,592,287
Retirementsand OtherDecreases
BalanceJuly 1
as restated (4)
Issuancesand OtherIncreases June 30
Subtotal
Note (1) Pursuant to GASB Statement No. 34, governmental activities include internal service funds. Business-type activities are considered enterprise funds.
Note (2) Payments on bonded debt that pertain to the Commonwealth's governmental activities are made through the debt service funds. Payments for installment purchases, compensated absences, capital leases, pension, and other obligations that pertain to the Commonwealth's governmental activities are made through the general and all special revenue funds, excluding the Literary Fund(major). Internal service funds predominantly serve the governmental funds. Accordingly, long-term liabilities for these funds are included as part of the total for governmental activities. Enterprise funds, or business-type activities, are self-supporting funds. Accordingly, long-term liabilities are paid from each respective fund.
Note (3) Foundations represent FASB reporting entities defined in Note 1.B.
Note (4) Trust and Annuity Obligations have been restated by $39,596 (dollars in thousands) for a nonmajor component unit for the liability to beneficiaries related to irrevocable split-interest agreements. Other Liabilities have been restated by $6,862 (dollars in thousands) for the Virginia Housing Development Authority (major) to remove third party escrow balances.
Note (5) Amounts are net of any unamortized discounts and premiums.

Commonwealth of Virginia 161
Due WithinOne Year
$ - $ 877,118 $ 52,115
966,746 20,119,932 1,293,148- 50,825 11,825
95 71,498 4,130304,389 2,346,115 176,78315,855 308,881 232,047
- 2,821,359 -- 961,908 -
74,703 114,429 3,022352,960 634,970 61,681
$ 1,714,748 $ 28,307,035 $ 1,834,751
June 30Balance
Foundations (3)
Bond and Note Defeasance
Primary Government
In February 2016, the Commonwealth Transportation Board of the Commonwealth of Virginia issued $10.1 million in Transportation Revenue Refunding Bonds Series 2016A, $13.9 million in Transportation Revenue Refunding Bonds Series 2016B, and $51.9 million in Transportation Revenue Refunding Bonds Series 2016C. Series 2016A and 2016C have an interest rate of 5.0 percent and 2016B has a varying interest rate of 2.0 to 5.0 percent. The bonds that were refunded include $11.3 million of Series 2006A, $16.3 million of Series 2006B, and $63.5 million of Series 2006C. The net proceeds from the sale of the Refunding Bonds of $93.6 million (after payment of underwriter’s fees and other issuance costs) were deposited into an irrevocable trust with an escrow agent to provide future debt service payments on the Refunded Bonds and to pay the costs related to issuance and refunding. As a result, the Refunded Bonds are considered to be defeased and the liability has been removed from the governmental activities column of the statement of net position. The reacquisition price exceeded the net carrying amount of the old debt by $2.2 million. This amount is being netted against the new debt and amortized over the remaining life of the refunded debt or the new debt, whichever is shorter. Total debt service payments will be reduced by $22.6 million resulting in an economic gain of $20.7 million.
Component Units
Higher education institutions (nonmajor) participate in the Virginia College Building Authority Pooled Bond Program. In December 2015, the Virginia College Building Authority (VCBA) (major) issued $153.9 million of Series 2015B Pooled Bond Program refunding bonds. The bonds were issued to refund $159.1 million
of its 2009A bonds. The net proceeds from the sale of the refunding bonds of $177.2 million were deposited in an irrevocable trust with an escrow agent to provide for all future debt service on the defeased bonds. This defeasance resulted in an accounting loss of $13.0 million. Total debt service payments over the next 24years will be reduced by $20.7 million resulting in a present value savings of $15.8 million discounted at the rate of 2.7 percent.
In June 2016, VCBA issued $49.3 million of Series 2016B 21st Century Program refunding bonds. The bonds were issued to refund $7.1 million of its 2008A bonds and $43.7 million of its 2009A bonds. The net proceeds from the sale of the refunding bonds of $56.7 million were deposited in an irrevocable trust with an escrow agent to provide for all future debt service on the defeased bonds. This defeasance resulted in an accounting loss of $3.9 million. Total debt service payments over the next 13 years will be reduced by $8.4 million resulting in a present value savings of $7.3 million discounted at the rate of 2.2 percent.
The Virginia Polytechnic Institute and State University (nonmajor) issued $2.6 million of Series 2015E bonds to refund $2.7 million of Series 2004A bonds. For additional information regarding this refunding, see the institution’s individually published financial statements.
GASB Statement No. 7, Advance Refundings Resulting in Defeasance of Debt, provides that refunded debt and assets placed in escrow for the payment of related debt service be excluded from the financial statements. As of June 30, 2016, there were $564.9 million in bonds from the primary government that have been refunded and defeased in-substance from the governmental activities column by placing existing assets and the proceeds of new bonds in irrevocable trusts to provide for all future debt service payments. In addition, there were $2.2 billion in bonds and notes outstanding considered defeased from the component units.
Arbitrage Rebate
The Tax Reform Act of 1986 requires that governmental entities issuing tax-exempt debt calculate and rebate arbitrage earnings to the federal government. The U.S. Treasury has issued regulations on calculating the rebate amount and complying with the provisions of the Tax Reform Act of 1986. Governmental issuers must comply with the rebate regulations in order for their bonds to maintain tax-exempt status. The regulations require the excess of the aggregate amount earned on investments purchased with bond proceeds over the amount that would have been earned if the proceeds were invested at a rate equal to the bond yield, to be rebated to the federal government. Income earned on excess earnings is also subject to rebate. Rebate liability, if any, must be paid every five years over the life of the bonds. Governmental issuers may elect to pay a penalty in lieu of rebate. Some bonds may be exempt from the rebate requirements if they qualify for certain regulatory exceptions. If the issuer meets one of the exceptions, the issuer retains any arbitrage earnings. Rebate and penalty payments are calculated and paid

162 Commonwealth of Virginia
as required by law on bond issues that do not qualify for an exception.
Rebate liability on bonds of the VPSA (major component unit) is payable from earnings on related bond funds and from local issuers whose local school bonds were purchased by the VPSA. During fiscal year 2016, an arbitrage rebate calculation for VPSA’s School Financing Bonds (1997 Resolution), Series 2006A identified a rebate liability of $18,985 due to the Federal government in fiscal year 2017. The liability was paid in July 2016 and a subsequent rebate report, following final redemption of the Series 2006A bonds, identified that no additional rebate payments were due.
Although rebatable arbitrage need only be calculated for tax purposes every fifth year that debt is outstanding, and consistent with modified accrual basis of accounting, is not recognized as a liability in governmental funds until amounts actually become due and payable, a liability is recognized in accrual basis government-wide statements as soon as the underlying event has occurred. Accordingly, as of June 30, 2016, the Virginia Resources Authority (major component unit) has recognized a liability of $391,873.
Amounts remitted to the federal government for rebate liability are generally paid from earnings derived from the issue. However, if all proceeds (including earnings) have been expended and depending on the type of issue, it may be necessary to use project revenues or general or nongeneral fund appropriations to satisfy any rebate liability. During fiscal year 2016, no rebate payments were owed on the Commonwealth’s General Obligation Bonds, Virginia Public Building Authority, Commonwealth Transportation Board, the Virginia College Building Authority 21st Century or Pooled Bond Programs, or the Virginia Port Authority.
Capital Leases
The Commonwealth leases buildings and equipment under various agreements that are accounted for as capital leases. The lease agreements are for various terms and all leases contain nonappropriation clauses indicating that continuation of the lease is subject to funding by the General Assembly.
Gross minimum lease payments, together with the present value of the net minimum lease payments as of June 30, 2016, are shown in the following table (dollars in thousands).
Governmental Business-Type ComponentActivities Activities Units (1)
2017 $ 10,779 $ 574 $ 6,7902018 9,570 589 6,9032019 7,363 603 6,3772020 6,758 619 6,3612021 6,669 634 5,573
2022-2026 13,402 3,417 26,1442027-2031 5,600 3,866 25,8672032-2036 2,180 4,374 8,6132037-2041 2,305 4,948 7082042-2046 464 1,075 6502047-2051 - - 1,176
Total Gross Minimum Lease Payments 65,090 20,699 95,162
Less: Amount Representing Executory Costs (6,353) - -
Net Minimum Lease Payments 58,737 20,699 95,162
Less: Amount Representing Interest (12,213) (15,340) (23,759)
Present Value of Net Minimum Lease Payments $ 46,524 $ 5,359 $ 71,403
Note (1): The above amounts exclude capital lease obligations of foundations.
Foundations (2)
2017 $ 672018 252019 7
Net Minimum Lease Payments 99
Less: Amount Representing Interest (4)
Present Value of Net Minimum Lease Payments $ 95
Note (2): Foundations represent FASB reporting entities defined in Note 1.B.
At June 30, 2016, assets purchased under capital leases were included in depreciable capital assets as follows (dollars in thousands). The amounts are net of accumulated depreciation where applicable. For a portion of these assets, ownership will pass to the Commonwealth at the end of the lease term.

Commonwealth of Virginia 163
Buildings Equipment Total
Governmental Activities: Gross Capital Assets $ 176,141 $ 4,309 $ 180,450 Less: Accumulated Depreciation (77,802) (2,968) (80,770)Total Governmental
Activities $ 98,339 $ 1,341 $ 99,680
Business-Type Activities: Gross Capital Assets $ 8,800 $ - $ 8,800 Less: Accumulated Depreciation (1,178) - (1,178)Total Business-Type
Activities $ 7,622 $ - $ 7,622
Component Units: Gross Capital Assets $ 131,592 $ 3,757 $ 135,349 Less: Accumulated Depreciation (48,026) (2,283) (50,309)
Subtotal (excluding Foundations) 83,566 1,474 85,040
Foundations: Gross Capital Assets - 733 733 Less: Accumulated Depreciation - (551) (551)
Subtotal Foundations - 182 182
Total Component Units (3) $ 83,566 $ 1,656 $ 85,222
Note (3): In addition to the above, land purchased under capital leases by the University of Virginia (nonmajor) is $8,095 (dollars in thousands).
Notes Payable
Notes Payable consist of several items as shown in the following schedule (dollars in thousands):
Primary Government Aviation Note $ 114 Installment Notes 108,877Total Primary Government 108,991Component Units Virginia Public School Authority 193,865 Virginia Resources Authority 105 Nonmajor Component Units 1,847,756 Installment Notes 50,825 Subtotal (excluding Foundations) 2,092,551 Foundations: Notes Payable 304,389 Subtotal - Foundations 304,389Total Component Units 2,396,940
Total Notes Payable $ 2,505,931
The Department of Aviation (primary government) Note represents a loan agreement with the Virginia Resources Authority (major component unit) with an outstanding balance of $114,381. The purpose of the loan was to finance and refinance grants-in-aid made to the Peninsula Airport Commission to provide funding for capital improvements at the Newport News/Williamsburg International Airport. The principal amount shall be paid semi-annually with the final payment due in 2017.
The Virginia Public School Authority (major component unit) notes of $193.9 million are for the School Equipment Financing Notes Educational Technology program. The note proceeds were used to make grants to school divisions for the purchase of educational technology equipment. The notes will be repaid from appropriations to be made by the Virginia GeneralAssembly from the Literary Fund (major special revenue).
The Virginia Resources Authority (major component unit) notes of $104,562 are Equipment and Term Financing loans.
An additional amount of $1.8 billion is comprised primarily of higher education institutions’ (nonmajor component units) promissory notes with the Virginia College Building Authority (VCBA) (major component unit) to finance the construction of various higher education facilities pursuant to the Pooled Bond Program. Interest rates range from 2.0 percent to 5.6 percent and shall be paid semi-annually and the planned interest payments total $611.3 million.Additionally, in accordance with the American Recovery and Reinvestment Act, the Commonwealth expects to receive a Build America Bonds (BABs) interest subsidy to reimburse interest payments of $31.8 million. The final principal payment is due in 2045.
The following higher education institutions (nonmajor component units) reported notes payables primarily for construction: Virginia Commonwealth University Health System Authority (Authority) (a blended component unit of the Virginia Commonwealth University – nonmajor component unit) $23.7 million, which includes $11.7 million reported by the University Health Services (a component unit of the Authority); Virginia State University $940,068; and Norfolk State University $15,824.
Various foundations (component units) have notes outstanding as of year-end. The purpose of a majority of these notes is for property acquisition, workingcapital, and construction. Future principal payments as of June 30, 2016, are shown in the following table (dollars in thousands).
Maturity Principal
2017 $ 10,3122018 90,7352019 48,3792020 31,4492021 7,021
Thereafter 116,493
Total $ 304,389
Foundations' Notes Payable (Component Units) (1)
Note (1): Foundations represent FASB reporting entities defined in Note 1.B.
164 Commonwealth of Virginia
Installment purchase obligations have been entered into by agencies and institutions of the Commonwealth. These agreements, other than those in the component units and certain institutions of higher education, contain nonappropriation clauses indicating that continuation of the installment purchase obligations is subject to funding by the General Assembly. Installment purchase obligations represent $159.7 million of the total outstanding debt of the Commonwealth. Presented inthe following tables are repayment schedules for installment purchase obligations as of June 30, 2016.
Maturity Principal Interest Total
2017 $ 12,096,135 $ 2,992,190 $ 15,088,3252018 12,272,971 2,683,832 14,956,8032019 12,577,813 2,354,239 14,932,0522020 12,878,233 2,014,707 14,892,9402021 11,444,501 1,668,893 13,113,394
2022-2026 37,468,275 4,356,401 41,824,6762027-2031 10,128,547 554,455 10,683,0022032-2036 10,952 19 10,971
Total $ 108,877,427 $ 16,624,736 $ 125,502,163
June 30, 2016Installment Purchase Obligations - Governmental Funds
Maturity Principal Interest Total
2017 $ 11,825,349 $ 1,001,737 $ 12,827,0862018 11,839,003 827,682 12,666,6852019 9,466,948 575,791 10,042,7392020 5,046,240 389,662 5,435,9022021 4,257,202 286,999 4,544,201
2022-2026 7,778,877 569,689 8,348,5662027-2031 611,672 26,710 638,382
Total $ 50,825,291 $ 3,678,270 $ 54,503,561
Installment Purchase Obligations - Component UnitsJune 30, 2016
The foundations (component units) had no installment purchase obligations as of June 30, 2016.
On May 23, 2016, the Virginia Department of Transportation (VDOT) (primary government) and Chesterfield County (County) signed a memorandum of understanding concerning payment of interest relating to the County’s contribution to VDOT for the construction of the Powhite Parkway Extension Project. The parties agreed that the interest to be paid by VDOT on the County’s contribution to the construction of the Powhite Parkway Extension is $18.5 million. The interest requirement paid during fiscal year 2016 totaled $10.3 million. The outstanding interest amount of $8.2 million is payable in annual installments on September 1 in the years 2016 to 2022. This interest is applicable to a note payable that VDOT repaid to the County in fiscal year 2014.
Lottery Prizes Payable
Lottery prizes are paid in 20, 25, 26, or 30 installments. The first installment is paid on the day the prize is claimed. The subsequent annual payments are funded with U.S. Treasury STRIPS purchased by the Virginia Lottery. For Life prizes payable represent estimated prizes payable monthly, quarterly or annually for the life of the winner based on life expectancy tables from the Virginia Bureau of Insurance, and funded with a pool of U.S. Treasury STRIPS.
Lottery prizes payable represent the future annual prize payments valued at cost plus accrued interest (present value of securities held to maturity) of the investment securities funding the payments.
Lottery prizes payable for the fiscal year ended June 30, 2016, are shown in the following table:
Due w ithin one year $ 8,339,546 $ 5,082,776 $ 13,422,322Due in subsequent years 51,599,365 64,873,461 116,472,826Total (present value) 59,938,911 69,956,237 129,895,148Add: Interest to Maturity 23,199,089 35,263,763 58,462,852Lottery Prizes Payable at Maturity $ 83,138,000 $ 105,220,000 $ 188,358,000
Jackpot Win For Life Total
Tuition Benefits Payable
The Virginia College Savings Plan administers the Virginia529 prePAID program. Virginia529 prePAID offers contracts at actuarially determined amounts that provide for future tuition and mandatory fee payments at state higher education institutions. The contract provisions also allow the benefits to be used for private or out-of-state institutions at differing amounts.
At June 30, 2016, tuition benefits payable of $2.0 billion have been recorded for the Virginia529 prePAID program on the statement of net position for the actuarially determined present value of future obligations anticipated for payment of benefits and administrative expenses for the Virginia529 prePAID program. In addition, a receivable in the amount of $198.8 million has been recorded to reflect the actuarially determined present value of future payments anticipated from contract holders.
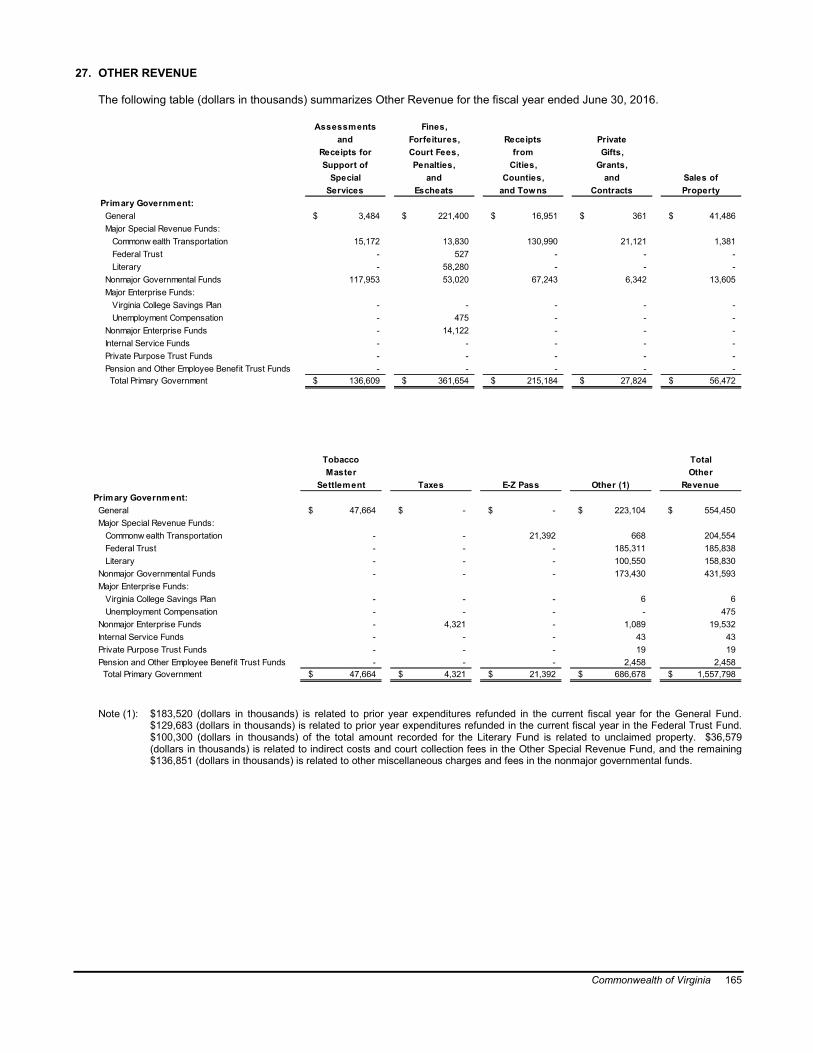
Commonwealth of Virginia 165
27. OTHER REVENUE
The following table (dollars in thousands) summarizes Other Revenue for the fiscal year ended June 30, 2016.
Support of Penalties,Special and Counties,
Services Escheats and TownsPrimary Government: General $ 3,484 $ 221,400 $ 16,951 $ 361 $ 41,486 Major Special Revenue Funds: Commonw ealth Transportation 15,172 13,830 130,990 21,121 1,381 Federal Trust - 527 - - - Literary - 58,280 - - - Nonmajor Governmental Funds 117,953 53,020 67,243 6,342 13,605 Major Enterprise Funds: Virginia College Savings Plan - - - - - Unemployment Compensation - 475 - - - Nonmajor Enterprise Funds - 14,122 - - - Internal Service Funds - - - - - Private Purpose Trust Funds - - - - - Pension and Other Employee Benefit Trust Funds - - - - - Total Primary Government $ 136,609 $ 361,654 $ 215,184 $ 27,824 $ 56,472
ReceiptsAssessments Fines,
and Forfeitures, PrivateReceipts for Court Fees,
and
fromCities,
Contracts
Gifts,Grants,
Sales ofProperty
Primary Government: General $ 47,664 $ - $ - $ 223,104 $ 554,450 Major Special Revenue Funds: Commonw ealth Transportation - - 21,392 668 204,554 Federal Trust - - - 185,311 185,838 Literary - - - 100,550 158,830 Nonmajor Governmental Funds - - - 173,430 431,593 Major Enterprise Funds: Virginia College Savings Plan - - - 6 6 Unemployment Compensation - - - - 475 Nonmajor Enterprise Funds - 4,321 - 1,089 19,532 Internal Service Funds - - - 43 43 Private Purpose Trust Funds - - - 19 19 Pension and Other Employee Benefit Trust Funds - - - 2,458 2,458 Total Primary Government $ 47,664 $ 4,321 $ 21,392 $ 686,678 $ 1,557,798
MasterSettlement
Tobacco
Taxes Other (1)
TotalOther
RevenueE-Z Pass
Note (1): $183,520 (dollars in thousands) is related to prior year expenditures refunded in the current fiscal year for the General Fund. $129,683 (dollars in thousands) is related to prior year expenditures refunded in the current fiscal year in the Federal Trust Fund. $100,300 (dollars in thousands) of the total amount recorded for the Literary Fund is related to unclaimed property. $36,579(dollars in thousands) is related to indirect costs and court collection fees in the Other Special Revenue Fund, and the remaining $136,851 (dollars in thousands) is related to other miscellaneous charges and fees in the nonmajor governmental funds.

166 Commonwealth of Virginia
28. PRIZES AND CLAIMS
The following table summarizes Prizes and Claims Expense for the fiscal year ended June 30, 2016.
(Dollars in Thousands)
Lottery PrizesInsurance Prize and
Claims Expense ClaimsProprietary Funds: Major Enterprise Funds: Virginia Lottery $ - $ 1,202,455 $ 1,202,455 Unemployment Compensation 390,441 - 390,441 Nonmajor Enterprise Funds 399,236 - 399,236 Total Enterprise Funds $ 789,677 $ 1,202,455 $ 1,992,132
Internal Service Funds $ 1,581,252 $ - $ 1,581,252
Total
29. OTHER EXPENSES
The following table summarizes Other Expenses for the fiscal year ended June 30, 2016.
(Dollars in Thousands)
Proprietary Funds: Major Enterprise Funds: Virginia College Savings Plan $ - $ 266 $ 61 $ 327 Nonmajor Enterprise Funds 91 3,190 3,423 6,704 Total Enterprise Funds $ 91 $ 3,456 $ 3,484 $ 7,031
Internal Service Funds $ 1,781 $ 952 $ 15,293 $ 18,026
Pension and Other Employee Benefit Trust Funds (2) $ - $ - $ 4,031 $ 4,031
DistributionsGrants and
ImprovementsTo LocalitiesEquipment/
ExpensesOtherTotal
Other (1)
Expendable
Note (1): $7,827 (dollars in thousands) can be attributed to expenses related to cyber insurance in the Risk Management internal service fund and $7,315 (dollars in thousands) can be attributed to Affordable Care Act related fees in the Health Care Fund internal service fund. $61 (dollars in thousands) can be attributed to the Virginia529 prePAID Program for promotional scholarships.
Note (2): Fiduciary expenses of $4,031 (dollars in thousands) are not included in the Government-wide Statement of Activities.

Commonwealth of Virginia 167
30. OTHER NON-OPERATING REVENUE/EXPENSES
The following table summarizes Other Non-Operating Revenue/Expenses for the fiscal year ended June 30, 2016.
(Dollars in Thousands)
on Sale ofInterest
Assets Expense Other (1)Proprietary Funds: Major Enterprise Funds: Virginia Lottery $ - $ (36) $ - $ - $ 287 $ 251 Virginia College Savings Plan - - (212) - - (212) Unemployment Compensation - - - (16) - (16) Nonmajor Enterprise Funds (129) (11) (621) - 8,774 8,013 Total Enterprise Funds $ (129) $ (47) $ (833) $ (16) $ 9,061 $ 8,036
Internal Service Funds $ 800 $ (23) $ (2,830) $ - $ 726 $ (1,327)
Expenses
Capital
(Loss)Gain/
(Expenses)
OperatingRevenue/Lending
Transactions Tax ActUnemployment
Federal
Total
for Non-Securities
Other
Note (1): Other Non-Operating Revenue/Expenses of the nonmajor enterprise funds are primarily comprised of $9,165 (dollars in thousands) reported by the Department of Alcoholic Beverage Control offset by $407 (dollars in thousands) of expenses reported by the Route 460 Funding Corporation of Virginia.
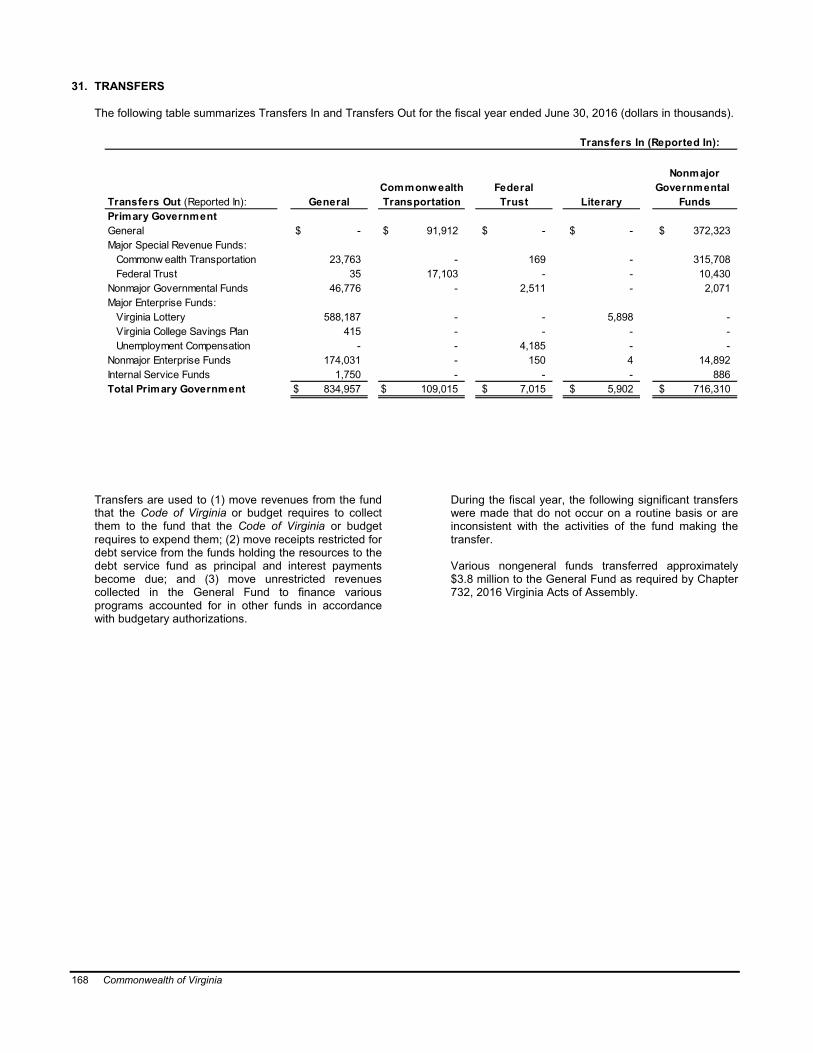
168 Commonwealth of Virginia
31. TRANSFERS
The following table summarizes Transfers In and Transfers Out for the fiscal year ended June 30, 2016 (dollars in thousands).
Transfers In (Reported In):
Transfers Out (Reported In): TransportationPrimary GovernmentGeneral $ - $ 91,912 $ - $ - $ 372,323Major Special Revenue Funds:
Commonw ealth Transportation 23,763 - 169 - 315,708Federal Trust 35 17,103 - - 10,430
Nonmajor Governmental Funds 46,776 - 2,511 - 2,071Major Enterprise Funds:
Virginia Lottery 588,187 - - 5,898 -Virginia College Savings Plan 415 - - - -Unemployment Compensation - - 4,185 - -
Nonmajor Enterprise Funds 174,031 - 150 4 14,892Internal Service Funds 1,750 - - - 886Total Primary Government $ 834,957 $ 109,015 $ 7,015 $ 5,902 $ 716,310
FundsCommonwealth
LiteraryTrustFederal
NonmajorGovernmental
General
Transfers are used to (1) move revenues from the fund that the Code of Virginia or budget requires to collect them to the fund that the Code of Virginia or budget requires to expend them; (2) move receipts restricted for debt service from the funds holding the resources to the debt service fund as principal and interest payments become due; and (3) move unrestricted revenues collected in the General Fund to finance various programs accounted for in other funds in accordance with budgetary authorizations.
During the fiscal year, the following significant transfers were made that do not occur on a routine basis or are inconsistent with the activities of the fund making the transfer.
Various nongeneral funds transferred approximately $3.8 million to the General Fund as required by Chapter 732, 2016 Virginia Acts of Assembly.

Commonwealth of Virginia 169
$ 250 $ 74 $ 464,559
- 388 340,02898 - 27,666
- 162 51,520
- - 594,085- - 415- - 4,185- - 189,077- - 2,636
$ 348 $ 624 $ 1,674,171
NonmajorEnterprise
Funds Government
TotalPrimary
Funds
InternalService
32. ON-BEHALF PAYMENTS
Higher education institutions (nonmajor component units) received various on-behalf payments from foundations primarily for salary supplements and stipends during fiscal year 2016. Since the foundations are included as part of the higher education entity, most on-behalf payments were considered intrafund and were eliminated from the financial statements. On-behalf payments not eliminated for fiscal year 2016 totaled $75,844 and were recorded as program revenue –charges for services with corresponding expenses.
33. ENDOWMENTS
Donor restricted endowments reside primarily within the higher education institutions. The net appreciation available for expenditure is $1.3 billion as of June 30, 2016. Of this amount, $1.0 million is reported as unrestricted net position and the remainder is reported as restricted net position. The Code of Virginia authorizes acceptance of donations. The governing boards of these entities and the donor agreements determine whether net appreciation can be spent and the accepted spending rate. These policies are entity specific and vary with each institution.

170 Commonwealth of Virginia
34. CASH FLOWS – ADDITIONAL DETAILED INFORMATION
The following table (dollars in thousands) summarizes specific cash flows for the fiscal year ended June 30, 2016.
Cash Flow s Resulting from:
Payments for Prizes, Claims, and Loss Control:Lottery Prizes $ (1,209,781) $ - $ -Claims and Loss Control - - (407,866)
Total $ (1,209,781) $ - $ (407,866)
Other Operating Revenue:Receipts from Interest, Dividends, and Rents $ - $ - $ -Other Operating Revenue - - 92
Total $ - $ - $ 92
Other Operating Expense:Other Operating Expenses (1) $ - $ (55) $ -
Total $ - $ (55) $ -
Other Noncapital Financing Receipt Activities:Advances/Contributions from the Commonw ealth $ - $ - $ -Receipts from Taxes - - -Other Noncapital Financing Receipt Activities 310 - 40
Total $ 310 $ - $ 40
Other Noncapital Financing Disbursement Activities:Repayments of Advances/Contributions from the Commonw ealth $ - $ - $ -Other Noncapital Financing Disbursement Activities - - -
Total $ - $ - $ -
Other Capital and Related Financing Receipt Activities:Receipts from Contract Termination $ - $ - $ -Other Capital and Related Financing Receipt Activities - - -
Total $ - $ - $ -
Other Capital and Related Financing Disbursement Activities:Disbursement of Residual Cash Balances $ - $ - $ -Other Capital and Related Financing Disbursement Activities - - -
Total $ - $ - $ -
CollegeVirginia
LotteryVirginia
CompensationUnemployment
PlanSavings
Note (1): $55,373 can be attributed to disbursements related to the Virginia529 prePAID Program for promotional scholarships. Also, $7,827 (dollars in thousands) can be attributed to expenses related to cyber insurance in the Risk Management internal service fund and $7,315 (dollars in thousands) can be attributed to Affordable Care Act related fees in the Health Care Fund internal service fund.

Commonwealth of Virginia 171
$ - $ (1,209,781) $ -(385,364) (793,230) (1,384,904)
$ (385,364) $ (2,003,011) $ (1,384,904)
$ - $ - $ -5,721 5,813 -
$ 5,721 $ 5,813 $ -
$ (4,510) $ (4,565) $ (17,383)$ (4,510) $ (4,565) $ (17,383)
$ 23,749 $ 23,749 $ 10,000225,364 225,364 -
32 382 3,405$ 249,145 $ 249,495 $ 13,405
$ (31,065) $ (31,065) $ (1,901)(224) (224) -
$ (31,289) $ (31,289) $ (1,901)
$ 165,794 $ 165,794 $ -68 68 -
$ 165,862 $ 165,862 $ -
$ (727) $ (727) $ -(3) (3) (633)
$ (730) $ (730) $ (633)
FundsFunds
InternalService
Nonmajor TotalEnterprise Enterprise
Funds
35. TOBACCO SETTLEMENT AND SECURITIZATION
On November 23, 1998, 46 states’ Attorneys General and the major tobacco companies signed a proposed settlement that reimburses states for smoking-related medical expenses paid through Medicaid and other health care programs. At the time of the settlement, it was estimated that the Commonwealth could receive approximately $4.1 billion over the duration of the settlement. The settlement was approved in a Consent Decree in December 1998. On March 29, 1999, the General Assembly enacted a law approving the establishment of the Tobacco Region Revitalization Commission (formerly the Tobacco Indemnification and Community Revitalization Commission) (Commission) (nonmajor component unit), in compliance with the Consent Decree, to help communities in Virginia hurt by the decline of tobacco.
The Commission was established for the purposes of determining the appropriate recipients of monies in the Tobacco Indemnification and Community Revitalization Fund. The monies are to be used to provide payments to tobacco farmers as compensation for the tobacco equipment and barns and lost tobacco production opportunities associated with a decline in quota. The monies are also to be used to revitalize tobacco dependent communities.
The General Assembly also created the Virginia Foundation for Healthy Youth (Foundation) (nonmajor component unit). The purpose of the Foundation is to determine the appropriate recipients of monies in the Virginia Tobacco Settlement Fund. The Foundation will also be responsible for distributing monies for the purposes provided in the legislation. Disbursements can be made to assist in financing efforts to restrict the use of tobacco products by minors, through educational and awareness programs describing the health effects of tobacco use on minors, and laws restricting the distribution of tobacco products to minors.
Additionally, the General Assembly created two special non-reverting funds. The Tobacco Settlement monies were accounted for in these funds and in the General Fund. Of the Settlement monies, 50.0 percent was deposited into the Tobacco Indemnification and Community Revitalization Fund at the Commission and 10.0 percent continues to be deposited into the Virginia Tobacco Settlement Fund at the Foundation. The remaining 40.0 percent continues to be reported in the General Fund.
Pursuant to Purchase and Sale Agreements executed in 2005 and 2007, the Commonwealth, acting as an agent on behalf of the Commission, sold the Commission’s future right, title and interest in the Tobacco Settlement Revenues (TSRs) to the Tobacco Settlement Financing Corporation (Corporation) (related organization).

172 Commonwealth of Virginia
Consideration paid by the Corporation to the Commission for TSRs consisted of a cash amount deposited into an endowment to fund the long-term spending plan approved by the Commission. Bonds issued by the Corporation to finance the purchase price are asset-backed instruments secured solely by the Corporation’s right to receive TSRs. At the time of issuance these revenues were expected to produce sufficient funds to repay the bond obligations issued by the Corporation.
The Commission is a nonmajor component unit of the Commonwealth, and the Corporation is disclosed as a related organization.
36. SERVICE CONCESSION ARRANGEMENTS
GASB Statement No. 60, Accounting and Financial Reporting for Service Concession Arrangements,describes the criteria for when an arrangement is classified as a Service Concession Arrangement (SCA). The basic criteria are: the operator of the capital asset owned by the transferor has the right to provide services in exchange for significant consideration; the operator’s revenue must come from a third party; the transferor must retain some level of control over the asset; and the transferor must receive significant residual interest at the conclusion of the arrangement.
Primary Government
The Commonwealth of Virginia has four SCAs as of June 30, 2016: Pocahontas 895, the 495 Express Lanes, Elizabeth River – Midtown Tunnel, and the 95 Express Lanes. They are all related to highway construction and operation and were established per the Public-Private Transportation Act of 1995, as amended (PPTA). PPTA project goals are to provide highway projects to the public in a timely and cost effective manner with private funding and support.
Pocahontas 895
On June 21, 2006, the Pocahontas Parkway Association (Association – previously reported as a blended component unit of the Virginia Department of Transportation (VDOT), part of primary government) signed an agreement with Transurban (895) LLC (Transurban). Under the terms of the agreement, all assets and rights of the Association under the Comprehensive Agreement with VDOT were transferred to Transurban. In exchange for the existing toll road and other assets, Transurban transferred sufficient funds and securities to pay or defease all outstanding bonds of the Association and pay all other outstanding obligations owed to VDOT. Additionally, Transurban agreed to construct an enhancement to the original toll road, and this enhancement was completed and placed in service in 2011.
During the 99-year agreement term, VDOT will have fee title or good and valid interest in the asset. VDOT retains the right of inspection of the asset and has outlined maximum toll charges and increases in the terms of the agreement. Capital assets of $337.2 million and deferred inflow balances of $512.2 million are included in the government-wide financial statements. No contractual liabilities exist for thisarrangement as of June 30.
During fiscal year 2014, the Transurban Board approved the transfer of Pocahontas 895 to the lenders of the asset due to lower revenues than anticipated. On May 15, 2014, DBi Services assumed control of Pocahontas 895.
495 Express Lanes
On December 19, 2007, VDOT signed an 80-year public-private partnership agreement with Capital Beltway Express, LLC. The purpose of this agreement is to build new express lanes to provide users with a faster and more reliable travel option. The construction of the express lanes was completed in November 2012.
During the 80-year agreement, VDOT maintains regulatory control and jurisdiction of the express lanes. VDOT will have fee title or good and valid interest in the express lanes. The lanes will remain open for the public as long as the applicable tolls are paid. Capital assets of $924.1 million and deferred inflows of $1.0 billion are included in the government-wide financial statements. Liabilities are contingent on specific events occurring pursuant to the agreement.
Elizabeth River – Midtown Tunnel
On December 5, 2011, VDOT signed a 58-year public private partnership agreement with Elizabeth River Crossings OPCO, LLC. The purposes of this agreement are to build and operate a new tunnel that will be adjacent to the existing Midtown Tunnel for crossing the Elizabeth River, provide improvements to the existing Midtown Tunnel and the Downtown Tunnel, and to provide various extensions and improvements of the MLK Freeway and I-264.
During the agreement, Elizabeth River Crossings OPCO, LLC will operate and maintain the road. The revenue source for the concessionaire will be toll collections, excluding the MLK Freeway, which will be used for maintenance, operating and return on investment for constructing the project. At the end of the 58-year term, control of and the rights to operate the facilities will revert back to VDOT. Since assets related to this project will not be operational until fiscal year 2017, no capital assets, liabilities, or deferred inflows of resources have been included in the financial statements.

Commonwealth of Virginia 173
95 Express Lanes
On July 31, 2012, VDOT signed a 73-year public private partnership agreement with 95 Express Lanes, LLC. This project will create approximately 29 miles of Express Lanes on I-95 in Northern Virginia. The project will also add capacity to the existing HOV Lanes. The construction of the express lanes was completed in December 2014.
During the agreement, 95 Express Lanes LLC will operate and maintain the road. The revenue source for the concessionaire will be toll collections which will be used for maintenance, operating and return on investment for constructing the project. At the end of the 73-year term, control of and the rights to operate the facilities will revert back to VDOT. The lanes will remain open for the public as long as the applicable tolls are paid. Capital assets of $599.9 million and deferred inflows of $619.5 million are included in the government-wide financial statements. Liabilities are contingent on specific events occurring pursuant to the agreement.
During fiscal year 2016, the Commonwealth Transportation Board awarded a contract to design and construct a reversible extension of the 95 Express Lanes at the southern terminus in Stafford County. The approximately 2.5 mile extension will carry traffic beyond the location where the 95 Express Lanes currently end. The construction will begin in fiscal year 2017 with final completion scheduled for summer 2018.
In addition, plans were announced by VDOT during fiscal year 2016, to extend the 95 Express Lanes north to I-395. This involves expanding and converting two high occupancy vehicle (HOV) lanes to three express lanes near the Pentagon. Construction on this eight-mile extension is expected to begin in spring 2017 with completion scheduled for Summer 2019.
Component Units
Aramark – Dining Services
During the year ended June 30, 2015, the University of Virginia (nonmajor) entered into an agreement with Aramark Educational Services, LLC (Aramark) for Aramark to provide dining services to the University. In return for use of University facilities, Aramark is required to make certain payments to the University and the University is required to provide certain repair and maintenance services related to the facilities during the term of the agreement. As of June 30, 2016, the University has accrued a $18.5 million receivable, a $13.7 million liability and a $70.2 million deferred inflow of resources related to the service concession arrangement.
37. INFORMATION TECHNOLOGY INFRASTRUCTURE PARTNERSHIP – NORTHROP GRUMMAN
The Comprehensive Infrastructure Agreement (CIA) is a contract, executed on November 13, 2005, between the Commonwealth of Virginia (Commonwealth) acting through the Virginia Information Technologies Agency (VITA) and Northrop Grumman Systems Corporation (NG). The Commonwealth’s primary goal was to significantly improve the Commonwealth’s IT infrastructure and the manner in which such infrastructure was operated, supported, and maintained for the following service towers: Cross-Functional Services, Desktop Computing Services, Data Network Services, Voice and Video Telecom Services, Mainframe and Server Services, Help Desk Services, Messaging Services, Security Services, Internal Application Services, and Data Center facilities.
On March 31, 2010, contract revisions to the CIA were completed between the Commonwealth and Northrop Grumman. As a result of the contract changes, the Commonwealth renewed the contract for an additional three years, the parties established the products and services covered in the contractual cap including the baseline quantities to be billed and the prices at which those quantities will be billed, a shortened formula for contract year ten cost of living adjustment, and increased resolution and disentanglement fees. These contract changes were intended to provide improved performance to the VITA customer agencies, provide greater accountability and operational efficiencies for the services provided, and resolve outstanding financial issues. Additional contract revisions to the CIA have been completed between the Commonwealth and Northrop Grumman in the years since 2010. The contract term expires June 30, 2019.
The CIA provides various termination scenarios. The Commonwealth can terminate the CIA due to a variety of reasons including the Commonwealth’s convenience; a significant change of control in the equity interests in NG; NG’s failure to implement satisfactory improvements; or, NG’s failure to prevent service interruption of 15 days or more. In these instances, the Commonwealth would be required to pay exit and resolution fees as outlined in the CIA. Additional causes for termination that do not require the payment of exit or resolution fees include NG’s default on the CIA terms, the Commonwealth’s lack of funds, or NG’s incurrence of liabilities equal to or more than 75.0 percent of the direct damages cap. On the other hand, NG can terminate the CIA only if the Commonwealth owes an aggregate amount in excess of $100.0 million that is more than 30 days past due and not being disputed in good faith. The Commonwealth might be required to pay exit and resolution fees, as outlined in the CIA. Fees resulting from the termination of the agreement are expected to be significant to the Commonwealth; however, exit fees are subject to the appropriation, allocation and availability of Commonwealth funds. Further, if the Commonwealth and NG terminate all or a portion of the business relationship on or before the conclusion of the CIA term, the Commonwealth will incur significant costs to obtain and transition the IT

174 Commonwealth of Virginia
infrastructure necessary to continue the Commonwealth’s operations.
In 2015, in anticipation of contract expiration in 2019, and with recognition of the complexity of the change in such a large shared services environment, VITA engaged a consulting firm to help develop sourcing strategies to better align with current best practices and future customer requirements. After evaluating options and engaging numerous Commonwealth stakeholders, VITA determined that it should start disentangling services from the CIA and transition services in waves to a new, multi-supplier model. The transition has begun with the messaging tower and a contract signed with Tempus Nova, along with an accompanying termination of messaging services from NG. Other transitions and accompanying terminations of services, on a tower-by-tower basis, are in progress or are planned, all with a goal of complete disentanglement from the CIA by June 30, 2019. These terminations may result in payment of exit and resolution fees, the amount of which is being determined as part of a negotiated disentanglement process.
Expenses associated with the CIA in fiscal year 2016 are $307.4 million, including payments to Northrop Grumman of $263.3 million. The Commonwealth expects to spend an additional $650.0 million over the next three fiscal years, either with NG or new providers.
38. CONTINGENCIES
A. Grants and Contracts
The Commonwealth has received federal grants for specific purposes that are subject to review and audit by the grantor agencies. Claims against these resources are generally conditional upon compliance with the terms and conditions of grant agreements and applicable federal regulations, including the expenditure of resources for allowable purposes. Any disallowance resulting from a federal audit may become a liability of the Commonwealth.
Institutions of higher education (component units) and other state agencies are required to comply with various federal regulations issued by the Office of Management and Budget, if such agencies are recipients of federal grants, contracts, or other sponsored agreements. Failure to comply with certain requirements of these regulations may result in questions concerning the allowability of related direct and indirect charges pursuant to such agreements. It is believed that the ultimate disallowance pertaining to these regulations, if any, will be immaterial to the overall financial condition of the Commonwealth.
The U.S. Department of Health and Human Services (DHHS) Office of the Inspector General conducted a review and indicated that the Commonwealth’s Statewide Indirect Cost Allocation Plan rates have allowed over-recoveries and transfers in the internal service funds and portions
of selected rebates. The Commonwealth has paid the amount it believes is owed for fiscal years 2009-2014, and is currently appealing a DHHS determination letter indicating that an additional amount may be owed for this time period.
Additionally, the DHHS has received the 2016 payback schedule which is based on fiscal year 2015 data. The Commonwealth has computed a liability of $4.7 million representing the amounts owed to the federal government for internal service fund over-recoveries and transfers, as well as the federal share of various rebates received. This amount has been reflected in the accompanying financial statements.
The SNAP error rate may have been inconsistently reported, and there is a reasonable possibility that the Commonwealth may owe an amount not expected to exceed $5.1 million.
The Virginia Tourism Authority (nonmajor component unit) had unclaimed awards totaling $1.8 million payable to awardees upon submission of proper claims for reimbursement for the Marketing Leverage Program. Additionally, the Authority had unclaimed awards totaling $50,201 payable to awardees upon submission of proper claims for reimbursement for the Sesquicentennial Marketing Program. In addition, the program has $46,358 in funding that had not been awarded to specific grantees.
B. Litigation
The Commonwealth is named as a party in legal proceedings and investigations that occur in the normal course of governmental operations, some involving substantial amounts. It is not possible at the present time to estimate the ultimate outcome or liability, if any, of the Commonwealth in respect to the various proceedings; however, it is believed that any ultimate liability resulting from these suits or investigations will not have a material, adverse effect on the financial condition of the Commonwealth.
C. Subject to Appropriation
Both the primary government and the discretely presented component units enter into agreements and issue debt secured solely by future appropriations from the General Fund of the Commonwealth. The primary government has leases and other agreements of such debt of $2.5 billion. The discretely presented component units have such debt of $4.1 billion.
D. Bailment Inventory
The Department of Alcoholic Beverage Control (ABC) houses and controls bailment inventory in the warehouse and is therefore responsible for the exercise of reasonable care to preserve the inventory until it is purchased by ABC or returned to

Commonwealth of Virginia 175
the supplier. ABC uses the bailment system for payment of merchandise for resale. ABC initiates payments to the vendors based on shipments from the ABC warehouse to the retail stores, rather than receipt of invoice from the vendor. At June 30, 2016, the bailment inventory was valued at $40.6 million.
E. Loan Guarantees
The Virginia Small Business Financing Authority (VSBFA) (nonmajor component unit) has a loan guaranty program which provides guarantees up tothe lesser of $500,000, or 75.0 percent, of a bank loan for lines of credit and short-term working capital loans for small businesses authorized by Section 2.2-2285 of the Code of Virginia. The relationship of the Commonwealth to the issuer or issuers of the obligations are private banks that contact VSBFA to obtain guarantees if they deem it necessary to approve the loan. The VSBFA staff underwrites the request for guarantees, and the Board of Directors makes the credit decision to approve or decline the loan. The Board has given VSBFA staff delegated authority to approve requests up to, and including, $500,000. The Board reviews all loan packages and ratifies all decisions. The length of time for the guarantees is up to five years for lines of credit and seven years for term loans. Upon a default or event of default under the loan documents and payment by VSBFA under the Guaranty Agreement, the borrower and the guarantor(s), jointly and severally, acknowledge and agree that VSBFA may set off, collect andretain any payments or monies due or owing the borrower or any guarantor from the Commonwealth of Virginia, and/or any governmental authority or agency of the Commonwealth. VSBFA submits collections to the Office of the Attorney General, Division of Debt Collection for legal action and collection of debt. As of June 30, 2016, the loan guaranty program has guarantees outstanding of $6.7 million and restricted assets pledged as collateral of $13.7 million.
GASB Statement No. 70, Accounting and Financial Reporting for Nonexchange Financial Guarantees,requires that certain information be disclosed regarding selected nonexchange financial guarantees. As of June 30, 2016, the VSBFA recognized a nonexchange financial guarantee liability of $135,527. This is a reduction of $12,365 from the beginning balance of $147,892. There were no required payments made during fiscal year 2016. Additionally, there have been no cumulative amounts paid on these outstanding loan guarantees nor are there any expected recoveries.
The Assistive Technology Loan Fund Authority (nonmajor component unit) has an alternative financing program which provides guarantees of loans made and serviced by its banking partner. As of June 30, 2016, there was approximately $46,346 of guaranteed loans held by the Authority’s banking partner.
F. Regional Wet Weather Management Plan
Hampton Roads Sanitation District (HRSD) (nonmajor component unit) is party to a federal consent decree with the federal and state governments (the Consent Decree), which requires the HRSD to evaluate the wet weather capacity of the regional sewer system, including collection systems owned by 13 of the localities which the HRSD serves in the Hampton Roads area. Based upon that evaluation, the HRSD, in consultation with the localities, is required to develop a regional wet weather management plan (RWWMP) for submittal to the federal and state environmental agencies for their approval.
The HRSD and the localities believe that addressing wet weather capacity issues from a regional perspective will result in the most affordable and cost-effective approach for rate payers throughout the region. Toward that end, the HRSD and the localities entered into a legally binding Memorandum of Agreement in March of 2014 (the MOA). The MOA commits HRSD to (1) develop the RWWMP in consultation with the localities, (2) fund the approved plan through a regional rate imposed on all regional ratepayers, (3) design and construct the necessary improvements, and (4) assume responsibility for wet weather capacity throughout the region in each area once the RWWMP is implemented. In exchange, the localities have agreed to (1) cooperate with the HRSD, (2) facilitate the construction of and accept ownership of any improvements which the HRSDmay need to construct in the localities’ systems, and (3) maintain the integrity of their systems to industry standards. The Consent Decree and MOA also contemplate that the localities’ obligation to maintain the integrity of their sewer systems to industry standards was embodied in a State administrative order. While the HRSD is preparing the RWWMP, the Consent Decree also requires the HRSD to implement approximately $200.0 million in priority capital system upgrade projects over a 9-year period, which is included in the capital improvement and expansion program. The HRSD is on schedule to complete these projects. The HRSD has a major capital improvement and expansion program funded through the issuance of debt and its own resources. As of June 30, 2016,the HRSD has outstanding commitments for contracts in progress of approximately $161.1 million.

176 Commonwealth of Virginia
39. PENDING GOVERNMENTAL ACCOUNTING STANDARDS BOARD STATEMENT
The GASB has issued Statement No. 74, Financial Reporting for Postemployment Benefit Plans Other Than Pension Plans, and Statement No. 75, Accounting and Financial Reporting for Postemployment Benefits Other Than Pensions. Both statements will significantly impact the Commonwealth’s reporting disclosures and accrued other postemployment benefit liability amounts. The Virginia Retirement System and the Department of Human Resource Management will implement GASB Statement No. 74 in fiscal year 2017. The Commonwealth will implement GASB Statement No. 75 in fiscal year 2018.
40. SUBSEQUENT EVENTS
Primary Government
Debt
On October 5, 2016, the Virginia Public Building Authority (VPBA) (nonmajor special revenue) issued $206.4 million of Public Facilities Revenue Bonds,Series 2016A; $179.0 million of Public Facilities Revenue Refunding Bonds, Series 2016B; $147.4 million of Public Facilities Revenue Bonds, Series 2016C (AMT) and $13.8 million of Public Facilities Revenue Bonds, Series 2016D (Taxable). The Bonds will provide funding for authorized VPBA projects, reimbursement of the Commonwealth’s share of regional and local jail costs and refund portions of VPBA’s Series 2009B and 2011A Bonds.
On November 9, 2016, the Commonwealth Transportation Board issued $316.9 million of Commonwealth of Virginia Federal TransportationGrant Anticipation Revenue Notes (GARVEEs) to fund the construction of several highway projects.
On November 10, 2016, the Commonwealth of Virginia issued $71.2 million of General Obligation Bonds,Series 2016A and $117.1 million of General Obligation Refunding Bonds, Series 2016B. The Bonds will provide funding for authorized 9(c) projects and refund certain maturities of prior General Obligation Bonds, Series 2006A, 2009A and 2009B.
Component Units
Debt
On July 12, 2016, the Virginia College Building Authority (VCBA) (major) issued $231.9 million of Educational Facilities Revenue Refunding Bonds (Public Higher Education Financing Program), Series 2016A. The VCBA used the proceeds to acquire Institutional Notes from participating public institutions of higher education. The Bonds refunded portions of VCBA’s 2006A, 2007A and 2009B Bonds.
On July 19, 2016, the Virginia Housing Development Authority (major) issued $5.0 million of Rental Housing Bonds.
On July 27, 2016, the Virginia Resources Authority (VRA) (major) issued bonds in the amount of $52.5 million. The interest rates range from 0.5 percent to 2.9 percent with a final maturity date of November 1, 2036.
On November 10, 2016, the Virginia Public School Authority (VPSA) (major) issued $64.6 million of Special Obligation School Refunding Bonds, Montgomery County Series 2016B to purchase certain general obligation local school bonds from Montgomery County to refund certain VPSA Bonds previously issued for Montgomery County.
On November 17, 2016, VPSA issued $90.1 million of School Financing and Refunding Bonds (1997 Resolution), Series 2016B to purchase certain general obligation local school bonds to finance capital projects for schools and to refund certain previously issued VPSA Bonds.
On November 30, 2016, VPSA issued $2.4 million of School Tax Credit Bonds (Qualified Zone Academy Bonds) Series 2016-1 to purchase certain general obligation local school bonds to finance capital projects for schools.
Other
The University of Virginia Medical Center (part of the University of Virginia – nonmajor component unit) entered into a real estate purchase agreement with the University of Virginia Physicians Group (component unit of the University) to purchase the Northridge Medical Office building. The purchase price is $18.4 million. The Medical Center made an earnest money deposit of $9.0 million on July 29, 2016. An estimated closing date of April 2017 is expected. The Medical Center purchased from Grove Street Properties, LLC seven parcels of land situated in the City of Charlottesville. The purchase price was $8.7 million and closed on August 26, 2016. The Medical Center entered into a membership interest purchase agreement with Mary Washington Hospital, Inc., where Mary Washington Hospital agreed to purchase the Medical Center’s 20 units of ownership for $268,254. The Medical Center received payment on August 11, 2016.
In September 2016, the University of Mary Washington (nonmajor) approved a 2.5 percent salary increase for all full-time teaching faculty, and a $1,000 recognition bonus for all A/P faculty and classified staff who attained a satisfactory performance evaluation in the most recent cycle. Wage employees who worked more than 100 hours total during fiscal year 2016 will receive a $500 bonus. Wage employees who worked less than 100 hours total during fiscal year 2016 will receive a $100 bonus.

Commonwealth of Virginia 177
On September 6, 2016, the U.S. Bankruptcy Court in Newark, New Jersey, granted Hanjin Shipping’s request to have its rehabilitation filed in Korean Bankruptcy Court recognized in the United States. Hanjin is, based on capacity, the seventh largest ship line in the world, and is a customer of Virginia International Terminals, LLC (VIT) (a blended component unit of the Virginia Port Authority (VPA) – nonmajor). VIT has taken measures to mitigate exposure to the bankruptcy including, but not limited to, requiring cash deposits and advance payments, affirming guarantees from third parties, and securing collateralized property on the terminal grounds. While the outcome of the proceedings and absolute effect on VIT is uncertain at this time, based on available information and management’s assessment of the matter, the bankruptcy is not expected to have a material adverse effect on VIT’s consolidated net position.
On September 21, 2016, VPA announced an agreementfor the extension and restatement of the lease with Virginia International Gateway, Inc., (VIG) from its current expiration date of July 1, 2030, to December 31, 2065. The restated lease will provide for, among other things, the development of 60 acres (designated as Phase II) of the terminal property, expansion of the existing wharf by 650 feet, provision of an additional 10,000 feet of on-dock rail, and the effective doubling of the capacity of the VIG terminal. Detailed information regarding the terms of the lease can be found in the Authority’s individually published financial statements.
On October 31, 2016, VPA’s contract with the current operator of Richmond Marine Terminal (RMT) expired.On November 1, 2016, VIT became the operator of RMT.

178 Commonwealth of Virginia

Commonwealth of Virginia 179
Required Supplementary Information

180 Commonwealth of Virginia
Schedule of Revenues, Expenditures, and Changes in Fund Balances – Budget and Actual –General and Major Special Revenue FundsFiscal Year Ended June 30, 2016(Dollars in Thousands)
Revenues:Taxes: Individual and Fiduciary Income $ 12,219,700 $ 12,823,000 $ 12,555,624 $ (267,376) Sales and Use 3,686,000 3,734,400 3,651,400 (83,000) Corporation Income 820,700 722,800 764,948 42,148 Motor Fuel - - - - Motor Vehicle Sales and Use - - - - Communications Sales and Use 425,000 419,000 406,707 (12,293) Deeds, Contracts, Wills, and Suits 328,300 389,506 377,699 (11,807) Premiums of Insurance Companies 326,800 322,700 339,081 16,381 Alcoholic Beverage Sales 207,900 207,900 217,594 9,694 Tobacco Products 177,032 181,100 178,741 (2,359) Estate - - 222 222 Public Service Corporations 96,800 98,900 92,586 (6,314) Other Taxes 25,512 29,972 32,107 2,135Rights and Privileges 87,967 85,179 84,628 (551)Sales of Property and Commodities 33,352 1,819 42,671 40,852Assessments and Receipts for Support of Special Services 900 2,450 3,539 1,089Institutional Revenue 42,409 46,422 36,819 (9,603)Interest, Dividends, and Rents 66,233 47,089 57,680 10,591Fines, Forfeitures, Court Fees, Penalties, and Escheats 203,624 221,405 222,039 634Federal Grants and Contracts 3,868 3,868 3,868 -Receipts from Cities, Counties, and Tow ns 10,032 15,682 16,951 1,269Private Donations, Gifts and Contracts 475 239 364 125Tobacco Master Settlement 53,166 47,962 47,664 (298)Other 186,357 208,007 225,342 17,335 Total Revenues 19,002,127 19,609,400 19,358,274 (251,126)
Expenditures: Current: General Government 2,571,224 2,571,068 2,497,121 73,947 Education 8,070,533 8,142,706 8,095,292 47,414 Transportation - 363 328 35 Resources and Economic Development 426,942 475,598 413,406 62,192 Individual and Family Services 5,998,805 6,291,377 6,238,651 52,726 Administration of Justice 2,584,339 2,700,068 2,678,980 21,088Capital Outlay 27,692 110,556 26,010 84,546 Total Expenditures 19,679,535 20,291,736 19,949,788 341,948 Revenues Over (Under) Expenditures (677,408) (682,336) (591,514) 90,822
Other Financing Sources (Uses):Transfers: Transfers In 749,323 762,600 775,363 12,763 Transfers Out (471,368) (460,976) (464,559) (3,583)Bonds Issued - - - -Premium on Debt Issuance - - - - Total Other Financing Sources (Uses) 277,955 301,624 310,804 9,180 Revenues and Other Sources Over (Under) Expenditures and Other Uses (399,453) (380,712) (280,710) 100,002Fund Balance, July 1, as restated 1,759,155 1,759,155 1,759,155 -Fund Balance, June 30 $ 1,359,702 $ 1,378,443 $ 1,478,445 $ 100,002
PositiveVariance
Final/Actual
Original Budget
General Fund
Budget Actual (Negative)Final
See notes on page 183 in this section.

Commonwealth of Virginia 181
$ - $ - $ - $ -1,370,849 1,253,200 1,339,591 86,391
- - - -1,035,602 1,024,405 944,823 (79,582)
840,000 893,800 909,532 15,732- - - -
78,400 88,700 92,255 3,555150,346 150,346 150,346 -
- - - -- - - -- - - -- - - -
65,120 69,900 72,585 2,685483,652 483,651 570,625 86,974
556 - 8,122 8,12219,181 20,127 15,179 (4,948)
- - - -12,595 15,657 19,389 3,73210,132 5,754 13,504 7,750
1,014,746 1,472,689 1,240,635 (232,054)215,039 249,426 103,700 (145,726)
25 25 12,331 12,306- - - -
23,348 28,591 20,823 (7,768)5,319,591 5,756,271 5,513,440 (242,831)
104,930 84,569 53,149 31,4201,048 1,048 1,036 12
5,513,869 6,623,584 5,761,549 862,03514,032 14,668 11,899 2,769
- - - -9,767 9,767 9,767 -
64,666 86,221 28,202 58,0195,708,312 6,819,857 5,865,602 954,255(388,721) (1,063,586) (352,162) 711,424
89,311 89,311 109,015 19,704(406,681) (420,435) (340,028) 80,407273,740 273,740 273,740 -27,236 27,236 27,236 -
(16,394) (30,148) 69,963 100,111
(405,115) (1,093,734) (282,199) 811,5352,242,500 2,242,500 2,242,500 -
$ 1,837,385 $ 1,148,766 $ 1,960,301 $ 811,535
PositiveOriginal Final
Commonwealth Transportation Fund
Final/ActualVariance
Actual (Negative)Budget Budget
Continued on next page

182 Commonwealth of Virginia
Schedule of Revenues, Expenditures, and Changes in Fund Balances – Budget and Actual –General and Major Special Revenue Funds (Continued from previous page)Fiscal Year Ended June 30, 2016(Dollars in Thousands)
Revenues:Taxes: Individual and Fiduciary Income $ - $ - $ - $ - Sales and Use - - - - Corporation Income - - - - Motor Fuel - - - - Motor Vehicle Sales and Use - - - - Communications Sales and Use - - - - Deeds, Contracts, Wills, and Suits - - - - Premiums of Insurance Companies - - - - Alcoholic Beverage Sales - - - - Tobacco Products - - - - Estate - - - - Public Service Corporations - - - - Other Taxes - - - -Rights and Privileges - - - -Sales of Property and Commodities 517 517 - (517)Assessments and Receipts for Support of Special Services - - - -Institutional Revenue - - - -Interest, Dividends, and Rents 535 9,417 587 (8,830)Fines, Forfeitures, Court Fees, Penalties, and Escheats 2,357 2,912 526 (2,386)Federal Grants and Contracts 7,573,286 7,917,148 8,546,210 629,062Receipts from Cities, Counties, and Tow ns - - - -Private Donations, Gifts and Contracts - 1,200 - (1,200)Tobacco Master Settlement - - - -Other 161,277 167,402 169,124 1,722 Total Revenues 7,737,972 8,098,596 8,716,447 617,851
Expenditures: Current: General Government 152,165 143,457 119,505 23,952 Education 949,227 987,075 1,004,108 (17,033) Transportation 35,091 31,769 14,833 16,936 Resources and Economic Development 185,898 188,792 152,606 36,186 Individual and Family Services 6,336,570 6,630,422 7,353,965 (723,543) Administration of Justice 57,444 75,682 41,231 34,451Capital Outlay 18,474 38,296 14,860 23,436 Total Expenditures 7,734,869 8,095,493 8,701,108 (605,615) Revenues Over (Under) Expenditures 3,103 3,103 15,339 12,236
Other Financing Sources (Uses):Transfers: Transfers In 171 171 7,366 7,195 Transfers Out (8,493) (8,493) (27,924) (19,431)Bonds Issued - - - -Premium on Debt Issuance - - - - Total Other Financing Sources (Uses) (8,322) (8,322) (20,558) (12,236) Revenues and Other Sources Over (Under) Expenditures and Other Uses (5,219) (5,219) (5,219) -Fund Balance, July 1, as restated 5,219 5,219 5,219 -Fund Balance, June 30 $ - $ - $ - $ -
Budget Budget Actual (Negative)
Federal Trust
Final/Actual
PositiveVariance
Original Final
See notes on page 183 in this section.

Commonwealth of Virginia 183
Notes for Schedule of Revenues, Expenditures, and Changes in Fund Balances – Budget and Actual –General and Major Special Revenue Funds
1. Basis of Budgeting vs. Modified Accrual Basis Fund Balance (1)
Since the presentation of financial data on the basis of budgeting differs from that presented under accounting principles generally accepted in the United States of America, a schedule reconciling the fund balance on a budgetary basis at June 30, 2016, to the fund balance on a modified accrual basis follows.
(Dollars in Thousands)
General Fund
Fund Balance, Basis of Budgeting $ 1,478,445 $ 1,960,301 $ -Adjustments from Budget to Modif ied Accrual: Accrued Revenues:
Taxes 635,762 138,037 -Tax Refunds (439,657) - -Other Revenue/Other Sources 147,070 99,296 677,581
Medicaid Payable (367,440) - (360,495) Accrued Expenditures/Other Uses (743,891) (269,218) (188,098)Fund Balance, Modif ied Accrual Basis $ 710,289 $ 1,928,416 $ 128,988
Fund Trust Fund
CommonwealthTransportation
Fund Balance ComparisonBudgetary Basis to GAAP Basis
Federal
1. As discussed in Note 1.E., the Literary Fund has no approved budget.
2. Appropriations
The amounts presented in the Schedule of Revenues, Expenditures, and Changes in Fund Balances – Budget and Actual – General and Major Special Revenue Funds are principally on a cash basis and represent the original budget adopted by the General Assembly and all supplemental appropriations and transfers. The following schedule reconciles original appropriations to the final adjusted expenditure appropriations for the General Fund and Major Special Revenue Funds, at June 30, 2016, except the Literary Fund which has no approved budget.
(Dollars in Thousands)
Appropriations (1) $ 19,679,535 $ 5,708,312 $ 7,734,869Supplemental Appropriations:
Reappropriations (2) 129,169 73,684 17,674Subsequent Executive (3) 124,322 758,756 187,921Subsequent Legislative (4) 353,024 356,916 169,366Capital Outlay and Operating Reversions (5) (8,566) - (1,476)Deficit (6) 1,424 - -Transfers (7) (7,274) (5,481) 1,580
Capital Outlay Adjustment (8) 20,102 (58,593) (14,441)Debt Service Adjustment (9) - (13,737) -Appropriations, as adjusted $ 20,291,736 $ 6,819,857 $ 8,095,493
Fund (10)General
Fund (11)Trust
Federal
FundTransportationCommonwealth
1. Represents the budget appropriated through Chapter 665, 2015 Acts of Assembly, as amended by Chapter 732, 2016 Acts of Assembly.2. Actions taken to reappropriate any prior year unexpended balances per authority of the language in the Appropriation Act.3. Actions taken by the Governor to carry forward any prior year unexpended balances, sum sufficient authority, and year 2 to year 1
reductions (General Fund) and actions taken to appropriate any additional revenues collected so that they can be legally spent (Special Revenue Funds).
4. Actions taken by the Governor and the General Assembly to adjust the budget.5. Represents reversions of unexpended capital outlay and operating balances.6. Represents additional appropriations authorized subsequent to the 2016 General Assembly Session for legal expenses.7. Represents transfers required by the Appropriation Act. Transfers out are reduced by approximately $1.6 billion (General Fund) and $20.8
million (Commonwealth Transportation Fund) for transfers to component units and fiduciary funds that have been reclassified as expenditures in accordance with GASB Statement No. 34.
8. Capital outlay appropriations cover the projects' lives and usually extend beyond the current fiscal year. These amounts have been adjusted to report the amount authorized for expenditure during the current fiscal year.
9. The Commonwealth Transportation Fund appropriations have been adjusted for debt service. 10. Budgetary reductions totaling $4.7 million are excluded since they were not available for disbursement during the current fiscal year. 11. Appropriations do not include food stamp issuances of $1.2 billion since this is a noncash item; however, this amount is included in actual
expenditures.

184 Commonwealth of Virginia
Schedule of Changes in Employers' Net Pension Liability (1) (2)Fiscal Year Ended June 30, 2016(Dollars in Thousands)
Total pension liability:Service cost $ 369,779 $ 375,149 $ 369,120 $ 828,856 $ 828,901 $ 831,501Interest 1,533,764 1,482,951 1,436,064 2,931,065 2,834,138 2,722,788Benefit changes - - - - - -Difference betw een actual and expected experience (245,642) 59,923 - (391,881) (212,089) -Assumption changes - - - - - -Benefit payments (1,195,198) (1,136,102) (1,081,866) (2,081,069) (1,980,353) (1,874,636)Refunds of contributions (25,240) (27,724) (25,036) (35,067) (36,058) (36,103)
Net change in total pension liability 437,463 754,197 698,282 1,251,904 1,434,539 1,643,550Total pension liability - beginning 22,521,130 21,766,933 21,068,651 42,930,422 41,495,883 39,852,333
Total pension liability - ending (a) $ 22,958,593 $ 22,521,130 $ 21,766,933 $ 44,182,326 $ 42,930,422 $ 41,495,883
Plan fiduciary net position:Contributions - employer $ 722,617 $ 480,657 $ 343,259 $ 1,062,338 $ 1,267,250 $ 853,634Contributions - member 200,184 195,582 198,035 380,314 373,525 371,241Net investment income 277,166 728,083 2,243,999 516,704 1,327,047 4,042,441Benefit payments (1,195,198) (1,136,102) (1,081,866) (2,081,069) (1,980,353) (1,874,636)Refunds of contributions (25,240) (27,724) (25,036) (35,067) (36,058) (36,103)Administrative expense (10,140) (10,302) (12,341) (18,859) (18,238) (22,036)Other (122) (154) 123 (222) (284) 217
Net change in plan f iduciary net position (30,733) 230,040 1,666,173 (175,861) 932,889 3,334,758Plan fiduciary net position - beginning 16,398,575 16,168,535 14,502,362 30,344,072 29,411,183 26,076,425Plan fiduciary net position - ending (b) $ 16,367,842 $ 16,398,575 $ 16,168,535 $ 30,168,211 $ 30,344,072 $ 29,411,183
Net pension liability - ending (a-b) $ 6,590,751 $ 6,122,555 $ 5,598,398 $ 14,014,115 $ 12,586,350 $ 12,084,700
Plan f iduciary net position as a percentageof the total pension liability (b/a) 71.3% 72.8% 74.3% 68.3% 70.7% 70.9%
Covered payroll (c) $ 3,977,759 $ 3,878,632 $ 3,861,712 $ 7,624,612 $ 7,434,932 $ 7,313,025
Net pension liability as a percentageof covered payroll ((a-b)/c) 165.7% 157.9% 145.0% 183.8% 169.3% 165.2%
2017VRS State
2017VRS Teacher
Change in the Net Pension Liability 2016 20162015 2015
(1) The Commonwealth implemented GASB Statement No. 68, Accounting and Financial Reporting for Pensions – an amendment of GASB Statement No. 27, and GASB Statement No. 71, Pension Transition for Contributions Made Subsequent to the Measurement Date – an amendment of GASB Statement No. 68, effective for the fiscal year ended June 30, 2015, therefore, ten years of data is unavailable.
(2) The Commonwealth’s fiscal year 2016 net pension measurement date is June 30, 2015, as reported in Note 15.
See notes on page 190 in this section.
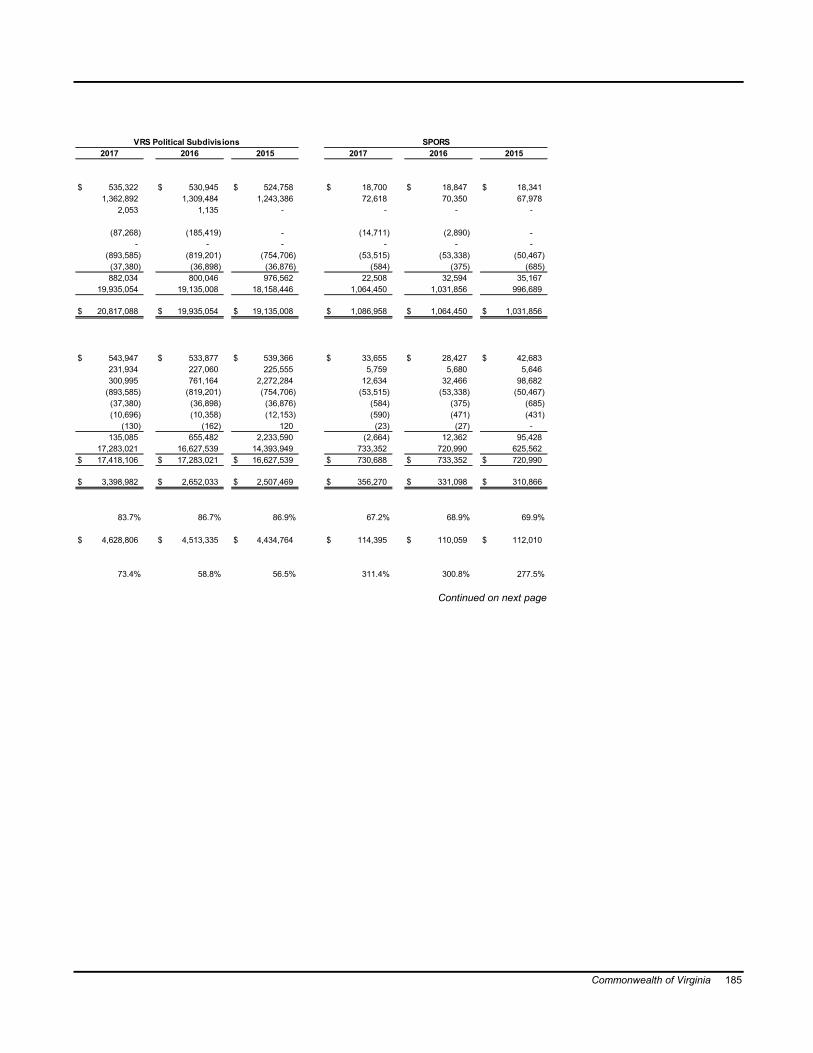
Commonwealth of Virginia 185
$ 535,322 $ 530,945 $ 524,758 $ 18,700 $ 18,847 $ 18,3411,362,892 1,309,484 1,243,386 72,618 70,350 67,978
2,053 1,135 - - - -
(87,268) (185,419) - (14,711) (2,890) -- - - - - -
(893,585) (819,201) (754,706) (53,515) (53,338) (50,467)(37,380) (36,898) (36,876) (584) (375) (685)882,034 800,046 976,562 22,508 32,594 35,167
19,935,054 19,135,008 18,158,446 1,064,450 1,031,856 996,689
$ 20,817,088 $ 19,935,054 $ 19,135,008 $ 1,086,958 $ 1,064,450 $ 1,031,856
$ 543,947 $ 533,877 $ 539,366 $ 33,655 $ 28,427 $ 42,683231,934 227,060 225,555 5,759 5,680 5,646300,995 761,164 2,272,284 12,634 32,466 98,682
(893,585) (819,201) (754,706) (53,515) (53,338) (50,467)(37,380) (36,898) (36,876) (584) (375) (685)(10,696) (10,358) (12,153) (590) (471) (431)
(130) (162) 120 (23) (27) -135,085 655,482 2,233,590 (2,664) 12,362 95,428
17,283,021 16,627,539 14,393,949 733,352 720,990 625,562$ 17,418,106 $ 17,283,021 $ 16,627,539 $ 730,688 $ 733,352 $ 720,990
$ 3,398,982 $ 2,652,033 $ 2,507,469 $ 356,270 $ 331,098 $ 310,866
83.7% 86.7% 86.9% 67.2% 68.9% 69.9%
$ 4,628,806 $ 4,513,335 $ 4,434,764 $ 114,395 $ 110,059 $ 112,010
73.4% 58.8% 56.5% 311.4% 300.8% 277.5%
SPORS201520162017
VRS Political Subdivisions2016 20152017
Continued on next page

186 Commonwealth of Virginia
Schedule of Changes in Employers' Net Pension Liability (1) (2) (Continued from previous page)Fiscal Year Ended June 30, 2016(Dollars in Thousands)
Total pension liability:Service cost $ 45,608 $ 47,531 $ 46,504 $ 21,978 $ 23,254 $ 24,024Interest 129,756 124,579 119,040 42,820 41,759 40,013Benefit changes - - - (15,552) - -Difference betw een actual and expected experience 4,997 (4,849) - (18,681) (9,107) -Assumption changes - - - - - -Benefit payments (92,270) (84,990) (78,412) (41,341) (40,205) (37,984)Refunds of contributions (4,524) (4,797) (4,665) - - -
Net change in total pension liability 83,567 77,474 82,467 (10,776) 15,701 26,053Total pension liability - beginning 1,902,051 1,824,577 1,742,110 632,381 616,680 590,627Total pension liability - ending (a) $ 1,985,618 $ 1,902,051 $ 1,824,577 $ 621,605 $ 632,381 $ 616,680
Plan fiduciary net position:Contributions - employer $ 79,392 $ 62,084 $ 67,483 $ 41,502 $ 31,503 $ 27,727Contributions - member 17,574 17,081 17,908 3,236 3,015 3,051Net investment income 20,899 52,312 156,786 8,112 20,051 60,833Benefit payments (92,270) (84,990) (78,412) (41,341) (40,205) (37,984)Refunds of contributions (4,524) (4,797) (4,665) - - -Administrative expense (940) (743) (681) (363) (283) (268)Other (38) (44) - (15) (17) -
Net change in plan f iduciary net position 20,093 40,903 158,419 11,131 14,064 53,359Plan fiduciary net position - beginning 1,191,353 1,150,450 992,031 456,258 442,194 388,835Plan fiduciary net position - ending (b) $ 1,211,446 $ 1,191,353 $ 1,150,450 $ 467,389 $ 456,258 $ 442,194Net pension liability - ending (a-b) $ 774,172 $ 710,698 $ 674,127 $ 154,216 $ 176,123 $ 174,486
Plan f iduciary net position as a percentageof the total pension liability (b/a) 61.0% 62.6% 63.1% 75.2% 72.1% 71.7%
Covered payroll (c) $ 345,504 $ 338,562 $ 352,492 $ 66,621 $ 61,092 $ 61,020
Net pension liability as a percentageof covered payroll ((a-b)/c) 224.1% 209.9% 191.2% 231.5% 288.3% 285.9%
Change in the Net Pension Liability 2015 20152017 2017JRSVaLORS
2016 2016

Commonwealth of Virginia 187

188 Commonwealth of Virginia
Schedule of Employer Contributions – Pension Plans (1)(Dollars in Thousands)
Contributionsin Relation to Contributions
Actuarially the Actuarially Contributions as a Percentage ofYear Ended Determined Determined Deficiency Covered Covered
June 30 Contribution Contribution (Excess) Payroll Payroll
2016 628,486$ 557,160$ 71,326$ 3,977,759$ 14.01%2015 612,824 478,235 134,589 3,878,632 12.33%2014 504,726 338,286 166,440 3,861,712 8.76%2013 485,577 325,452 160,125 3,715,205 8.76%2012 309,930 117,696 192,234 3,663,475 3.21%2011 294,363 74,113 220,250 3,479,484 2.13%2010 285,209 176,751 108,458 3,556,222 4.97%2009 290,653 225,782 64,871 3,624,109 6.23%2008 260,965 218,954 42,011 3,560,228 6.15%2007 246,458 192,997 53,461 3,362,317 5.74%
2016 1,344,981$ 1,072,020$ 272,961$ 7,624,612$ 14.06%2015 1,353,158 1,078,065 275,093 7,434,932 14.50%2014 1,226,394 852,699 373,695 7,313,025 11.66%2013 1,203,856 837,028 366,828 7,178,629 11.66%2012 903,655 443,078 460,577 6,999,653 6.33%2011 891,237 271,306 619,931 6,903,465 3.93%2010 839,550 450,218 389,332 7,090,791 6.35%2009 845,999 629,497 216,502 7,145,260 8.81%2008 766,559 706,222 60,337 6,856,523 10.30%2007 733,633 603,705 129,928 6,562,008 9.20%
2016 554,335$ 549,408$ 4,927$ 4,628,806$ 11.87%2015 540,859 535,919 4,940 4,513,335 11.87%2014 551,822 539,131 12,691 4,434,764 12.16%2013 537,657 525,385 12,272 4,321,565 12.16%2012 400,879 400,879 - 4,142,150 9.68%2011 391,531 391,531 - 4,078,580 9.60%2010 363,982 363,982 - 4,125,087 8.82%2009 364,366 364,366 - 4,144,638 8.79%2008 351,469 351,469 - 3,960,566 8.87%2007 319,516 319,516 - 3,699,629 8.64%
VIRGINIA RETIREMENT SYSTEM (VRS) � STATE
VIRGINIA RETIREMENT SYSTEM (VRS) ��TEACHER
VIRGINIA RETIREMENT SYSTEM (VRS) ��POLITICAL SUBDIVISIONS
(1) Contributions made by employers were not in all cases in accordance with the actuarially determined Annual Required Contribution (ARC), but they did meet statutory requirements.
See notes on page 190 in this section.

Commonwealth of Virginia 189
Contributionsin Relation to Contributions
Actuarially the Actuarially Contributions as a Percentage ofYear Ended Determined Determined Deficiency Covered Covered
June 30 Contribution Contribution (Excess) Payroll Payroll
2016 35,211$ 31,561$ 3,650$ 114,395$ 27.59%2015 33,876 28,417 5,459 110,059 25.82%2014 36,538 27,711 8,827 112,010 24.74%2013 34,535 26,193 8,342 105,872 24.74%2012 26,250 11,441 14,809 102,701 11.14%2011 24,570 7,460 17,110 96,128 7.76%2010 23,791 15,714 8,077 98,757 15.91%2009 24,241 20,175 4,066 100,626 20.05%2008 22,941 20,989 1,952 101,106 20.76%2007 19,402 16,358 3,044 97,892 16.71%
2016 72,763$ 65,101$ 7,662$ 345,504$ 18.84%2015 71,301 59,824 11,477 338,562 17.67%2014 68,806 52,169 16,637 352,492 14.80%2013 66,463 50,392 16,071 340,489 14.80%2012 55,306 24,481 30,825 347,181 7.05%2011 53,686 17,255 36,431 337,010 5.12%2010 57,894 39,027 18,867 345,020 11.31%2009 60,059 50,932 9,127 357,922 14.23%2008 61,325 55,929 5,396 352,643 15.86%2007 56,190 48,338 7,852 323,115 14.96%
2016 37,008$ 33,291$ 3,717$ 66,621$ 49.97%2015 35,336 31,560 3,776 61,092 51.66%2014 33,018 27,728 5,290 61,020 45.44%2013 32,185 27,028 5,157 59,481 45.44%2012 27,631 18,907 8,724 59,053 32.02%2011 28,101 17,303 10,798 60,058 28.81%2010 23,638 17,065 6,573 62,139 27.46%2009 23,148 21,000 2,148 60,853 34.51%2008 23,600 22,386 1,214 58,896 38.01%2007 22,557 20,530 2,027 56,293 36.47%
JUDICIAL RETIREMENT SYSTEM (JRS)
STATE POLICE OFFICERS' RETIREMENT SYSTEM (SPORS)
VIRGINIA LAW OFFICERS' RETIREMENT SYSTEM (VaLORS)

190 Commonwealth of Virginia
Notes for Pension Schedules
State Teacher Political Subdivisions SPORS VaLORS JRS
Valuation Date June 30, 2015 June 30, 2015 June 30, 2015 June 30, 2015 June 30, 2015 June 30, 2015
Actuarial Cost Method Entry Age Normal Entry Age Normal Entry Age Normal Entry Age Normal Entry Age Normal Entry Age Normal
Actuarial Assumptions:Investment Rate of Return* 7.00% 7.00% 7.00% 7.00% 7.00% 7.00%
Projected Salary Increases:*State Employees/Teachers 3.50% to 5.35% 3.50% to 5.95% N/A 3.50% to 4.75% 3.50% to 4.75% 4.50%
Political Subdivision � Non-Hazardous Duty Employees N/A N/A 3.50% to 5.35% N/A N/A N/A
����������� �������� Hazardous Duty Employees N/A N/A 3.50% to 4.75% N/A N/A N/A
Post-Retirement Benefits Increases**Plan 1 2.50% 2.50% 2.50% 2.50% 2.50% 2.50%Plan 2 2.25% 2.25% 2.25% 2.25% 2.25% 2.25%
* Includes inflation at 2.50%.** Compounded annually.
VRS
As discussed in Note 15, contact the Virginia Retirement System to obtain a copy of the individually published financial statements.

Commonwealth of Virginia 191
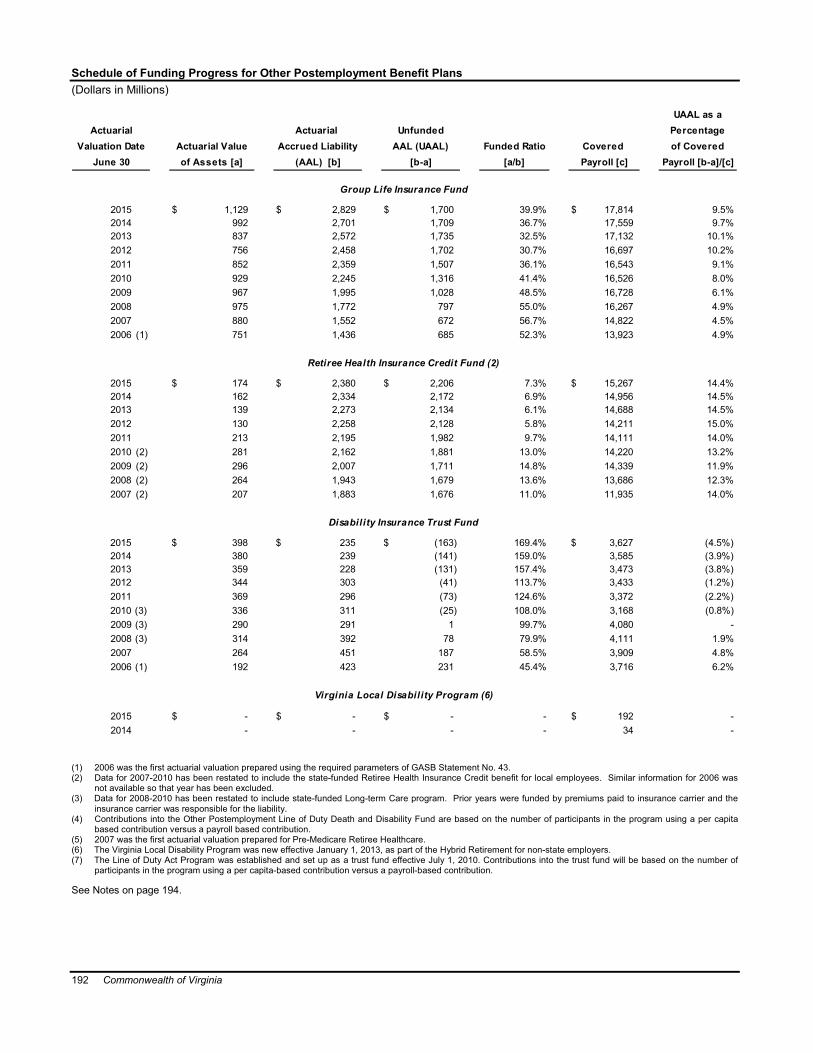
192 Commonwealth of Virginia
Schedule of Funding Progress for Other Postemployment Benefit Plans(Dollars in Millions)
UAAL as aUnfunded Percentage
AAL (UAAL) Funded Ratio Covered of Covered[b-a] [a/b] Payroll [c] Payroll [b-a]/[c]
2015 $ 1,129 $ 2,829 $ 1,700 39.9% $ 17,814 9.5%2014 992 2,701 1,709 36.7% 17,559 9.7%2013 837 2,572 1,735 32.5% 17,132 10.1%2012 756 2,458 1,702 30.7% 16,697 10.2%2011 852 2,359 1,507 36.1% 16,543 9.1%2010 929 2,245 1,316 41.4% 16,526 8.0%2009 967 1,995 1,028 48.5% 16,728 6.1%2008 975 1,772 797 55.0% 16,267 4.9%2007 880 1,552 672 56.7% 14,822 4.5%2006 (1) 751 1,436 685 52.3% 13,923 4.9%
2015 $ 174 $ 2,380 $ 2,206 7.3% $ 15,267 14.4%2014 162 2,334 2,172 6.9% 14,956 14.5%2013 139 2,273 2,134 6.1% 14,688 14.5%2012 130 2,258 2,128 5.8% 14,211 15.0%2011 213 2,195 1,982 9.7% 14,111 14.0%2010 (2) 281 2,162 1,881 13.0% 14,220 13.2%2009 (2) 296 2,007 1,711 14.8% 14,339 11.9%2008 (2) 264 1,943 1,679 13.6% 13,686 12.3%2007 (2) 207 1,883 1,676 11.0% 11,935 14.0%
2015 $ 398 $ 235 $ (163) 169.4% $ 3,627 (4.5%)2014 380 239 (141) 159.0% 3,585 (3.9%)2013 359 228 (131) 157.4% 3,473 (3.8%)2012 344 303 (41) 113.7% 3,433 (1.2%)2011 369 296 (73) 124.6% 3,372 (2.2%)2010 (3) 336 311 (25) 108.0% 3,168 (0.8%)2009 (3) 290 291 1 99.7% 4,080 -2008 (3) 314 392 78 79.9% 4,111 1.9%2007 264 451 187 58.5% 3,909 4.8%2006 (1) 192 423 231 45.4% 3,716 6.2%
2015 $ - $ - $ - - $ 192 -2014 - - - - 34 -
Retiree Health Insurance Credit Fund (2)
Disability Insurance Trust Fund
Group Life Insurance Fund
Actuarial
of Assets [a]Actuarial Value
(AAL) [b]Accrued Liability
ActuarialValuation Date
June 30
Virginia Local Disability Program (6)
(1) 2006 was the first actuarial valuation prepared using the required parameters of GASB Statement No. 43.(2) Data for 2007-2010 has been restated to include the state-funded Retiree Health Insurance Credit benefit for local employees. Similar information for 2006 was
not available so that year has been excluded. (3) Data for 2008-2010 has been restated to include state-funded Long-term Care program. Prior years were funded by premiums paid to insurance carrier and the
insurance carrier was responsible for the liability.(4) Contributions into the Other Postemployment Line of Duty Death and Disability Fund are based on the number of participants in the program using a per capita
based contribution versus a payroll based contribution. (5) 2007 was the first actuarial valuation prepared for Pre-Medicare Retiree Healthcare.(6) The Virginia Local Disability Program was new effective January 1, 2013, as part of the Hybrid Retirement for non-state employers.(7) The Line of Duty Act Program was established and set up as a trust fund effective July 1, 2010. Contributions into the trust fund will be based on the number of
participants in the program using a per capita-based contribution versus a payroll-based contribution.
See Notes on page 194.

Commonwealth of Virginia 193
UAAL as aUnfunded Percentage
AAL (UAAL) Funded Ratio Covered of Covered[b-a] [a/b] Payroll [c] Payroll [b-a]/[c]
2015 $ - $ 245 $ 245 - N/A -2014 7 226 219 3.1% N/A -2013 10 204 194 4.9% N/A -2012 6 226 220 2.7% N/A -2011 - 399 399 - N/A -2010 (4) - 576 576 - N/A -2009 - 373 373 - N/A -2008 3 185 182 1.6% N/A -2007 - 146 146 - N/A -2006 (1) - 99 99 - N/A -
2015 $ - $ 1,309 $ 1,309 - $ 4,034 32.4%2014 - 1,342 1,342 - 4,011 33.5%2013 - 1,262 1,262 - 3,857 32.7%2012 - 1,351 1,351 - 3,709 36.4%2011 - 1,269 1,269 - 3,566 35.6%2010 (3) - 1,298 1,298 - 3,297 39.4%2009 - 1,218 1,218 - 3,170 38.4%2007 (5) - 982 982 - 2,931 33.5%
Pre-M edicare Retiree Healthcare
Line of Duty Death and Disability (Line of Duty Trust Fund) (7)
Actuarial Actuarial Valuation Date Actuarial Value Accrued Liability
June 30 of Assets [a] (AAL) [b]

194 Commonwealth of Virginia
Notes for Schedule of Funding Progress for Other Postemployment Benefit Plans
Group Life Retiree Disability Virginia Line of Duty Pre-MedicareInsurance Health Insurance Insurance Local Disability Death and Retiree
Fund Credit Fund Trust Fund Program Disability Healthcare
Valuation Date June 30, 2015 June 30, 2015 June 30, 2015 June 30, 2015 June 30, 2015 July 1, 2015
Entry Age Normal Entry Age Normal Entry Age Normal Entry Age Normal Entry Age Normal Projected Unit Credit
Amortization Method Level Percent of Pay, Closed
Level Percent of Pay, Closed
Level Percent of Pay, Closed
Level Percent of Pay, Closed
Level Percent of Pay, Open
Level dollar, Open
Payroll Growth Rate:State Employees 3.0% 3.0% 3.0% N/A 3.0% 3.0%Teachers 3.0% 3.0% N/A 3.0% N/A N/APolitical Subdivision Employees 3.0% 3.0% N/A 3.0% 3.0% N/AState Police / Virginia Law Officers 3.0% 3.0% 3.0% N/A 3.0% 3.0%Judges 3.0% 3.0% N/A N/A N/A N/A
Effective Amortization Period (1)State Employees 28.6 years 28.0 years 25.9 years N/A 30.0 years 30.0 yearsTeachers 28.6 years 27.8 years N/A 20.1 years N/A N/APolitical Subdivision Employees 28.6 years 27.8 years N/A 17.9 years 30.0 years N/A
Asset Valuation MethodState Employees and Teachers 5-Year, 5-Year, 5-Year, 5-Year, Market Value Market Value
Smoothed Market Smoothed Market Smoothed Market Smoothed Market
Political Subdivision Employees 5-Year, Market Value N/A 5-Year, Market Value Market Valueand State-Funded Local Employees Smoothed Market Smoothed Market
Actuarial Assumptions:Investment Rate of Return (2) 7.0% 7.0% 7.0% 7.0% 4.8% 4.0%Projected Salary Increases (3)
State Employees 3.5% to 5.4% 3.5% to 5.4% 3.5% to 5.4% N/A N/A 4.0%Teachers 3.5% to 6.0% 3.5% to 6.0% N/A 3.5% to 6.0% N/A N/APolitical Subdivision Employees (Non-Hazardous Duty Employees) 3.5% to 5.4% 3.5% to 5.4% N/A 3.5% to 5.4% N/A N/APolitical Subdivision Employees (Hazardous Duty Employees) 3.5% to 4.8% 3.5% to 4.8% N/A N/A N/A N/AState Police / Virginia Law Officers 3.5% to 4.8% 3.5% to 4.8% 3.5% to 4.8% N/A N/A 4.0%Judges 4.5% 4.5% N/A N/A N/A N/A
Medical Trend Assumptions (Under Age 65) N/A N/A N/A N/A 7.5% to 5.0%Medical Trend Assumptions (Ages 65 and Older) N/A N/A N/A N/A 5.5% to 5.0%Year of Ultimate Trend Rate N/A N/A N/A N/A 2020
Actuarial Cost Method
(1) The amortization period of the Unfunded Actuarial Accrued Liability (UAAL) was a closed 30-year period for the June 30, 2013 balance and closed 20-year period for each subsequent year. The Line of Duty Act Program amortization period is 30 years for the UAAL.
(2) Includes inflation rate of 2.5 percent. The Line of Duty Act Program uses 4.3 percent for the investment rate of return.(3) Projected salary increases for the Retiree Health Insurance Credit Fund are used in the application of the actuarial cost method. Projected
salary increase factors are not applicable to the Line of Duty Act Program since neither the benefit nor the cost is salary-based.
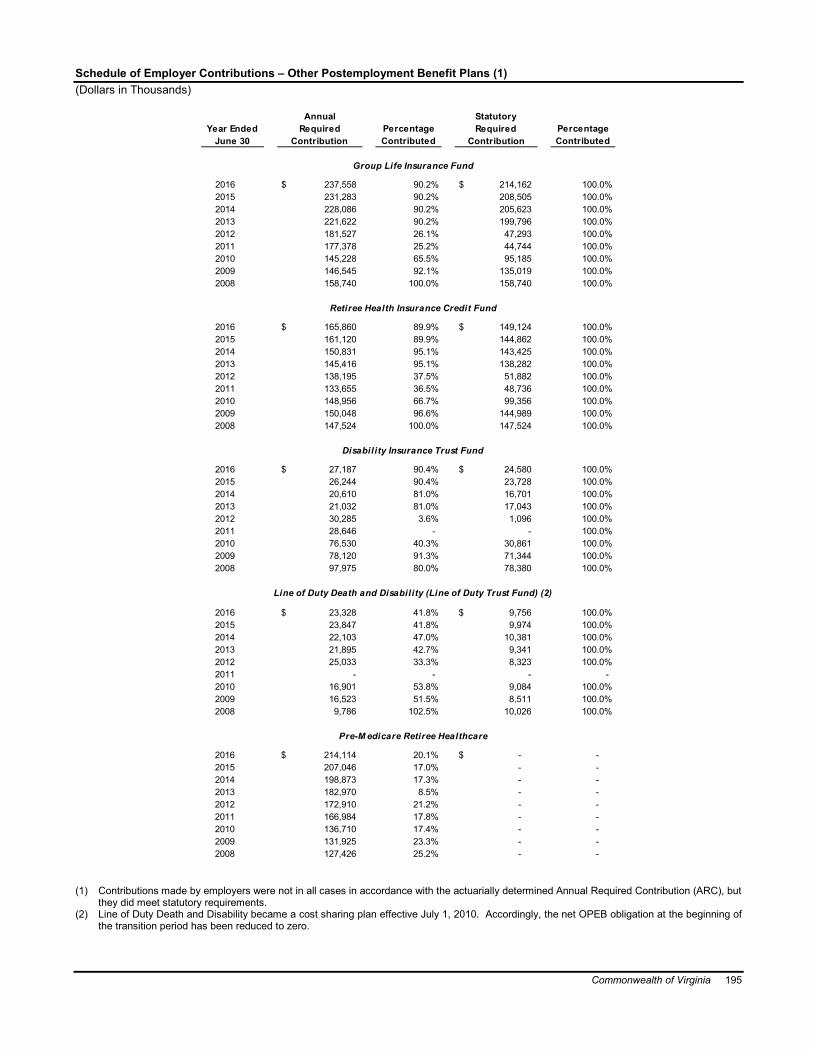
Commonwealth of Virginia 195
Schedule of Employer Contributions – Other Postemployment Benefit Plans (1)(Dollars in Thousands)
Percentage PercentageContributed Contributed
2016 $ 237,558 90.2% $ 214,162 100.0%2015 231,283 90.2% 208,505 100.0%2014 228,086 90.2% 205,623 100.0%2013 221,622 90.2% 199,796 100.0%2012 181,527 26.1% 47,293 100.0%2011 177,378 25.2% 44,744 100.0%2010 145,228 65.5% 95,185 100.0%2009 146,545 92.1% 135,019 100.0%2008 158,740 100.0% 158,740 100.0%
2016 $ 165,860 89.9% $ 149,124 100.0%2015 161,120 89.9% 144,862 100.0%2014 150,831 95.1% 143,425 100.0%2013 145,416 95.1% 138,282 100.0%2012 138,195 37.5% 51,882 100.0%2011 133,655 36.5% 48,736 100.0%2010 148,956 66.7% 99,356 100.0%2009 150,048 96.6% 144,989 100.0%2008 147,524 100.0% 147,524 100.0%
2016 $ 27,187 90.4% $ 24,580 100.0%2015 26,244 90.4% 23,728 100.0%2014 20,610 81.0% 16,701 100.0%2013 21,032 81.0% 17,043 100.0%2012 30,285 3.6% 1,096 100.0%2011 28,646 - - 100.0%2010 76,530 40.3% 30,861 100.0%2009 78,120 91.3% 71,344 100.0%2008 97,975 80.0% 78,380 100.0%
2016 $ 23,328 41.8% $ 9,756 100.0%2015 23,847 41.8% 9,974 100.0%2014 22,103 47.0% 10,381 100.0%2013 21,895 42.7% 9,341 100.0%2012 25,033 33.3% 8,323 100.0%2011 - - - -2010 16,901 53.8% 9,084 100.0%2009 16,523 51.5% 8,511 100.0%2008 9,786 102.5% 10,026 100.0%
2016 $ 214,114 20.1% $ - -2015 207,046 17.0% - -2014 198,873 17.3% - -2013 182,970 8.5% - -2012 172,910 21.2% - -2011 166,984 17.8% - -2010 136,710 17.4% - -2009 131,925 23.3% - -2008 127,426 25.2% - -
Annual
ContributionRequiredStatutory
Year EndedJune 30
Pre-M edicare Retiree Healthcare
Group Life Insurance Fund
Retiree Health Insurance Credit Fund
Disability Insurance Trust Fund
Line of Duty Death and Disability (Line of Duty Trust Fund) (2)
ContributionRequired
(1) Contributions made by employers were not in all cases in accordance with the actuarially determined Annual Required Contribution (ARC), but they did meet statutory requirements.
(2) Line of Duty Death and Disability became a cost sharing plan effective July 1, 2010. Accordingly, the net OPEB obligation at the beginning of the transition period has been reduced to zero.

196 Commonwealth of Virginia
Claims Development Information – Risk Management(Dollars in Thousands)
Comparison of Earned Revenues and Investment Income to Related Costs of Loss and Other Expenses
Fiscal and Policy Year Ended
1. Required contribution and investment revenue:Earned $ 6,560 $ 6,759 $ 6,197 $ 5,485Ceded (a) - - - -Net earned 6,560 6,759 6,197 5,485
2. Unallocated expenses 1,047 1,307 1,272 1,269
3. Estimated incurred claims and expenses, end of policy year:Incurred 2,060 3,330 3,681 3,404Ceded (a) - - - -Net incurred 2,060 3,330 3,681 3,404
4. Net paid (cumulative) as of:End of policy year 106 493 300 412One year later 1,051 1,697 1,858 2,236Tw o years later 2,436 3,476 2,690 5,237Three years later 2,631 3,753 3,679 6,744Four years later 2,662 3,834 3,867 7,013Five years later 2,671 5,065 3,928 7,653Six years later 2,671 5,084 3,928 7,937Seven years later 2,671 5,140 3,930Eight years later 2,671 5,164Nine years later 2,671
5. Reestimated ceded claims and expenses (a) - - - -
6. Reestimated incurred claims and expenses:End of policy year 2,060 3,330 3,681 3,404One year later 3,316 3,928 3,742 6,096Tw o years later 3,224 5,420 3,943 8,428Three years later 2,887 5,309 4,721 8,640Four years later 2,730 5,094 4,555 8,692Five years later 2,731 6,065 4,000 7,894Six years later 2,731 5,768 3,936 8,108Seven years later 2,731 5,968 3,936Eight years later 2,716 6,691Nine years later 2,716
7. Increase (decrease) in estimated net incurred 656 3,361 255 4,704claims and expense from end of policy year
2007 2008 2009 2010
The Commonwealth, through the Department of the Treasury, Division of Risk Management, provides errors and omissions liability insurance and law enforcement professional liability insurance for local governmental units, which went into effect in fiscal year 1987.
See Notes on page 200 in this section.
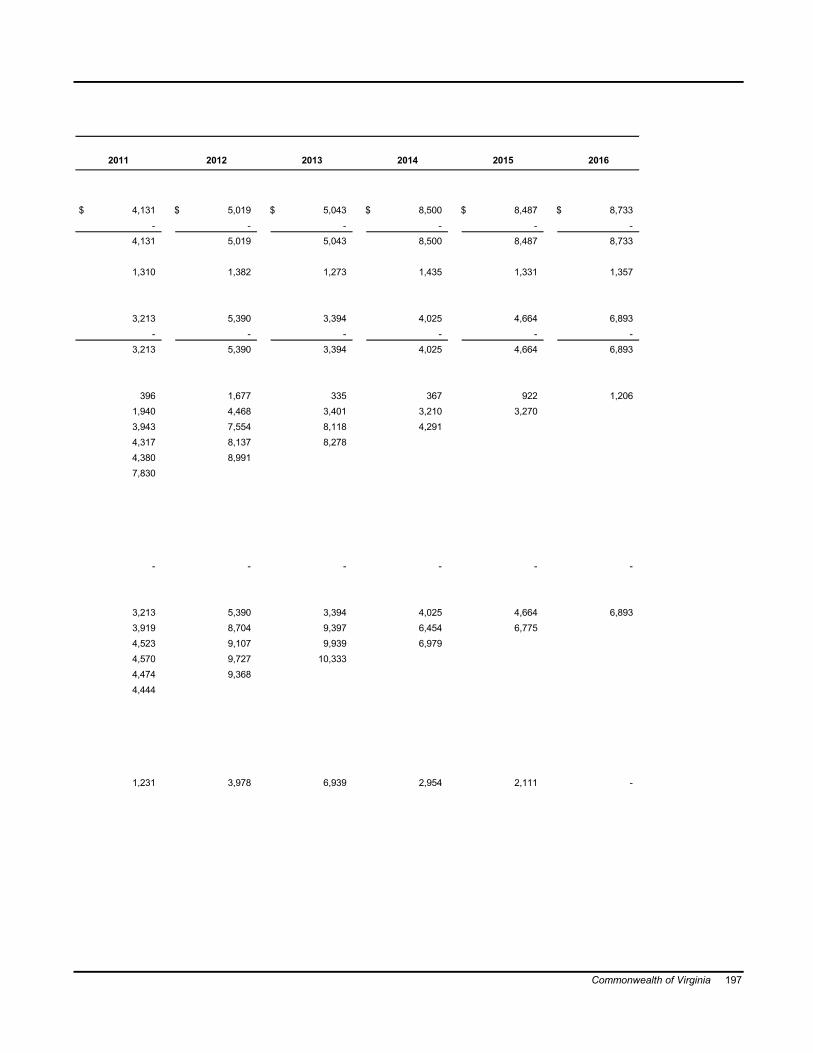
Commonwealth of Virginia 197
$ 4,131 $ 5,019 $ 5,043 $ 8,500 $ 8,487 $ 8,733- - - - - -
4,131 5,019 5,043 8,500 8,487 8,733
1,310 1,382 1,273 1,435 1,331 1,357
3,213 5,390 3,394 4,025 4,664 6,893- - - - - -
3,213 5,390 3,394 4,025 4,664 6,893
396 1,677 335 367 922 1,2061,940 4,468 3,401 3,210 3,2703,943 7,554 8,118 4,2914,317 8,137 8,2784,380 8,9917,830
- - - - - -
3,213 5,390 3,394 4,025 4,664 6,8933,919 8,704 9,397 6,454 6,7754,523 9,107 9,939 6,9794,570 9,727 10,3334,474 9,3684,444
1,231 3,978 6,939 2,954 2,111 -
2014 201620152011 2012 2013

198 Commonwealth of Virginia
Claims Development Information – Health Care(Dollars in Thousands)
Fiscal and Policy Year Ended
1. Required contribution and investment revenue:Earned $ 202,366 $ 211,034 $ 222,498 $ 240,305Ceded (a) - - - -Net earned 202,366 211,034 222,498 240,305
2. Unallocated expenses 13,782 16,215 16,400 15,936
3. Estimated incurred claims and expenses, end of policy year:Incurred 163,787 185,117 214,411 215,376Ceded (a) - - - -Net incurred 163,787 185,117 214,411 215,376
4. Net paid (cumulative) as of:End of policy year 159,769 181,566 204,655 214,371One year later N/A N/A N/A N/ATw o years later N/A N/A N/A N/AThree years later N/A N/A N/A N/AFour years later N/A N/A N/A N/AFive years later N/A N/A N/A N/ASix years later N/A N/A N/A N/ASeven years later N/A N/A N/AEight years later N/A N/ANine years later N/A
5. Reestimated ceded claims and expenses (a) - - - -
6. Reestimated incurred claims and expenses:End of policy year 163,787 185,117 214,411 215,376One year later 163,787 185,117 214,411 215,376Tw o years later N/A N/A N/A N/AThree years later N/A N/A N/A N/AFour years later N/A N/A N/A N/AFive years later N/A N/A N/A N/ASix years later N/A N/A N/A N/ASeven years later N/A N/A N/AEight years later N/A N/ANine years later N/A
7. Increase (decrease) in estimated net incurred - - - -claims and expense from end of policy year
Comparison of Earned Revenues and Investment Income to Related Costs of Loss and Other Expenses
2007 2008 2009 2010
The Commonwealth, through its Department of Human Resource Management, provides health care insurance for local governmental units, which went into effect in fiscal year 1987.
See Notes on page 200 in this section.

Commonwealth of Virginia 199
$ 246,730 $ 259,135 $ 284,526 $ 320,678 $ 343,470 $ 392,778- - - - - -
246,730 259,135 284,526 320,678 343,470 392,778
15,849 16,701 18,781 17,738 22,748 25,422
213,694 250,019 277,455 290,557 327,154 386,227- - - - - -
213,694 250,019 277,455 290,557 327,154 386,227
209,365 235,058 267,256 291,711 329,099 379,376N/A N/A N/A N/A N/AN/A N/A N/A N/AN/A N/A N/AN/A N/AN/A
- - - - - -
213,694 250,019 277,455 290,557 327,154 386,227213,694 250,019 277,455 290,557 327,154
N/A N/A N/A N/AN/A N/A N/AN/A N/AN/A
- - - - - -
2015 20162011 2012 2013 2014

200 Commonwealth of Virginia
Notes for Claims Development Information Tables
The tables on the previous four pages illustrate how the Risk Management and Health Care Claims Funds earned revenues (net of reinsurance) and investment income compare to related costs of loss (net of loss assumed by reinsurers) and other expenses assumed by the funds as of the end of each of the past several years. The rows of the tables are defined as follows:
1. This line shows the total of each fiscal year’s gross earned contribution revenue and investment revenue, contribution revenue ceded to reinsurers, and net earned contribution revenue and reported investment revenue.
2. This line shows each fiscal year's other operating costs of the funds, including overhead and claims expense not allocable to individual claims.
3. This line shows the funds’ gross incurred claims and allocated claim adjustment expenses, claims assumed by reinsurers, and net incurred claims and adjustment expenses (both paid and accrued) as originally reported at the end of the first year in which the event that triggered coverage under the contract occurred (called policy year).
4. This section of rows shows the cumulative net amounts paid as of the end of successive years for each policy year.
5. This line shows the latest reestimated amount of claims assumed by reinsurers as of the end of the current year for each accident year.
6. This section of rows shows how each policy year's net incurred claims increased or decreased as of the end of successive years. (This annual reestimation results from new information received on known claims, reevaluation of existing information on known claims, as well as emergence of new claims not previously known.)
7. This line compares the latest reestimated net incurred claims amount to the amount originally established (line 3) and shows whether this latest estimate of net claims cost is greater or less than originally thought. As data for individual policy years mature, the correlation between original estimates and reestimated amounts is commonly used to evaluate the accuracy of net incurred claims currently recognized in less mature policy years.
The columns of the tables show data for successive policy years.
Notes:
(a) During fiscal year 1997, the Commonwealth implemented GASB Statement No. 30, Risk Financing Omnibus. The Commonwealth has no reinsurers; therefore, the ceded amounts on lines 1, 3, and 5 are zero.

Commonwealth of Virginia 201
Combining and Individual Fund Statements and Schedules

202 Commonwealth of Virginia

Commonwealth of Virginia 203
Nonmajor Governmental Funds
Special Revenue Funds
Special Revenue Funds account for specific revenue sources that are restricted or committed to finance particular functions and activities of the Commonwealth.
The Health and Social Services Special Revenue Fundaccounts for revenues and expenditures related to local health care assistance.
The Other Special Revenue Fund accounts for revenues and expenditures related to business and agricultural activities, and miscellaneous activities throughout the Commonwealth.
Debt Service Funds
The Debt Service Funds account for transactions related to resources retained and used for the payment of interest and principal on long-term obligations recorded in the Governmental Activities column on the Government-wide Statement of Net Position.
Primary Government accounts for the payment of principal and interest on bonds used to acquire, construct, or improve parks, highways, and correctional, behavioral health, and parking facilities owned by the Commonwealth.
The Virginia Public Building Authority accounts for the payment of principal and interest on bonds used to acquire, construct, and operate public buildings used by the Commonwealth and its political subdivisions.
Capital Project Funds
The Capital Project Funds are maintained to account for resources received and used for the acquisition, construction, or improvement of capital facilities not reported in the other governmental or proprietary funds.
Primary Government accounts for the financial resources acquired through the issuance of General Obligation Bonds and Energy Performance Contracts. The resources are used to acquire, construct, or improve land, public buildings, and parking facilities owned by the Commonwealth.
The Virginia Public Building Authority accounts for financial resources acquired through the issuance of section 9(d) bonds. These resources are used to acquire, construct, finance, refinance and operate public buildings used by the Commonwealth and any of its political subdivisions. Resources are also used to finance or refinance reimbursements to localities or governmental entities for the Commonwealth’s share of the capital costs for certain authorized projects.
Permanent Funds
Permanent Funds are funds whose principal must remain intact.
Commonwealth Health Research Fund provides financial grants for human health research benefiting the Commonwealth’s citizens. The entire fund balance is restricted for use as such as a condition of a legal settlement.
Behavioral Health Endowment Funds provide funds for the welfare of patients in behavioral health facilities. The entire fund balance is restricted for use as such.

204 Commonwealth of Virginia
Combining Balance Sheet – Nonmajor Governmental FundsJune 30, 2016(Dollars in Thousands)
Assets and Deferred Outflows of ResourcesCash and Cash Equivalents $ 158,867 $ 405,681 $ 564,548Investments 5,401 13,988 19,389Receivables, Net 37,481 21,106 58,587Due from Other Funds 1,550 5,272 6,822Due from External Parties (Fiduciary Funds) - 168 168Interfund Receivable - 157,909 157,909Inventory 4,804 241 5,045Prepaid Items 17,103 3,169 20,272Other Assets 10 1,704 1,714Loans Receivable from Component Units - 18,905 18,905Total Assets 225,216 628,143 853,359
Deferred Outflows of Resources - - - Total Assets and Deferred Outf low s of Resources $ 225,216 $ 628,143 $ 853,359
Liabilities, Deferred Inflows of Resources, and Fund BalancesAccounts Payable $ 15,797 $ 29,652 $ 45,449Amounts Due to Other Governments 363 2,357 2,720Due to Other Funds 1,963 3,086 5,049Due to Component Units - - -Due to External Parties (Fiduciary Funds) 1,168 1,569 2,737Unearned Revenue 2,168 4,816 6,984Obligations Under Securities Lending Program 331 1,411 1,742Other Liabilities 65 4,840 4,905Long-term Liabilities Due Within One Year 133 74 207
Total Liabilities 21,988 47,805 69,793 Deferred Inflows of Resources 18,482 8,489 26,971 Total Liabilities and Deferred Inflow s of Resources 40,470 56,294 96,764
Fund Balances:Nonspendable 21,907 3,354 25,261Restricted 35,875 71,072 106,947Committed 121,567 474,065 595,632Assigned 5,397 23,358 28,755
Total Fund Balances 184,746 571,849 756,595$ 225,216 $ 628,143 $ 853,359Total Liabilities, Deferred Inflow s of Resources, and Fund Balances
Health andSocial
TotalServices
Special Revenue Funds
Other

Commonwealth of Virginia 205
$ 21,752 $ - $ 21,752 $ 27,739 $ 23,490 $ 51,229- - - - - -- - - - 42 42- - - - - -- - - - - -- - - - - -- - - - - -- - - - - -- - - - - -- - - - - -
21,752 - 21,752 27,739 23,532 51,271- - - - - -
$ 21,752 $ - $ 21,752 $ 27,739 $ 23,532 $ 51,271
$ - $ - $ - $ 1,022 $ 10,590 $ 11,612- - - - - -- - - - - -- - - 39 - 39- - - - - -- - - - - -- - - - - -- - - - - -- - - - - -- - - 1,061 10,590 11,651- - - - - -- - - 1,061 10,590 11,651
- - - - - -21,752 - 21,752 26,678 12,942 39,620
- - - - - -- - - - - -
21,752 - 21,752 26,678 12,942 39,620$ 21,752 $ - $ 21,752 $ 27,739 $ 23,532 $ 51,271
Government AuthorityAuthority TotalPrimary Building
Government
Virginia PublicPrimary
Debt Service Funds Capital Project Funds
Virginia Public
TotalBuilding
Continued on next page

206 Commonwealth of Virginia
Combining Balance Sheet – Nonmajor Governmental Funds (Continued from previous page)June 30, 2016(Dollars in Thousands)
Assets and Deferred Outflows of ResourcesCash and Cash Equivalents $ 111 $ 134 $ 245 $ 637,774Investments 35,227 - 35,227 54,616Receivables, Net - - - 58,629Due from Other Funds - - - 6,822Due from External Parties (Fiduciary Funds) - - - 168Interfund Receivable - - - 157,909Inventory - - - 5,045Prepaid Items - - - 20,272Other Assets - - - 1,714Loans Receivable from Component Units - - - 18,905Total Assets 35,338 134 35,472 961,854 Deferred Outflows of Resources - - - - Total Assets and Deferred Outf low s of Resources $ 35,338 $ 134 $ 35,472 $ 961,854
Liabilities, Deferred Inflows of Resources, and Fund BalancesAccounts Payable $ 8 $ - $ 8 $ 57,069Amounts Due to Other Governments - - - 2,720Due to Other Funds 1 - 1 5,050Due to Component Units - - - 39Due to External Parties (Fiduciary Funds) 1 - 1 2,738Unearned Revenue - - - 6,984Obligations Under Securities Lending Program 1 - 1 1,743Other Liabilities - - - 4,905Long-term Liabilities Due Within One Year - - - 207
Total Liabilities 11 - 11 81,455 Deferred Inflows of Resources - - - 26,971 Total Liabilities and Deferred Inflow s of Resources 11 - 11 108,426
Fund Balances:Nonspendable 34,007 48 34,055 59,316Restricted 1,320 86 1,406 169,725Committed - - - 595,632Assigned - - - 28,755
Total Fund Balances 35,327 134 35,461 853,428$ 35,338 $ 134 $ 35,472 $ 961,854Total Liabilities, Deferred Inflow s of Resources, and Fund Balances
Permanent Funds
Endowment
CommonwealthHealth
Research
TotalNonmajor
GovernmentalFundsTotalFunds
BehavioralHealth
Board

Commonwealth of Virginia 207

208 Commonwealth of Virginia
Combining Statement of Revenues, Expenditures, and Changes in Fund Balance –Nonmajor Governmental FundsFor the Fiscal Year Ended June 30, 2016(Dollars in Thousands)
RevenuesTaxes $ 4,735 $ 74,358 $ 79,093Rights and Privileges 142,162 182,821 324,983Institutional Revenue 209,879 19,932 229,811Interest, Dividends, Rents, and Other Investment Income 403 13,639 14,042Other 106,461 316,947 423,408Total Revenues 463,640 607,697 1,071,337
ExpendituresCurrent:
General Government 6 152,997 153,003Education 133 24,236 24,369Transportation - 7,250 7,250Resources and Economic Development 36,815 303,772 340,587Individual and Family Services 392,858 68,477 461,335Administration of Justice 452 66,431 66,883
Capital Outlay 3 4,707 4,710Debt Service:
Principal Retirement - - -Interest and Charges - - -
Total Expenditures 430,267 627,870 1,058,137Revenues Over (Under) Expenditures 33,373 (20,173) 13,200
Other Financing Sources (Uses)Transfers In 1,425 40,361 41,786Transfers Out (24,015) (26,864) (50,879)Notes Issued - 250 250Insurance Recoveries 76 334 410Capital Leases Issued - 185 185Premium on Debt Issuance - - -Refunding Bonds Issued - - -Sale of Capital Assets 375 5,518 5,893Payment to Refunded Bond Escrow Agents - - -
Total Other Financing Sources (Uses) (22,139) 19,784 (2,355)
Net Change in Fund Balances 11,234 (389) 10,845Fund Balance, July 1, as restated 173,512 572,238 745,750Fund Balance, June 30 $ 184,746 $ 571,849 $ 756,595
Special Revenue Funds
TotalOtherServicesSocial
Health and

Commonwealth of Virginia 209
$ - $ - $ - $ - $ - $ -- - - - - -- - - - - -4 - 4 86 655 741
7,212 - 7,212 - 973 9737,216 - 7,216 86 1,628 1,714
- - - - - -- - - - - -- - - - - -- - - - - -- - - - - -- - - - - -- - - 8,310 244,564 252,874
263,159 160,470 423,629 - - -180,020 101,612 281,632 - - -443,179 262,082 705,261 8,310 244,564 252,874
(435,963) (262,082) (698,045) (8,224) (242,936) (251,160)
412,535 261,989 674,524 - - -- - - - (641) (641)- - - 3,336 - 3,336- - - - - -- - - - - -
18,034 - 18,034 - - -75,825 - 75,825 - - -
- - - - - -(93,315) - (93,315) - - -
413,079 261,989 675,068 3,336 (641) 2,695
(22,884) (93) (22,977) (4,888) (243,577) (248,465)44,636 93 44,729 31,566 256,519 288,085
$ 21,752 $ - $ 21,752 $ 26,678 $ 12,942 $ 39,620
Debt Service FundsVirginia Virginia
TotalAuthority AuthorityPrimary
Government
Capital Project Funds
Total
Public
GovernmentPrimary
PublicBuildingBuilding
Continued on next page
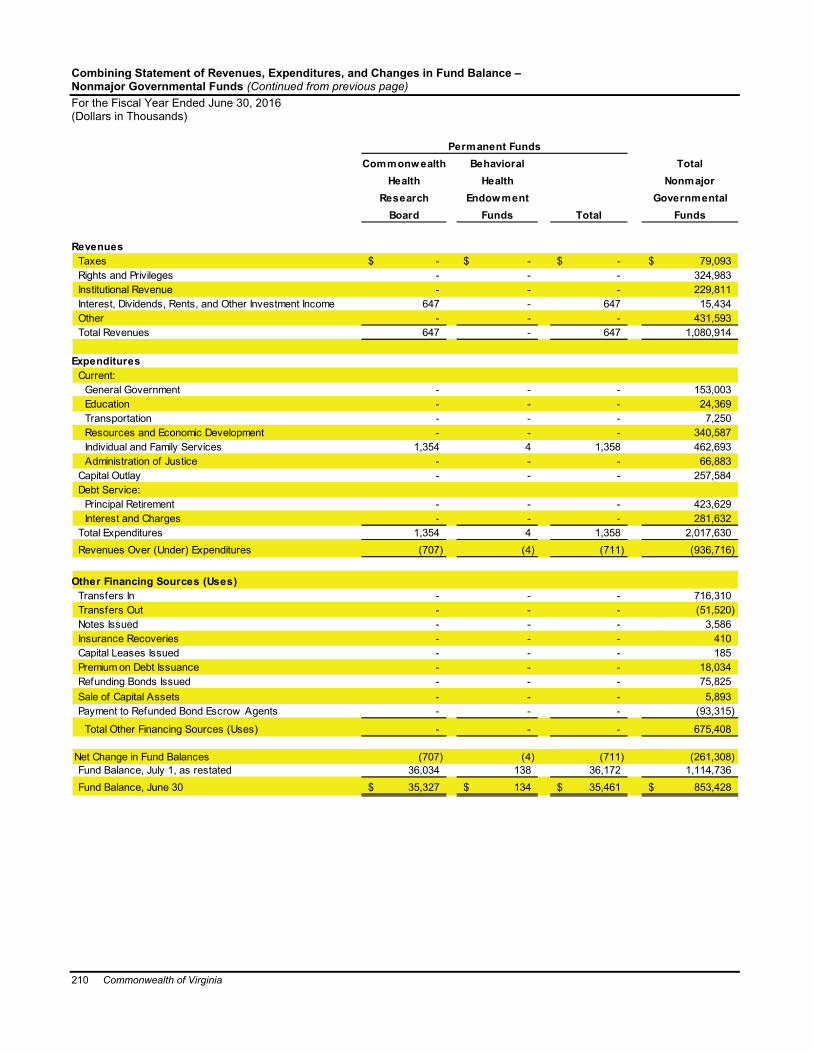
210 Commonwealth of Virginia
Combining Statement of Revenues, Expenditures, and Changes in Fund Balance –Nonmajor Governmental Funds (Continued from previous page)For the Fiscal Year Ended June 30, 2016(Dollars in Thousands)
RevenuesTaxes $ - $ - $ - $ 79,093Rights and Privileges - - - 324,983Institutional Revenue - - - 229,811Interest, Dividends, Rents, and Other Investment Income 647 - 647 15,434Other - - - 431,593Total Revenues 647 - 647 1,080,914
ExpendituresCurrent:
General Government - - - 153,003Education - - - 24,369Transportation - - - 7,250Resources and Economic Development - - - 340,587Individual and Family Services 1,354 4 1,358 462,693Administration of Justice - - - 66,883
Capital Outlay - - - 257,584Debt Service:
Principal Retirement - - - 423,629Interest and Charges - - - 281,632
Total Expenditures 1,354 4 1,358 2,017,630Revenues Over (Under) Expenditures (707) (4) (711) (936,716)
Other Financing Sources (Uses)Transfers In - - - 716,310Transfers Out - - - (51,520)Notes Issued - - - 3,586Insurance Recoveries - - - 410Capital Leases Issued - - - 185Premium on Debt Issuance - - - 18,034Refunding Bonds Issued - - - 75,825Sale of Capital Assets - - - 5,893Payment to Refunded Bond Escrow Agents - - - (93,315)
Total Other Financing Sources (Uses) - - - 675,408
Net Change in Fund Balances (707) (4) (711) (261,308)Fund Balance, July 1, as restated 36,034 138 36,172 1,114,736Fund Balance, June 30 $ 35,327 $ 134 $ 35,461 $ 853,428
ResearchBoard
NonmajorCommonwealth
Health
Permanent FundsBehavioral
HealthGovernmental
Total
FundsTotalFundsEndowment

Commonwealth of Virginia 211

212 Commonwealth of Virginia
Schedule of Revenues, Expenditures, and Changes in Fund Balance –Budget and Actual – Nonmajor Special Revenue FundsFor the Fiscal Year Ended June 30, 2016(Dollars in Thousands)
Revenues:Taxes: Motor Fuel $ - $ - $ - $ - Deeds, Contracts, Suits - - - - Alcoholic Beverage Sales - - - - Tobacco Products - - - - Public Service Corporations 5,819 5,819 4,735 (1,084) Other Taxes - - - -Rights and Privileges 143,386 141,905 141,964 59Sales of Property and Commodities 207 - 6,346 6,346Assessments and Receipts for Support of Special Services - - - -Institutional Revenue 198,327 208,467 215,015 6,548Interest, Dividends, and Rents 120 134 614 480Fines, Forfeitures, Court Fees, Penalties, and Escheats 384 1,225 2,857 1,632Receipts from Cities, Counties, and Tow ns 57,041 59,311 58,818 (493)Private Donations, Gifts and Contracts 3,599 3,609 2,937 (672)Other 33,481 32,986 35,562 2,576 Total Revenues 442,364 453,456 468,848 15,392
Expenditures: Current: General Government 280 280 13 267 Education 1,020 1,020 136 884 Transportation - - - - Resources and Economic Development 34,788 37,674 36,415 1,259 Individual and Family Services 463,220 472,031 394,802 77,229 Administration of Justice 408 509 483 26Capital Outlay 2,550 2,550 3 2,547 Total Expenditures 502,266 514,064 431,852 82,212 Revenues Over (Under) Expenditures (59,902) (60,608) 36,996 97,604
Other Financing Sources (Uses):Transfers: Transfers In 225 225 1,425 1,200 Transfers Out (20,870) (20,870) (24,015) (3,145) Total Other Financing Sources (Uses) (20,645) (20,645) (22,590) (1,945) Revenues and Other Sources Over (Under) Expenditures and Other Uses (80,547) (81,253) 14,406 95,659Fund Balance, July 1, as restated 146,839 146,839 146,839 -
Fund Balance, June 30 $ 66,292 $ 65,586 $ 161,245 $ 95,659
FinalBudget
Original Budget
Health and Social Services
Actual (Negative)Positive
Final/ActualVariance
See Notes on page 214 in this section.

Commonwealth of Virginia 213
$ 32,951 $ 34,198 $ 33,630 $ (568)549 549 577 28854 868 782 (86)83 83 106 23
10,512 10,639 9,981 (658)26,418 27,632 29,201 1,569
193,124 194,797 181,900 (12,897)8,132 4,633 12,188 7,555
118,465 117,965 117,959 (6)19,379 18,903 19,949 1,04611,464 11,620 13,228 1,60832,170 42,890 50,431 7,5411,248 1,244 1,213 (31)
897 1,319 3,144 1,82561,510 125,499 139,256 13,757
517,756 592,839 613,545 20,706
80,445 167,807 152,465 15,34225,367 26,601 24,032 2,5698,019 8,054 7,299 755
324,810 336,839 306,742 30,09772,165 73,648 69,306 4,34279,716 85,783 67,747 18,03618,446 22,008 4,807 17,201
608,968 720,740 632,398 88,342(91,212) (127,901) (18,853) 109,048
15,055 17,882 40,440 22,558(18,333) (20,491) (26,864) (6,373)(3,278) (2,609) 13,576 16,185
(94,490) (130,510) (5,277) 125,233583,263 583,263 583,263 -
$ 488,773 $ 452,753 $ 577,986 $ 125,233
Positive
Other
Final/ActualVariance
Actual (Negative)Final
Budget BudgetOriginal

214 Commonwealth of Virginia
Notes for Schedule of Revenues, Expenditures, and Changes in Fund Balance –Budget and Actual – Nonmajor Special Revenue Funds
1. Basis of Budgeting vs. Modified Accrual Basis Fund Balance (1)
Since the presentation of financial data on the basis of budgeting differs from that presented under accounting principles generally accepted in the United States of America, a schedule reconciling the fund balance on a budgetary basis at June 30, 2016, to the fund balance on a modified accrual basis follows.
(Dollars in Thousands)
Fund Balance, Basis of Budgeting $ 161,245 $ 577,986
Adjustments from Budget to Modif ied Accrual: Accrued Revenues: Taxes - 5,983 Other Revenue/Transfers 16,521 9,017 Accrued Expenditures/Transfers 5,986 (21,552) Fund Reclassif ication - Budget to Modif ied Accrual 994 415Fund Balance, Modif ied Accrual Basis $ 184,746 $ 571,849
Health and Social
Services Other
2. Appropriations
The amounts presented in the Schedule of Revenues, Expenditures, and Changes in Fund Balance – Budget and Actual –Nonmajor Special Revenue Funds are principally on a cash basis and represent the original budget adopted by the General Assembly and all supplemental appropriations and transfers. The following schedule reconciles original appropriations to the final adjusted expenditure appropriations for the Nonmajor Special Revenue Funds, at June 30, 2016.
(Dollars in Thousands)
Appropriations (1) $ 502,266 $ 608,968Supplemental Appropriations:
Reappropriations (2) 2,550 47,910Subsequent Executive (3) 7,241 84,889Subsequent Legislative (4) 5,292 22,103Capital Outlay Reversions (5) - (287)Transfers (6) (735) 2,204
Capital Outlay Adjustment (7) (2,550) (45,047)Appropriations, as adjusted $ 514,064 $ 720,740
Other
Health and
ServicesSocial
1. Represents the budget appropriated through Chapter 665, 2015 Acts of Assembly, as amended by Chapter 732, 2016 Acts of Assembly.2. Actions taken to reappropriate any prior year unexpended balances per authority of the language in the Appropriation Act.3. Actions taken by the Governor to appropriate any additional revenues collected so that they can be legally spent.4. Actions taken by the Governor and the General Assembly to adjust the budget.5. Represents reversions of unexpended capital outlay balances.6. Represents transfers required by the Appropriation Act.7. Capital outlay appropriations cover the projects' lives and usually extend beyond the current fiscal year. These amounts have been adjusted
to report the amount authorized for expenditure during the current fiscal year.

Commonwealth of Virginia 215
Nonmajor Enterprise Funds
The Enterprise Funds account for operations that are financed and operated in a manner similar to private business enterprises. It is the intent that the cost of providing such goods or services will be recovered through user charges.
Department of Alcoholic Beverage Control operates facilities for the distribution and sale of distilled spirits and wine.
Risk Management accounts for pooled resources received and used by the Department of the Treasury for financing local government insurance programs. This includes Local Entities Bond Insurance, Public Officials Insurance and Law Enforcement Insurance.
Local Choice Health Care administers a health care plan for the employees of participating local governments.
Route 460 Funding Corporation of Virginia (Corporation)accounted for the development, design, construction, financing, maintenance, tolling and operation of the Route 460 Corridor Improvements Project. The Corporation was ablended component unit of the Department of Transportation (Primary Government). The planned collection of tolls upon project completion served as the security for the outstanding debt issued to construct the facility. The Corporation’s continued operations ceased during fiscal year 2016.
Virginia Industries for the Blind manufactures products for sale to governments, certain private organizations, and the general public.
Consolidated Laboratory provides water testing services and a newborn screening program.
eVA Procurement System accounts for the statewide electronic procurement system.
Department of Environmental Quality accounts for the Title V program that offers services to the general public.
Wireless E-911 Service Board assists in the establishment of wireless E-911 service in Virginia localities.
Virginia Museum of Fine Arts accounts for gift shop and food service activities.
Science Museum of Virginia accounts for gift shop activities.
Behavioral Health Local Funds account for the canteen store and work activity programs.
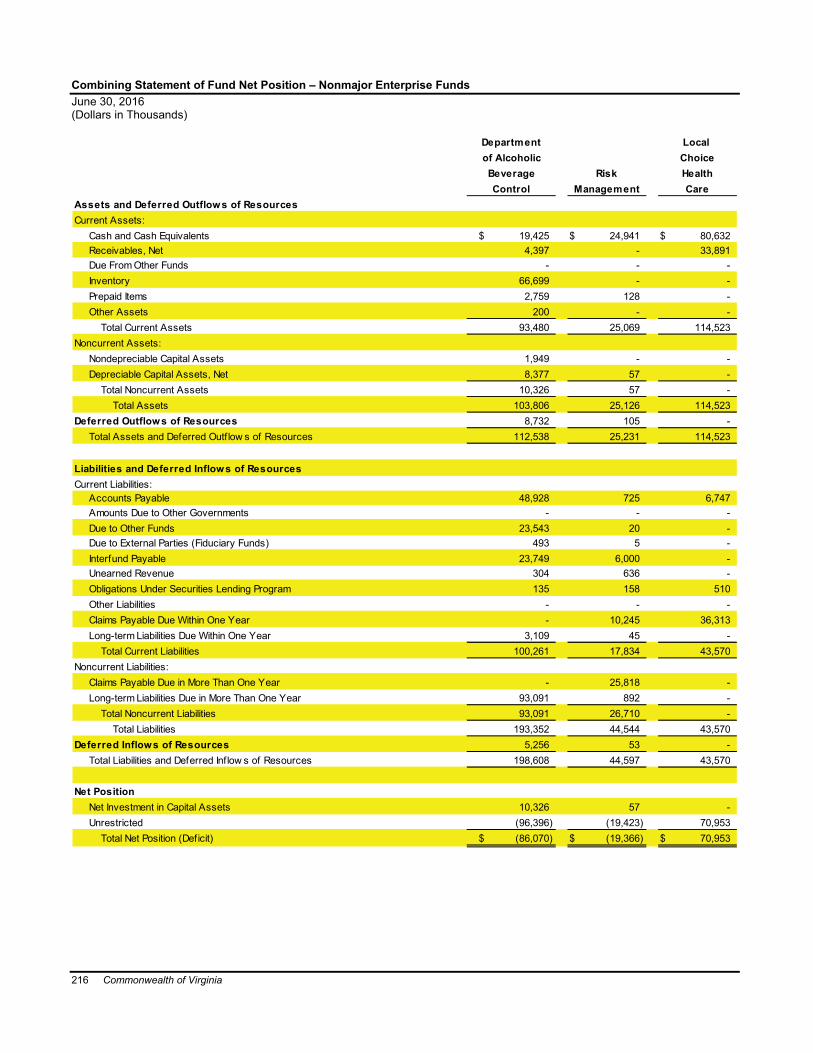
216 Commonwealth of Virginia
Combining Statement of Fund Net Position – Nonmajor Enterprise FundsJune 30, 2016(Dollars in Thousands)
Assets and Deferred Outflows of ResourcesCurrent Assets:
Cash and Cash Equivalents $ 19,425 $ 24,941 $ 80,632Receivables, Net 4,397 - 33,891Due From Other Funds - - -Inventory 66,699 - -Prepaid Items 2,759 128 -Other Assets 200 - -
Total Current Assets 93,480 25,069 114,523Noncurrent Assets:
Nondepreciable Capital Assets 1,949 - -Depreciable Capital Assets, Net 8,377 57 -
Total Noncurrent Assets 10,326 57 -Total Assets 103,806 25,126 114,523
Deferred Outflows of Resources 8,732 105 -Total Assets and Deferred Outf low s of Resources 112,538 25,231 114,523
Liabilities and Deferred Inflows of ResourcesCurrent Liabilities:
Accounts Payable 48,928 725 6,747Amounts Due to Other Governments - - -Due to Other Funds 23,543 20 -Due to External Parties (Fiduciary Funds) 493 5 -Interfund Payable 23,749 6,000 -Unearned Revenue 304 636 -Obligations Under Securities Lending Program 135 158 510Other Liabilities - - -Claims Payable Due Within One Year - 10,245 36,313Long-term Liabilities Due Within One Year 3,109 45 -
Total Current Liabilities 100,261 17,834 43,570Noncurrent Liabilities:
Claims Payable Due in More Than One Year - 25,818 -Long-term Liabilities Due in More Than One Year 93,091 892 -
Total Noncurrent Liabilities 93,091 26,710 -Total Liabilities 193,352 44,544 43,570
Deferred Inflows of Resources 5,256 53 -Total Liabilities and Deferred Inflow s of Resources 198,608 44,597 43,570
Net PositionNet Investment in Capital Assets 10,326 57 -Unrestricted (96,396) (19,423) 70,953
Total Net Position (Deficit) $ (86,070) $ (19,366) $ 70,953
RiskManagement
Departmentof AlcoholicBeverageControl
ChoiceLocal
HealthCare

Commonwealth of Virginia 217
$ - $ 8,363 $ 3,686 $ 6,066 $ 2,374 $ 17,728 $ 1,506- 2,306 252 5,714 - 4,924 136- 100 53 655 - - -- 4,627 263 - - - 599- 523 - - - - -- 3 - - - - 6- 15,922 4,254 12,435 2,374 22,652 2,247
- 1,441 127 - - - -- 9,544 1,098 - - - -- 10,985 1,225 - - - -- 26,907 5,479 12,435 2,374 22,652 2,247- 409 395 431 1,211 156 164- 27,316 5,874 12,866 3,585 22,808 2,411
- 2,365 517 2,919 385 5,755 325- - - - - 2,297 -- 87 395 392 552 18 11- 28 27 21 55 10 11- - - - - - -- - 1,802 - - - -- - - - 15 112 -- - - - - - 95- - - - - - -- 177 193 149 535 79 -- 2,657 2,934 3,481 1,542 8,271 442
- - - - - - -- 4,200 4,543 5,906 10,237 1,937 1,855- 4,200 4,543 5,906 10,237 1,937 1,855- 6,857 7,477 9,387 11,779 10,208 2,297- 236 351 383 614 174 109- 7,093 7,828 9,770 12,393 10,382 2,406
- 10,985 1,225 - - - -- 9,238 (3,179) 3,096 (8,808) 12,426 5
$ - $ 20,223 $ (1,954) $ 3,096 $ (8,808) $ 12,426 $ 5
SystemProcurement
LaboratoryConsolidated
of VirginiaCorporation
FundingRoute 460
Fine Arts
Virginia
Blindfor the
QualityEnvironmental
ofeVAVirginia
IndustriesDepartment Wireless
E-911Service Board
Museumof
Continued on next page
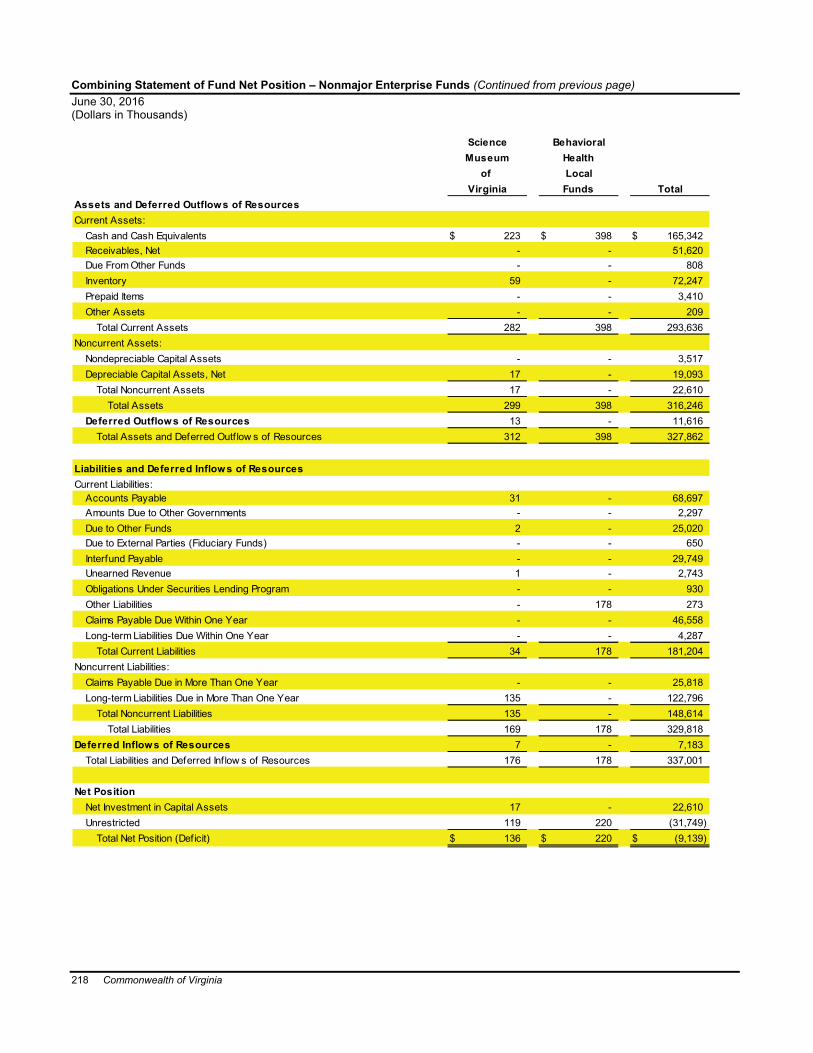
218 Commonwealth of Virginia
Combining Statement of Fund Net Position – Nonmajor Enterprise Funds (Continued from previous page)June 30, 2016(Dollars in Thousands)
Assets and Deferred Outflows of ResourcesCurrent Assets:
Cash and Cash Equivalents $ 223 $ 398 $ 165,342Receivables, Net - - 51,620Due From Other Funds - - 808Inventory 59 - 72,247Prepaid Items - - 3,410Other Assets - - 209
Total Current Assets 282 398 293,636Noncurrent Assets:
Nondepreciable Capital Assets - - 3,517Depreciable Capital Assets, Net 17 - 19,093
Total Noncurrent Assets 17 - 22,610Total Assets 299 398 316,246
Deferred Outflows of Resources 13 - 11,616Total Assets and Deferred Outf low s of Resources 312 398 327,862
Liabilities and Deferred Inflows of ResourcesCurrent Liabilities:
Accounts Payable 31 - 68,697Amounts Due to Other Governments - - 2,297Due to Other Funds 2 - 25,020Due to External Parties (Fiduciary Funds) - - 650Interfund Payable - - 29,749Unearned Revenue 1 - 2,743Obligations Under Securities Lending Program - - 930Other Liabilities - 178 273Claims Payable Due Within One Year - - 46,558Long-term Liabilities Due Within One Year - - 4,287
Total Current Liabilities 34 178 181,204Noncurrent Liabilities:
Claims Payable Due in More Than One Year - - 25,818Long-term Liabilities Due in More Than One Year 135 - 122,796
Total Noncurrent Liabilities 135 - 148,614Total Liabilities 169 178 329,818
Deferred Inflows of Resources 7 - 7,183Total Liabilities and Deferred Inflow s of Resources 176 178 337,001
Net PositionNet Investment in Capital Assets 17 - 22,610Unrestricted 119 220 (31,749)
Total Net Position (Deficit) $ 136 $ 220 $ (9,139)
TotalLocalHealthMuseum
of
BehavioralScience
FundsVirginia

Commonwealth of Virginia 219

220 Commonwealth of Virginia
Combining Statement of Revenues, Expenses, and Changes in Fund Net Position –Nonmajor Enterprise FundsFor the Fiscal Year Ended June 30, 2016(Dollars in Thousands)
Operating RevenuesCharges for Sales and Services $ 752,079 $ 8,587 $ 392,137Interest, Dividends, Rents, and Other Investment Income - - -Other 19,522 - -
Total Operating Revenues 771,601 8,587 392,137Operating Expenses
Cost of Sales and Services 433,457 - -Prizes and Claims - 13,009 386,227Personal Services 104,617 737 -Contractual Services 31,189 455 23,157Supplies and Materials 3,273 4 -Depreciation 2,580 8 -Rent, Insurance, and Other Related Charges 29,279 64 -Non-recurring Cost Estimate Payments to Providers - - -Other 3,690 2 2,265
Total Operating Expenses 608,085 14,279 411,649Operating Income (Loss) 163,516 (5,692) (19,512)
Nonoperating Revenues (Expenses)Interest, Dividends, Rents, and Other Investment Income 102 149 647Other 9,159 (2) (6)
Total Nonoperating Revenues (Expenses) 9,261 147 641
Income (Loss) Before Transfers 172,777 (5,545) (18,871)Transfers In 98 - 250Transfers Out (174,184) - -
Change in Net Position (1,309) (5,545) (18,621)Total Net Position (Deficit), July 1 (84,761) (13,821) 89,574Total Net Position (Deficit), June 30 $ (86,070) $ (19,366) $ 70,953
Department
Control
of Alcoholic ChoiceBeverage Risk Health
Local
Management Care

Commonwealth of Virginia 221
$ - $ 42,036 $ 9,484 $ 21,169 $ 10,631 $ 58,031 $ 6,355- 2 - - - - -- - - - - - 10- 42,038 9,484 21,169 10,631 58,031 6,365
- - - - - - 2,327- - - - - - -- 7,499 4,266 3,983 9,544 1,426 3,188- 1,345 1,328 16,671 830 490 669- 30,105 3,229 1 102 21 100- 395 331 31 - - -- 2,301 810 1,872 659 40 -- - - - - 39,866 -
436 215 52 20 - 8 -436 41,860 10,016 22,578 11,135 41,851 6,284
(436) 178 (532) (1,409) (504) 16,180 81
200 - - - - 101 -(1,025) (6) (123) - - (1) -
(825) (6) (123) - - 100 -
(1,261) 172 (655) (1,409) (504) 16,280 81- - - - - - -- - (1,153) - - (13,450) (255)
(1,261) 172 (1,808) (1,409) (504) 2,830 (174)1,261 20,051 (146) 4,505 (8,304) 9,596 179
$ - $ 20,223 $ (1,954) $ 3,096 $ (8,808) $ 12,426 $ 5
for the Procurement Environmental Service eVA
ofMuseum
Department Wireless Virginia
Board
E-911
Fine ArtsBlindof VirginiaCorporation
System Quality
ofConsolidatedLaboratory
Route 460Funding
VirginiaIndustries
Continued on next page

222 Commonwealth of Virginia
Combining Statement of Revenues, Expenses, and Changes in Fund Net Position –Nonmajor Enterprise Funds (Continued from previous page)For the Fiscal Year Ended June 30, 2016(Dollars in Thousands)
Operating RevenuesCharges for Sales and Services $ 409 $ 437 $ 1,301,355Interest, Dividends, Rents, and Other Investment Income - - 2Other - - 19,532
Total Operating Revenues 409 437 1,320,889Operating Expenses
Cost of Sales and Services 186 451 436,421Prizes and Claims - - 399,236Personal Services 172 - 135,432Contractual Services 7 - 76,141Supplies and Materials 4 - 36,839Depreciation 7 - 3,352Rent, Insurance, and Other Related Charges - - 35,025Non-recurring Cost Estimate Payments to Providers - - 39,866Other 16 - 6,704
Total Operating Expenses 392 451 1,169,016Operating Income (Loss) 17 (14) 151,873
Nonoperating Revenues (Expenses)Interest, Dividends, Rents, and Other Investment Income - - 1,199Other 17 - 8,013
Total Nonoperating Revenues (Expenses) 17 - 9,212
Income (Loss) Before Transfers 34 (14) 161,085Transfers In - - 348Transfers Out (15) (20) (189,077)
Change in Net Position 19 (34) (27,644)Total Net Position (Deficit), July 1 117 254 18,505Total Net Position (Deficit), June 30 $ 136 $ 220 $ (9,139)
ScienceMuseum
Virginia
Behavioral
of FundsLocal
Total
Health

Commonwealth of Virginia 223

224 Commonwealth of Virginia
Combining Statement of Cash Flows – Nonmajor Enterprise FundsFor the Fiscal Year Ended June 30, 2016(Dollars in Thousands)
Cash Flows from Operating ActivitiesReceipts for Sales and Services $ 766,095 $ 8,589 $ 391,357Internal Activity-Receipts from Other Funds - - -Internal Activity-Payments to Other Funds - - -Payments to Suppliers for Goods and Services (453,545) - -Payments for Contractual Services (31,189) (500) (22,953)Payments for Prizes, Claims, and Loss Control - (5,988) (379,376)Payments to Employees (104,552) (863) -Payments to Providers for Non-recurring Cost Estimates - - -Other Operating Revenue 5,719 - -Other Operating Expense - - (2,265)
Net Cash Provided by (Used for) Operating Activities 182,528 1,238 (13,237)
Cash Flows from Noncapital Financing ActivitiesTransfers In from Other Funds 98 - 250Transfers Out to Other Funds (381,046) - -Other Noncapital Financing Receipt Activities 249,145 - -Other Noncapital Financing Disbursement Activities (31,289) - -
Net Cash Provided by (Used for) Noncapital Financing Activities (163,092) - 250
Cash Flows from Capital and Related Financing ActivitiesAcquisition of Capital Assets (1,285) - -Payment of Principal and Interest on Bonds and Notes - - -Proceeds from Sale of Capital Assets 2 - -Other Capital and Related Financing Receipt Activities 68 - -Other Capital and Related Financing Disbursement Activities (3) - -
Net Cash Used for Capital and Related Financing Activities (1,218) - -
Cash Flows from Investing ActivitiesProceeds from Sales or Maturities of Investments - - -Investment Income on Cash, Cash Equivalents, and Investments - 146 641
Net Cash Provided by Investing Activities - 146 641
Net Increase (Decrease) in Cash and Cash Equivalents 18,218 1,384 (12,346)
Cash and Cash Equivalents, July 1 1,272 23,399 92,468Cash and Cash Equivalents, June 30 $ 19,490 $ 24,783 $ 80,122
Reconciliation of Cash and Cash Equivalents Per the Statement of Net Position: Cash and Cash Equivalents $ 19,425 $ 24,941 $ 80,632 Cash and Travel Advances 200 - - Less: Securities Lending Cash Equivalents (135) (158) (510) Cash and Cash Equivalents per the Statement of Cash Flow s $ 19,490 $ 24,783 $ 80,122
Department Local of Alcoholic
Control Management CareBeverage Risk Health
Choice

Commonwealth of Virginia 225
$ - $ 38,039 $ 10,202 $ 15,472 $ 10,630 $ 57,953 $ 6,275- 4,645 - 4,803 - - -- - (872) (1,919) - (189) -- (32,111) (3,443) (50) (97) (30) (2,462)
(489) (1,361) (1,044) (15,302) (865) (417) (669)- - - - - - -- (7,388) (4,216) (4,180) (9,431) (1,438) (3,130)- - - - - (40,853) -- 2 - - - - -- (1,486) - - (705) - -
(489) 340 627 (1,176) (468) 15,026 14
- - - - - - -- - (1,153) - - (13,450) (255)- - - - - - -- - - - - - -
- - (1,153) - - (13,450) (255)
- (257) (84) - - - -(326,124) - - - - - -
- - - - - - -165,794 - - - - - -
(727) - - - - - -
(161,057) (257) (84) - - - -
25,623 - - - - - -352 - - - - 100 -
25,975 - - - - 100 -
(135,571) 83 (610) (1,176) (468) 1,676 (241)135,571 8,283 4,296 7,242 2,827 15,940 1,753
$ - $ 8,366 $ 3,686 $ 6,066 $ 2,359 $ 17,616 $ 1,512
$ - $ 8,363 $ 3,686 $ 6,066 $ 2,374 $ 17,728 $ 1,506- 3 - - - - 6
- - - - (15) (112) -$ - $ 8,366 $ 3,686 $ 6,066 $ 2,359 $ 17,616 $ 1,512
Blind System Fine ArtsBoardfor the Procurement
MuseumEnvironmental
eVARoute 460 VirginiaDepartment WirelessVirginia
of VirginiaCorporation
FundingService of
E-911IndustriesConsolidatedLaboratory Quality
of
Continued on next page

226 Commonwealth of Virginia
Combining Statement of Cash Flows – Nonmajor Enterprise Funds (Continued from previous page)For the Fiscal Year Ended June 30, 2016(Dollars in Thousands)
Cash Flows from Operating ActivitiesReceipts for Sales and Services $ 409 $ 437 $ 1,305,458Internal Activity-Receipts from Other Funds - - 9,448Internal Activity-Payments to Other Funds - - (2,980)Payments to Suppliers for Goods and Services (186) (451) (492,375)Payments for Contractual Services - - (74,789)Payments for Prizes, Claims, and Loss Control - - (385,364)Payments to Employees (136) - (135,334)Payments to Providers for Non-recurring Cost Estimates - - (40,853)Other Operating Revenue - - 5,721Other Operating Expense (54) - (4,510)
Net Cash Provided by (Used for) Operating Activities 33 (14) 184,422
Cash Flows from Noncapital Financing ActivitiesTransfers In from Other Funds - - 348Transfers Out to Other Funds (15) (20) (395,939)Other Noncapital Financing Receipt Activities - - 249,145Other Noncapital Financing Disbursement Activities - - (31,289)
Net Cash Provided by (Used for) Noncapital Financing Activities (15) (20) (177,735)
Cash Flows from Capital and Related Financing ActivitiesAcquisition of Capital Assets - - (1,626)Payment of Principal and Interest on Bonds and Notes - - (326,124)Proceeds from Sale of Capital Assets - - 2Other Capital and Related Financing Receipt Activities - - 165,862Other Capital and Related Financing Disbursement Activities - - (730)
Net Cash Used for Capital and Related Financing Activities - - (162,616)
Cash Flows from Investing ActivitiesProceeds from Sales or Maturities of Investments - - 25,623Investment Income on Cash, Cash Equivalents, and Investments - - 1,239
Net Cash Provided by Investing Activities - - 26,862
Net Increase (Decrease) in Cash and Cash Equivalents 18 (34) (129,067)
Cash and Cash Equivalents, July 1 205 432 293,688Cash and Cash Equivalents, June 30 $ 223 $ 398 $ 164,621
Reconciliation of Cash and Cash Equivalents Per the Statement of Net Position: Cash and Cash Equivalents $ 223 $ 398 $ 165,342 Cash and Travel Advances - - 209 Less: Securities Lending Cash Equivalents - - (930) Cash and Cash Equivalents per the Statement of Cash Flow s $ 223 $ 398 $ 164,621
Virginia
HealthMuseumBehavioralScience
Totalof
FundsLocal

Commonwealth of Virginia 227
Reconciliation of Operating Income To Net Cash Provided by (Used for) Operating Activities:Operating Income (Loss) $ 163,516 $ (5,692) $ (19,512)Adjustments to Reconcile Operating Income to Net Cash Provided by (Used for) Operating Activities:Depreciation 2,580 8 -Miscellaneous Nonoperating Income 248 - -Other - - -Change in Assets, Deferred Outf low s of Resources, Liabilities, and Deferred Inflow s of Resources
(Increase) Decrease in Accounts Receivable (36) - (780)(Increase) Decrease in Due from Other Funds - - -(Increase) Decrease in Inventory (5,134) - -(Increase) Decrease in Prepaid Items (1,712) (128) -(Increase) Decrease in Deferred Outf low s of Resources (1,460) (16) -Increase (Decrease) in Accounts Payable 19,858 243 2,581Increase (Decrease) in Amounts Due to Other Governments - - -Increase (Decrease) in Due to Other Funds 9,548 (5) -Increase (Decrease) in Due to External Parties (Fiduciary Funds) 71 (3) -Increase (Decrease) in Interfund Payables (7,316) - -Increase (Decrease) in Unearned Revenue 2 2 -Increase (Decrease) in Other Liabilities - - -Increase (Decrease) in Claims Payable: Due Within One Year - 2,816 4,474Increase (Decrease) in Claims Payable: Due in More Than One Year - 3,975 -Increase (Decrease) in Long-term Liabilities: Due Within One Year 277 4 -Increase (Decrease) in Long-term Liabilities: Due in More Than One Year 8,351 96 -Increase (Decrease) in Deferred Inflow s of Resources (6,265) (62) -
Net Cash Provided by (Used for) Operating Activities $ 182,528 $ 1,238 $ (13,237)
CareManagementControlBeverage Risk Health
of Alcoholic ChoiceDepartment Local
Continued on next page

228 Commonwealth of Virginia
Combining Statement of Cash Flows – Nonmajor Enterprise Funds (Continued from previous page)For the Fiscal Year Ended June 30, 2016(Dollars in Thousands)
Reconciliation of Operating Income To Net Cash Provided by (Used for) Operating Activities:Operating Income (Loss) $ (436) $ 178 $ (532)Adjustments to Reconcile Operating Income to Net Cash Provided by (Used for) Operating Activities:Depreciation - 395 331Miscellaneous Nonoperating Income - - -Other - 116 -Change in Assets, Deferred Outf low s of Resources, Liabilities, and Deferred Inflow s of Resources
(Increase) Decrease in Accounts Receivable - 789 (93)(Increase) Decrease in Due from Other Funds - - 54(Increase) Decrease in Inventory - (949) (180)(Increase) Decrease in Prepaid Items 57 - -(Increase) Decrease in Deferred Outf low s of Resources - (148) (103)Increase (Decrease) in Accounts Payable (110) (165) 102Increase (Decrease) in Amounts Due to Other Governments - - -Increase (Decrease) in Due to Other Funds - (96) 101Increase (Decrease) in Due to External Parties (Fiduciary Funds) - 6 5Increase (Decrease) in Interfund Payables - - -Increase (Decrease) in Unearned Revenue - - 813Increase (Decrease) in Other Liabilities - - -Increase (Decrease) in Claims Payable: Due Within One Year - - -Increase (Decrease) in Claims Payable: Due in More Than One Year - - -Increase (Decrease) in Long-term Liabilities: Due Within One Year - 8 12Increase (Decrease) in Long-term Liabilities: Due in More Than One Year - 507 386(Increase) Decrease in Deferred Inflow s of Resources - (301) (269)
Net Cash Provided by (Used for) Operating Activities $ (489) $ 340 $ 627
Laboratoryof Virginia Blind
IndustriesConsolidatedCorporation for the
FundingRoute 460 Virginia

Commonwealth of Virginia 229
$ (1,409) $ (504) $ 16,180 $ 81 $ 17 $ (14) $ 151,873
31 - - - 7 - 3,352- - - - - - 248- - 2 - - - 118
(773) - (79) (47) - - (1,019)(130) - - - 2 - (74)
- - - (55) 3 - (6,315)- - - - 1 - (1,782)
(38) (154) (28) (51) (3) - (2,001)1,270 40 (1,087) 52 24 - 22,808
- - 12 - - - 12(10) (237) 1 - (7) - 9,295(3) 8 1 2 - - 87- - - - - - (7,316)- (1) - - - - 816- - - (43) - - (43)- - - - - - 7,290- - - - - - 3,975
(51) 11 14 - - - 275387 1,098 106 208 (1) - 11,138
(450) (729) (96) (133) (10) - (8,315)$ (1,176) $ (468) $ 15,026 $ 14 $ 33 $ (14) $ 184,422
TotalBoardSystem VirginiaQuality Fine Arts FundsService LocalProcurement
eVA of MuseumofEnvironmental
VirginiaWirelessDepartment Science BehavioralE-911 Museum
of Health

230 Commonwealth of Virginia

Commonwealth of Virginia 231
Internal Service Funds
Internal Service Funds account for the operations of state agencies that render services to other state agencies, institutions, or other governmental units of the Commonwealth on a cost-reimbursement basis.
Virginia Information Technologies Agency accounts for the installation and maintenance of the state government's telephone system; the development, use and maintenance of the Commonwealth's data processing systems; and the development of automated systems.
Enterprise Application Fund accounts for the development and operation of the Commonwealth’s Performance Budgeting System, Cardinal System, and Payroll SystemReplacement Project. Funding is derived from charges to agencies for the ongoing costs of the Commonwealth's enterprise applications, including recovery of the development and implementation costs initially funded through working capital advances.
Virginia Correctional Enterprises accounts for the manufacturing activities of the Commonwealth’s correctional facilities.
Health Care accounts for the health insurance programs provided to state employees and for retirees who are not yet eligible to participate in Medicare.
Fleet Management accounts for the Commonwealth's motor vehicle pool.
Property Management accounts for real estate services, non-routine facility maintenance, and the disposal of state-owned property.
Risk Management accounts for the insurance programs provided to state agencies and institutions.
General Services accounts for a variety of services, including the purchase of supplies, the sale of surplus property, water testing, graphic design and engineering.
Payroll Service Bureau accounts for the payroll and leave accounting services provided to state agencies and institutions.

232 Commonwealth of Virginia
Combining Statement of Fund Net Position – Internal Service FundsJune 30, 2016(Dollars in Thousands)
Assets and Deferred Outflows of ResourcesCurrent Assets:Cash and Cash Equivalents $ 74,144 $ 2,142 $ 9,624Receivables, Net 2,043 - 3,140Due From Other Funds 14,985 - 1,410Due From External Parties (Fiduciary Funds) 39 - -Due From Component Units - - -Inventory - - 14,706Prepaid Items 2,798 3 -Other Assets 11,945 - 1,109Total Current Assets 105,954 2,145 29,989
Noncurrent Assets:Nondepreciable Capital Assets 1,764 64,566 376Depreciable Capital Assets, Net 12,625 7,074 7,786Total Noncurrent Assets 14,389 71,640 8,162 Total Assets 120,343 73,785 38,151
Deferred Outflows of Resources 1,925 586 1,252Total Assets and Deferred Outf low s of Resources 122,268 74,371 39,403
Liabilities and Deferred Inflows of Resources Current Liabilities:Accounts Payable 58,050 2,251 4,705Amounts Due to Other Governments - - -Due to Other Funds 69 41 359Due to External Parties (Fiduciary Funds) 125 21 85Interfund Payable 26,000 7,863 -Unearned Revenue 43,292 - 848Obligations Under Securities Lending Program - - -Other Liabilities - - 1Claims Payable Due Within One Year - - -Long-term Liabilities Due w ithin One Year 860 171 148Total Current Liabilities 128,396 10,347 6,146
Noncurrent Liabilities:Interfund Payable - 68,534 -Claims Payable Due In More Than One Year - - -Long-term Liabilities Due in More Than One Year 29,066 3,216 15,630Total Noncurrent Liabilities 29,066 71,750 15,630 Total Liabilities 157,462 82,097 21,776
Deferred Inflows of Resources 2,157 190 1,383Total Liabilities and Deferred Inflow s of Resources 159,619 82,287 23,159
Net PositionNet Investment in Capital Assets 14,389 71,640 8,014Unrestricted (51,740) (79,556) 8,230Total Net Position (Deficit) $ (37,351) $ (7,916) $ 16,244
InformationVirginia
Virginia
AgencyTechnologies Correctional
EnterprisesEnterpriseApplication

Commonwealth of Virginia 233
$ 114,986 $ 3,555 $ 33,550 $ 197,464 $ 7,502 $ 105 $ 443,0722,700 513 150 211 920 - 9,677
28,128 2,198 2,431 10 1,808 - 50,97013,848 - - - - - 13,88718,715 - - - - - 18,715
- 33 294 - 3,694 - 18,727- - 359 90 - 132 3,382- - - - - - 13,054
178,377 6,299 36,784 197,775 13,924 237 571,484
- - 1,499 - 150 - 68,355- 38,610 15,752 72 4,497 84 86,500- 38,610 17,251 72 4,647 84 154,855
178,377 44,909 54,035 197,847 18,571 321 726,339- 114 1,180 257 735 446 6,495
178,377 45,023 55,215 198,104 19,306 767 732,834
29,041 1,031 2,608 1,681 2,570 92 102,029- - 981 - - - 981- 83 834 24 495 9 1,914- 8 77 13 48 14 391- - 419 - 397 - 34,679- - 22,047 49,979 106 - 116,272
727 - - 1,235 - - 1,962- - 383 - 49 - 433
123,385 - - 74,984 - - 198,369- 3,209 3,894 77 395 96 8,850
153,153 4,331 31,243 127,993 4,060 211 465,880
- - 1,812 - - - 70,346- - - 760,299 - - 760,299- 17,430 42,668 2,269 9,088 2,805 122,172- 17,430 44,480 762,568 9,088 2,805 952,817
153,153 21,761 75,723 890,561 13,148 3,016 1,418,697- 102 1,046 145 652 145 5,820
153,153 21,863 76,769 890,706 13,800 3,161 1,424,517
- 19,522 (1,505) 72 4,647 84 116,86325,224 3,638 (20,049) (692,674) 859 (2,478) (808,546)
$ 25,224 $ 23,160 $ (21,554) $ (692,602) $ 5,506 $ (2,394) $ (691,683)
ManagementFleet RiskProperty
Health Care Management Management TotalGeneralServices
PayrollServiceBureau

234 Commonwealth of Virginia
Combining Statement of Revenues, Expenses, and Changes in Fund Net Position –Internal Service FundsFor the Fiscal Year Ended June 30, 2016(Dollars in Thousands)
Operating RevenuesCharges for Sales and Services $ 352,932 $ 19,957 $ 53,467Other - 43 -Total Operating Revenues 352,932 20,000 53,467
Operating ExpensesCost of Sales and Services - - 38,063Prizes and Claims - - -Personal Services 19,855 2,419 5,899Contractual Services 326,492 19,119 2,912Supplies and Materials 52 15 516Depreciation 4,013 1,297 1,220Rent, Insurance, and Other Related Charges 3,147 285 874Interest Expense - 8 -Other 134 52 47Total Operating Expenses 353,693 23,195 49,531Operating Income (Loss) (761) (3,195) 3,936
Nonoperating Revenues (Expenses)Interest, Dividends, Rents, and Other Investment Income - - -Other - - (51)Total Nonoperating Revenues (Expenses) - - (51)
Income (Loss) Before Transfers (761) (3,195) 3,885Transfers In 108 - 38Transfers Out - (27) (1,000)
Change in Net Position (653) (3,222) 2,923Total Net Position (Deficit), July 1 (36,698) (4,694) 13,321Total Net Position (Deficit), June 30 $ (37,351) $ (7,916) $ 16,244
Agency
VirginiaCorrectionalEnterprises
EnterpriseApplication
VirginiaInformation
Technologies

Commonwealth of Virginia 235
$ 1,351,266 $ 16,608 $ 106,326 $ 109,463 $ 40,287 $ 2,230 $ 2,052,536- - - - - - 43
1,351,266 16,608 106,326 109,463 40,287 2,230 2,052,579
- - - - 25,772 - 63,8351,322,568 - - 258,684 - - 1,581,252
- 1,111 11,505 1,961 7,224 2,235 52,20978,249 3,453 15,016 10,327 3,392 48 459,008
- 2,713 2,701 7 1,797 8 7,809- 7,438 2,191 13 864 4 17,040- 1,074 66,725 2,262 1,754 147 76,268- - 11 - - - 19
7,315 85 2,361 7,830 194 8 18,0261,408,132 15,874 100,510 281,084 40,997 2,450 2,275,466
(56,866) 734 5,816 (171,621) (710) (220) (222,887)
1,242 - - 1,260 114 - 2,616(11) 321 (1,590) 4 - - (1,327)
1,231 321 (1,590) 1,264 114 - 1,289
(55,635) 1,055 4,226 (170,357) (596) (220) (221,598)75 - 15 - 388 - 624
(750) - - (859) - - (2,636)(56,310) 1,055 4,241 (171,216) (208) (220) (223,610)81,534 22,105 (25,795) (521,386) 5,714 (2,174) (468,073)
$ 25,224 $ 23,160 $ (21,554) $ (692,602) $ 5,506 $ (2,394) $ (691,683)
Health Care Total Risk
ManagementGeneralServices
ServiceBureau
FleetManagement
PropertyManagement
Payroll

236 Commonwealth of Virginia
Combining Statement of Cash Flows – Internal Service FundsFor the Fiscal Year Ended June 30, 2016(Dollars in Thousands)
Cash Flows from Operating ActivitiesReceipts for Sales and Services $ 13,903 $ 1,680 $ 17,952Receipts from Investments - - -Internal Activity-Receipts from Other Funds 335,674 18,320 35,072Internal Activity-Payments to Other Funds (5,203) - (1,009)Payments to Suppliers for Goods and Services (665) (15) (36,278)Payments for Contractual Services (320,475) (17,810) (2,547)Payments for Prizes, Claims, and Loss Control - - -Payments to Employees (18,722) (2,110) (6,024)Payments for Interest - (8) -Other Operating Expense - (341) -Net Cash Provided by (Used for) Operating Activities 4,512 (284) 7,166
Cash Flows from Noncapital Financing ActivitiesTransfers In from Other Funds 108 - 38Transfers Out to Other Funds - (106) (1,000)Other Noncapital Financing Receipt Activities 10,000 2,589 -Other Noncapital Financing Disbursement Activities - (1,473) -Net Cash Provided by (Used for) Noncapital Financing Activities 10,108 1,010 (962)
Cash Flows from Capital and Related Financing ActivitiesAcquisition of Capital Assets (1,625) - (290)Payment of Principal and Interest on Bonds and Notes - - (591)Proceeds from Sale of Capital Assets - - 1Other Capital and Related Financing Disbursement Activities - - -Net Cash Used for Capital and Related Financing Activities (1,625) - (880)
Cash Flows from Investing ActivitiesInvestment Income on Cash, Cash Equivalents, and Investments - - -Net Cash Provided by Investing Activities - - -
Net Increase (Decrease) in Cash and Cash Equivalents 12,995 726 5,324Cash and Cash Equivalents, July 1 61,149 1,416 4,300Cash and Cash Equivalents, June 30 $ 74,144 $ 2,142 $ 9,624
Reconciliation of Cash and Cash Equivalents Per the Statement of Net Position: Cash and Cash Equivalents $ 74,144 $ 2,142 $ 9,624 Less: Securities Lending Cash Equivalents - - - Cash and Cash Equivalents per the Statement of Cash Flow s $ 74,144 $ 2,142 $ 9,624
TechnologiesAgency
CorrectionalEnterprises
EnterpriseApplication
VirginiaInformation Virginia
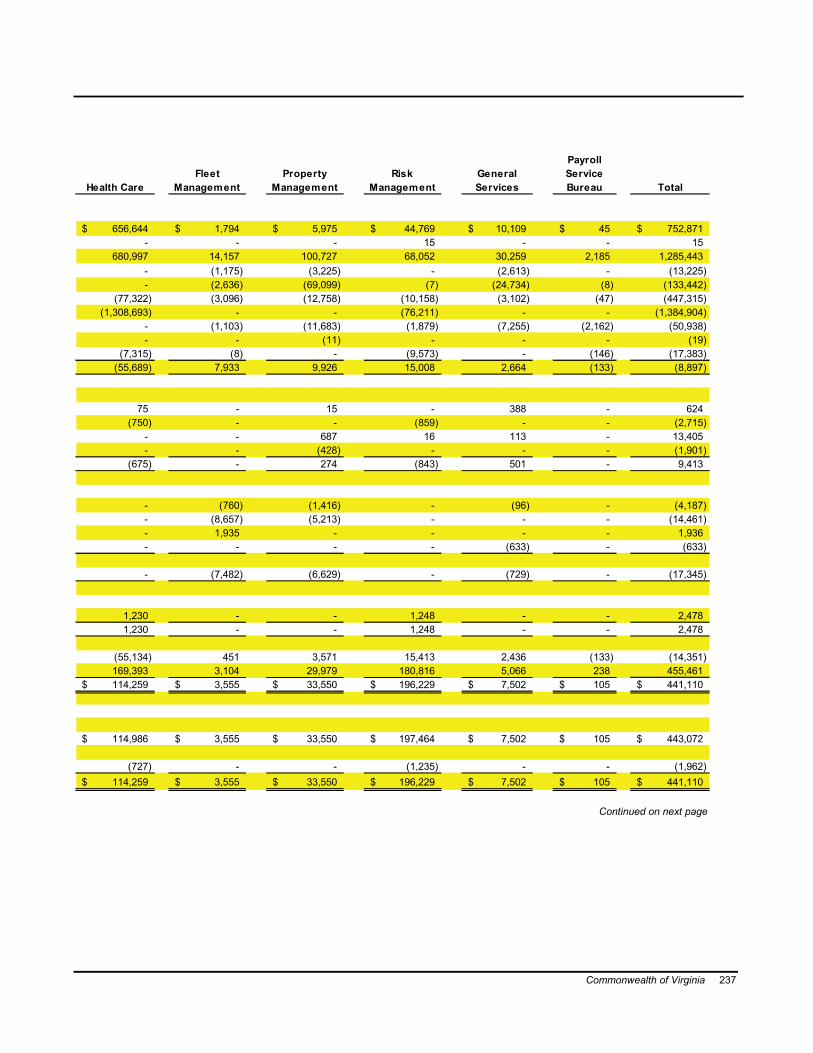
Commonwealth of Virginia 237
$ 656,644 $ 1,794 $ 5,975 $ 44,769 $ 10,109 $ 45 $ 752,871- - - 15 - - 15
680,997 14,157 100,727 68,052 30,259 2,185 1,285,443- (1,175) (3,225) - (2,613) - (13,225)- (2,636) (69,099) (7) (24,734) (8) (133,442)
(77,322) (3,096) (12,758) (10,158) (3,102) (47) (447,315)(1,308,693) - - (76,211) - - (1,384,904)
- (1,103) (11,683) (1,879) (7,255) (2,162) (50,938)- - (11) - - - (19)
(7,315) (8) - (9,573) - (146) (17,383)(55,689) 7,933 9,926 15,008 2,664 (133) (8,897)
75 - 15 - 388 - 624(750) - - (859) - - (2,715)
- - 687 16 113 - 13,405- - (428) - - - (1,901)
(675) - 274 (843) 501 - 9,413
- (760) (1,416) - (96) - (4,187)- (8,657) (5,213) - - - (14,461)- 1,935 - - - - 1,936- - - - (633) - (633)
- (7,482) (6,629) - (729) - (17,345)
1,230 - - 1,248 - - 2,4781,230 - - 1,248 - - 2,478
(55,134) 451 3,571 15,413 2,436 (133) (14,351)169,393 3,104 29,979 180,816 5,066 238 455,461
$ 114,259 $ 3,555 $ 33,550 $ 196,229 $ 7,502 $ 105 $ 441,110
$ 114,986 $ 3,555 $ 33,550 $ 197,464 $ 7,502 $ 105 $ 443,072
(727) - - (1,235) - - (1,962)$ 114,259 $ 3,555 $ 33,550 $ 196,229 $ 7,502 $ 105 $ 441,110
ManagementProperty
TotalServiceBureauServices
RiskManagementHealth Care
FleetManagement
PayrollGeneral
Continued on next page
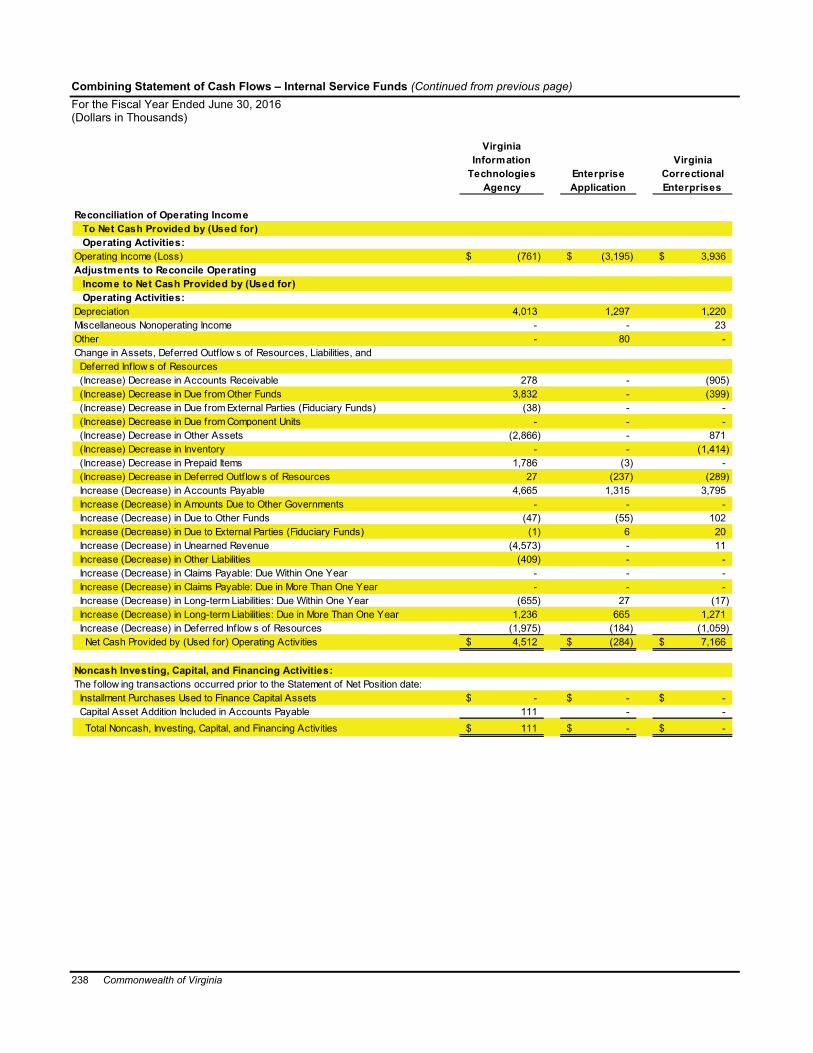
238 Commonwealth of Virginia
Combining Statement of Cash Flows – Internal Service Funds (Continued from previous page)For the Fiscal Year Ended June 30, 2016(Dollars in Thousands)
Reconciliation of Operating Income To Net Cash Provided by (Used for) Operating Activities:Operating Income (Loss) $ (761) $ (3,195) $ 3,936Adjustments to Reconcile Operating Income to Net Cash Provided by (Used for) Operating Activities:Depreciation 4,013 1,297 1,220Miscellaneous Nonoperating Income - - 23Other - 80 -Change in Assets, Deferred Outf low s of Resources, Liabilities, and Deferred Inflow s of Resources(Increase) Decrease in Accounts Receivable 278 - (905)(Increase) Decrease in Due from Other Funds 3,832 - (399)(Increase) Decrease in Due from External Parties (Fiduciary Funds) (38) - -(Increase) Decrease in Due from Component Units - - -(Increase) Decrease in Other Assets (2,866) - 871(Increase) Decrease in Inventory - - (1,414)(Increase) Decrease in Prepaid Items 1,786 (3) -(Increase) Decrease in Deferred Outf low s of Resources 27 (237) (289)Increase (Decrease) in Accounts Payable 4,665 1,315 3,795Increase (Decrease) in Amounts Due to Other Governments - - -Increase (Decrease) in Due to Other Funds (47) (55) 102Increase (Decrease) in Due to External Parties (Fiduciary Funds) (1) 6 20Increase (Decrease) in Unearned Revenue (4,573) - 11Increase (Decrease) in Other Liabilities (409) - -Increase (Decrease) in Claims Payable: Due Within One Year - - -Increase (Decrease) in Claims Payable: Due in More Than One Year - - -Increase (Decrease) in Long-term Liabilities: Due Within One Year (655) 27 (17)Increase (Decrease) in Long-term Liabilities: Due in More Than One Year 1,236 665 1,271Increase (Decrease) in Deferred Inflow s of Resources (1,975) (184) (1,059)Net Cash Provided by (Used for) Operating Activities $ 4,512 $ (284) $ 7,166
Noncash Investing, Capital, and Financing Activities:The follow ing transactions occurred prior to the Statement of Net Position date:Installment Purchases Used to Finance Capital Assets $ - $ - $ -Capital Asset Addition Included in Accounts Payable 111 - -Total Noncash, Investing, Capital, and Financing Activities $ 111 $ - $ -
ApplicationTechnologies Correctional
VirginiaVirginia
EnterpriseAgency Enterprises
Information
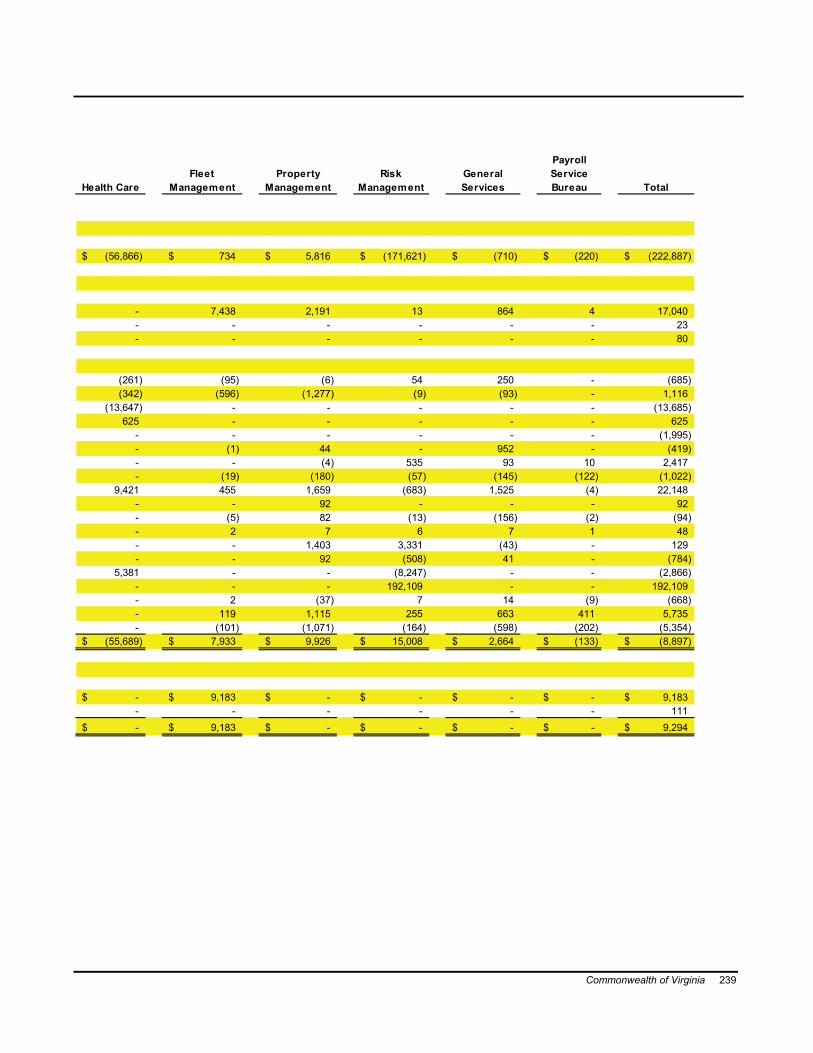
Commonwealth of Virginia 239
$ (56,866) $ 734 $ 5,816 $ (171,621) $ (710) $ (220) $ (222,887)
- 7,438 2,191 13 864 4 17,040- - - - - - 23- - - - - - 80
(261) (95) (6) 54 250 - (685)(342) (596) (1,277) (9) (93) - 1,116
(13,647) - - - - - (13,685)625 - - - - - 625
- - - - - - (1,995)- (1) 44 - 952 - (419)- - (4) 535 93 10 2,417- (19) (180) (57) (145) (122) (1,022)
9,421 455 1,659 (683) 1,525 (4) 22,148- - 92 - - - 92- (5) 82 (13) (156) (2) (94)- 2 7 6 7 1 48- - 1,403 3,331 (43) - 129- - 92 (508) 41 - (784)
5,381 - - (8,247) - - (2,866)- - - 192,109 - - 192,109- 2 (37) 7 14 (9) (668)- 119 1,115 255 663 411 5,735- (101) (1,071) (164) (598) (202) (5,354)
$ (55,689) $ 7,933 $ 9,926 $ 15,008 $ 2,664 $ (133) $ (8,897)
$ - $ 9,183 $ - $ - $ - $ - $ 9,183- - - - - - 111
$ - $ 9,183 $ - $ - $ - $ - $ 9,294
TotalProperty
ManagementGeneralServices
PayrollServiceBureauHealth Care
FleetManagement
RiskManagement

240 Commonwealth of Virginia
Fiduciary Funds
Private Purpose Trust Funds
Private Purpose Trust Funds are trust arrangements that benefit individuals, private organizations, or other governments.
Unclaimed Property accounts for unclaimed and escheat property that the state holds for its rightful owner.
Virginia529 inVEST accounts for program activities offered by the Virginia College Savings Plan. The program is a defined contribution college savings program in which participants can save for qualified higher education expenses by making contributions and investments into portfolios of their choice.
Loan Servicing Reserve accounts for funds that are used to service loan activities for individual loans in order to meet the provisions of the Declarations of the dissolved Virginia Education Loan Authority.
Edvantage Reserve accounts for funds that are used to service loan activities for individual loans in order to meet the provisions of the dissolved Student Education Assistance Authority.
Virginia Revolving Farm Loan Program accounts for trust funds that are used to provide loans to individual farmers for rural rehabilitation purposes.
Gas and Oil Board Escrow Account accounts for the funds held in escrow awaiting disbursement to the validated owner of property containing gas and oil interest.
Miscellaneous Trust account for perpetual trusts created through donations to the state. Earnings are used for the benefit of donor-specified local entities.
Pension and Other Employee Benefit Trust Funds
Pension and Other Employee Benefit Trust Funds reflect the activities of the retirement systems and postemployment benefits administered by the Virginia Retirement System (VRS) or the Department of Human Resource Management.
The Virginia Retirement System provides retirement benefits to Commonwealth employees, teachers, political subdivision employees, and other qualifying employees.
The State Police Officers’ Retirement System provides retirement benefits to Virginia state police officers.
The Judicial Retirement System provides retirement benefits to the Commonwealth's judiciary.
The Virginia Law Officers’ Retirement System provides retirement benefits to correctional officers, capital police officers, university police officers, and game wardens.
Political Appointees provides optional retirement benefits to selected officials and administrative staff.
The Public School Superintendents’ Plan provides retirement benefits to superintendents in the public school system.
The Virginia Supplemental Retirement Plan provides extra benefits to turn-around specialists in the public school system.
Other Postemployment Retiree Health Insurance Credit Fund accounts for the health insurance credits provided by the Commonwealth which offset a portion of the retirees’ monthly insurance premiums.
Other Employment Group Life Fund provides life insurance coverage to members of the retirement systems.
Other Postemployment Disability Insurance Trust Fundprovides income protection to Commonwealth employees for absences caused by sickness or disability.
Other Employment Volunteer Firefighters' and Rescue Squad Workers' Fund provides optional retirement benefits to volunteer firefighters and rescue squad workers.
Other Postemployment Line of Duty Death and Disability Fund provides death and health benefits to beneficiaries of certain law enforcement and rescue personnel disabled or killed in the line of duty.
Virginia Local Disability Program provides long-term disability benefits to local government employees.

Commonwealth of Virginia 241
Investment Trust Fund
Investment Trust Fund reflects the external portion of the local government investment pool sponsored by the Commonwealth.
Local Government Investment Pool (LGIP) helps local governmental entities maximize their rate of return by commingling their resources for investment purposes.
Agency Funds
Agency Funds report those funds for which the Commonwealth acts solely in a custodial capacity.
Funds for the Collection of Taxes and Fees account for taxes and fees collected by the Commonwealth to be distributed to localities or other states.
Employee Benefits Fund accounts for undistributed withholdings for employee benefits.
Contractor Deposits Fund accounts for reimbursable deposits, including both cash and securities, from mining companies, road construction companies, motor fuel retailers and localities to ensure performance meets regulatory standards.
Deposits of Insurance Carriers Fund accounts for security deposits of insurance carriers as protection to the policy holders of the Commonwealth, as well as funds or irrevocable letters of credit held in lieu of insurance for pilot licensure.
Inmate and Ward Fund accounts for the savings of inmates and wards of the Departments of Corrections and Juvenile Justice.
Child Support Collection Fund accounts for court-ordered child support payments that flow through the Department of Social Services.
Behavioral Health Patient Fund accounts for the savings of patients in the Commonwealth's behavioral health facilities.
Behavioral Health Non-patient Fund accounts for the savings of non-patients in the Commonwealth's behavioral health facilities.
Comptroller's Debt Setoff Fund accounts for monies held in a suspense status while research is conducted to determine the party entitled to the funds.
Unclaimed Property of Other States Fund accounts for unclaimed property that is due to other states.
Legal Settlement Fund accounts for receipts from court judgments that are deposited and subsequently distributed to the appropriate injured parties.
Consumer Services Fund accounts for deposits made by businesses that will provide assistance to individuals suffering losses associated with these businesses and will be returned after dispute resolution. The Milk Commission, which accounts for deposits from milk producers that will be distributed to individual farmers to offset delivery expenses and losses incurred, is reported as part of this fund.
State Asset Forfeiture Fund accounts for seized assets that are deposited and subsequently distributed to the appropriate parties pursuant to court orders.
Virginia School for the Deaf and the Blind Fund accounts for student funds used to establish new activities for students.
Wilson Workforce and Rehabilitation Center Fund(formerly the Woodrow Wilson Rehabilitation Center Fund) accounts for student funds held by the center.
Third Party Administrator Fund accounts for funds held in custody for assets of the Virginia Railway Express and the van pool insurance program.
Department of Environmental Quality Fund accounts for deposits from the EPA as a result of a legal settlement which will be distributed to localities to retro-fit school buses.
Virginia Veterans’ Care Center Resident Fund accounts for the savings of residents of the Virginia Veterans Care Center.
Virginia Individual Development Account Trust Fund accounts for funds used to benefit low income individuals and to assist them in purchasing affordable housing.
E-Payables Fund accounts for payments to vendors which are held in a suspense status until the electronic payment is processed.

242 Commonwealth of Virginia
Combining Statement of Fiduciary Net Position – Private Purpose Trust FundsJune 30, 2016(Dollars in Thousands)
Assets and Deferred Outflows of ResourcesCash and Cash Equivalents $ 32,891 $ 122,905 $ 189Investments: Bonds and Mortgage Securities 6,159 90,773 - Stocks 189,376 62,973 - Fixed Income Commingled Funds 1,156 - - Index and Pooled Funds 67,588 1,722,302 - Real Estate 1,719 - - Mutual and Money Market Funds 75,481 662,264 - Other 57 671,799 - Total Investments 341,536 3,210,111 -Receivables, Net: Accounts - 93 - Interest and Dividends - 2,282 - Other Receivables - 308 - Total Receivables - 2,683 -Prepaid Items 57 - -Furniture and Equipment 946 - - Total Assets 375,430 3,335,699 189Deferred Outflows of Resources 498 - - Total Assets and Deferred Outf low s of Resources 375,928 3,335,699 189
Liabilities and Deferred Inflows of ResourcesAccounts Payable and Accrued Expenses 323 1,754 -Due to Other Funds 24 - -Due to Internal Parties (Governmental Funds and Business-type Activities) 65 - -Obligations Under Securities Lending Program - - -Other Liabilities - 4,656 - Compensated Absences Payable 296 - - Net Pension Liability 3,601 - -Other Postemployment Benefits (OPEB) Liability 656 - - Total Liabilities 4,965 6,410 -
Deferred Inflows of Resources 253 - - Total Liabilities and Deferred Inflow s of Resources 5,218 6,410 -
Net Position Restricted for Participants and Other Purposes $ 370,710 $ 3,329,289 $ 189
PropertyUnclaimed Virginia529
inVEST
LoanServicingReserve

Commonwealth of Virginia 243
$ 248 $ 4,720 $ 21,744 $ 66 $ 182,763
- - - - 96,932- - - - 252,349- - - - 1,156- - - - 1,789,890- - - - 1,719- - - - 737,745- - - - 671,856- - - - 3,551,647
- 2 - - 95- - - - 2,282- - - 308- 2 - - 2,685- - - - 57- - - - 946
248 4,722 21,744 66 3,738,098- 8 - - 506
248 4,730 21,744 66 3,738,604
- 5 - - 2,082- 1 - - 25- - - - 652 30 - - 32- - - - 4,656- 3 - - 299- 73 - - 3,674- 13 - - 6692 125 - - 11,502
- 5 - - 2582 130 - - 11,760
$ 246 $ 4,600 $ 21,744 $ 66 $ 3,726,844
RevolvingFarm LoanProgram Trust
Miscellaneous
Virginia Gas and
TotalEscrowAccount
Oil BoardEdvantageReserve

244 Commonwealth of Virginia
Combining Statement of Changes in Fiduciary Net Position – Private Purpose Trust FundsFor the Fiscal Year June 30, 2016(Dollars in Thousands)
Additions:Investment Income: Interest, Dividends, and Other Investment Income $ (21,677) $ 55,666 $ - Total Investment Income (21,677) 55,666 - Less Investment Expenses - 4,677 - Net Investment Income (21,677) 50,989 -Proceeds from Unclaimed Property 88,488 - -Contributions: Participants - 433,790 - Total Contributions - 433,790 -Other Revenue - - - Total Additions 66,811 484,779 -Deductions:Loan Servicing Payments - - -Educational Expense Benefits - 203,429 -Insurance Premiums and Claims 40,523 - -Trust Payments - - -Administrative Expenses 6,386 971 -Shares Redeemed - 23,616 - Total Deductions 46,909 228,016 -Net Increase (Decrease) 19,902 256,763 -
Net Position Restricted for Participants and Other PurposesJuly 1, as restated 350,808 3,072,526 189June 30 $ 370,710 $ 3,329,289 $ 189
Loan
Property ReserveinVESTUnclaimed ServicingVirginia529
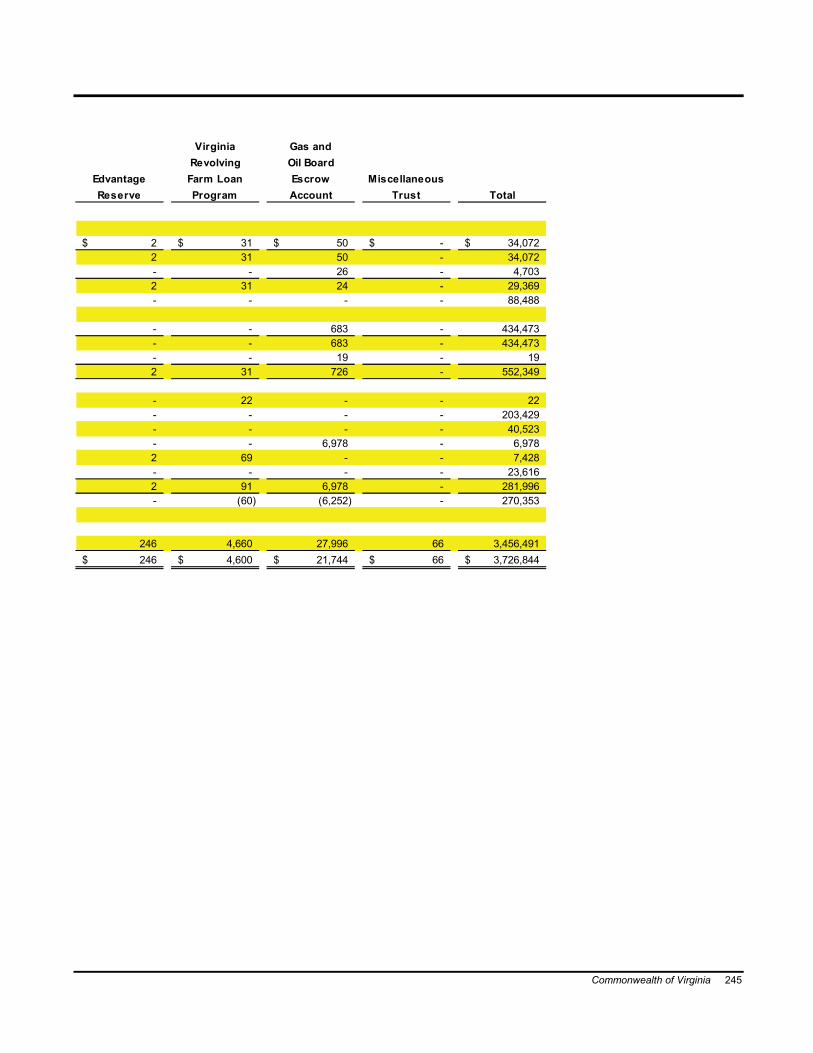
Commonwealth of Virginia 245
$ 2 $ 31 $ 50 $ - $ 34,0722 31 50 - 34,072- - 26 - 4,7032 31 24 - 29,369- - - - 88,488
- - 683 - 434,473- - 683 - 434,473- - 19 - 192 31 726 - 552,349
- 22 - - 22- - - - 203,429- - - - 40,523- - 6,978 - 6,9782 69 - - 7,428- - - - 23,6162 91 6,978 - 281,996- (60) (6,252) - 270,353
246 4,660 27,996 66 3,456,491$ 246 $ 4,600 $ 21,744 $ 66 $ 3,726,844
Gas and
TotalTrustMiscellaneous
Oil BoardEscrowAccount
RevolvingVirginia
Reserve ProgramEdvantage Farm Loan

246 Commonwealth of Virginia
Combining Statement of Fiduciary Net Position – Pension and Other Employee Benefit Trust FundsJune 30, 2016(Dollars in Thousands)
Assets and Deferred Outflows of ResourcesCash and Cash Equivalents $ 449,290 $ 5,152 $ 3,292Investments: Bonds and Mortgage Securities 19,507,081 223,662 142,932 Stocks 19,894,274 228,101 145,769 Fixed Income Commingled Funds 1,105,595 12,677 8,101 Index and Pooled Funds 7,952,334 91,179 58,268 Real Estate 7,187,577 82,410 52,665 Private Equity 8,488,507 97,327 62,197 Short-term Investments 130,238 1,493 954 Hybrid Defined Contribution Investments 73,031 - 882 Other 4,709,368 53,996 34,506 Total Investments 69,048,005 790,845 506,274Receivables, Net: Contributions 204,091 1,270 1,337 Interest and Dividends 205,760 2,359 1,508 Security Transactions 1,136,206 13,025 8,324 Other Receivables 299,675 3,438 2,192 Total Receivables 1,845,732 20,092 13,361Due from Other Funds 23 - -Due from Internal Parties (Governmental Funds and Business-type Activities) 26,069 163 172Due from Component Units 31,664 - -Furniture and Equipment 32,097 - - Total Assets 71,432,880 816,252 523,099
Deferred Outflows of Resources - - - Total Assets and Deferred Outf low s of Resources 71,432,880 816,252 523,099
Liabilities and Deferred Inflows of ResourcesAccounts Payable and Accrued Expenses 26,865 268 171Due to Internal Parties (Governmental Funds and Business-type Activities) 13,822 - -Obligations Under Securities Lending Program 4,709,368 53,996 34,506Other Liabilities 361,595 3,963 2,533Retirement Benefits Payable 318,286 5,092 3,371Refunds Payable 5,227 - -Compensated Absences Payable 2,455 - -Insurance Premiums and Claims Payable - - -Payable for Security Transactions 1,966,289 22,245 14,216 Total Liabilities 7,403,907 85,564 54,797
Deferred Inflows of Resources - - - Total Liabilities and Deferred Inflow s of Resources 7,403,907 85,564 54,797
Net Position Restricted for Pensions and Other Employment Benefits $ 64,028,973 $ 730,688 $ 468,302
System
Judicial
System SystemRetirement
Officers'
State
VirginiaRetirement
Police
Retirement
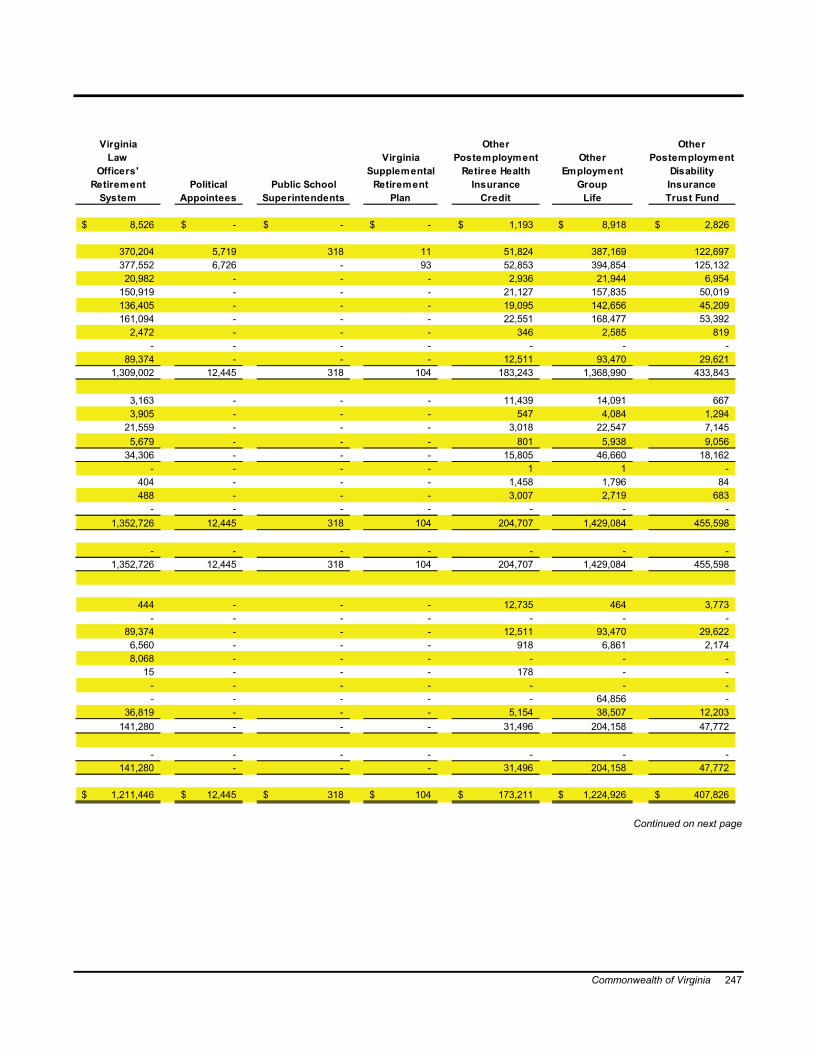
Commonwealth of Virginia 247
$ 8,526 $ - $ - $ - $ 1,193 $ 8,918 $ 2,826
370,204 5,719 318 11 51,824 387,169 122,697377,552 6,726 - 93 52,853 394,854 125,13220,982 - - - 2,936 21,944 6,954
150,919 - - - 21,127 157,835 50,019136,405 - - - 19,095 142,656 45,209161,094 - - - 22,551 168,477 53,392
2,472 - - - 346 2,585 819- - - - - - -
89,374 - - - 12,511 93,470 29,6211,309,002 12,445 318 104 183,243 1,368,990 433,843
3,163 - - - 11,439 14,091 6673,905 - - - 547 4,084 1,294
21,559 - - - 3,018 22,547 7,1455,679 - - - 801 5,938 9,056
34,306 - - - 15,805 46,660 18,162- - - - 1 1 -
404 - - - 1,458 1,796 84488 - - - 3,007 2,719 683
- - - - - - -1,352,726 12,445 318 104 204,707 1,429,084 455,598
- - - - - - -1,352,726 12,445 318 104 204,707 1,429,084 455,598
444 - - - 12,735 464 3,773- - - - - - -
89,374 - - - 12,511 93,470 29,6226,560 - - - 918 6,861 2,1748,068 - - - - - -
15 - - - 178 - -- - - - - - -- - - - - 64,856 -
36,819 - - - 5,154 38,507 12,203141,280 - - - 31,496 204,158 47,772
- - - - - - -141,280 - - - 31,496 204,158 47,772
$ 1,211,446 $ 12,445 $ 318 $ 104 $ 173,211 $ 1,224,926 $ 407,826
System
VirginiaSupplemental
RetirementPlan
RetirementOfficers'
Appointees Superintendents
OtherVirginiaLaw
Retiree HealthPolitical Public School
EmploymentOther
GroupLifeCredit
Insurance
PostemploymentOther
Trust Fund
DisabilityInsurance
Postemployment
Continued on next page

248 Commonwealth of Virginia
Combining Statement of Fiduciary Net Position – Pension and Other Employee Benefit Trust Funds (Continued from previous page)June 30, 2016(Dollars in Thousands)
Assets and Deferred Outflows of ResourcesCash and Cash Equivalents $ - $ 19 $ -Investments: Bonds and Mortgage Securities 105 709 - Stocks 3,120 724 - Fixed Income Commingled Funds - 40 - Index and Pooled Funds - 289 - Real Estate - 261 - Private Equity - 308 - Short-term Investments - 5 - Hybrid Defined Contribution Investments - - - Other - 171 - Total Investments 3,225 2,507 -Receivables, Net: Contributions - 29 687 Interest and Dividends - 7 - Security Transactions - 41 - Other Receivables - 358 7 Total Receivables - 435 694Due from Other Funds - - -Due from Internal Parties (Governmental Funds and Business-type Activities) - 3 88Due from Component Units - - -Furniture and Equipment - - - Total Assets 3,225 2,964 782
Deferred Outflows of Resources - - - Total Assets and Deferred Outf low s of Resources 3,225 2,964 782
Liabilities and Deferred Inflows of ResourcesAccounts Payable and Accrued Expenses - 1 -Due to Internal Parties (Governmental Funds and Business-type Activities) - - -Obligations Under Securities Lending Program - 173 -Other Liabilities - 12 782Retirement Benefits Payable - - -Refunds Payable - - -Compensated Absences Payable - - -Insurance Premiums and Claims Payable - - -Payable for Security Transactions - 70 - Total Liabilities - 256 782
Deferred Inflows of Resources - - - Total Liabilities and Deferred Inflow s of Resources - 256 782
Net Position Restricted for Pensions and Other Employment Benefits $ 3,225 $ 2,708 $ -
Other
and RescueSquad Workers
Other
Virginia LocalDeath andDisability
DisabilityProgram
EmploymentVolunteer
FirefightersPostemployment
Line of Duty

Commonwealth of Virginia 249
$ 479,216
20,812,43121,229,1981,179,2298,481,9707,666,2789,053,853
138,91273,913
5,023,01773,658,801
236,774219,464
1,211,865327,144
1,995,24725
30,23738,56132,097
76,234,184
-76,234,184
44,72113,822
5,023,020385,398334,817
5,4202,455
64,8562,095,5037,970,012
-7,970,012
$ 68,264,172
Total

250 Commonwealth of Virginia
Combining Statement of Changes in Fiduciary Net Position – Pension and Other Employee Benefit Trust FundsFor the Fiscal Year Ended June 30, 2016(Dollars in Thousands)
Additions:Investment Income:
Interest, Dividends, and Other Investment Income $ 1,476,407 $ 16,975 $ 10,843 Total Investment Income 1,476,407 16,975 10,843 Less Investment Expenses 381,178 4,340 2,706 Net Investment Income 1,095,229 12,635 8,137Contributions: Member 841,115 5,759 3,503 Employer 2,352,164 33,655 41,909 Total Contributions 3,193,279 39,414 45,412Other Revenue 1,789 - - Total Additions 4,290,297 52,049 53,549Deductions:Retirement Benefits 4,169,852 53,515 41,341Refunds to Former Members 99,444 584 -Retiree Health Insurance Credits - - -Insurance Premiums and Claims - - -Administrative Expenses 39,696 591 363Other Expenses 2,263 23 15Long-term Disability Benefits - - - Total Deductions 4,311,255 54,713 41,719Net Increase/(Decrease) (20,958) (2,664) 11,830
Net Position Restricted for Pensions and Other Employment BenefitsJuly 1 64,049,931 733,352 456,472June 30 $ 64,028,973 $ 730,688 $ 468,302
VirginiaRetirement
Officers' Judicial
System System SystemRetirement Retirement
PoliceState

Commonwealth of Virginia 251
$ 27,941 $ 184 $ 3 $ 2 $ 3,334 $ 30,767 $ 9,36127,941 184 3 2 3,334 30,767 9,3617,044 - - - 913 7,322 2,427
20,897 184 3 2 2,421 23,445 6,934
17,574 1,374 40 - - 127,846 -79,392 - - - 151,916 86,411 24,49796,966 1,374 40 - 151,916 214,257 24,497
- - - - - - 659117,863 1,558 43 2 154,337 237,702 32,090
92,270 765 104 5 - - -4,524 - - - - - -
- - - - 153,914 - -- - - - - 173,843 -
938 10 - - 401 81 77438 - - - 5 1,469 12
- - - - - - 37,99697,770 775 104 5 154,320 175,393 38,78220,093 783 (61) (3) 17 62,309 (6,692)
1,191,353 11,662 379 107 173,194 1,162,617 414,518$ 1,211,446 $ 12,445 $ 318 $ 104 $ 173,211 $ 1,224,926 $ 407,826
Appointees Superintendents PlanPublic School
VirginiaSupplemental
Retirement
Postemployment PostemploymentRetiree Health
InsuranceCredit Trust FundLife
PoliticalOfficers'
SystemRetirement
OtherEmployment
Group InsuranceDisability
OtherLaw
Virginia Other
Continued on next page

252 Commonwealth of Virginia
Combining Statement of Changes in Fiduciary Net Position – Pension and Other Employee Benefit Trust Funds (Continued from previous page)For the Fiscal Year Ended June 30, 2016(Dollars in Thousands)
Additions:Investment Income:
Interest, Dividends, and Other Investment Income $ 58 $ 149 $ - Total Investment Income 58 149 - Less Investment Expenses - 24 - Net Investment Income 58 125 -Contributions: Member 29 - - Employer 90 10,881 1,341 Total Contributions 119 10,881 1,341Other Revenue - - 10 Total Additions 177 11,006 1,351Deductions:Retirement Benefits - - -Refunds to Former Members 66 - -Retiree Health Insurance Credits - - -Insurance Premiums and Claims - 8,732 -Administrative Expenses - 275 38Other Expenses - 206 -Long-term Disability Benefits - - 1,313 Total Deductions 66 9,213 1,351Net Increase/(Decrease) 111 1,793 -
Net Position Restricted for Pensions and Other Employment BenefitsJuly 1 3,114 915 -June 30 $ 3,225 $ 2,708 $ -
Program
Other
FirefightersDeath andand Rescue
Line of Duty
EmploymentPostemploymentVolunteer
DisabilitySquad Workers
Other
Virginia LocalDisability

Commonwealth of Virginia 253
$ 1,576,0241,576,024
405,9541,170,070
997,2402,782,2563,779,496
2,4584,952,024
4,357,852104,618153,914182,57543,1674,031
39,3094,885,466
66,558
68,197,614$ 68,264,172
Total

254 Commonwealth of Virginia
Combining Statement of Fiduciary Net Position – Investment Trust FundJune 30, 2016(Dollars in Thousands)
Assets and Deferred Outflows of ResourcesCash and Cash Equivalents $ 1,964,139 $ 1,964,139Investments: Bonds and Mortgage Securities 130,284 130,284 Short-term Investments 1,247,254 1,247,254 Total Investments 1,377,538 1,377,538Receivables, Net: Interest and Dividends 1,097 1,097 Total Receivables 1,097 1,097 Total Assets 3,342,774 3,342,774
Deferred Outflows of Resources - - Total Assets and Deferred Outf low s of Resources 3,342,774 3,342,774
Liabilities and Deferred Inflows of ResourcesDue to Internal Parties (Governmental Funds and Business-type Activities) 1 1 Total Liabilities 1 1
Deferred Inflows of Resources - - Total Liabilities and Deferred Inflow s of Resources 1 1
Net Position Restricted for Pool Participants $ 3,342,773 $ 3,342,773
Pool (LGIP)
Local
Total
GovernmentInvestment
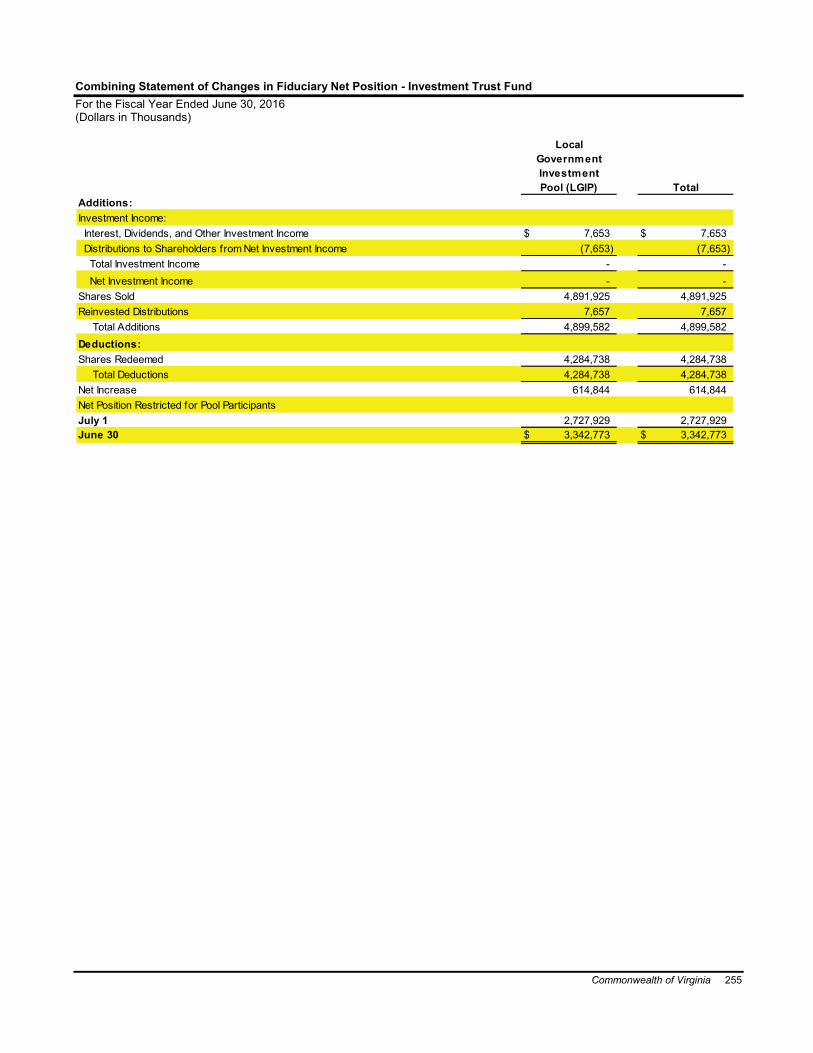
Commonwealth of Virginia 255
Combining Statement of Changes in Fiduciary Net Position - Investment Trust FundFor the Fiscal Year Ended June 30, 2016(Dollars in Thousands)
Additions:Investment Income: Interest, Dividends, and Other Investment Income $ 7,653 $ 7,653 Distributions to Shareholders from Net Investment Income (7,653) (7,653) Total Investment Income - - Net Investment Income - -Shares Sold 4,891,925 4,891,925Reinvested Distributions 7,657 7,657 Total Additions 4,899,582 4,899,582Deductions:Shares Redeemed 4,284,738 4,284,738 Total Deductions 4,284,738 4,284,738Net Increase 614,844 614,844Net Position Restricted for Pool ParticipantsJuly 1 2,727,929 2,727,929June 30 $ 3,342,773 $ 3,342,773
Pool (LGIP) TotalInvestment
LocalGovernment
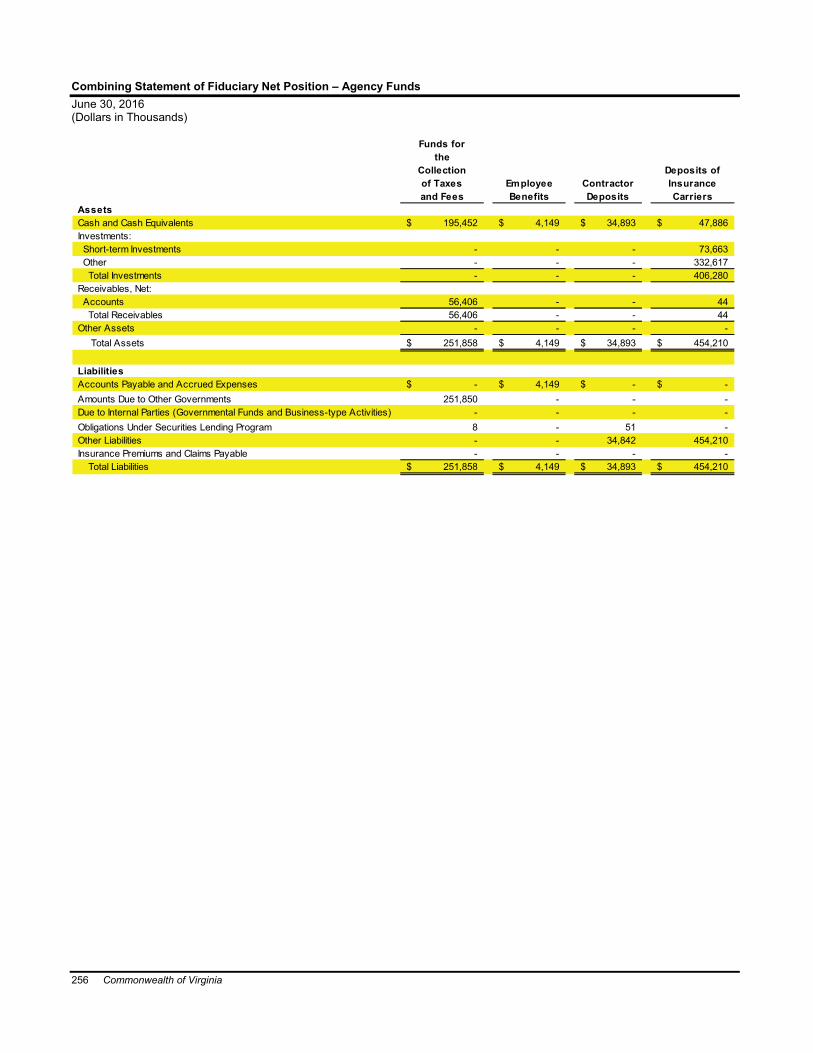
256 Commonwealth of Virginia
Combining Statement of Fiduciary Net Position – Agency FundsJune 30, 2016(Dollars in Thousands)
AssetsCash and Cash Equivalents $ 195,452 $ 4,149 $ 34,893 $ 47,886Investments: Short-term Investments - - - 73,663 Other - - - 332,617 Total Investments - - - 406,280Receivables, Net: Accounts 56,406 - - 44 Total Receivables 56,406 - - 44Other Assets - - - - Total Assets $ 251,858 $ 4,149 $ 34,893 $ 454,210
LiabilitiesAccounts Payable and Accrued Expenses $ - $ 4,149 $ - $ -Amounts Due to Other Governments 251,850 - - -Due to Internal Parties (Governmental Funds and Business-type Activities) - - - -Obligations Under Securities Lending Program 8 - 51 -Other Liabilities - - 34,842 454,210Insurance Premiums and Claims Payable - - - - Total Liabilities $ 251,858 $ 4,149 $ 34,893 $ 454,210
Funds for
and Feesof Taxes
Collectionthe
CarriersInsurance
Deposits ofEmployeeBenefits
ContractorDeposits

Commonwealth of Virginia 257
$ 18,233 $ 13,438 $ 1,697 $ 33 $ 841 $ 9,514 $ 16,619 $ 1,348
- - - - - - - -- - 6 - - - - -- - 6 - - - - -
506 - - - - - - -506 - - - - - - -
- - - - - - - -$ 18,739 $ 13,438 $ 1,703 $ 33 $ 841 $ 9,514 $ 16,619 $ 1,348
$ 2,747 $ - $ - $ - $ - $ - $ - $ 2- - - - - 9,514 - -
168 - - - - - - -- - - - - - 6 -
15,824 13,438 1,703 33 841 - 16,613 1,346- - - - - - - -
$ 18,739 $ 13,438 $ 1,703 $ 33 $ 841 $ 9,514 $ 16,619 $ 1,348
BehavioralHealthNon-
Unclaimed Property
Consumerof Other LegalDebtComptroller's
and Ward PatientCollectionSupport
ChildInmate
BehavioralHealth
SetoffPatient SettlementStates Services
Continued on next page

258 Commonwealth of Virginia
Combining Statement of Fiduciary Net Position – Agency Funds (Continued from previous page)June 30, 2016(Dollars in Thousands)
AssetsCash and Cash Equivalents $ 9,963 $ 20 $ 4 $ 11,885Investments: Short-term Investments - - - - Other - - - - Total Investments - - - -Receivables, Net: Accounts - - - 52 Total Receivables - - - 52Other Assets - - - 49 Total Assets $ 9,963 $ 20 $ 4 $ 11,986
LiabilitiesAccounts Payable and Accrued Expenses $ - $ - $ - $ 2Amounts Due to Other Governments - - - -Due to Internal Parties (Governmental Funds and Business-type Activities) - - - -Obligations Under Securities Lending Program 10 - - 75Other Liabilities 9,953 20 4 11,764Insurance Premiums and Claims Payable - - - 145 Total Liabilities $ 9,963 $ 20 $ 4 $ 11,986
WilsonWorkforce and
VirginiaSchool
AssetState
Center
ThirdParty
AdministratorForfeiture and BlindRehabilitationfor the Deaf

Commonwealth of Virginia 259
$ 128 $ 214 $ - $ 16,378 $ 382,695
- - - - 73,663- - - - 332,623- - - - 406,286
- - - - 57,008- - - - 57,008- - - - 49
$ 128 $ 214 $ - $ 16,378 $ 846,038
$ - $ - $ - $ - $ 6,900- - - - 261,364- - - - 168- - - - 150
128 214 - 16,378 577,311- - - - 145
$ 128 $ 214 $ - $ 16,378 $ 846,038
E-Payables
Department of
Trust Fund
VirginiaIndividual
Development
VirginiaVeterans'
Care CenterAccount
FundResidentEnvironmental
Quality Total

260 Commonwealth of Virginia
Combining Statement of Changes in Assets and Liabilities – Agency FundsFor the Fiscal Year Ended June 30, 2016(Dollars in Thousands)
BalanceAdditions Deletions June 30July 1
Balance
Funds for the Collection of Taxes and Fees Assets: Cash and Cash Equivalents $ 192,772 $ 1,337,127 $ 1,334,447 $ 195,452 Short-term Investments 1 - 1 - Accounts Receivable 57,569 56,406 57,569 56,406 Total Assets $ 250,342 $ 1,393,533 $ 1,392,017 $ 251,858
Liabilities: Amounts Due to Other Governments $ 250,303 $ 1,393,525 $ 1,391,978 $ 251,850 Obligations Under Securities Lending Program 39 8 39 8 Total Liabilities $ 250,342 $ 1,393,533 $ 1,392,017 $ 251,858
Employee Benefits Assets: Cash and Cash Equivalents $ 3,620 $ 303,722 $ 303,193 $ 4,149 Total Assets $ 3,620 $ 303,722 $ 303,193 $ 4,149
Liabilities: Accounts Payable and Accrued Expenses $ 3,620 $ 303,722 $ 303,193 $ 4,149 Total Liabilities $ 3,620 $ 303,722 $ 303,193 $ 4,149
Contractor Deposits Assets: Cash and Cash Equivalents $ 34,277 $ 11,692 $ 11,076 $ 34,893 Short-term Investments 11 - 11 - Total Assets $ 34,288 $ 11,692 $ 11,087 $ 34,893
Liabilities: Obligations Under Securities Lending Program $ 302 $ 51 $ 302 $ 51 Other Liabilities 33,986 11,641 10,785 34,842 Total Liabilities $ 34,288 $ 11,692 $ 11,087 $ 34,893
Deposits of Insurance Carriers Assets: Cash and Cash Equivalents $ 49,343 $ 37,756 $ 39,213 $ 47,886 Short-term Investments 69,996 73,664 69,997 73,663 Other Investments 319,445 43,237 30,065 332,617 Accounts Receivable 40 505 501 44 Total Assets $ 438,824 $ 155,162 $ 139,776 $ 454,210
Liabilities: Other Liabilities $ 438,824 $ 155,162 $ 139,776 $ 454,210 Total Liabilities $ 438,824 $ 155,162 $ 139,776 $ 454,210
Inmate and Ward Assets: Cash and Cash Equivalents $ 16,050 $ 2,291 $ 108 $ 18,233 Accounts Receivable 599 3 96 506 Total Assets $ 16,649 $ 2,294 $ 204 $ 18,739
Liabilities: Accounts Payable and Accrued Expenses $ 2,464 $ 283 $ - $ 2,747 Due to Internal Parties (Governmental Funds and Business-type Activities) 71 97 - 168 Other Liabilities 14,114 1,825 115 15,824 Total Liabilities $ 16,649 $ 2,205 $ 115 $ 18,739

Commonwealth of Virginia 261
BalanceAdditions Deletions June 30July 1
Balance
Child Support Collection Assets: Cash and Cash Equivalents $ 16,250 $ 650,163 $ 652,975 $ 13,438 Total Assets $ 16,250 $ 650,163 $ 652,975 $ 13,438
Liabilities: Other Liabilities $ 16,250 $ 650,163 $ 652,975 $ 13,438 Total Liabilities $ 16,250 $ 650,163 $ 652,975 $ 13,438
Behavioral Health Patient Assets: Cash and Cash Equivalents $ 1,996 $ 2,489 $ 2,788 $ 1,697 Other Investments 6 - - 6 Total Assets $ 2,002 $ 2,489 $ 2,788 $ 1,703
Liabilities: Other Liabilities $ 2,002 $ 2,489 $ 2,788 $ 1,703 Total Liabilities $ 2,002 $ 2,489 $ 2,788 $ 1,703
Behavioral Health Non-Patient Assets: Cash and Cash Equivalents $ 39 $ 8 $ 14 $ 33 Total Assets $ 39 $ 8 $ 14 $ 33
Liabilities: Other Liabilities $ 39 $ 8 $ 14 $ 33 Total Liabilities $ 39 $ 8 $ 14 $ 33
Comptroller's Debt Setoff Assets: Cash and Cash Equivalents $ 1,022 $ 13,475 $ 13,656 $ 841 Total Assets $ 1,022 $ 13,475 $ 13,656 $ 841
Liabilities: Other Liabilities $ 1,022 $ 13,475 $ 13,656 $ 841 Total Liabilities $ 1,022 $ 13,475 $ 13,656 $ 841
Unclaimed Property of Other States Assets: Cash and Cash Equivalents $ 6,006 $ 9,514 $ 6,006 $ 9,514 Total Assets $ 6,006 $ 9,514 $ 6,006 $ 9,514
Liabilities: Amounts Due to Other Governments $ 6,006 $ 9,514 $ 6,006 $ 9,514 Total Liabilities $ 6,006 $ 9,514 $ 6,006 $ 9,514
Legal Settlement Assets: Cash and Cash Equivalents $ 14,225 $ 7,899 $ 5,505 $ 16,619 Short-term Investments 1 - 1 - Total Assets $ 14,226 $ 7,899 $ 5,506 $ 16,619
Liabilities: Obligations Under Securities Lending Program $ 39 $ 6 $ 39 $ 6 Other Liabilities 14,187 7,893 5,467 16,613 Total Liabilities $ 14,226 $ 7,899 $ 5,506 $ 16,619
Continued on next page

262 Commonwealth of Virginia
Combining Statement of Changes in Assets and Liabilities – Agency Funds (Continued from previous page)For the Fiscal Year Ended June 30, 2016(Dollars in Thousands)
BalanceAdditions Deletions June 30July 1
Balance
Consumer Services Assets: Cash and Cash Equivalents $ 1,475 $ 196 $ 323 $ 1,348 Total Assets $ 1,475 $ 196 $ 323 $ 1,348
Liabilities: Accounts Payable and Accrued Expenses $ 2 $ 26 $ 26 $ 2 Other Liabilities 1,473 170 297 1,346 Total Liabilities $ 1,475 $ 196 $ 323 $ 1,348
State Asset Forfeiture Assets: Cash and Cash Equivalents $ 9,149 $ 7,230 $ 6,416 $ 9,963 Total Assets $ 9,149 $ 7,230 $ 6,416 $ 9,963
Liabilities: Obligations Under Securities Lending Program $ - $ 10 $ - $ 10 Other Liabilities 9,149 7,220 6,416 9,953 Total Liabilities $ 9,149 $ 7,230 $ 6,416 $ 9,963
Virginia School for the Deaf and the Blind Assets: Cash and Cash Equivalents $ 19 $ 10 $ 9 $ 20 Total Assets $ 19 $ 10 $ 9 $ 20
Liabilities: Other Liabilities $ 19 $ 10 $ 9 $ 20 Total Liabilities $ 19 $ 10 $ 9 $ 20
Wilson Workforce and Rehabilitation Center Assets: Cash and Cash Equivalents $ 2 $ 15 $ 13 $ 4 Total Assets $ 2 $ 15 $ 13 $ 4
Liabilities: Other Liabilities $ 2 $ 15 $ 13 $ 4 Total Liabilities $ 2 $ 15 $ 13 $ 4
Third Party Administrator Assets: Cash and Cash Equivalents $ 12,122 $ 4,486 $ 4,723 $ 11,885 Accounts Receivable 2 52 2 52 Other Assets 26 23 - 49 Total Assets $ 12,150 $ 4,561 $ 4,725 $ 11,986
Liabilities: Accounts Payable and Accrued Expenses $ 16 $ 2 $ 16 $ 2 Obligations Under Securities Lending Program - 75 - 75 Other Liabilities 11,827 4,498 4,561 11,764 Insurance Premiums and Claims Payable 307 - 162 145 Total Liabilities $ 12,150 $ 4,575 $ 4,739 $ 11,986
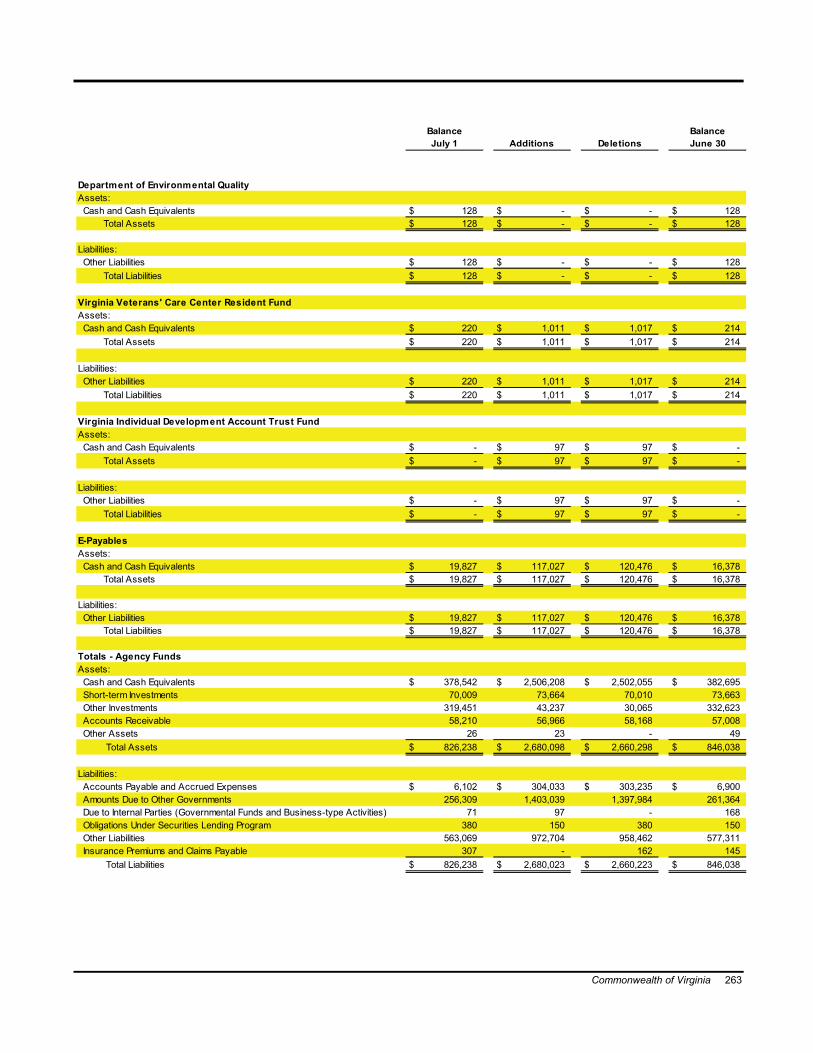
Commonwealth of Virginia 263
BalanceAdditions Deletions June 30July 1
Balance
Department of Environmental Quality Assets: Cash and Cash Equivalents $ 128 $ - $ - $ 128 Total Assets $ 128 $ - $ - $ 128
Liabilities: Other Liabilities $ 128 $ - $ - $ 128 Total Liabilities $ 128 $ - $ - $ 128
Virginia Veterans' Care Center Resident FundAssets: Cash and Cash Equivalents $ 220 $ 1,011 $ 1,017 $ 214 Total Assets $ 220 $ 1,011 $ 1,017 $ 214
Liabilities: Other Liabilities $ 220 $ 1,011 $ 1,017 $ 214 Total Liabilities $ 220 $ 1,011 $ 1,017 $ 214
Virginia Individual Development Account Trust FundAssets: Cash and Cash Equivalents $ - $ 97 $ 97 $ - Total Assets $ - $ 97 $ 97 $ -
Liabilities: Other Liabilities $ - $ 97 $ 97 $ - Total Liabilities $ - $ 97 $ 97 $ -
E-Payables Assets: Cash and Cash Equivalents $ 19,827 $ 117,027 $ 120,476 $ 16,378 Total Assets $ 19,827 $ 117,027 $ 120,476 $ 16,378
Liabilities: Other Liabilities $ 19,827 $ 117,027 $ 120,476 $ 16,378 Total Liabilities $ 19,827 $ 117,027 $ 120,476 $ 16,378
Totals - Agency FundsAssets: Cash and Cash Equivalents $ 378,542 $ 2,506,208 $ 2,502,055 $ 382,695 Short-term Investments 70,009 73,664 70,010 73,663 Other Investments 319,451 43,237 30,065 332,623 Accounts Receivable 58,210 56,966 58,168 57,008 Other Assets 26 23 - 49 Total Assets $ 826,238 $ 2,680,098 $ 2,660,298 $ 846,038
Liabilities: Accounts Payable and Accrued Expenses $ 6,102 $ 304,033 $ 303,235 $ 6,900 Amounts Due to Other Governments 256,309 1,403,039 1,397,984 261,364 Due to Internal Parties (Governmental Funds and Business-type Activities) 71 97 - 168 Obligations Under Securities Lending Program 380 150 380 150 Other Liabilities 563,069 972,704 958,462 577,311 Insurance Premiums and Claims Payable 307 - 162 145 Total Liabilities $ 826,238 $ 2,680,023 $ 2,660,223 $ 846,038

264 Commonwealth of Virginia
Nonmajor Component Units
Component Units are organizations that are legally separate from the Commonwealth of Virginia. Each discrete component unit serves or benefits those outside of the primary government.
The Higher Education Institutions account for the resources received and used in the operation of the Commonwealth’s institutions of higher education and medical teaching hospitals.
Higher Education Institutions included in this section are:
University of Virginia, including the University of Virginia Medical Center, and the University of Virginia College at WiseVirginia Polytechnic Institute and State UniversityVirginia Commonwealth University, including the Virginia Commonwealth University Health System AuthorityThe College of William & Mary, including Richard Bland College and the Virginia Institute of Marine ScienceVirginia Military InstituteVirginia State UniversityNorfolk State UniversityUniversity of Mary Washington James Madison UniversityRadford UniversityOld Dominion UniversityGeorge Mason UniversityVirginia Community College SystemChristopher Newport University Longwood UniversitySouthwest Virginia Higher Education CenterRoanoke Higher Education AuthorityInnovation and Entrepreneurship Investment AuthorityInstitute for Advanced Learning and ResearchSouthern Virginia Higher Education Center New College Institute

Commonwealth of Virginia 265
The Virginia Economic Development Partnership works to enhance and increase the Commonwealth’s commerce and trade.
The Virginia Outdoors Foundation promotes preservation and fundraising for the purchase of preservation land.
The Virginia Port Authority is empowered to maintain and operate Virginia's harbors and ports.
The Virginia Tourism Authority promotes tourism and film production industries of the Commonwealth.
The Virginia Foundation for Healthy Youth determines the appropriate recipients of monies in the Virginia Tobacco Set-tlement Fund.
The Tobacco Region Revitalization Commission (formerly the Tobacco Indemnification and Revitalization Commission) determines the appropriate recipients of monies in the Tobacco Indemnification and Community Revitalization Fund.
The Hampton Roads Sanitation District Commission operates a sewage system for 17 localities in the Chesapeake Bay Area.
The Virginia Biotechnology Research Partnership Authority assists in the development of a biotechnology research park.
The Virginia Small Business Financing Authority assists small businesses in the Commonwealth in obtaining financing for new businesses or the expansion of existing businesses.
The Virginia School for the Deaf and Blind Foundation op-erates exclusively for the benefit of the Virginia School for the Deaf and Blind.
The Science Museum of Virginia Foundation operates to implement and fund projects and operations of the Science Museum of Virginia.
The Virginia Commercial Space Flight Authority dissemi-nates knowledge pertaining to scientific and technological re-search and development among public and private entities in-cluding, but not limited to, knowledge in the area of commercial space flight, and to promote industrial and economic develop-ment.
The Danville Science Center, Inc., promotes programs, pro-jects and operations to educate students.
The Virginia Museum of Fine Arts Foundation implements and funds programs, projects, and operations of the Virginia Museum of Fine Arts.
The A. L. Philpott Manufacturing Extension Partnershippromotes industrial expansion by providing consulting services to manufacturers.
The Virginia University Research Partnership oversaw the administration of grant payments for use by a non-profit, public benefit research institute that conducted research and devel-opment for government agencies, commercial businesses, foundations, and other organizations. The Partnership ceased operations during fiscal year 2016.
The Fort Monroe Authority assists in formulating a reuse plan for Fort Monroe.
The Assistive Technology Loan Fund Authority provides assistance with loans and in the purchase of assistive technol-ogy or other equipment to enable Virginians with disabilities to become more independent.
The Virginia Sesquicentennial of the American Civil War Foundation was created to prepare for and commemorate the sesquicentennial of Virginia's participation in the American Civil War.
The Virginia Land Conservation Foundation acquires inter-ests in preservation land and provides grants to other entities to acquire interests in preservation land.
The Virginia Arts Foundation works to promote the arts in the Commonwealth.
The Library of Virginia Foundation promotes and supports the Library of Virginia.
The Virginia Health Workforce Development Authority pro-vides assistance to the health professions.

266 Commonwealth of Virginia
Combining Statement of Net Position – Nonmajor Component UnitsJune 30, 2016(Dollars in Thousands)
Assets and Deferred Outflows of ResourcesCash and Cash Equivalents $ 205,974 $ 180,613 $ 519,323 $ 48,119Investments 7,693,520 424,840 1,735,174 56,932Receivables, Net 385,888 110,323 459,024 20,160Contributions Receivable, Net 91,042 93,428 41,228 23,085Due from Primary Government 5,320 33,855 7,424 -Due from Component Units 14,238 19,731 10,796 7,227Inventory 26,297 16,528 26,329 575Prepaid Items 51,924 18,867 14,472 2,003Other Assets 29,962 4,779 20,590 1,786Restricted Cash and Cash Equivalents 12,825 117,828 64,818 42,910Restricted Investments 740,537 822,240 538,242 673,291Other Restricted Assets 12,566 14,821 20,013 159,603Nondepreciable Capital Assets 424,481 280,299 247,646 217,712Depreciable Capital Assets, Net 3,233,678 1,676,355 1,749,424 652,751Total Assets 12,928,252 3,814,507 5,454,503 1,906,154
Deferred Outflows of Resources 92,864 58,078 123,070 22,685Total Assets and Deferred Outf low s of Resources 13,021,116 3,872,585 5,577,573 1,928,839
Liabilities and Deferred Inflows of ResourcesAccounts Payable 285,694 140,264 239,142 40,702Amounts Due to Other Governments - - - -Due to Primary Government 15,457 3,913 17,621 1,240Due to Component Units - - - -Due to External Parties (Fiduciary Funds) 6,490 6,734 6,342 1,406Unearned Revenue 103,218 44,670 50,170 15,045Obligations Under Securities Lending Program - - - 1Other Liabilities 538,201 57,845 182,236 9,386Loans Payable to Primary Government - - - 2,005Claims Payable:Due Within One Year - - 90,466 -Due in More Than One Year - - 41,161 -
Long-term Liabilities:Due Within One Year 141,394 66,806 96,766 26,032Due in More Than One Year 2,754,904 1,249,733 1,485,761 436,430Total Liabilities 3,845,358 1,569,965 2,209,665 532,247
Deferred Inflows of Resources 111,711 30,173 37,499 9,184Total Liabilities and Deferred Inflow s of Resources 3,957,069 1,600,138 2,247,164 541,431
Net PositionNet Investment in Capital Assets 1,996,603 1,285,923 1,181,692 616,375Restricted For:Nonexpendable:Higher Education 1,299,151 479,547 329,857 547,038Other - - - -
Expendable:Capital Projects/Construction/Capital Acquisition - - - -Debt Service - - - -Gifts and Grants - - - -Higher Education 3,507,927 591,304 304,633 306,487Other - - - -
Unrestricted 2,260,366 (84,327) 1,514,227 (82,492)Total Net Position (Deficit) $ 9,064,047 $ 2,272,447 $ 3,330,409 $ 1,387,408
of VirginiaUniversity
College ofWilliam
and Mary
VirginiaPolytechnicInstitute and
State University
VirginiaCommonwealth
University
The

Commonwealth of Virginia 267
$ 23,837 $ 25,531 $ 19,398 $ 17,523 $ 176,554 $ 99,317 $ 121,712 $ 260,90873,657 801 17,435 2,345 14,345 5,567 25,290 6,7043,091 6,283 4,825 4,057 8,955 5,730 81,691 39,221
29,971 - 934 3,280 10,585 1,843 11,684 35,950137 396 1,169 210 18,886 7,549 1,173 48
11,461 3,316 6,239 76 7,557 3,988 6,379 9,4736,915 - - 579 900 515 475 1,2001,283 2,896 2,288 845 10,690 4,023 4,715 11,537
72 82 1,416 1,102 28 4,925 332 6,4875,941 11,127 5,336 13,962 3,977 2,073 33,554 28,352
321,110 45,194 9,482 37,738 86,485 49,040 209,713 147,3045,708 - - - 6,265 202 - 10,348
100,984 26,872 29,704 57,995 135,594 69,301 128,959 103,828230,022 284,035 234,890 387,934 909,726 278,942 525,665 1,238,900814,189 406,533 333,116 527,646 1,390,547 533,015 1,151,342 1,900,260
3,057 9,246 5,430 4,440 27,169 10,284 27,136 40,222817,246 415,779 338,546 532,086 1,417,716 543,299 1,178,478 1,940,482
19,457 7,488 13,337 10,346 41,807 22,282 52,254 59,8971,359 - - - - - - 4
296 358 402 348 1,588 683 1,163 1,500- - - - - - 3,225 -
235 244 544 181 3,037 287 1,157 2,657936 2,236 3,044 1,555 16,074 4,104 14,792 50,71594 113 73 - 686 496 413 1,029
1,113 3,484 4,224 3,806 13,448 5,624 11,461 18,922- - - - - - - 12,500
- - - - - - - -- - - - - - - -
2,570 8,373 3,971 6,819 20,243 3,884 24,343 45,805109,369 191,978 140,883 337,981 484,426 134,709 473,657 1,035,436135,429 214,274 166,478 361,036 581,309 172,069 582,465 1,228,465
2,235 5,631 7,018 3,574 10,763 4,773 9,252 19,296137,664 219,905 173,496 364,610 592,072 176,842 591,717 1,247,761
312,701 199,983 196,993 196,107 751,437 300,507 413,470 606,946
177,689 19,938 9,532 38,793 62,504 26,845 141,368 92,259- - - - - - - -
- - - - - - - -- - - - - - - -- - - - - - - -
156,733 23,133 17,772 14,740 68,212 30,036 103,715 97,687- - - - - - - -
32,459 (47,180) (59,247) (82,164) (56,509) 9,069 (71,792) (104,171)$ 679,582 $ 195,874 $ 165,050 $ 167,476 $ 825,644 $ 366,457 $ 586,761 $ 692,721
Virginia
University
George
University
Old
UniversityRadford
VirginiaMilitaryInstitute University
MasonDominionof MaryWashington
UniversityMadisonJames
UniversityState State
University
Norfolk
Continued on next page

268 Commonwealth of Virginia
Combining Statement of Net Position – Nonmajor Component Units (Continued from previous page)June 30, 2016(Dollars in Thousands)
Assets and Deferred Outflows of ResourcesCash and Cash Equivalents $ 267,665 $ 38,624 $ 42,018 $ -Investments 77,833 204 13,224 -Receivables, Net 16,234 1,431 5,518 1,623Contributions Receivable, Net 10,802 14,059 2,900 -Due from Primary Government 1,285 72 5,549 34Due from Component Units 17,337 443 1,475 -Inventory 1,470 246 585 -Prepaid Items 14,402 1,751 2,896 -Other Assets 119 2,694 1,173 352Restricted Cash and Cash Equivalents 27,346 20,165 29,205 -Restricted Investments 174,878 23,898 63,916 -Other Restricted Assets - 1,152 111 -Nondepreciable Capital Assets 126,342 66,127 51,167 319Depreciable Capital Assets, Net 1,263,323 549,323 273,286 10,728Total Assets 1,999,036 720,189 493,023 13,056
Deferred Outflows of Resources 66,042 11,782 6,438 195Total Assets and Deferred Outf low s of Resources 2,065,078 731,971 499,461 13,251
Liabilities and Deferred Inflows of ResourcesAccounts Payable 88,306 16,455 7,601 339Amounts Due to Other Governments 4,398 - - -Due to Primary Government 3,260 432 405 31Due to Component Units - - - -Due to External Parties (Fiduciary Funds) 8,430 378 180 21Unearned Revenue 54,537 1,255 2,131 -Obligations Under Securities Lending Program 4 155 227 -Other Liabilities 13,240 5,573 8,689 -Loans Payable to Primary Government 4,400 - - -Claims Payable:Due Within One Year - - - -Due in More Than One Year - - - -
Long-term Liabilities:Due Within One Year 26,182 18,107 7,896 225Due in More Than One Year 783,595 332,100 242,783 2,601Total Liabilities 986,352 374,455 269,912 3,217
Deferred Inflows of Resources 45,905 3,018 2,793 197Total Liabilities and Deferred Inflow s of Resources 1,032,257 377,473 272,705 3,414
Net PositionNet Investment in Capital Assets 1,263,286 345,205 176,725 10,580Restricted For:Nonexpendable:Higher Education 77,521 23,963 37,486 -Other - - - -
Expendable:Capital Projects/Construction/Capital Acquisition - - - -Debt Service - - - -Gifts and Grants - - - -Higher Education 92,492 16,487 21,650 -Other - - - -
Unrestricted (400,478) (31,157) (9,105) (743)Total Net Position (Deficit) $ 1,032,821 $ 354,498 $ 226,756 $ 9,837
NewportUniversity Center
Virginia
EducationHigher
LongwoodUniversity
VirginiaCommunity
CollegeSystem
Southwest
Christopher

Commonwealth of Virginia 269
$ 2,640 $ 9,112 $ 4,342 $ 973 $ 2,854 $ 2,296 $ 2,135 $ 104,743- 2,236 978 - 1,045 - - -
13 317 267 134 9 1,198 761 87,443- - - - 259 - - -- - - 52 273 - - -
124 - 53 46 28 - - -- - - - - - - 19,580
43 105 210 - 54 432 47 5,365127 47 - 1 - 19 1 -
- - 321 - - - 1,500 146,969- - - - 552 - - 1,188- - 576 - - - - -
1,786 5,401 200 - 546 - 5,417 225,18625,722 9,514 13,017 1,388 17,869 1,764 115 558,71730,455 26,732 19,964 2,594 23,489 5,709 9,976 1,149,191
56 - 68 450 220 1,632 - 18,28430,511 26,732 20,032 3,044 23,709 7,341 9,976 1,167,475
157 894 218 133 1,004 438 127 44,057- - - - - - - -- - - 17 5 - - 5- - - - - - - -- - - 15 5 - 117 7
26 331 1,391 - 31 75 - -- - - - - - - 341
18 240 22 - - - - 12,292- - - - - - - -
- - - - - - - -- - - - - - - -
143 200 64 119 38 556 70 26,091735 - 21 3,212 1,480 14,824 105 556,308
1,079 1,665 1,716 3,496 2,563 15,893 419 639,10143 - 52 190 92 1,223 - 5,486
1,122 1,665 1,768 3,686 2,655 17,116 419 644,587
26,712 14,915 13,217 1,388 18,415 1,764 5,532 299,198
- - - - 552 - - -- - - - - - 47 -
- - - - - - - 17,257- - - - - - - 44,018- - - - - - - -- - 877 - 1,052 - - -- - - - - - 1,526 -
2,677 10,152 4,170 (2,030) 1,035 (11,539) 2,452 162,415$ 29,389 $ 25,067 $ 18,264 $ (642) $ 21,054 $ (9,775) $ 9,557 $ 522,888
Virginia
Education Investment OutdoorsVirginia
Virginia
Education CollegeHigher Advanced NewEntrepreneurship
Roanoke
PartnershipInstitute Authority
SouthernInstitute for
Higher Economic VirginiaDevelopmentLearning Port
and Research CenterAuthorityAuthority Foundation
Innovation and
Continued on next page

270 Commonwealth of Virginia
Combining Statement of Net Position – Nonmajor Component Units (Continued from previous page)June 30, 2016(Dollars in Thousands)
Assets and Deferred Outflows of ResourcesCash and Cash Equivalents $ 4,844 $ 12,584 $ 11,307 $ 68,309Investments - - 271,313 123,553Receivables, Net 47 49 4,779 45,952Contributions Receivable, Net - - - -Due from Primary Government - - - -Due from Component Units - - - -Inventory - - - 28,106Prepaid Items 498 - 5 -Other Assets - 6 2,776 325Restricted Cash and Cash Equivalents - - 21,929 91,559Restricted Investments - - 192,682 -Other Restricted Assets - - 795 -Nondepreciable Capital Assets 811 - - 202,995Depreciable Capital Assets, Net 638 - - 997,409Total Assets 6,838 12,639 505,586 1,558,208
Deferred Outflows of Resources 919 183 145 25,638Total Assets and Deferred Outf low s of Resources 7,757 12,822 505,731 1,583,846
Liabilities and Deferred Inflows of ResourcesAccounts Payable 438 626 79 42,366Amounts Due to Other Governments - - - -Due to Primary Government - 10 7 -Due to Component Units - - - -Due to External Parties (Fiduciary Funds) 69 11 9 -Unearned Revenue - - - -Obligations Under Securities Lending Program - 80 54 -Other Liabilities 5 819 2,660 17,880Loans Payable to Primary Government - - - -Claims Payable:Due Within One Year - - - -Due in More Than One Year - - - -
Long-term Liabilities:Due Within One Year 331 36 25 81,149Due in More Than One Year 8,311 2,080 1,540 832,337Total Liabilities 9,154 3,662 4,374 973,732
Deferred Inflows of Resources 498 121 94 8,510Total Liabilities and Deferred Inflow s of Resources 9,652 3,783 4,468 982,242
Net PositionNet Investment in Capital Assets 1,449 - - 410,287Restricted For:Nonexpendable:Higher Education - - - -Other - - - -
Expendable:Capital Projects/Construction/Capital Acquisition - - 215,081 -Debt Service - - - 23,798Gifts and Grants - - - -Higher Education - - - -Other - - - -
Unrestricted (3,344) 9,039 286,182 167,519Total Net Position (Deficit) $ (1,895) $ 9,039 $ 501,263 $ 601,604
RegionRevitalizationfor Healthy
TobaccoSanitationVirginia Foundation
Authority Youth Commission CommissionDistrictTourism
VirginiaHampton
Roads

Commonwealth of Virginia 271
$ 4,346 $ 4,316 $ 3,480 $ 605 $ 5,814 $ 56 $ 3,046 $ 1,3816,501 - 1,420 536 - 308 6,959 -
24,734 12,049 - 16 2,218 2 - 583- - - 3,250 - 7 11,467 -- - - - - - - -- - - - 3,225 - - -- - - - - 5 - -3 - - 3 454 - - -
344 - - - 4,341 - 5,179 -- 22,805 - 7,792 - 258 18,959 -- - - 13,657 - 503 224,996 -- 14,880 - - - - - -
3,369 - - - 2,661 - - -59 - - 2 107,989 28 639 1
39,356 54,050 4,900 25,861 126,702 1,167 271,245 1,9651,482 600 - - - - - -
40,838 54,650 4,900 25,861 126,702 1,167 271,245 1,965
25 66 - 1 1,784 47 1,315 477- - - - - - - -- 2 - 774 - - - -- - - - - - - -- 5 - - - - - -4 - - - 1,000 - - 17- 63 - - - - - -
11 1,167 - - - - 732 -- - - - - - - -
- - - - - - - -- - - - - - - -
3,665 - - 2 - - 1,278 18923,121 1,125 - 7 - - 44,230 -26,826 2,428 - 784 2,784 47 47,555 683
52 816 - - - - - -26,878 3,244 - 784 2,784 47 47,555 683
3,428 - - 2 110,650 28 639 1
- - - - - - - -- - - 5,999 - 254 152,752 -
- - - 6,189 - - 161 -- - - - - - - -
184 37,410 - 11,728 - 507 88,803 -- - - - - - - -
345 6,676 - - 5,086 - - -10,003 7,320 4,900 1,159 8,182 331 (18,665) 1,281
$ 13,960 $ 51,406 $ 4,900 $ 25,077 $ 123,918 $ 1,120 $ 223,690 $ 1,282
Business DanvilleExtension
A. L. PhilpottManufacturing
VirginiaSmall School Science
FoundationFoundationAuthorityPartnership Financing
Commercialand Blind
for the DeafVirginia
MuseumResearch
AuthoritySpace Flight
Center, Inc.Science of Fine Arts
Museum
PartnershipAuthority
Virginia Virginia
Foundationof Virginia
VirginiaBiotechnology
Continued on next page

272 Commonwealth of Virginia
Combining Statement of Net Position – Nonmajor Component Units (Continued from previous page)June 30, 2016(Dollars in Thousands)
Assets and Deferred Outflows of ResourcesCash and Cash Equivalents $ - $ 3,229 $ 6,484 $ 280Investments - - - -Receivables, Net - 1,411 2,739 -Contributions Receivable, Net - - - -Due from Primary Government - - - -Due from Component Units - - - -Inventory - - - -Prepaid Items - 209 - -Other Assets - - - -Restricted Cash and Cash Equivalents - 289 - -Restricted Investments - - - -Other Restricted Assets - - - -Nondepreciable Capital Assets - 237 - -Depreciable Capital Assets, Net - 86 - -Total Assets - 5,461 9,223 280
Deferred Outflows of Resources - 333 - -Total Assets and Deferred Outf low s of Resources - 5,794 9,223 280
Liabilities and Deferred Inflows of ResourcesAccounts Payable - 1,234 - -Amounts Due to Other Governments - - - -Due to Primary Government - - - -Due to Component Units - - - -Due to External Parties (Fiduciary Funds) - - - -Unearned Revenue - 10 - -Obligations Under Securities Lending Program - - - -Other Liabilities - 296 - -Loans Payable to Primary Government - - - -Claims Payable:Due Within One Year - - - -Due in More Than One Year - - - -
Long-term Liabilities:Due Within One Year - 49 6 -Due in More Than One Year - 2,519 - -Total Liabilities - 4,108 6 -
Deferred Inflows of Resources - 154 - -Total Liabilities and Deferred Inflow s of Resources - 4,262 6 -
Net PositionNet Investment in Capital Assets - 323 - -Restricted For:Nonexpendable:Higher Education - - - -Other - 5 - -
Expendable:Capital Projects/Construction/Capital Acquisition - - - -Debt Service - - - -Gifts and Grants - - 29 280Higher Education - - - -Other - - - -
Unrestricted - 1,204 9,188 -Total Net Position (Deficit) $ - $ 1,532 $ 9,217 $ 280
of theAssistive
Civil WarLoan Fund
Sesquicentennial
ResearchAuthorityAuthority
Monroe
Virginia
Partnership Foundation
University AmericanFort TechnologyVirginia

Commonwealth of Virginia 273
$ 4,435 $ 7 $ 3 $ 71 $ 2,310,808- - 1,284 - 10,564,004- - - - 1,338,775- - 546 - 386,320- - - - 83,432- - - - 123,212- - 126 - 130,431- - 22 - 152,042- - - - 89,065- 1,038 53 - 732,891- - 1,510 - 4,378,156- - - - 247,040- - - - 2,515,939- - 7 - 15,233,946
4,435 1,045 3,551 71 38,286,061- - - - 558,148
4,435 1,045 3,551 71 38,844,209
- - 27 - 1,140,884- - - - 5,761- - - - 49,517- - - - 3,225- - - - 38,561- - - - 367,367
28 7 - - 3,864- - 30 - 913,424- - - - 18,905
- - - - 90,466- - - - 41,161
- - - - 613,427- - - - 11,688,301
28 7 57 - 14,974,863- - - - 320,353
28 7 57 - 15,295,216
- - 7 - 10,762,488
- - - - 3,364,043- 1,038 1,676 - 161,771
- - - - 238,688- - - - 67,816- - 452 - 139,393- - - - 5,354,937- - - 71 13,704
4,407 - 1,359 - 3,446,153$ 4,407 $ 1,038 $ 3,494 $ 71 $ 23,548,993
UnitsFoundation
TotalNonmajor
ComponentLibrary
of VirginiaFoundation Authority
DevelopmentConservation
VirginiaHealth
WorkforceVirginiaArts
Foundation
LandVirginia

274 Commonwealth of Virginia
Combining Statement of Activities – Nonmajor Component UnitsFor the Fiscal Year Ended June 30, 2016(Dollars in Thousands)
Higher EducationUniversity of Virginia $ 3,734,868 $ 2,719,484 $ 512,497 $ 41,720 $ (461,167)Virginia Polytechnic Institute and State University 1,469,371 774,678 379,505 91,388 (223,800)Virginia Commonw ealth University 3,677,531 3,316,558 237,885 43,308 (79,780)The College of William and Mary 485,594 272,167 62,097 53,188 (98,142)Virginia Military Institute 98,121 49,381 9,442 57,248 17,950Virginia State University 140,220 51,179 32,397 29,298 (27,346)Norfolk State University 158,334 51,375 30,464 16,938 (59,557)University of Mary Washington 139,853 81,887 3,943 10,029 (43,994)James Madison University 508,337 380,384 36,279 71,983 (19,691)Radford University 205,947 118,355 14,605 42,523 (30,464)Old Dominion University 496,468 265,836 97,447 30,075 (103,110)George Mason University 857,422 548,457 192,558 59,844 (56,563)Virginia Community College System 1,251,474 387,505 363,081 74,163 (426,725)Christopher New port University 164,626 114,157 8,154 6,274 (36,041)Longw ood University 157,669 94,340 11,643 10,906 (40,780)Southw est Virginia Higher Education Center 4,130 1,485 370 64 (2,211)Roanoke Higher Education Authority 3,401 1,241 77 863 (1,220)Innovation and Entrepreneurship Investment Authority 17,350 5,580 1,061 190 (10,519)Institute for Advanced Learning and Research 8,449 2,231 1,000 258 (4,960)Southern Virginia Higher Education Center 7,916 3,084 1,746 59 (3,027)New College Institute 6,725 618 2,027 130 (3,950)
Total Higher Education 13,593,806 9,239,982 1,998,278 640,449 (1,715,097)
Other Nonmajor Component UnitsVirginia Economic Development Partnership 22,423 491 2,102 - (19,830)Virginia Outdoors Foundation 3,563 1,387 1,377 - (799)Virginia Port Authority 475,743 448,428 6,391 15,981 (4,943)Virginia Tourism Authority 24,678 881 1,308 - (22,489)Virginia Foundation for Healthy Youth 9,376 - 50 - (9,326)Tobacco Region Revitalization Commission 46,825 - - - (46,825)Hampton Roads Sanitation District Commission 218,902 244,580 - 14,389 40,067Virginia Biotechnology Research Partnership Authority 2,259 2,419 - 403 563Virginia Small Business Financing Authority 1,932 9,241 - - 7,309Virginia School for the Deaf and Blind Foundation 88 - - - (88)Science Museum of Virginia Foundation 3,928 - (392) 959 (3,361)Virginia Commercial Space Flight Authority 33,838 600 7,050 10,261 (15,927)Danville Science Center, Inc. 381 13 119 - (249)Virginia Museum of Fine Arts Foundation 24,575 - (8,289) - (32,864)A. L. Philpott Manufacturing Extension Partnership 4,645 3,040 1,703 - 98Virginia University Research Partnership 4 - - - (4)Fort Monroe Authority 13,132 4,803 1,057 387 (6,885)Assistive Technology Loan Fund Authority 469 - 1 - (468)Virginia Sesquicentennial of the American Civil War Foundation 29 - 6 - (23)Virginia Land Conservation Foundation 2,903 - 1,123 - (1,780)Virginia Arts Foundation - 38 - - 38Library of Virginia Foundation 602 204 (6) - (404)Virginia Health Workforce Development Authority 850 - 803 - (47)
Total Other Nonmajor 891,145 716,125 14,403 42,380 (118,237)Total Nonmajor Component Units $ 14,484,951 $ 9,956,107 $ 2,012,681 $ 682,829 $ (1,833,334)
Program Revenues
CapitalOperating
Expenses ServicesCharges for
ContributionsGrants and
ContributionsGrants and Net (Expenses)
Revenue

Commonwealth of Virginia 275
$ 159,757 $ 29,231 $ (72,776) $ 17,676 $ 40,021 $ (287,258) $ 9,351,305 $ 9,064,047250,649 7,334 6,026 20,313 26,482 87,004 2,185,443 2,272,447206,986 1,728 (37,044) 6,317 25,082 123,289 3,207,120 3,330,40972,407 16,179 1,552 25,783 11,644 29,423 1,357,985 1,387,40814,169 - (1,998) 586 24,523 55,230 624,352 679,58246,626 2,523 (668) 2,702 565 24,402 171,472 195,87458,429 1,997 513 1,608 569 3,559 161,491 165,05028,632 958 (654) 868 5,202 (8,988) 176,464 167,47693,560 536 156 2,373 4,634 81,568 744,076 825,64456,493 174 (757) 1,613 752 27,811 338,646 366,457
138,374 - (20) 1,665 1,865 38,774 547,987 586,761148,917 2,020 1,962 4,539 4,810 105,685 587,036 692,721422,530 7,049 6,673 16,811 7,957 34,295 998,526 1,032,82131,782 534 (803) - 2,771 (1,757) 356,255 354,49830,699 505 (1,554) 230 1,623 (9,277) 236,033 226,7562,100 - - - - (111) 9,948 9,8371,216 15 11 - - 22 29,367 29,3899,948 - 2,473 99 - 2,001 23,066 25,0675,817 48 (72) 21 - 854 17,410 18,2642,468 465 - - - (94) (548) (642)1,937 - 68 1 - (1,944) 22,998 21,054
1,783,496 71,296 (96,912) 103,205 158,500 304,488 21,146,432 21,450,920
20,764 - 13 340 - 1,287 (11,062) (9,775)1,753 66 13 - - 1,033 8,524 9,557
42,367 - 723 156 - 38,303 484,585 522,88823,001 - 20 - - 532 (2,427) (1,895)
- 9,248 60 - - (18) 9,057 9,039- - 18,151 3,293 - (25,381) 526,644 501,263- - 2,313 2,399 - 44,779 556,825 601,604- - 489 - - 1,052 12,908 13,960- - 111 1,537 - 8,957 42,449 51,406- 2 (77) 28 - (135) 5,035 4,900- 1,502 (13) - 524 (1,348) 26,425 25,077
21,600 - - - - 5,673 118,245 123,918- 110 (12) - 42 (109) 1,229 1,120- 8,834 (236) 62 14,956 (9,248) 232,938 223,690
399 - - - - 497 785 1,282- - - - - (4) 4 -
5,285 - - 168 - (1,432) 2,964 1,532- - 176 - - (292) 9,509 9,217- - - - - (23) 303 280
4,000 - - - - 2,220 2,187 4,407- - - 7 - 45 993 1,038- 198 (54) 11 791 542 2,952 3,494- - - - - (47) 118 71
119,169 19,960 21,677 8,001 16,313 66,883 2,031,190 2,098,073$ 1,902,665 $ 91,256 $ (75,235) $ 111,206 $ 174,813 $ 371,371 $ 23,177,622 $ 23,548,993
OperatingAppropriations
General Revenues
UnrestrictedContributionsto Permanent
June 30(Deficit)
as restatedNet PositionChange in July 1,
Miscellaneous
Net PositionNet Position
Governmentfrom Primary Grants and
Endowments
(Deficit)
Contributions EarningsInvestment and Term

276 Commonwealth of Virginia

Commonwealth of Virginia 277
Debt Schedules

278 Commonwealth of Virginia
Summary Schedule – Total Debt and Other Long-term Obligations of the CommonwealthLast Five Fiscal Years(Dollars in Thousands)
For the Fiscal Year Ended June 30,
Tax-Supported Debt: Primary Government: General Obligation Bonds (1): Section 9(b) Bonds (2) $ 571,915 $ 642,181 $ 706,192 $ 752,493 $ 831,148 Section 9(c) Bonds (2) 29,717 33,190 36,677 39,499 42,593 Subtotal - General Obligation Bonds 601,632 675,371 742,869 791,992 873,741 Nongeneral Obligation Debt: Section 9(d) Bonds (2) 5,163,651 5,175,570 4,748,217 5,029,659 5,222,270 Other Long-term Debt and Obligations (3) 5,729,566 5,366,682 3,287,907 3,004,676 2,742,274 Total Primary Government 11,494,849 11,217,623 8,778,993 8,826,327 8,838,285 Component Units: General Obligation Bonds (1): Section 9(c) Bonds (2) 877,118 936,857 925,086 877,858 906,474 Subtotal - General Obligation Bonds 877,118 936,857 925,086 877,858 906,474 Nongeneral Obligation Bonds: Section 9(d) Bonds (2) 4,351,059 3,839,279 3,542,518 2,990,382 2,747,447 Other Long-term Debt (3) 4,154,182 3,756,274 2,207,305 1,944,418 1,701,305 Total Component Units 9,382,359 8,532,410 6,674,909 5,812,658 5,355,226Total Tax-Supported Debt 20,877,208 19,750,033 15,453,902 14,638,985 14,193,511Debt Not Supported by Taxes: Primary Government: Total Primary Government (2) 3,009,647 3,472,475 3,510,428 3,320,450 2,915,671 Component Units: Section 9(d) Moral Obligation Bonds 907,209 877,875 831,165 836,656 801,384 Section 9(d) Other Debt 2,081,823 2,038,579 1,826,602 1,538,395 1,541,802 Other Long-term Debt (4) 14,220,896 14,113,641 14,351,277 15,341,291 15,088,830 Foundations (5) 1,714,748 1,685,948 1,669,241 1,583,178 1,570,447 Total Component Units 18,924,676 18,716,043 18,678,285 19,299,520 19,002,463Total Debt Not Supported by Taxes 21,934,323 22,188,518 22,188,713 22,619,970 21,918,134Total Debt of the Commonwealth $ 42,811,531 $ 41,938,551 $ 37,642,615 $ 37,258,955 $ 36,111,645
Section 9(b) Debt: Public Facilities Bonds $ 571,915 $ 642,181 $ 706,192 $ 752,493 $ 831,148 Subtotal 9(b) Debt 571,915 642,181 706,192 752,493 831,148 Section 9(c) Debt: Higher Educational Institution Bonds 877,118 936,857 925,086 877,858 906,474 Transportation Facilities Bonds 14,562 17,154 19,632 21,961 24,210 Parking Facilities Bonds 15,155 16,036 17,045 17,538 18,383 Subtotal 9(c) Debt 906,835 970,047 961,763 917,357 949,067 Total General Obligation Debt (1) $ 1,478,750 $ 1,612,228 $ 1,667,955 $ 1,669,850 $ 1,780,215
20152016 2014 2013 2012
2016 2015 2014 2013 2012
(1) Total general obligation debt for the fiscal year ended.(2) Beginning with fiscal year 2014, GASB Statement No. 65 removed deferrals of debt defeasance from the debt balances. Balances reported in
prior fiscal years netted the deferrals against the debt balances. All amounts are net of unamortized discounts and premiums.(3) Includes capital lease obligations, notes payable, installment purchase obligations, pension liability, and the long-term portion of the liability for
compensated absences.(4) Includes bonds payable, notes payable, and other debt not supported by taxes. (5) Foundations represent FASB reporting entities defined in Note 1.B.

Commonwealth of Virginia 279
Tax-Supported Debt and Other Long-term ObligationsLast Five Fiscal Years(Dollars in Thousands)
For the Fiscal Year Ended June 30,
Primary Government: General Obligation Debt (1) (4): Section 9(b) Debt Public Facilities (2) $ 571,915 $ 642,181 $ 706,192 $ 752,493 $ 831,148 Subtotal Section 9(b) Debt 571,915 642,181 706,192 752,493 831,148 Section 9(c) Debt Parking Facilities (2) 15,155 16,036 17,045 17,538 18,383 Transportation Facilities (2) 14,562 17,154 19,632 21,961 24,210 Subtotal Section 9(c) Debt 29,717 33,190 36,677 39,499 42,593 Subtotal General Obligation Debt 601,632 675,371 742,869 791,992 873,741 Nongeneral Obligation Debt: Section 9(d) Debt: Transportation Debt (2) 2,722,238 2,552,123 2,373,382 2,495,312 2,655,481 Virginia Public Building Authority (2) 2,441,413 2,623,447 2,374,835 2,534,347 2,566,789 Subtotal Section 9(d) Debt 5,163,651 5,175,570 4,748,217 5,029,659 5,222,270 Other Long-term Debt: Transportation Notes Payable - - - 8,000 8,000 Regional Jail Construction - - - 837 2,748 Capital Lease Obligations 46,524 57,948 60,916 71,835 77,400 Installment Purchase Obligations 108,877 113,373 113,936 106,367 114,959 Economic Development Authority Obligations 44,712 51,249 57,621 77,472 81,747 Tax Refund Note - - - 20,319 40,639 Aviation Notes Payable (3) 114 307 529 764 1,050 Subtotal Other Long-term Debt 200,227 222,877 233,002 285,594 326,543 Other Long-term Obligations: Compensated Absences 317,053 311,406 321,520 317,528 315,176 Net Pension Liability 4,419,257 4,133,117 2,114,803 1,875,011 1,660,768 OPEB Liability 734,064 654,173 568,764 493,443 406,969 Pollution Remediation Liability 11,308 11,954 13,186 3,494 5,171 Other Liabilities 47,657 33,155 36,632 29,606 27,647 Subtotal Other Long-term Obligations 5,529,339 5,143,805 3,054,905 2,719,082 2,415,731Total Primary Government 11,494,849 11,217,623 8,778,993 8,826,327 8,838,285
Component Units: General Obligation Bonds (1) (4): Section 9(c) Debt Higher Educational Institutions (2) 877,118 936,857 925,086 877,858 906,474 Subtotal General Obligation Debt 877,118 936,857 925,086 877,858 906,474 Nongeneral Obligation Debt: Section 9(d) Debt: Virginia Port Authority (2) 275,256 288,446 222,044 228,619 237,321 Innovation & Entrepreneurship Investment Authority - - - 1,220 2,375 Virginia College Building Authority 4,049,060 3,520,214 3,286,119 2,725,259 2,470,589 Virginia Biotechnology Research Partnership Authority 26,743 30,619 34,355 35,284 37,162 Subtotal Section 9(d) Debt 4,351,059 3,839,279 3,542,518 2,990,382 2,747,447 Other Long-term Debt: Capital Lease Obligations 71,403 77,456 82,189 85,631 91,166 Installment Purchase Obligations 50,825 63,812 76,526 86,315 100,161 Subtotal Other Long-term Debt 122,228 141,268 158,715 171,946 191,327 Other Long-term Obligations: Compensated Absences 293,026 288,320 280,237 265,246 253,845 Net Pension Liability 2,777,020 2,496,179 1,066,638 924,512 785,472 OPEB Liability 961,908 830,507 701,715 582,714 470,661 Subtotal Other Long-term Obligations 4,031,954 3,615,006 2,048,590 1,772,472 1,509,978Total Component Units 9,382,359 8,532,410 6,674,909 5,812,658 5,355,226Total Tax-Supported Debt $ 20,877,208 $ 19,750,033 $ 15,453,902 $ 14,638,985 $ 14,193,511
2016 2015 2014 2013 2012
(1) The general obligation debt is the only debt or long-term obligation that is backed by the full faith and credit of the Commonwealth.(2) Beginning with fiscal year 2014, GASB Statement No. 65 removed deferrals of debt defeasance from the debt balances. Balances reported in
prior fiscal years netted the deferrals against the debt balances. All amounts are net of unamortized discounts and premiums.(3) Reflected as Notes Payable in Note 26, Long-term Liabilities.(4) See Note 1 on previous page.

280 Commonwealth of Virginia
Debt and Other Long-term Obligations Not Supported by TaxesLast Five Fiscal Years(Dollars in Thousands)
For the Fiscal Year Ended June 30,
Primary Government: Other Long-term Debt & Obligations: Federal Reimbursement Anticipation Notes Payable (1) $ - $ 30,624 $ 60,905 $ 89,836 $ 182,450 Grant Anticipation Notes (GARVEES) (1) 663,147 705,574 746,812 473,733 298,728 Route 460 Funding Corporation of Virginia - 320,110 317,305 314,662 - Net Pension Liability 140,522 125,294 57,400 48,798 42,249 OPEB Liability 25,113 22,051 18,709 15,688 12,751 Capital Lease Obligations 5,359 5,708 6,072 6,453 449 Compensated Absences 10,003 10,123 10,102 9,727 9,267 Tuition Benefits Payable 2,035,608 2,116,769 2,140,430 2,189,079 2,175,296 Lottery Prizes Payable 129,895 136,222 152,693 172,474 194,481Total Primary Government 3,009,647 3,472,475 3,510,428 3,320,450 2,915,671
Component Units: Section 9(d) Moral Obligation Debt: (1) Virginia Resources Authority 907,209 877,875 831,165 836,656 801,384 Subtotal Section 9(d) Moral Obligation Debt 907,209 877,875 831,165 836,656 801,384
Section 9(d) Other Debt: Higher Educational Institutions (1): Auxiliary Enterprise Revenue Bonds 1,579,951 1,531,950 1,315,358 1,269,149 1,205,869 Teaching Hospitals Revenue Bonds (4) 501,872 506,629 511,244 269,246 335,933 Subtotal Section 9(d) Other Debt 2,081,823 2,038,579 1,826,602 1,538,395 1,541,802
Other Long-term Debt: Virginia Housing Development Authority (1) (2) 4,320,935 4,498,847 4,931,982 5,742,689 5,945,174 Hampton Roads Sanitation District Commission 879,294 748,397 766,353 790,503 639,286 Virginia Public School Authority (1) (2) 3,655,914 3,551,741 3,523,633 3,483,366 3,378,084 Virginia Port Authority 252,631 256,656 272,831 276,816 281,978 Virginia Resources Authority 2,704,321 2,631,153 2,536,711 2,582,923 2,478,243 Notes Payable 2,041,726 2,083,619 2,067,038 2,179,181 2,070,152 Net Pension Liability 44,339 41,516 - - - Other Long-term Debt 321,736 301,712 252,729 285,813 295,913 Foundations (5) 1,714,748 1,685,948 1,669,241 1,583,178 1,570,447 Subtotal Other Long-term Debt 15,935,644 15,799,589 16,020,518 16,924,469 16,659,277
Subtotal Section 9(d) and Other Debt 18,017,467 17,838,168 17,847,120 18,462,864 18,201,079Total Component Units 18,924,676 18,716,043 18,678,285 19,299,520 19,002,463Total Debt Not Supported by Taxes (3) $ 21,934,323 $ 22,188,518 $ 22,188,713 $ 22,619,970 $ 21,918,134
2016 2015 2014 2013 2012
(1) Beginning with fiscal year 2014, GASB Statement No. 65 removed deferrals of debt defeasance from the debt balances. Balances reported in prior fiscal years netted the deferrals against the debt balances. All amounts are net of unamortized discounts and premiums.
(2) Includes notes payable and/or installment purchase obligations.(3) These amounts are not backed by the full faith and credit of the Commonwealth.(4) Includes the Virginia Commonwealth University Health System Authority.(5) Foundations represent FASB reporting entities defined in Note 1.B.

Commonwealth of Virginia 281
Authorized and Unissued Tax-Supported DebtFor the Fiscal Year Ended June 30, 2016(Dollars in Thousands)
Section 9(c) Debt (Primary Government): Higher Educational Institution Bonds $ 667,562 $ 40,986 $ - $ - $ 708,548 Parking Facilities Bonds 226 - - - 226 Subtotal Section 9(c) Debt 667,788 40,986 - - 708,774
Section 9(d) Debt: Primary Government: Transportation Contract Revenue Bonds (Northern Virginia Transportation District Fund Program) 24,700 - - - 24,700 U.S. Route 58 Corridor Development Program 595,700 - - - 595,700 Transportation Capital Projects Revenue Bonds 1,187,335 - 273,740 (26,260) 887,335
Component Units: Virginia Public Building Authority (Projects) 688,763 972,167 - 32,411 1,693,341 Virginia Public Building Authority (Jails) 84,299 3,900 48,865 (518) 38,816 Virginia College Building Authority (21st Century) 1,005,656 1,536,106 568,700 (53,560) 1,919,502 Virginia College Building Authority (Equipment Program) 138,436 168,470 121,830 (16,606) 168,470 Subtotal Section 9(d) Debt 3,724,889 2,680,643 1,013,135 (64,533) 5,327,864
Total Authorized and Unissued Tax-Supported Debt $ 4,392,677 $ 2,721,629 $ 1,013,135 $ (64,533) $ 6,036,638
DebtAuthorized Issued ments 20162015
As ofJune 30, New Debt
OtherAdjust-
As ofJune 30,

282 Commonwealth of Virginia
Tax-Supported Debt – Annual Debt Service Requirements [1]For the Fiscal Year Ended June 30, 2016(Dollars in Thousands)
Fiscal YearEndingJune 30
2017 $ 108,735 $ 59,583 $ 168,318 $ 582,934 $ 379,139 $ 962,0732018 101,990 54,467 156,457 555,700 358,791 914,4912019 101,445 49,855 151,300 533,620 333,996 867,6162020 101,385 45,200 146,585 509,343 309,394 818,7372021 103,520 40,590 144,110 511,796 286,183 797,9792022 98,740 35,804 134,544 490,570 262,916 753,4862023 99,145 31,295 130,440 481,765 241,091 722,8562024 98,770 26,819 125,589 479,446 219,564 699,0102025 90,545 22,366 112,911 472,225 198,234 670,4592026 85,160 18,460 103,620 476,405 177,471 653,8762027 76,825 14,777 91,602 461,621 157,476 619,0972028 61,410 11,317 72,727 455,425 137,236 592,6612029 47,000 8,569 55,569 451,335 117,275 568,6102030 37,290 6,567 43,857 433,940 97,290 531,2302031 32,890 5,029 37,919 379,845 77,524 457,3692032 22,855 3,699 26,554 352,765 61,499 414,2642033 22,440 2,794 25,234 293,915 47,266 341,1812034 20,080 1,896 21,976 280,250 34,874 315,1242035 12,805 1,061 13,866 235,310 23,100 258,4102036 5,210 545 5,755 156,200 13,546 169,7462037 1,895 328 2,223 78,670 7,710 86,3802038 1,675 244 1,919 39,195 4,662 43,8572039 1,730 165 1,895 40,685 3,160 43,8452040 1,785 84 1,869 24,015 1,598 25,6132041 - - - 24,899 704 25,603
Subtotal 1,335,325 441,514 1,776,839 8,801,874 3,551,699 12,353,573
AddAccretion onCapital AppreciationBonds - - - 25,634 - 25,634
AddUnamortizedPremium 143,425 - 143,425 732,119 - 732,119
LessUnamortizedDiscount - - - (91) - (91)
Total $ 1,478,750 $ 441,514 $ 1,920,264 $ 9,559,536 $ 3,551,699 $ 13,111,235
General Obligation DebtSection 9(d) [1] [2]
Other Tax-Supported Debt
InterestPrincipal TotalInterestPrincipalTotal
Sections 9(a), 9(b) and 9(c)
[1] Includes Fairfax County Economic Development Authority and the Virginia Aviation Board. Does not include other capital leases, installment purchase obligations, regional jail reimbursements under the original treasury board program, compensated absences, pension liability, pollution remediation liability and other liabilities.
[2] Includes principal amount of $5,208,477 (dollars in thousands) for the primary government.

Commonwealth of Virginia 283
$ 691,669 $ 438,722 $ 1,130,391657,690 413,258 1,070,948635,065 383,851 1,018,916610,728 354,594 965,322615,316 326,773 942,089589,310 298,720 888,030580,910 272,386 853,296578,216 246,383 824,599562,770 220,600 783,370561,565 195,931 757,496538,446 172,253 710,699516,835 148,553 665,388498,335 125,844 624,179471,230 103,857 575,087412,735 82,553 495,288375,620 65,198 440,818316,355 50,060 366,415300,330 36,770 337,100248,115 24,161 272,276161,410 14,091 175,50180,565 8,038 88,60340,870 4,906 45,77642,415 3,325 45,74025,800 1,682 27,48224,899 704 25,603
10,137,199 3,993,213 14,130,412
25,634 - 25,634
875,544 - 875,544
(91) - (91)
$ 11,038,286 $ 3,993,213 $ 15,031,499
Total
TotalInterestPrincipal

284 Commonwealth of Virginia
Tax-Supported Debt – Detail of Long-term IndebtednessFor the Fiscal Year Ended June 30, 2016(Dollars in Thousands)
(Retired) OutstandingAmount June 30, During June 30,
Series Issued Year 2016 Maturity
IssuedOutstanding
2015
General Obligation DebtSection 9(b) Debt (Primary Government):
Public Facilities BondsSeries 2006 $ 117,910 $ 5,920 $ (5,920) $ -Series 2007 200,465 26,750 (10,250) 16,500 06/01/17-18Series 2008 198,165 29,765 (9,925) 19,840 06/01/17-18Series 2009 80,000 56,000 (4,000) 52,000 06/01/17-29Series 2009 Refunding 121,765 121,295 (8,110) 113,185 06/01/17-22Series 2009 Taxable BABs 45,000 33,175 (2,365) 30,810 06/01/17-29Series 2012A Refunding 71,065 49,055 (4,775) 44,280 06/01/17-24Series 2013 Refunding 128,250 128,250 (6,090) 122,160 06/01/17,19-27Series 2014B Refunding 22,855 14,590 (9,360) 5,230 06/01/17-18Series 2015 102,520 102,520 - 102,520 06/01/18-28
Unamortized Premium - 74,861 (9,471) 65,390Total Public Facilities Bonds 1,087,995 642,181 (70,266) 571,915
Total Section 9(b) Debt 1,087,995 642,181 (70,266) 571,915
Section 9(c) DebtHigher Educational Institution bonds (Component Units)
Series 2006 Refunding BondsChristopher New port University
Dorm/Dining - '96 Refunding, Refunded Portion 1,725 950 (145) 805 06/01/17-21Subtotal Series 2006 Refunding Bonds 1,725 950 (145) 805
Series 2006 BondsThe College of William and Mary
Renovate Dormitories 4,515 210 (210) -George Mason University
Construct Student Housing VII 39,080 1,350 (1,350) -Renovate Housing Facilities 2,420 325 (325) -
James Madison University Renovate Residence Hall Phase III 6,230 285 (285) -
Longw ood UniversityRenovate Housing Facilities 5,900 270 (270) -
Old Dominion UniversityConstruct Residence Hall Phase II 8,785 405 (405) -
Virginia Polytechnic Institute and State UniversityParking Projects 685 30 (30) -
Virginia State UniversityConstruct Dining Hall 4,330 210 (210) -Construct Residence Halls 16,780 815 (815) -
Subtotal Series 2006 Bonds 88,725 3,900 (3,900) -
Series 2007 BondsGeorge Mason University
Construct Student Housing VII and Entrance Road 15,495 1,065 (520) 545 06/01/17Construct Student Housing, VII 2,010 135 (65) 70 06/01/17Renovate Student Housing, President's Park I 3,130 820 (400) 420 06/01/17
James Madison University Construct Dining Hall 20,840 1,910 (930) 980 06/01/17Renovate Bluestone Residence Hall, Phase III 2,280 205 (100) 105 06/01/17
Longw ood UniversityRenovate Cox Hall 6,250 575 (280) 295 06/01/17
Old Dominion UniversityConstruct Residence Hall, Phase II 16,115 1,475 (720) 755 06/01/17
Virginia Commonw ealth UniversityMonroe Park Housing 15,525 760 (370) 390 06/01/17
Virginia Polytechnic Institute and State UniversityConstruct New Residence Hall 13,130 2,000 (635) 1,365 06/01/17-18Improve Residence and Dining Halls 5,995 915 (290) 625 06/01/17-18

Commonwealth of Virginia 285
(Retired) OutstandingAmount June 30, During June 30,
Series Issued Year 2016 Maturity
IssuedOutstanding
2015
General Obligation Debt (continued)Section 9(c) Debt (continued)
Higher Educational Institution bonds (Component Units) (continued)Virginia State University
Construct Residence Halls 2,020 285 (90) 195 06/01/17-18Construct Tw o Residence Halls 26,160 2,615 (1,275) 1,340 06/01/17
Subtotal Series 2007 Bonds 128,950 12,760 (5,675) 7,085
Series 2008 BondsThe College of William and Mary
Renovate Graduate Student Residence Halls 2,395 330 (105) 225 06/01/17-18George Mason University
Renovate Commonw ealth and Dominion Phase II 1,530 585 (185) 400 06/01/17-18Renovate President's Park Phase I 3,095 1,185 (375) 810 06/01/17-18Renovate President's Park Phase II 3,120 445 (140) 305 06/01/17-18Student Housing VII 1,955 185 (60) 125 06/01/17-18Student Housing VII and Entrance Road 23,870 2,320 (735) 1,585 06/01/17-18
James Madison University Construct New Residence Hall 19,430 2,600 (825) 1,775 06/01/17-18
Longw ood UniversityRenovate Cox Hall 4,630 615 (195) 420 06/01/17-18
Old Dominion UniversityQuad Housing Phase II 39,960 5,355 (1,700) 3,655 06/01/17-18
Virginia Polytechnic Institute and State UniversityNew Residence Hall 17,185 2,375 (755) 1,620 06/01/17-18Parking Auxiliary Projects 1,545 205 (65) 140 06/01/17-18
Subtotal Series 2008 Bonds 118,715 16,200 (5,140) 11,060
Series 2009 BondsChristopher New port University
Residence Hall '01 Refunded Portion 1,878 1,866 (12) 1,854 06/01/17-21The College of William and Mary
Dining Commons Hall Renovation '05 Refunded Portion 3,200 3,200 - 3,200 06/01/17-22Dormitory Renovations '06B Refunded Portion 1,270 1,270 - 1,270 06/01/18-22Dormitory Renovations '02 Refunded 2,582 2,259 (287) 1,972 06/01/17-22Dormitory Renovations '05 Refunded 1,940 1,940 - 1,940 06/01/17-22Dormitory Renovations '01 Refunded Portion 384 382 (3) 379 06/01/17-21
George Mason University Housing Building V '01 Refunded Portion 6,267 6,234 (35) 6,199 06/01/17-24Housing Building V '02 Refunded Portion 4,448 3,889 (494) 3,395 06/01/17-22Housing VIII 7,910 7,260 (240) 7,020 06/01/17-34Renovate President Park Phase I 1,790 885 (205) 680 06/01/17-19Student Housing Construction VII '05 Refunded 6,630 6,630 - 6,630 06/01/17-22Student Housing VII C 8,255 7,215 (235) 6,980 06/01/17-34Student Housing Construction VII '06B Refunded 8,230 8,230 - 8,230 06/01/18-22
James Madison University Bluestone Dorm Phase II '01 Refunded Portion 458 455 (3) 452 06/01/17-21Renovate Bluestone Res Hall III '06B Refunded Portion 1,750 1,750 - 1,750 06/01/18-22Renovate Bluestone Dorms '02 Refunded Portion 1,048 916 (116) 800 06/01/17-22Renovate Bluestone Dorms II '02 Refunded Portion 1,089 951 (121) 830 06/01/17-22
Longw ood UniversityHousing Facilities Renovations '05 Refunded Portion 1,340 1,340 - 1,340 06/01/17-22Renovate Housing Facilities '06B Refunded Portion 1,655 1,655 - 1,655 06/01/18-22
Old Dominion UniversityConstruct Residence Hall Ph II '06B Refunded Portion 2,465 2,465 - 2,465 06/01/18-22Housing Renovations '02 Refunded Portion 1,319 1,152 (146) 1,006 06/01/17-22Housing Renovations Ph I '05 Refunded Portion 1,625 1,625 - 1,625 06/01/17-22
University of Mary WashingtonResidence Hall Renovation '01 Refunded Portion 153 152 (1) 151 06/01/17-21Seacobeck Dining Hall '05 Refunded Portion 1,625 1,625 - 1,625 06/01/17-22
Continued on next page

286 Commonwealth of Virginia
Tax-Supported Debt – Detail of Long-term Indebtedness (Continued from previous page)For the Fiscal Year Ended June 30, 2016(Dollars in Thousands)
(Retired) OutstandingAmount June 30, During June 30,
Series Issued Year 2016 Maturity
IssuedOutstanding
2015
General Obligation Debt (continued)Section 9(c) Debt (continued)
Higher Educational Institution bonds (Component Units) (continued)Series 2009 Bonds (continued)
University of VirginiaResidence Hall Monroe Lane '01 Refunded Portion 368 366 (4) 362 06/01/17-21
Virginia Military InstituteCrozet Hall & Parking '04A Refunded Portion 4,242 4,242 (297) 3,945 06/01/17-22
Virginia Polytechnic Institute and State UniversityParking Aux Projects '06B Refunded Portion 190 190 - 190 06/01/18-22Improve Residence and Dining Halls 3,720 3,145 (160) 2,985 06/01/17-29Parking Auxiliary Project '02 Refunded Portion 276 169 (84) 85 06/01/17Parking Structure 24,590 22,010 (720) 21,290 06/01/17-34Renovate Dietrick Servery Ph II '04A Refunded Portion 1,891 1,891 (131) 1,760 06/01/17-22Renovate Ambler Johnston Hall 39,005 32,979 (1,684) 31,295 06/01/17-29
Virginia State UniversityConstruct Residence Hall '06B Refunded Portion 4,965 4,965 - 4,965 06/01/18-22Construct Dining Hall '06B Refunded Portion 1,280 1,280 - 1,280 06/01/18-22
Subtotal Series 2009 Bonds 149,838 136,583 (4,978) 131,605
Series 2010 BondsChristopher New port University
Construct Residence Hall 34,480 31,905 (945) 30,960 06/01/17-40The College of William and Mary
Construct New Dormitory 2,010 1,630 (95) 1,535 06/01/17-30Renovate Residence Halls 4,440 3,590 (205) 3,385 06/01/17-30
George Mason UniversityHousing VIII 39,420 35,535 (1,425) 34,110 06/01/17-35Renovate Commons 1,325 1,145 (65) 1,080 06/01/17-30Renovate Student Housing, President's Park II 2,790 1,645 (320) 1,325 06/01/17-20Smithsonian CRC Housing 5,415 4,880 (195) 4,685 06/01/17-35
James Madison UniversityRenovate Bluestone Dormitories, Phase IV 14,890 12,060 (695) 11,365 06/01/17-30
Old Dominion UniversityRenovate Student Housing, Phase I 1,975 1,595 (90) 1,505 06/01/17-30
Virginia Commonw ealth UniversityConstruct West Grace Housing and Parking Phase I 29,130 26,250 (1,055) 25,195 06/01/17-35
Virginia Polytechnic Institute and State UniversityConstruct Academic and Student Affairs Building 34,650 28,715 (1,660) 27,055 06/01/17-30Parking Auxiliary Projects 745 600 (35) 565 06/01/17-30
Subtotal Series 2010 Bonds 171,270 149,550 (6,785) 142,765
Series 2011 BondsChristopher New port University
Renovate Santoro Residence Hall 4,100 2,775 (430) 2,345 06/01/17-21The College of William and Mary
Construct New Dormitory 14,400 12,735 (595) 12,140 06/01/17-31George Mason University
Housing VIII 20,230 18,605 (575) 18,030 06/01/17-36Presidential Park Housing Renovation 2,700 1,930 (305) 1,625 06/01/17-21Renovate Commons 14,350 13,200 (620) 12,580 06/01/17-31Smithsonian CRC Housing 4,070 3,845 (120) 3,725 06/01/17-36Student Housing VII-C 1,045 975 (35) 940 06/01/17-36
Virginia Commonw ealth UniversityWest Grace Housing - North 25,830 24,390 (760) 23,630 06/01/17-36
Virginia Polytechnic Institute and State UniversityRenovate Ambler Johnston Hall 18,860 16,685 (795) 15,890 06/01/17-31
Virginia State UniversityConstruct Gatew ay Residence Hall Phase II 34,735 30,075 (1,435) 28,640 06/01/17-31Construct Quad Phase II 28,555 26,270 (1,235) 25,035 06/01/17-31
Subtotal Series 2011 Bonds 168,875 151,485 (6,905) 144,580

Commonwealth of Virginia 287
(Retired) OutstandingAmount June 30, During June 30,
Series Issued Year 2016 Maturity
IssuedOutstanding
2015
General Obligation Debt (continued)Section 9(c) Debt (continued)
Higher Educational Institution bonds (Component Units) (continued)Series 2012 Bonds
The College of William and MaryDining Commons Hall Renovation 2005 Refunding 1,289 1,289 - 1,289 06/01/23-24Dorm Renovation - 2005 Refunding 780 780 (1) 779 06/01/23-24Dorm Repairs - 2002 Refunding (96 Ref) 429 130 (130) -Underground Utilities - 2002 Refunding (95 Ref) 388 120 (120) -
George Mason University Student Housing Construction, VII - 2005 Refunding 2,674 2,674 - 2,674 06/01/23-24
Longw ood UniversityDining Hall - 2002 Refunding (96 Ref) 1,472 446 (446) -Housing Facilities Renovation - 2005 Refunding 545 545 - 545 06/01/23-24
Old Dominion UniversityHousing Renovation, Phase I - 2005 Refunding 655 655 - 655 06/01/23-24
University of Mary WashingtonSeacobeck Dining Hall - 2005 Refunding 655 655 - 655 06/01/23-24
University of VirginiaNew comb Hall - 2002 Refunding (95 Ref) 2,752 832 (832) -Student Residence - 2002 Refunding (95 Ref) 1,241 376 (376) -
Virginia Commonw ealth UniversityVisitors Deck - 2002 Refunding (96 Ref) 871 265 (265) -
Virginia Military InstituteCrozet Hall & Parking - 2004A Refunding 3,019 2,489 - 2,489 06/01/23-25
Virginia Polytechnic Institute and State UniversityRenovate Dietrick Servery -2004A Refunding 942 705 - 705 06/01/23-24
Virginia State UniversityJones Hall - 2002 Refunding (96 Ref) 646 195 (195) -
Subtotal Series 2012 Bonds 18,358 12,156 (2,365) 9,791
Series 2013 BondsThe College of William and Mary
Construct New Dormitory 8,770 8,175 (315) 7,860 06/01/17-33Dining Commons Hall Renovation - 2005A Ref Portion 1,831 1,831 (442) 1,389 06/01/25-26Dorm Renovations - 2005A Ref Portion 1,113 1,113 (269) 844 06/01/25-26Dorm Renovations - 2006B Ref Portion 1,412 1,412 - 1,412 06/01/17, 23-26Renovate Dormitory 4,660 4,345 (165) 4,180 06/01/17-33
George Mason UniversityConstruct Student Housing VII & Entrance Rd - 2007B Ref Portion 4,579 4,579 - 4,579 06/01/19-25Construct Student Housing VII - 2007B Refunded Portion 584 584 - 584 06/01/19-25Construct Student Housing VII - 2006B Refunded Portion 9,187 9,187 - 9,187 06/01/17, 23-26Student Housing Construction, VII - 2005A Ref Portion 10,504 10,504 (971) 9,533 06/01/25-30
James Madison UniversityConstruct Dining Hall - 2007B Refunded Portion 8,207 8,207 - 8,207 06/01/19-25Renovate Bluestone Residence Hall, Ph 3 -2007B Ref Portion 893 893 - 893 06/01/19-25Renovate Residence Hall - 2006B Refunded Portion 1,953 1,953 - 1,953 06/01/17, 23-26
Longw ood UniversityHousing Facility Renovation - 2005A Refunded Portion 472 472 (186) 286 06/01/25Renovate Cox Hall - 2007B Refunded Portion 2,461 2,461 - 2,461 06/01/19-25Renovate Housing Facilities - 2006B Refunded Portion 1,852 1,852 - 1,852 06/01/17, 23-26
Old Dominion UniversityConstruct Residence Hall, Ph II - 2007B Refunded Portion 6,344 6,344 - 6,344 06/01/19-25Construct Residence Hall, Ph II - 2006B Refunded Portion 2,761 2,761 - 2,761 06/01/17, 23-26Housing Renovations, Ph I - 2005A Refunded Portion 570 570 (221) 349 06/01/25
Radford UniversityWashington Hall 5,040 4,700 (180) 4,520 06/01/17-33
University of Mary WashingtonSeacobeck Dining Hall - 2005A Refunded Portion 565 565 (221) 344 06/01/25
Virginia Commonw ealth UniversityMonroe Park Housing - 2007B Refunded Portion 3,252 3,252 - 3,252 06/01/19-25
Continued on next page

288 Commonwealth of Virginia
Tax-Supported Debt – Detail of Long-term Indebtedness (Continued from previous page)For the Fiscal Year Ended June 30, 2016(Dollars in Thousands)
(Retired) OutstandingAmount June 30, During June 30,
Series Issued Year 2016 Maturity
IssuedOutstanding
2015
General Obligation Debt (continued)Section 9(c) Debt (continued)
Higher Educational Institution bonds (Component Units) (continued)Series 2013 Bonds (continued)
Virginia Polytechnic Institute and State UniversityConstruct New Residence Hall - 2007A Refunded Portion 7,842 7,842 - 7,842 06/01/19-27Improve Residence and Dining Halls - 2007A Refunded Portion 3,576 3,576 - 3,576 06/01/19-27Parking Projects - 2006B Refunded Portion 217 217 - 217 06/01/17, 23-26
Virginia State UniversityConstruct Dining Hall - 2006B Refunded Portion 1,431 1,431 - 1,431 06/01/17, 23-26Construct Residence Hall - 2007B Refunded Portion 1,132 1,132 - 1,132 06/01/19-27Construct Residence Halls - 2006B Refunded Portion 5,541 5,541 - 5,541 06/01/17, 23-26Construct Tw o Residence Halls - 2007B Refunded Portion 11,231 11,231 - 11,231 06/01/19-25
Subtotal Series 2013 Bonds 107,980 106,730 (2,970) 103,760
Series 2014 BondsChristopher New port University
New Residence Hall - 2004B Refunded Portion 8,147 7,372 (1,377) 5,995 06/01/17-20Residence Hall II - 2004B Refunding Portion 4,210 3,698 (877) 2,821 06/01/17-19
College Of William and MaryRenovate Dormitories - 2004B Refunding Portion 1,666 1,506 (280) 1,226 06/01/17-20Dormitory Renovation Phase II - 2004B Refunding Portion 120 111 (54) 57 06/01/17Dormitory Repairs - 2004B Refunding Portion 650 492 (240) 252 06/01/17Utility System - 2004B Refunding Portion 311 285 (142) 143 06/01/17Dormitory Renovation - 2004B Refunding Portion 1,551 1,298 (417) 881 06/01/17-18Renovate Dormitories 9,005 8,750 (305) 8,445 06/01/17-34
George Mason UniversityHousing Building V - 2004B Refunding Portion 6,306 5,710 (1,068) 4,642 06/01/17-20Student Housing VIII 2,235 2,170 (75) 2,095 06/01/17-34
James Madison UniversityBluestone Dormitory Phase II- 2004B Refunding Portion 1,985 1,797 (335) 1,462 06/01/17-20Dining Hall Renovation - 2004B Refunding Portion 254 190 (93) 97 06/01/17Residence Hall - 2004B Refunding Portion 2,232 1,690 (827) 863 06/01/17Student Services - 2004B Refunding Portion 1,191 901 (440) 461 06/01/17Dining Facilities Renovation - 2004B Refunding Portion 260 216 (68) 148 06/01/17-18Student Housing Phase I 46,660 45,350 (1,570) 43,780 06/01/17-34
Longw ood UniversityDining Hall - 2004B Refunding Portion 934 822 (194) 628 06/01/17-19Residence Hall Improvements - 2004B Refunding Portion 880 773 (183) 590 06/01/17-19
Radford UniversityRenovate Residence Halls 11,080 10,770 (375) 10,395 06/01/17-34
University of Mary WashingtonResidence Hall Renovation - 2004B Refunding Portion 656 596 (113) 483 06/01/17-20
University of VirginiaResidence Hall - Monroe Lane - 2004B Refunding Portion 1,595 1,444 (270) 1,174 06/01/17-20Residence Hall - Wise- 2004B Refunding Portion 1,512 1,329 (317) 1,012 06/01/17-19
Virginia Commonw ealth UniversityAcademic Parking Deck - 2004B Refunding Portion 2,429 1,836 (900) 936 06/01/17
Virginia Polytechnic Institute and State UniversityParking Auxiliary Projects - 2004B Refunding Portion 300 229 (113) 116 06/01/17Residence Hall - 2004B Refunding Portion 3,151 2,387 (1,170) 1,217 06/01/17Dining Hall - 2004B Refunding Portion 793 663 (214) 449 06/01/17-18Dining Hall HVAC - 2004B Refunding Portion 587 517 (124) 393 06/01/17-19
Virginia State UniversityJones Dining Hall - 2004B Refunding Portion 255 212 (68) 144 06/01/17-18
Subtotal Series 2014 Bonds 110,955 103,114 (12,209) 90,905

Commonwealth of Virginia 289
(Retired) OutstandingAmount June 30, During June 30,
Series Issued Year 2016 Maturity
IssuedOutstanding
2015
General Obligation Debt (continued)Section 9(c) Debt (continued)
Higher Educational Institution bonds (Component Units) (continued)Series 2015 Bonds
Christopher New port UniversityConstruct Residential Housing 18,860 18,860 - 18,860 06/01/17-35Expand Dining Hall 8,960 8,960 - 8,960 06/01/17-35
College of William and MaryRenovate Graduate St. - 2008B Ref Portion 1,482 1,482 - 1,482 06/01/19-28Renovate Dormitories 10,980 10,980 (320) 10,660 06/01/17-35
George Mason UniversityConstruct Housing VII & Entrance Road - 2007B Ref Portion 6,817 6,817 - 6,817 06/01/18, 26-32Construct Student Housing VII - 2006B Refunding Portion 11,765 11,765 - 11,765 06/01/27-31Construct Student Housing VII - 2007B Refunding Portion 854 854 - 854 06/01/18, 26-32Renovate President Park, Phase II - 2008B Refunding Portion 1,999 1,999 - 1,999 06/01/19-28Student Housing VII - 2008B Refunding Portion 1,366 1,366 - 1,366 06/01/19-33Student Housing VII - C - 2008B Refunding Portion 17,566 17,566 - 17,566 06/01/19-33
James Madison UniversityConstruct Dining Hall - 2007B Refunding Portion 3,650 3,650 - 3,650 06/01/18, 26-27Construct New Residence Hall - 2008B Refunding Portion 11,695 11,695 - 11,695 06/01/19-28Renovate Bluestone Residence Hall, Ph 3 - 2007B Ref Portion 403 403 - 403 06/01/18, 26-27
Longw ood UniversityRenovate Cox Hall - 2007B Refunding Portion 1,089 1,089 - 1,089 06/01/18, 26-27Renovate Cox Hall - 2008B Refunding Portion 2,785 2,785 - 2,785 06/01/19-28
Old Dominion UniversityConstruct Residence Hall, Phase II - 2007B Refunding Portion 2,827 2,827 - 2,827 06/1/2018, 26-27Quad Housing Phase II - 2008B Refunding Portion 24,074 24,074 - 24,074 06/01/19-28
Radford UniversityRenovate Residence Halls 8,820 8,820 (260) 8,560 06/01/17-35
Virginia Commonw ealth UniversityMonroe Park Housing - 2007B Refunding Portion 6,806 6,806 - 6,806 06/01/18, 26-37
Virginia Polytechnic Institute and StateNew Residence Hall - 2008B Refunding Portion 10,671 10,671 - 10,671 06/01/19-28Parking Auxiliary Project - 2008B Refunding Portion 921 921 - 921 06/01/19-28
Virginia State UniversityConstruct Tw o Residence Halls - 2007B Refunding Portion 4,995 4,996 (1) 4,995
Subtotal Series 2015 Bonds 159,385 159,386 (581) 158,805
Unamortized Premium - 84,043 (8,086) 75,957
Subtotal Higher Educational Institution Bonds 1,224,776 936,857 (59,739) 877,118
Transportation Facilities Bonds (Primary Government)Series 2006, Coleman Refunding 31,880 16,725 (2,520) 14,205 06/01/17-21
Unamortized Premium - 429 (72) 357Subtotal Transportation Facilities
Bonds 31,880 17,154 (2,592) 14,562
Parking Facilities Bonds (Primary Government)Series 2009 13,755 11,240 (575) 10,665 06/01/17-29Series 2009 Refunding 2,122 2,122 (147) 1,975 06/01/17-22Series 2012 Refunding (2004A Ref) 1,061 794 - 794 06/01/23-24
Unamortized Premium - 1,880 (159) 1,721Subtotal Parking Facilities
Bonds 16,938 16,036 (881) 15,155
Total Section 9(c) Debt 1,273,594 970,047 (63,212) 906,835
Total General Obligation Debt 2,361,589 1,612,228 (133,478) 1,478,750
Continued on next page

290 Commonwealth of Virginia
Tax-Supported Debt – Detail of Long-term Indebtedness (Continued from previous page)For the Fiscal Year Ended June 30, 2016(Dollars in Thousands)
(Retired) OutstandingAmount June 30, During June 30,
Series Issued Year 2016 Maturity
IssuedOutstanding
2015
Nongeneral Obligation DebtSection 9(d) Debt
Virginia Public Building Authority Bonds (Primary Government)Series 2005A Refunding 47,305 4,050 (4,050) -Series 2005B Refunding 135,675 13,585 (13,585) -Series 2005C 165,810 16,115 (16,115) -Series 2005D 50,000 50,000 - 50,000 08/01/22-25Series 2006A 135,000 20,935 (10,205) 10,730 08/01/16Series 2006B 215,065 24,915 (12,145) 12,770 08/01/16Series 2007A 242,480 46,000 (14,575) 31,425 08/01/16-17Series 2008B 150,000 26,035 (6,070) 19,965 08/01/16-18Series 2009A 40,995 26,885 (3,195) 23,690 08/01/16-21Series 2009B 265,000 205,205 (13,435) 191,770 08/01/16-29Series 2009C 10,000 6,420 (795) 5,625 08/01/16-21Series 2009D Refunding 42,745 31,655 (4,850) 26,805 08/01/16-21Series 2010A1 60,520 13,050 (13,050) -Series 2010A2 BABs 256,710 256,710 - 256,710 08/01/16-30Series 2010B1 87,510 48,980 (11,355) 37,625 08/01/16-18Series 2010B2 Taxable BABs 195,310 195,260 - 195,260 08/01/19-30Series 2010B3 Refunding 50,780 49,750 (355) 49,395 08/01/16-22Series 2011A 280,000 253,100 (9,785) 243,315 08/01/16-31Series 2011B 18,500 16,355 (740) 15,615 08/01/16-31Series 2012A Refunding 72,415 72,415 - 72,415 08/01/16-24Series 2013A 143,400 138,960 (4,645) 134,315 08/01/16-33Series 2013B Refunding 72,370 72,370 - 72,370 08/01/19-23Series 2014A 132,875 132,875 (4,065) 128,810 08/01/16-34Series 2014B Taxable 29,735 29,735 (1,200) 28,535 08/01/16-34Series 2014C Refunding 298,390 298,390 (16,255) 282,135 08/01/16-27Series 2015A 232,980 232,980 - 232,980 08/01/16-35Series 2015B Refunding 134,730 134,730 - 134,730 08/01/16-28
Unamortized Premium - 205,987 (21,564) 184,423Total Virginia Public Building Authority
Bonds 3,566,300 2,623,447 (182,034) 2,441,413
Virginia College Building Authority Bonds (Component Unit) (1)21st Century College Program
Series 2006BC 120,000 83,580 (6,195) 77,385 02/01/17-26Series 2007A 59,125 57,230 (6,765) 50,465 02/01/17-22Series 2007B 132,095 4,520 (2,215) 2,305 02/01/17Series 2008A 144,075 24,875 (11,260) 13,615 02/01/17-19, 28Series 2009A 284,020 104,380 (53,975) 50,405 02/01/17-20, 28-29Series 2009B 84,680 31,750 (10,025) 21,725 02/01/17-18Series 2009D 52,420 16,825 (8,205) 8,620 02/01/17Series 2009E Refunding 208,860 182,325 (15,655) 166,670 02/01/17-24Series 2009F2 Taxable BABs 390,575 370,970 (19,985) 350,985 02/01/17-30Series 2010A 50,350 15,320 (7,470) 7,850 02/01/17Series 2010B2 Taxable BABs 290,600 290,600 (16,475) 274,125 02/01/17-30Series 2011A 272,515 236,720 (15,045) 221,675 02/01/17-32Series 2012A 335,075 285,000 (16,910) 268,090 02/01/17-32Series 2012B 349,255 330,625 (10,995) 319,630 02/01/17-33Series 2012C 8,350 5,010 (1,670) 3,340 02/01/17-18Series 2013A 331,705 321,500 (16,085) 305,415 02/01/17-34Series 2014A 319,155 300,265 (15,635) 284,630 02/01/17-34Series 2014B 27,985 21,865 (8,660) 13,205 02/01/17-20, 25Series 2015A 373,230 373,230 (10,850) 362,380 02/01/17-35Series 2015B Refunding 204,880 204,880 (3,670) 201,210 02/01/17-27Series 2015C Taxable 6,785 6,785 (1,105) 5,680 02/01/17-20Series 2015D1 233,300 - 228,540 228,540 02/01/17-35Series 2015D2 56,765 - 53,200 53,200 02/01/17-22Series 2016A 360,485 - 360,485 360,485 02/01/17-36Series 2016 B Refunding 49,300 - 49,300 49,300 02/01/28-29Series 2016C 39,980 - 39,980 39,980 02/01/17-26
Unamortized Premium - 251,959 56,191 308,150Total Virginia College Building Authority
Bonds 4,785,565 3,520,214 528,846 4,049,060

Commonwealth of Virginia 291
(Retired) OutstandingAmount June 30, During June 30,
Series Issued Year 2016 Maturity
IssuedOutstanding
2015
Nongeneral Obligation Debt (continued)Section 9(d) Debt (continued)
Transportation Debt (Primary Government)Route 28 Refunding Bonds 111,680 84,305 (3,326) 80,979 04/01/17-32Transportation Revenue Bonds (U.S. Route 58) 316,900 260,830 (47,535) 213,295 05/15/17-26Northern Virginia Transportation District Program 194,060 205,660 (24,800) 180,860 05/15/17-27Oak Grove Connector (Chesapeake) 10,100 12,885 (2,785) 10,100 05/15/17-22Capital Projects 2,241,385 1,805,175 220,860 2,026,035 05/15/17-41
Unamortized Premium - 183,268 27,701 210,969Total Section 9(d) Transportation Debt 2,874,125 2,552,123 170,115 2,722,238
Virginia Port Authority Debt (Component Unit)Series 2005 60,000 1,930 (1,930) -Series 2006 21,730 4,250 (2,885) 1,365 07/01/16Series 2011 57,370 57,370 - 57,370 07/01/28-36Series 2012 108,015 95,370 (6,400) 88,970 07/01/16-27Series 2012B 45,230 43,885 (715) 43,170 07/01/16-29Series 2012C 4,795 4,795 - 4,795 07/01/29-30Series 2015 58,680 58,680 - 58,680 07/01/28-31, 37-40
Unamortized Premium - 22,166 (1,260) 20,906Total Virginia Port Authority Debt 355,820 288,446 (13,190) 275,256
Virginia Biotechnology Research PartnershipAuthority (Component Unit)
Series 2009 91,010 28,250 (3,525) 24,725 09/01/16-21Unamortized Premium - 2,369 (351) 2,018
Total Virginia Biotechnology Research PartnershipAuthority (Component Unit) 91,010 30,619 (3,876) 26,743
Economic Development Authority Obligations 55,875 44,740 (5,590) 39,150 05/15/17-22Unamortized Premium - 6,509 (947) 5,562
Total Economic Development Authority Obligations 55,875 51,249 (6,537) 44,712
Total Section 9(d) Debt 11,728,695 9,066,098 493,324 9,559,422
Nongeneral Obligation Debt and Other ObligationsOther Long-term Debt (1)
Capital Leases - 135,404 (17,477) 117,927Installment Purchase Obligations - 177,185 (17,483) 159,702Aviation Note Payable 6,600 307 (193) 114
Total Other Long-term Debt 6,600 312,896 (35,153) 277,743
Other Long-term ObligationsCompensated Absences - 599,726 10,353 610,079Net Pension Liability - 6,629,296 566,981 7,196,277OPEB Liability - 1,484,680 211,292 1,695,972Other - 45,109 13,856 58,965
Total Other Long-term Obligations - 8,758,811 802,482 9,561,293
Total Nongeneral Obligation Debt and Other Obligations 11,735,295 18,137,805 1,260,653 19,398,458
Total Tax-Supported Debt and Other Obligations $ 14,096,884 $ 19,750,033 $ 1,127,175 $ 20,877,208
(1) These amounts are reported as notes payable on the higher education institutions' financial statements.(2) Pursuant to GASB Statement No. 34, Basic Financial Statements – and Management's Discussion and Analysis – for State and Local
Governments, Governmental Activities include internal service funds.

292 Commonwealth of Virginia

Commonwealth of Virginia 293
STATISTICAL SECTION
The financial presentations included in this section present detailed information as a context for understanding what the information in the financial statements, note disclosures, and required supplementary information says about the Commonwealth’s overall financial health.
Statistical schedules related to property taxes are not presented since the Commonwealth does not assess property taxes.
Contents
Financial Trends.......................................................................................................................................................................... 295These schedules contain trend information to help the reader understand how the Commonwealth’s financial performance and well-being have changed over time.
Ten-Year Schedule of Revenues and Expenditures – Modified Accrual Basis – General Governmental Revenues by Source and Expenditures by Function
Net Position by Component – Accrual Basis of AccountingChanges in Net Position – Accrual Basis of AccountingChanges in Fund Balance, Governmental Funds – Modified Accrual Basis of AccountingFund Balance, Governmental Funds – Modified Accrual Basis of AccountingComparison of General Fund Balance
Revenue Capacity ....................................................................................................................................................................... 309These schedules contain information to help the reader assess the factors affecting the Commonwealth’s ability to generate its income taxes.
Personal Income Tax RatesEffective Tax Rates Personal Income Tax Filers and Liability by Income LevelPersonal Income by IndustryTaxable Sales by Business ClassSales Tax Revenue by Business Class
Debt Capacity .............................................................................................................................................................................. 317These schedules present information to help the reader assess the affordability of the Commonwealth’s current levels of outstanding debt and the Commonwealth’s ability to issue debt in the future.
Ratios of Outstanding Debt by TypeRatios of General Obligation Bonded Debt OutstandingComputation of Legal Debt Limit and MarginSchedule of Pledged Revenue Bond Coverage – Primary Government 9(d) General Long-term Debt
Demographic and Economic Information ................................................................................................................................. 323These schedules offer demographic and economic indicators to help the reader understand the environment within which the Commonwealth’s financial activities take place and to help make comparisons over time and with other governments.
Schedule of Demographic and Economic StatisticsPrincipal Employers
Operating Information................................................................................................................................................................. 325These schedules contain information about the Commonwealth’s operations and resources to help the reader understand how the Commonwealth’s financial information relates to the services the Commonwealth provides and the activities it performs.
State Employees by FunctionOperating Indicators by FunctionCapital Asset Statistics by Function
Employees of the Department of Accounts .............................................................................................................................. 334
Sources: Unless otherwise noted, the information in these schedules is derived from the comprehensive annual financial reportsfor the relevant year.

294 Commonwealth of Virginia

Commonwealth of Virginia 295
Financial Trends

296 Commonwealth of Virginia
Ten-Year Schedule of Revenues and Expenditures – Modified Accrual BasisGeneral Governmental Revenues by Source and Expenditures by Function For Fiscal Year Ended June 30(Dollars in Millions)
Tax Revenues:Individual and Fiduciary Income $ 12,652 $ 12,248 $ 11,659 $ 11,378Sales and Use 4,984 4,832 4,606 3,935Motor Fuels 977 887 793 879Corporation Income 773 797 774 778Public Service Corporations 108 119 119 116Motor Vehicle Sales and Use 910 846 781 582Communications Sales and Use 405 416 422 425Gross Premiums of Insurance Companies 490 454 449 396Alcoholic Beverage Sales 148 140 132 127Deeds, Contracts, Wills, and Suits 471 441 395 436Beer and Beverage Excise 43 43 43 43Estate - - - -Tobacco Products 176 179 182 182Bank Stock 18 19 23 20Wine and Spirits/ABC Liter 26 26 26 25Other Taxes 115 110 95 78 Total Tax Revenues 22,296 21,557 20,499 19,400
Other Revenues:Federal Grants and Contracts 9,885 9,727 9,681 9,913Institutional Revenue 267 303 325 360Sales of Property and Commodities 56 38 56 35Rights and Privileges 977 978 950 957Interest, Dividends, and Rents 134 91 144 83Fines, Forfeitures, Costs, Penalties and Escheats 347 352 435 366Assessments 137 137 132 125Other Revenues 995 987 739 824 Total Other Revenues 12,798 12,613 12,462 12,663 Total Revenues $ 35,094 $ 34,170 $ 32,961 $ 32,063
Percentage Increase Over Previous Year 2.7% 3.7% 2.8% 1.8%
Expenditures by Function:Education $ 9,373 $ 9,372 $ 8,970 $ 8,886Administration of Justice 2,801 2,690 2,724 2,566Individual and Family Services 14,186 13,421 13,196 13,039Resources and Economic Development 915 929 912 876Transportation 5,817 5,348 5,057 4,613General Government (1) 3,527 3,261 3,238 3,187Capital Outlay 331 251 194 219 Total Expenditures $ 36,950 $ 35,272 $ 34,291 $ 33,386
Percentage Increase Over Previous Year 4.8% 2.9% 2.7% 2.7%
Includes all General, Special Revenue, Debt Service, Capital Project, and Permanent Funds
2016 2015 2014 2013
(1) General Government expenditure amounts include debt service principal retirement and interest charges.
Source: Department of Accounts

Commonwealth of Virginia 297
$ 10,714 $ 10,050 $ 8,730 $ 9,471 $ 10,084 $ 9,6293,866 3,674 3,553 3,568 3,820 3,760
900 903 891 889 924 930950 827 833 642 767 889115 113 112 103 106 89538 495 440 406 534 588425 556 453 - - -391 412 391 387 397 385121 114 111 110 106 100371 335 326 351 457 58444 44 44 45 44 44
- 2 6 4 136 140195 175 178 182 183 18819 25 24 21 14 1324 23 21 20 19 1875 77 74 77 68 79
18,748 17,825 16,187 16,276 17,659 17,436
9,933 10,749 10,628 8,113 6,627 6,204385 384 403 409 390 36041 36 32 26 29 24
921 917 870 889 933 826164 159 294 218 452 532362 368 343 349 394 334120 122 116 113 109 110814 712 704 611 645 558
12,740 13,447 13,390 10,728 9,579 8,948$ 31,488 $ 31,272 $ 29,577 $ 27,004 $ 27,238 $ 26,384
0.7% 5.7% 9.5% -0.9% 3.2% 3.6%
$ 8,733 $ 8,682 $ 8,843 $ 9,260 $ 8,940 $ 8,7002,422 2,398 2,399 2,531 2,543 2,398
12,682 12,688 12,236 10,764 9,345 8,996870 886 897 990 868 812
4,474 3,860 3,401 3,704 3,883 3,1413,007 3,129 2,932 2,512 2,612 2,545
330 439 619 612 845 808$ 32,518 $ 32,082 $ 31,327 $ 30,373 $ 29,036 $ 27,400
1.4% 2.4% 3.1% 4.6% 6.0% 8.3%
2010 2009 2008 20072012 2011

298 Commonwealth of Virginia
Net Position by ComponentAccrual Basis of AccountingLast Ten Fiscal Years(Dollars in Millions)
Governmental Activities:Net Investment in Capital Assets (1) $ 24,309 $ 23,407 $ 22,317 $ 20,259Restricted 1,365 1,436 1,465 1,456Unrestricted (5,560) (5,406) (2,820) (1,531)
Total Governmental Activities Net Position 20,114 19,437 20,962 20,184
Business-type Activities:Net Investment in Capital Assets (1) 33 34 12 30Restricted 1,045 845 587 371Unrestricted 508 500 563 261
Total Business-type Activities Net Position 1,586 1,379 1,162 662
Primary Government:Net Investment in Capital Assets (1) 24,342 23,441 22,329 20,289Restricted 2,410 2,281 2,052 1,827Unrestricted (5,052) (4,906) (2,257) (1,270)
Total Primary Government Net Position $ 21,700 $ 20,816 $ 22,124 $ 20,846
2016 20142015 2013
(1) Beginning with fiscal year 2013, GASB Statement No. 63 changed the title of Invested in Capital Assets, Net of Related Debt to Net Investment in Capital Assets. Balances reported in prior fiscal years were not affected.
Source: Department of Accounts

Commonwealth of Virginia 299
$ 19,891 $ 18,320 $ 17,424 $ 16,209 $ 15,241 $ 13,8351,648 1,171 1,160 1,421 1,641 1,893
(2,216) (1,596) (1,887) (1,555) 516 94419,323 17,895 16,697 16,075 17,398 16,672
34 35 31 23 26 30179 16 16 372 816 872143 70 (169) (180) 59 212356 121 (122) 215 901 1,114
19,925 18,355 17,455 16,232 15,267 13,8651,827 1,187 1,176 1,793 2,457 2,765
(2,073) (1,526) (2,056) (1,735) 575 1,156$ 19,679 $ 18,016 $ 16,575 $ 16,290 $ 18,299 $ 17,786
2007200820092012 2011 2010

300 Commonwealth of Virginia
Changes in Net PositionAccrual Basis of AccountingLast Ten Fiscal Years(Dollars in Millions)
ExpensesGovernmental Activities:
General Government $ 3,230 $ 3,267 $ 3,362 $ 3,019Education 10,178 9,845 9,431 9,281Transportation 4,528 4,369 3,602 3,307Resources and Economic Development 1,008 970 940 928Individual and Family Services 14,024 13,277 13,116 12,941Administration of Justice 2,922 2,751 2,927 2,760Interest and Charges on Long-term Debt 240 224 238 255
Total Governmental Activities Expenses 36,130 34,703 33,616 32,491
Business-type Activities:Virginia Lottery 1,415 1,300 1,266 1,194Virginia College Savings Plan 103 155 104 156Unemployment Compensation 390 431 536 584Alcoholic Beverage Control 615 580 555 533Risk Management 14 10 13 12Local Choice Health Care 412 350 308 296Route 460 Funding Corporation of Virginia 1 13 82 67Virginia Industries for the Blind 42 43 38 31Consolidated Laboratory 10 9 9 8eVA Procurement System 23 23 20 20Department of Environmental Quality Title V 11 10 12 11Wireless E-911 42 37 37 42Museum and Library Gift Shops 7 7 6 7Behavioral Health Canteen and Work Activity - - 1 1
Total Business-type Activities Expenses 3,085 2,968 2,987 2,962Total Primary Government Expenses $ 39,215 $ 37,671 $ 36,603 $ 35,453
Program RevenuesGovernmental Activities:
Charges for Services:General Government $ 306 $ 297 $ 255 $ 250Education 563 545 518 448Transportation 675 691 652 680Resources and Economic Development 375 379 359 345Individual and Family Services 365 366 376 413Administration of Justice 284 316 401 322
Operating Grants and Contributions 9,147 8,915 8,732 8,820Capital Grants and Contributions 1,467 1,619 1,509 1,754
Total Governmental Activities Program Revenues 13,182 13,128 12,802 13,032
2016 20142015 2013
Source: Department of Accounts

Commonwealth of Virginia 301
$ 2,878 $ 2,917 $ 2,829 $ 2,541 $ 2,470 $ 2,6459,181 9,086 9,312 9,566 9,300 9,5423,030 2,839 2,311 2,786 3,054 2,256
985 1,006 1,107 1,003 878 84112,712 12,663 12,285 10,757 9,249 9,0222,639 2,641 2,741 2,611 2,607 2,659
229 228 206 201 205 20331,654 31,380 30,791 29,465 27,763 27,168
1,121 1,030 998 920 936 92996 243 294 115 244 180
640 662 923 881 433 382507 479 469 467 457 43413 8 7 6 6 3
267 230 231 231 202 179- - - - - -
32 28 28 24 24 207 7 6 6 6 6
19 17 19 18 18 1911 10 10 11 12 1141 38 48 53 50 476 7 2 1 2 21 - 1 1 - 1
2,761 2,759 3,036 2,734 2,390 2,213$ 34,415 $ 34,139 $ 33,827 $ 32,199 $ 30,153 $ 29,381
$ 255 $ 254 $ 248 $ 243 $ 229 $ 216397 388 380 373 379 350645 650 611 643 709 583393 309 306 299 297 299429 430 411 415 389 370323 322 308 321 387 292
9,178 9,950 9,951 7,584 6,067 5,8701,267 1,324 1,603 997 1,152 851
12,887 13,627 13,818 10,875 9,609 8,831
20102012 2011 20072009 2008
Continued on next page

302 Commonwealth of Virginia
Changes in Net PositionAccrual Basis of Accounting (Continued from previous page)Last Ten Fiscal Years(Dollars in Millions)
Business-type Activities:Charges for Services:
Virginia Lottery 2,007 1,844 1,811 1,690Virginia College Savings Plan 146 188 408 301Unemployment Compensation 594 693 761 790Alcoholic Beverage Control 772 730 689 662Risk Management 9 8 9 5Local Choice Health Care 393 343 321 285Virginia Industries for the Blind 42 44 36 30Consolidated Laboratory 9 10 9 7eVA Procurement System 21 20 16 16Department of Environmental Quality Title V 11 11 11 11Wireless E-911 58 55 54 62Museum and Library Gift Shops 7 8 6 8Behavioral Health Canteen and Work Activity - - - -
Operating Grants and Contributions - - - -Capital Contributions - - 70 61
Total Business-type Activities Program Revenue 4,069 3,954 4,201 3,928Total Primary Government Program Revenues $ 17,251 $ 17,082 $ 17,003 $ 16,960
Net (Expense)/RevenueGovernmental Activities $ (22,948) $ (21,575) $ (20,814) $ (19,459)Business-type Activities 984 986 1,214 966Total Primary Government Net Expense $ (21,964) $ (20,589) $ (19,600) $ (18,493)
General Revenues and Other Changes in Net PositionGovernmental Activities:
Taxes:Individual and Fiduciary Income $ 12,685 $ 12,266 $ 11,681 $ 11,400Sales and Use 4,994 4,830 4,597 3,941Corporation Income 773 801 770 805Motor Fuel 976 888 792 879Motor Vehicle Sales and Use 910 846 781 582Communications Sales and Use 405 416 420 424Premiums of Insurance Companies 485 453 460 407Public Service Corporations 108 119 119 116Other Taxes 1,001 959 896 909
Unrestricted Grants and Contributions 48 49 49 74Investment Earnings 63 16 44 6Miscellaneous 282 206 234 306Special Item - (134) - -Transfers 787 728 724 670Contributions to Permanent and Term Endow ments - - - -
Total Governmental Activities 23,517 22,443 21,567 20,519
Business-type Activities:Other Taxes 9 9 9 9Investment Earnings 1 2 2 1Miscellaneous - - 1 -Special Items - 34 - -Transfers (787) (728) (724) (670)
Total Business-type Activities (777) (683) (712) (660)Total Primary Government $ 22,740 $ 21,760 $ 20,855 $ 19,859
Change in Net PositionGovernmental Activities $ 569 $ 868 $ 753 $ 1,060Business-type Activities 207 303 502 306Total Primary Government $ 776 $ 1,171 $ 1,255 $ 1,366
2016 2015 2014 2013
Source: Department of Accounts

Commonwealth of Virginia 303
1,616 1,483 1,436 1,366 1,389 1,366160 459 371 (117) 70 328853 686 524 341 350 438633 598 584 573 552 525
5 4 5 6 7 7259 247 241 226 216 20732 28 30 24 24 218 8 7 9 8 7
16 19 17 27 26 298 7 10 9 10 10
55 53 53 51 51 507 8 2 2 2 21 - - - 1 1- 1 4 105 39 36- - - - - -
3,653 3,601 3,284 2,622 2,745 3,027$ 16,540 $ 17,228 $ 17,102 $ 13,497 $ 12,354 $ 11,858
$ (18,767) $ (17,753) $ (16,973) $ (18,590) $ (18,154) $ (18,337)892 842 248 (112) 355 814
$ (17,875) $ (16,911) $ (16,725) $ (18,702) $ (17,799) $ (17,523)
$ 10,814 $ 10,050 $ 8,779 $ 9,559 $ 10,100 $ 9,6393,885 3,669 3,569 3,554 3,821 3,756
979 852 846 546 772 906900 903 891 889 924 930538 495 440 406 534 588423 557 456 - - -391 406 414 365 356 385115 113 112 103 106 89849 795 777 814 1,025 1,16149 48 49 60 54 5084 63 205 143 349 477
465 286 427 237 224 154- - - - - -
668 615 597 591 593 564- - - - - 20
20,160 18,852 17,562 17,267 18,858 18,719
9 9 10 13 12 121 1 2 4 12 11- - - - 1 -- - - - - -
(668) (614) (597) (591) (593) (563)(658) (604) (585) (574) (568) (540)
$ 19,502 $ 18,248 $ 16,977 $ 16,693 $ 18,290 $ 18,179
$ 1,394 $ 1,099 $ 589 $ (1,323) $ 704 $ 381234 238 (337) (686) (213) 274
$ 1,628 $ 1,337 $ 252 $ (2,009) $ 491 $ 655
20072012 2011 2010 2009 2008

304 Commonwealth of Virginia
Changes in Fund Balance, Governmental FundsModified Accrual Basis of AccountingLast Ten Fiscal Years(Dollars in Millions)
RevenuesTaxes $ 22,296 $ 21,557 $ 20,499 $ 19,400Rights and Privileges 977 978 950 957Institutional Revenue 267 303 325 360Interest, Dividends, Rents, and Other Investment Income 134 91 144 83Federal Grants and Contracts 9,885 9,727 9,681 9,913Other 1,535 1,514 1,362 1,350Total Revenues 35,094 34,170 32,961 32,063
ExpendituresGeneral Government 2,821 2,544 2,538 2,424Education 9,373 9,372 8,970 8,886Transportation 5,817 5,348 5,057 4,613Resources and Economic Development 915 929 912 876Individual and Family Services 14,186 13,421 13,196 13,039Administration of Justice 2,801 2,690 2,724 2,566Capital Outlay 331 251 194 219Debt Service:
Principal Retirement 424 441 421 474Interest and Charges 282 276 279 289
Total Expenditures 36,950 35,272 34,291 33,386Revenues Over (Under) Expenditures (1,856) (1,102) (1,330) (1,323)
Other Financing Sources (Uses)Transfers In 1,673 1,706 1,661 1,625Transfers Out (884) (972) (927) (940)Notes Issued 4 7 16 22Insurance Recoveries 1 1 - 1Capital Leases Issued 1 - - -Bonds Issued 274 671 273 264Premium on Debt Issuance 45 150 75 85Refunding Bonds Issued 76 536 277 201Sale of Capital Assets 15 24 16 96Payments to Refunded Bond Escrow Agents (93) (618) (337) (258)Total Other Financing Sources (Uses) 1,112 1,505 1,054 1,096
Net Change in Fund Balances $ (744) $ 403 $ (276) $ (227)
Debt Service as a Percentage ofNoncapital Expenditures (1) 2.05% 2.22% 2.21% 2.58%
2016 2015 2014 2013
(1) Noncapital expenditures exclude expenditures for capital outlay, which are recorded by function. The majority of these expenditures were for Transportation.
Source: Department of Accounts

Commonwealth of Virginia 305
$ 18,748 $ 17,825 $ 16,187 $ 16,276 $ 17,659 $ 17,436921 917 869 889 933 826385 384 403 409 390 360
164 159 294 218 452 5329,933 10,749 10,628 8,112 6,627 6,2031,337 1,238 1,196 1,100 1,177 1,027
31,488 31,272 29,577 27,004 27,238 26,384
2,322 2,439 2,306 1,889 2,047 2,0308,733 8,683 8,842 9,260 8,940 8,7004,474 3,860 3,401 3,704 3,883 3,141
870 886 897 990 868 81212,682 12,688 12,236 10,764 9,345 8,9962,422 2,398 2,399 2,531 2,543 2,398
330 439 619 612 845 809
423 456 420 416 362 322262 233 206 207 203 192
32,518 32,082 31,326 30,373 29,036 27,400(1,030) (810) (1,749) (3,369) (1,798) (1,016)
1,770 1,498 1,624 1,571 1,663 1,637(1,097) (876) (1,022) (976) (1,070) (1,072)
10 37 20 21 - 163 8 5 8 6 71 2 1 1 5 4
1,196 883 941 646 416 593217 71 44 46 23 40319 51 124 68 59 123
4 3 4 4 7 8(373) (55) (146) (74) (62) (131)
2,050 1,622 1,595 1,315 1,047 1,225
$ 1,020 $ 812 $ (154) $ (2,054) $ (751) $ 209
2.29% 2.30% 2.04% 2.09% 2.00% 1.93%
2012 2011 2010 20072009 2008

306 Commonwealth of Virginia
Fund Balance, Governmental FundsModified Accrual Basis of AccountingLast Ten Fiscal Years(Dollars in Millions)
General FundReserved (1) $ - $ - $ - $ -Unreserved (1) - - - -Nonspendable 114 120 111 120Restricted 908 1,086 971 962Committed 397 296 330 503Unassigned (709) (653) (782) (947)
Total $ 710 $ 849 $ 630 $ 638
All Other Governmental FundsSpecial Revenue Funds
Reserved (1) $ - $ - $ - $ -Unreserved (1) - - - -Nonspendable 159 128 104 118Restricted 583 759 880 588Committed 2,094 2,244 2,145 2,556Assigned 29 29 17 14Unassigned - (60) - -
Debt Service FundsReserved (1) - - - -Restricted 22 45 44 35
Capital Projects FundsUnreserved (1) - - - -Restricted 40 288 53 214
Permanent FundsUnreserved (1) - - - -Nonspendable 34 35 34 31Restricted 1 1 1 1
Total $ 2,962 $ 3,469 $ 3,278 $ 3,557
2016 2015 2014 2013
(1) GASB Statement No. 54 changes in fund balance information presented in this section began with fiscal year 2011. Fund balances prior to fiscal year 2011 were not reclassified because this was deemed impractical. The nature of the difference between fiscal year 2011 forward and all prior years relates to fund balances for those prior years not being reclassified to GASB Statement No. 54 fund classifications. For additional information on fund balance classifications, see Note 3, Fund Balance Classifications.
Source: Department of Accounts

Commonwealth of Virginia 307
$ - $ - $ 395 $ 670 $ 1,125 $ 1,420- - (1,069) (928) 78 564
118 113 - - - -729 464 - - - -486 410 - - - -
(821) (1,046) - - - -
$ 512 $ (59) $ (674) $ (258) $ 1,203 $ 1,984
$ - $ - $ 410 $ 204 $ 242 $ 280- - 2,502 2,325 3,072 3,060
105 111 - - - -567 422 - - - -
2,923 2,683 - - - -12 10 - - - -
- - - - - -
- - 105 102 101 9779 68 - - - -
- - 206 331 134 81202 145 - - - -
- - 47 45 52 5328 29 - - - -1 1 - - - -
$ 3,917 $ 3,469 $ 3,270 $ 3,007 $ 3,601 $ 3,571
20112012 2007200820092010
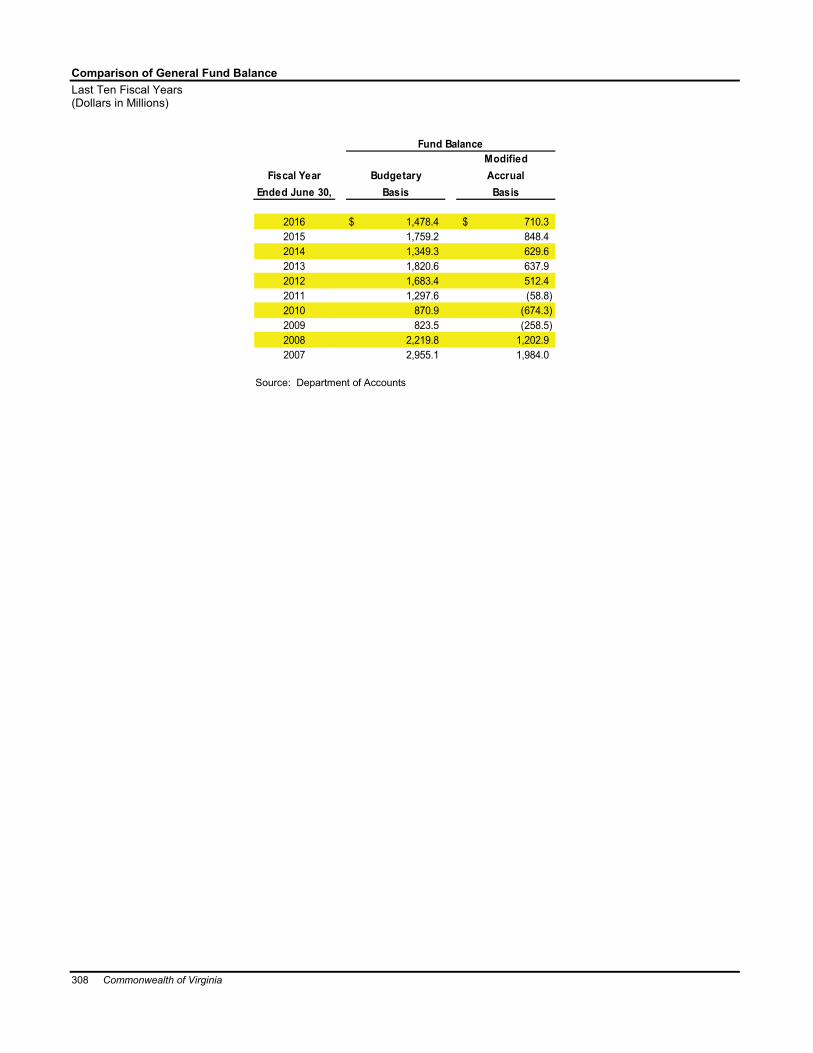
308 Commonwealth of Virginia
Comparison of General Fund BalanceLast Ten Fiscal Years(Dollars in Millions)
Fiscal YearEnded June 30,
2016 $ 1,478.4 $ 710.32015 1,759.2 848.42014 1,349.3 629.62013 1,820.6 637.92012 1,683.4 512.42011 1,297.6 (58.8)2010 870.9 (674.3)2009 823.5 (258.5)2008 2,219.8 1,202.92007 2,955.1 1,984.0
Fund Balance
BudgetaryBasis
ModifiedAccrualBasis
Source: Department of Accounts

Commonwealth of Virginia 309
Revenue Capacity

310 Commonwealth of Virginia
Personal Income Tax RatesLast Ten Fiscal Years(Dollars in Millions)
For the Fiscal Personal AverageYear Ended Income Tax Personal Effective
June 30, Collections (1) Income (2)(3) Rate (3)(4)
2016 12,556$ 449,181$ 2.80%2015 12,329 435,029 2.83%2014 11,253 415,205 2.71%2013 11,340 399,887 2.84%2012 10,613 401,097 2.65%2011 9,944 383,411 2.59%2010 9,088 362,706 2.51%2009 9,481 351,561 2.70%2008 10,115 362,092 2.79%2007 9,788 344,190 2.84%
(1) Tax revenues from individual and fiduciary income tax.(2) Personal income amounts provided by U.S. Bureau of Economic Analysis website.(3) Amounts for fiscal years 2007-2015 were revised to reflect the incorporation of newly available and revised source data, as well as improved
estimating methodologies.(4) Average effective rate equals tax collections divided by income.
Sources: Department of TaxationU.S. Bureau of Economic Analysis
Effective Tax Rates (1)Tax Years 2006-2015
Income Tax Bracket Tax Rate
$0 - $3,000 2.00%$3,000 - $5,000 2.00% - 2.40%
$5,000 - $17,000 2.40% - 4.23%$17,000 - $30,000 4.23% - 4.89%$30,000 - $50,000 4.89% - 5.23%
$50,000 - $100,000 5.23% - 5.49%Over $100,000 5.49% up to 5.75%
(1) Amounts shown are for all filing status returns.
Source: Department of Taxation
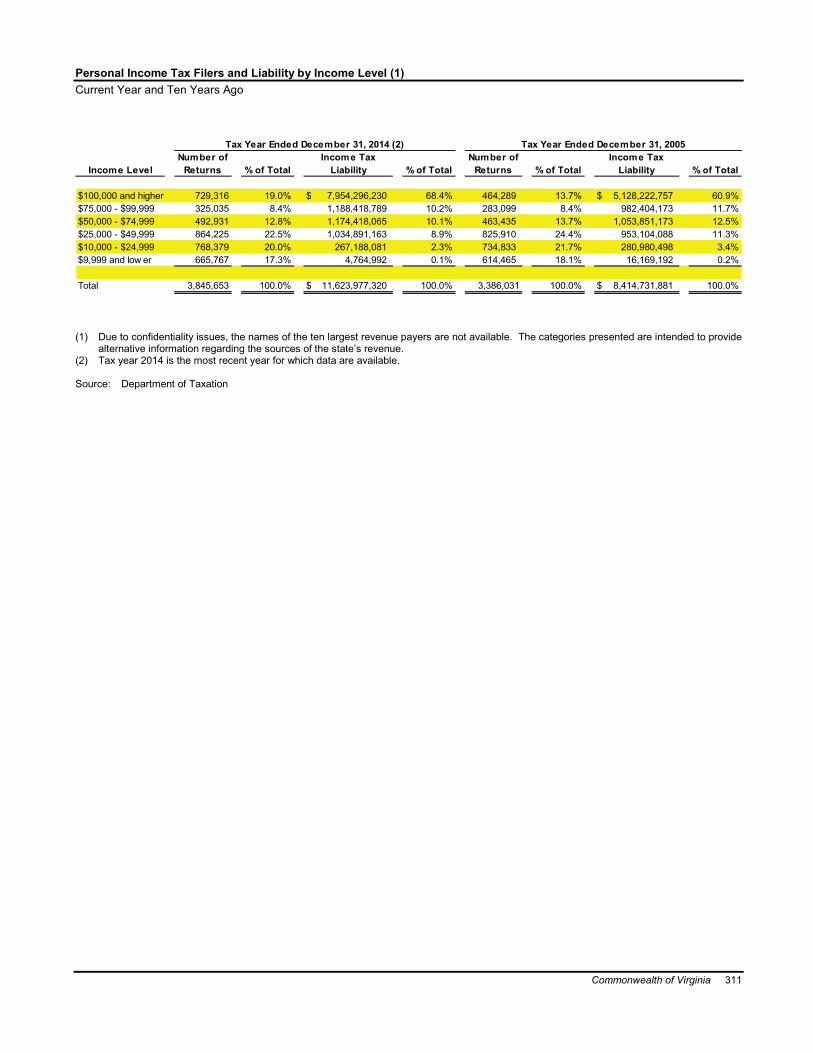
Commonwealth of Virginia 311
Personal Income Tax Filers and Liability by Income Level (1)Current Year and Ten Years Ago
Income LevelNumber of
Returns % of Total % of TotalNumber of
Returns % of Total % of Total
$100,000 and higher 729,316 19.0% $ 7,954,296,230 68.4% 464,289 13.7% $ 5,128,222,757 60.9%$75,000 - $99,999 325,035 8.4% 1,188,418,789 10.2% 283,099 8.4% 982,404,173 11.7%$50,000 - $74,999 492,931 12.8% 1,174,418,065 10.1% 463,435 13.7% 1,053,851,173 12.5%$25,000 - $49,999 864,225 22.5% 1,034,891,163 8.9% 825,910 24.4% 953,104,088 11.3%$10,000 - $24,999 768,379 20.0% 267,188,081 2.3% 734,833 21.7% 280,980,498 3.4%$9,999 and low er 665,767 17.3% 4,764,992 0.1% 614,465 18.1% 16,169,192 0.2%
Total 3,845,653 100.0% $ 11,623,977,320 100.0% 3,386,031 100.0% $ 8,414,731,881 100.0%
Tax Year Ended December 31, 2014 (2) Tax Year Ended December 31, 2005Income Tax
Liability Income Tax
Liability
(1) Due to confidentiality issues, the names of the ten largest revenue payers are not available. The categories presented are intended to provide alternative information regarding the sources of the state’s revenue.
(2) Tax year 2014 is the most recent year for which data are available.
Source: Department of Taxation
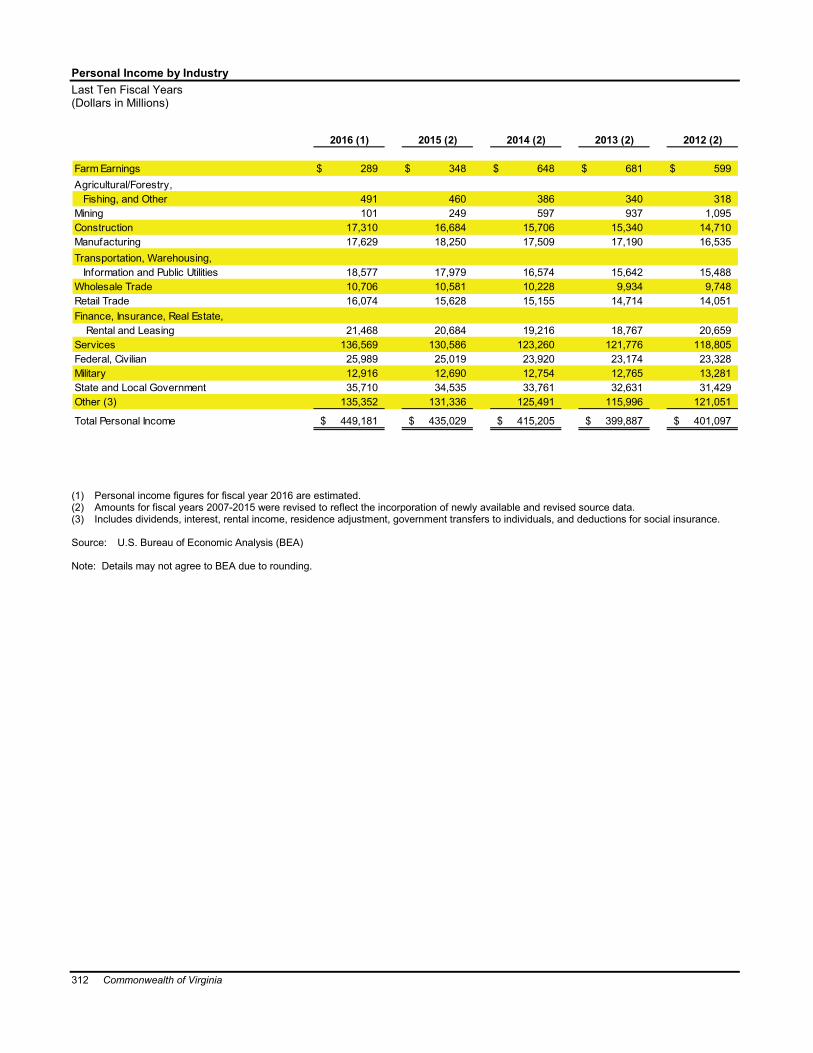
312 Commonwealth of Virginia
Personal Income by Industry Last Ten Fiscal Years(Dollars in Millions)
Farm Earnings $ 289 $ 348 $ 648 $ 681 $ 599Agricultural/Forestry, Fishing, and Other 491 460 386 340 318Mining 101 249 597 937 1,095Construction 17,310 16,684 15,706 15,340 14,710Manufacturing 17,629 18,250 17,509 17,190 16,535Transportation, Warehousing, Information and Public Utilities 18,577 17,979 16,574 15,642 15,488Wholesale Trade 10,706 10,581 10,228 9,934 9,748Retail Trade 16,074 15,628 15,155 14,714 14,051Finance, Insurance, Real Estate, Rental and Leasing 21,468 20,684 19,216 18,767 20,659Services 136,569 130,586 123,260 121,776 118,805Federal, Civilian 25,989 25,019 23,920 23,174 23,328Military 12,916 12,690 12,754 12,765 13,281State and Local Government 35,710 34,535 33,761 32,631 31,429Other (3) 135,352 131,336 125,491 115,996 121,051
Total Personal Income $ 449,181 $ 435,029 $ 415,205 $ 399,887 $ 401,097
2016 (1) 2015 (2) 2014 (2) 2013 (2) 2012 (2)
(1) Personal income figures for fiscal year 2016 are estimated.(2) Amounts for fiscal years 2007-2015 were revised to reflect the incorporation of newly available and revised source data.(3) Includes dividends, interest, rental income, residence adjustment, government transfers to individuals, and deductions for social insurance.
Source: U.S. Bureau of Economic Analysis (BEA)
Note: Details may not agree to BEA due to rounding.

Commonwealth of Virginia 313
$ 513 $ 255 $ 227 $ 312 $ 221
267 264 251 242 309982 880 704 869 711
13,568 13,259 13,383 16,244 17,85416,124 15,834 15,619 16,950 17,248
16,009 16,263 16,823 17,133 17,3819,795 9,190 9,235 9,651 9,665
13,562 13,307 12,823 13,472 13,994
17,526 17,151 14,951 16,450 16,915114,884 110,115 106,876 104,439 98,07722,952 22,206 20,113 19,045 18,01213,399 13,833 13,326 13,048 12,47430,908 31,074 30,780 29,697 28,256
112,922 99,075 96,450 104,540 93,073
$ 383,411 $ 362,706 $ 351,561 $ 362,092 $ 344,190
2008 (2) 2007 (2)2011 (2) 2010 (2) 2009 (2)

314 Commonwealth of Virginia
Taxable Sales by Business Class (1) (2)Last Ten Calendar Years(Dollars in Millions)
Alcoholic Beverage 718 676 640 559 567Apparel 5,001 4,918 6,668 6,545 4,749Automotive 3,159 3,024 2,945 2,860 2,717Food 30,627 28,972 27,924 27,150 25,691Fuel 1,967 1,864 1,880 1,899 1,828Furniture, Home Furnishings, and Equipment 2,840 2,663 2,645 2,612 2,538General Merchandise 21,917 21,693 21,852 21,568 20,635Hotels, Motels, Tourist Camps, etc. 3,452 3,238 3,098 3,107 2,988Lumber, Building Materials, and Supply 8,865 8,589 8,513 8,112 7,750Machinery, Equipment, and Supplies 330 303 300 357 309Miscellaneous 19,067 17,994 16,031 16,228 16,341Other Miscellaneous and Unidentif iable 2,273 2,270 2,088 2,321 2,955Total $ 100,216 $ 96,204 $ 94,584 $ 93,318 $ 89,068
Direct Sales Tax Rate (2) 5.3% 5.3% 5.3% 5.0% 5.0%
2015 2014 2013 2012 2011
(1) Retail sales information is available only on a calendar-year basis.(2) Effective July 1, 2013, the sales tax rate increased from 5.0 percent to 5.3 percent.
Source: Department of Taxation

Commonwealth of Virginia 315
545 532 517 487 4574,601 4,494 5,015 5,191 4,9172,555 2,397 2,440 2,563 2,416
24,617 24,134 23,721 22,502 19,8561,691 1,582 1,539 1,729 1,7782,442 2,519 3,013 3,448 3,684
19,836 19,577 19,387 19,574 17,1042,837 2,804 3,066 3,079 3,0007,652 7,369 8,140 9,354 9,805
243 173 241 238 21316,402 16,780 18,527 18,301 17,4792,997 3,505 4,495 5,577 8,765
$ 86,418 $ 85,866 $ 90,101 $ 92,043 $ 89,474
5.0% 5.0% 5.0% 5.0% 5.0%
2006200720082010 2009
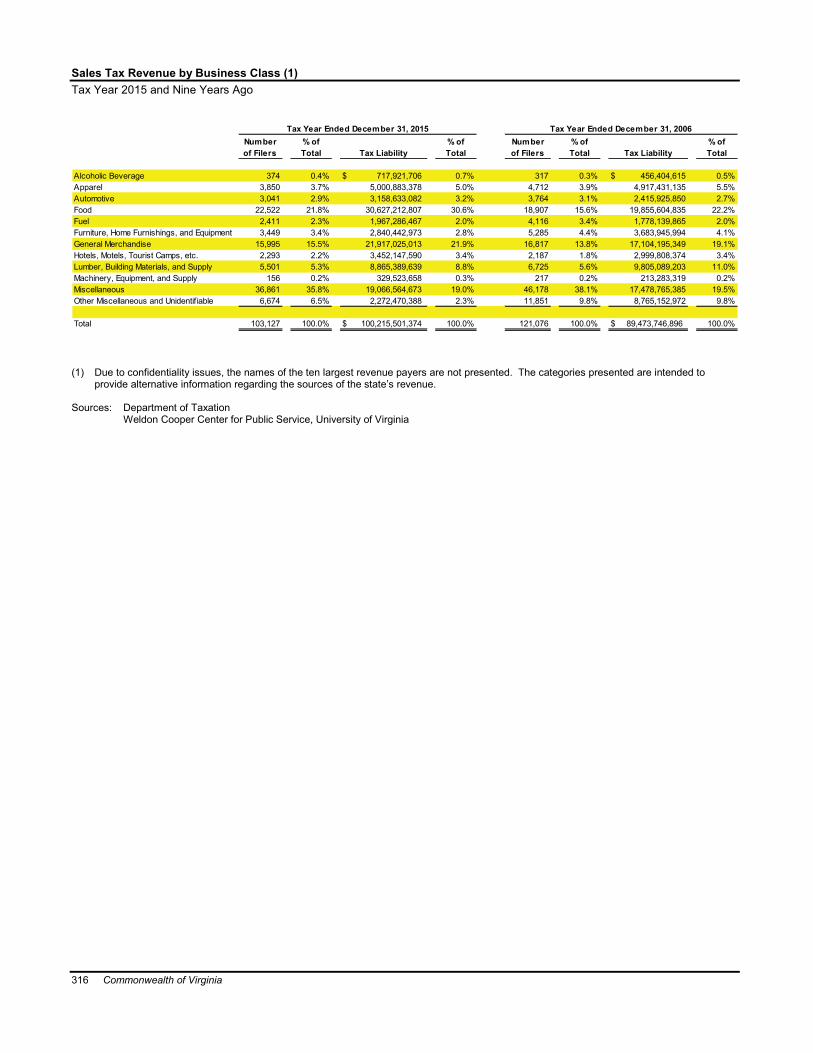
316 Commonwealth of Virginia
Sales Tax Revenue by Business Class (1)Tax Year 2015 and Nine Years Ago
Number of Filers
% of Total
% of Total
Number of Filers
% of Total
% of Total
Alcoholic Beverage 374 0.4% $ 717,921,706 0.7% 317 0.3% $ 456,404,615 0.5%Apparel 3,850 3.7% 5,000,883,378 5.0% 4,712 3.9% 4,917,431,135 5.5%Automotive 3,041 2.9% 3,158,633,082 3.2% 3,764 3.1% 2,415,925,850 2.7%Food 22,522 21.8% 30,627,212,807 30.6% 18,907 15.6% 19,855,604,835 22.2%Fuel 2,411 2.3% 1,967,286,467 2.0% 4,116 3.4% 1,778,139,865 2.0%Furniture, Home Furnishings, and Equipment 3,449 3.4% 2,840,442,973 2.8% 5,285 4.4% 3,683,945,994 4.1%General Merchandise 15,995 15.5% 21,917,025,013 21.9% 16,817 13.8% 17,104,195,349 19.1%Hotels, Motels, Tourist Camps, etc. 2,293 2.2% 3,452,147,590 3.4% 2,187 1.8% 2,999,808,374 3.4%Lumber, Building Materials, and Supply 5,501 5.3% 8,865,389,639 8.8% 6,725 5.6% 9,805,089,203 11.0%Machinery, Equipment, and Supply 156 0.2% 329,523,658 0.3% 217 0.2% 213,283,319 0.2%Miscellaneous 36,861 35.8% 19,066,564,673 19.0% 46,178 38.1% 17,478,765,385 19.5%Other Miscellaneous and Unidentif iable 6,674 6.5% 2,272,470,388 2.3% 11,851 9.8% 8,765,152,972 9.8%
Total 103,127 100.0% $ 100,215,501,374 100.0% 121,076 100.0% $ 89,473,746,896 100.0%
Tax Year Ended December 31, 2015
Tax Liability
Tax Year Ended December 31, 2006
Tax Liability
(1) Due to confidentiality issues, the names of the ten largest revenue payers are not presented. The categories presented are intended to provide alternative information regarding the sources of the state’s revenue.
Sources: Department of TaxationWeldon Cooper Center for Public Service, University of Virginia

Commonwealth of Virginia 317
Debt Capacity

318 Commonwealth of Virginia
Ratios of Outstanding Debt by TypeLast Ten Fiscal Years(Amounts in Thousands except Per Capita)
Debt as a For the Fiscal Percentage
Year Ended of PersonalJune 30, Income (2)
2016 $ 601,632 $ 5,826,798 $ 200,227 $ - $ 5,359 $ 6,634,016 1.48% $ 7872015 675,371 5,911,768 222,877 320,110 5,708 7,135,834 1.64% 8502014 742,869 5,555,935 233,002 317,305 6,072 6,855,183 1.65% 8232013 791,992 5,593,228 285,594 314,662 6,453 6,991,929 1.75% 8492012 873,741 5,703,448 326,543 - 449 6,904,181 1.72% 8442011 960,374 4,701,764 348,972 - 918 6,012,028 1.57% 7492010 1,049,386 4,120,056 366,170 - 1,594 5,537,206 1.53% 7022009 1,077,520 3,549,958 373,594 - 2,883 5,003,955 1.42% 6382008 1,001,989 3,345,259 312,890 - 4,082 4,664,220 1.29% 6012007 900,329 3,363,275 341,574 - 2,610 4,607,788 1.34% 599
Bonds Bonds Bonds Obligations (1)
Business-type Activities
ObligationGeneral Non- General
ObligationCapita (3)
PerAmountTotal
PrimaryGovernment
Governmental ActivitiesOther
Long-termObligations (1)
Non-GeneralObligation
OtherLong-term
(1) Pension, compensated absences, other postemployment benefits, other liabilities, lottery prizes payable, tuition benefits payable, and pollution remediation obligations have been excluded.
(2) Personal income amounts used for this calculation were obtained from the U. S. Bureau of Economic Analysis. (3) Population statistics used in this calculation were provided by the Department of Taxation. Fiscal year 2016 population was estimated.
Sources: Department of AccountsDepartment of TaxationU. S. Bureau of Economic Analysis

Commonwealth of Virginia 319
Ratios of General Obligation Bonded Debt OutstandingLast Ten Fiscal Years(Amounts in Thousands except Per Capita)
For theFiscal Year Percentage
Ended of TaxJune 30, Revenues [5]
2016 $ 571,915 $ 29,717 $ 877,118 $ 1,478,750 11.78% $ 1752015 642,181 33,190 936,857 1,612,228 13.08% 1922014 706,192 36,677 925,086 1,667,955 14.82% 2002013 752,493 39,499 877,858 1,669,850 14.73% 2032012 831,148 42,593 906,474 1,780,215 16.77% 2182011 914,574 45,800 765,280 1,725,654 17.35% 2152010 999,841 49,545 631,275 1,680,661 18.49% 2132009 1,040,636 36,884 573,550 1,651,070 17.41% 2112008 935,105 66,884 487,296 1,489,285 14.72% 1922007 821,563 78,766 411,842 1,312,171 13.41% 171
9(b) [3] 9(c) [4] 9(c) TotalGovernmental
Capita [6]Per
General Bonded Debt Outstanding [1] [2]Higher Education
Amount
[1] Beginning with fiscal year 2014, GASB Statement No. 65 removed deferrals of debt defeasance from the debt balances. Balances reported in prior fiscal years netted the deferrals against the debt balances. Amounts are net of unamortized premiums, discounts, deferrals on debt defeasance, and/or issuance expenses.
[2] There are currently no Section 9(a) bonds outstanding. [3] Section 9(b) bonds have been authorized by the citizens of Virginia through bond referenda to finance capital projects. These bonds are
retired through the use of state appropriations.[4] Section 9(c) bonds are issued to finance capital projects which, when completed, will generate revenue to repay the debt.[5] Individual and fiduciary Income tax collections were used for this calculation.[6] Population statistics used in this calculation are provided by the Department of Taxation. Fiscal year 2016 population was estimated.
Source: Department of Accounts

320 Commonwealth of Virginia
Computation of Legal Debt Limit and MarginLast Ten Fiscal Years(Dollars in Thousands)
Tax Revenues Required for ComputationTaxes on Income and Retail Sales: Individual and Fiduciary Income Tax [1] $ 12,555,624 $ 12,328,675 $ 11,253,348 $ 11,339,965 Corporate Income Tax [2] 764,948 831,907 757,491 796,728 State Sales and Use Tax [3] 3,651,400 3,587,849 3,399,223 3,419,489 Total $ 16,971,972 $ 16,748,431 $ 15,410,062 $ 15,556,182
Average Tax Revenues (Three Fiscal Years) $ 16,376,822 $ 15,904,892 $ 15,251,227 $ 14,766,900
Section 9(a) [2] General Obligation Debt Limit [4]Debt Issuance Limit (30% of 1.15 times annual tax revenues) $ 5,855,330 $ 5,778,209 $ 5,316,471 $ 5,366,883 Less Bonds Outstanding: - - - - Debt Issuance Margin for Section 9(a) [2] General Obligation Bonds $ 5,855,330 $ 5,778,209 $ 5,316,471 $ 5,366,883
Debt Applicable to Limit as a % Limit 0.00% 0.00% 0.00% 0.00%
Section 9(b) General Obligation Debt Limit Debt Issuance Limit (1.15 times average tax revenues for three f iscal years) $ 18,833,345 $ 18,290,626 $ 17,538,911 $ 16,981,935 Less Bonds Outstanding:** Public Facilities Bonds [6] 571,915 642,181 706,192 752,493 Transportation Facilities Refunding Bonds [5] [6] - - - - Debt Issuance Margin for Section 9(b) General Obligation Bonds $ 18,261,430 $ 17,648,445 $ 16,832,719 $ 16,229,442
Debt Applicable to Limit as a % Limit 3.04% 3.51% 4.03% 4.43%
Additional Section 9(b) Debt Borrow ing Restriction:Four-year Authorization Restriction (25% of 9(b) Debt Limit) $ 4,708,336 $ 4,572,656 $ 4,384,728 $ 4,245,484 Less 9(b) Debt authorized in past three f iscal years - - - - Maximum Additional Borrow ing Restriction (amount that may be authorized by the General Assembly) $ 4,708,336 $ 4,572,656 $ 4,384,728 $ 4,245,484
Section 9(c) General Obligation Debt Limit Debt Issuance Limit (1.15 times average tax revenues for three f iscal years) $ 18,833,345 $ 18,290,626 $ 17,538,911 $ 16,981,935 Less Bonds Outstanding:** Parking Facilities Bonds [6] 15,155 16,036 17,045 17,538 Transportation Facilities Bonds [6] 14,562 17,154 19,632 21,961 Higher Educational Institution Bonds [6] 877,118 936,857 925,086 877,858 Debt Issuance Margin for Section 9(c) General Obligation Bonds $ 17,926,510 $ 17,320,579 $ 16,577,148 $ 16,064,578
Debt Applicable to Limit as a % Limit 4.82% 5.30% 5.48% 5.40%
2016 2015 2014 2013
**Bonds included on this schedule are only those which are backed by the full faith and credit of the Commonwealth.[1] Includes taxes imposed pursuant to Articles 2 and 9 of Chapter 3, Title 58.1 of the Code of Virginia.[2] Includes taxes imposed pursuant to Article 10 of Chapter 3, Title 58.1 of the Code of Virginia.[3] Includes taxes imposed pursuant to Chapter 6, Title 58.1 of the Code of Virginia, less taxes identified in Sections 58.1-605 and 58.1-638.[4] Debt limit applies only to debt authorized pursuant to Article X, Section 9(a)(2) of the Constitution of Virginia.[5] These bonds refunded certain Section 9(c) debt, and because the Governor did not certify the feasibility of the refinanced project, it must be
applied against the Section 9(b) Debt Limit.[6] Beginning with fiscal year 2014, GASB Statement No. 65 removed deferrals of debt defeasance from the debt balances. Balances reported in
prior fiscal years netted the deferrals against the debt balances. Net of unamortized discounts, premiums, and/or deferral on debt defeasance.
Sources: Department of AccountsDepartment of the Treasury

Commonwealth of Virginia 321
$ 10,612,836 $ 9,944,370 $ 9,088,252 $ 9,481,109 $ 10,114,833 $ 9,787,592859,923 822,259 806,473 648,033 807,852 879,575
3,314,677 3,190,452 3,264,210 3,116,831 3,302,181 3,274,286$ 14,787,436 $ 13,957,081 $ 13,158,935 $ 13,245,973 $ 14,224,866 $ 13,941,453
$ 13,967,817 $ 13,453,996 $ 13,543,258 $ 13,804,097 $ 13,792,131 $ 13,071,436
$ 5,101,665 $ 4,815,193 $ 4,539,833 $ 4,569,861 $ 4,907,579 $ 4,809,801- - - - - -
$ 5,101,665 $ 4,815,193 $ 4,539,833 $ 4,569,861 $ 4,907,579 $ 4,809,801
0.00% 0.00% 0.00% 0.00% 0.00% 0.00%
$ 16,062,990 $ 15,472,096 $ 15,574,747 $ 15,874,712 $ 15,860,950 $ 15,032,151
831,148 914,574 993,372 1,027,941 916,483 797,300- - 6,469 12,696 18,622 24,263
$ 15,231,842 $ 14,557,522 $ 14,574,906 $ 14,834,075 $ 14,925,845 $ 14,210,588
5.17% 5.91% 6.42% 6.56% 5.90% 5.47%
$ 4,015,747 $ 3,868,024 $ 3,893,687 $ 3,968,678 $ 3,965,238 $ 3,758,038- - - - - -
$ 4,015,747 $ 3,868,024 $ 3,893,687 $ 3,968,678 $ 3,965,238 $ 3,758,038
$ 16,062,990 $ 15,472,096 $ 15,574,747 $ 15,874,712 $ 15,860,950 $ 15,032,151
18,383 19,445 21,151 6,527 7,590 8,80424,210 26,355 28,394 30,358 59,294 69,962
906,474 765,280 631,275 573,550 487,296 411,842
$ 15,113,923 $ 14,661,016 $ 14,893,927 $ 15,264,277 $ 15,306,770 $ 14,541,543
5.91% 5.24% 4.37% 3.85% 3.49% 3.26%
2010 2009 2008 200720112012

322 Commonwealth of Virginia
Schedule of Pledged Revenue Bond CoveragePrimary Government 9(d) General Long-term DebtLast Ten Fiscal Years(Dollars in Thousands except Coverage)
NetFor the Fiscal Available
Year Ended Balance, Pledged Operating forJune 30, as restated (1) Revenues Expenses (2) Debt Service Coverage
Primary Government Revenue Bonds: Route 460 Funding Corporation of 2016 $ 1,261 $ - $ 436 $ 825 $ - $ - - Virginia (4) (5) 2015 (20,991) - 524 (21,515) - 11,726 (1.83) (Series 2012A and 2012B CAB) 2014 (8,958) - 448 (9,406) - 12,084 (0.78)
2013 - - 130 (130) - - -
Requirements (3) (4) Debt Service
Principal Interest
Beginning
(1) The Route 460 Funding Corporation of Virginia was restated due to the implementation of GASB Statement No. 65 in fiscal year 2014.(2) Operating expenses are exclusive of principal and interest.(3) Includes principal and interest of revenue bonds only. Does not include debt defeasance transactions.(4) This entity was established in fiscal year 2013. No debt service payments were required during fiscal year 2013.(5) The Route 460 Funding Corporation of Virginia continuing operations ceased during fiscal year 2016.
Source: Department of Accounts

Commonwealth of Virginia 323
Demographic and Economic Information

324 Commonwealth of Virginia
Schedule of Demographic and Economic StatisticsLast Ten Fiscal Years
Public PrimaryPopulation Per Capita and Secondary
Fiscal Year In Thousands (1) Income (3) School Enrollment
2016 8,433 $ 449,180,761 $ 53,265 1,267,591 4.1 %2015 8,392 435,028,664 51,838 1,279,773 4.9 %2014 8,332 415,205,288 49,833 1,273,211 5.2 %2013 8,235 399,886,844 48,559 1,264,880 5.6 %2012 8,178 401,096,804 49,046 1,258,521 6.0 %2011 8,029 383,411,012 47,753 1,253,038 6.5 %2010 7,886 362,705,744 45,994 1,245,937 7.0 %2009 7,839 351,561,032 44,848 1,236,546 5.6 %2008 7,758 362,092,108 46,673 1,232,436 3.4 %2007 7,694 344,189,984 44,735 1,221,939 3.1 %
In Thousands (2)(3)Income
PersonalUnemployment
Rate
(1) Population figure for fiscal year 2016 is estimated.(2) Personal income amount for fiscal year 2016 is estimated. (3) Amounts for fiscal years 2007-2015 were revised to reflect the incorporation of newly available and revised source data, as well as improved
estimating methodologies.
Sources: Department of EducationDepartment of TaxationVirginia Employment CommissionU.S. Bureau of Economic Analysis
Principal Employers (1)Current Year and Nine Years Ago
Employer 2015 Rank (2) 2006 Rank
U.S. Department of Defense 1 1
Wal-Mart 2 2
Fairfax County Public Schools 3 3
Sentara Healthcare 4 8
Huntington Ingalls Industries, Inc. 5 4
Food Lion 6 5
U. S. Postal Service 7 7
County of Fairfax 8 6
U. S. Department of Homeland Defense (3) 9 -
HCA Virginia Health System (3) 10 -
(1) The Virginia Employment Commission is precluded from disclosing the actual number of employees per the Confidential Information Protection and Statistical Efficiency Act – Title V of Public Law 107-347. All Employers above have an employment size of 1,000 or more.
(2) Calendar year 2015 is the most recent information available.(3) Previous ranking not available.
Source: Virginia Employment Commission (1)

Commonwealth of Virginia 325
Operating Information

326 Commonwealth of Virginia
State Employees by Function (1)Last Ten Fiscal Years
2016 2015 2014 2013 2012
General GovernmentVirginia Information Technologies Agency 213 260 263 270 262Department of Taxation 862 855 877 873 917Department of General Services 594 608 614 621 624All other 1,730 1,675 1,663 1,677 1,571
EducationColleges and Universities 64,450 56,777 56,086 55,223 53,979All other 2,714 2,634 2,663 2,662 2,667
TransportationDepartment of Transportation 7,601 7,372 7,365 7,212 7,167Department of Motor Vehicles 2,078 2,023 2,040 1,999 1,926All other 317 263 198 193 190
Resources and Economic DevelopmentDepartment of Conservation & Recreation 1,130 1,106 747 1,165 933Department of Environmental Quality 814 826 822 779 731All other 2,935 2,957 2,950 2,898 2,957
Individual and Family ServicesDepartment of Health 3,408 3,565 3,593 3,646 3,784Behavioral Health Agencies 6,628 7,378 7,629 8,314 8,803All other 5,539 5,505 5,545 5,804 5,740
Administration of JusticeDepartment of State Police 2,725 2,773 2,792 2,779 2,640Department of Juvenile Justice 2,057 2,086 2,339 2,405 2,499Correctional Facilities 9,731 9,272 9,922 9,738 9,656All other 6,552 6,505 6,579 6,606 6,363
Business-type ActivitiesDepartment of Alcoholic Beverage Control 2,737 2,294 2,272 2,182 3,306Virginia Lottery 285 284 279 275 270All other 96 100 94 84 81
State Total (2) 125,196 117,118 117,332 117,405 117,066
(1) Includes salaried and wage employees but excludes adjunct faculty.(2) Totals have been rounded and may vary slightly from the Department of Human Resource Management reports.
Source: Department of Human Resource Management

Commonwealth of Virginia 327
2011 2010 2009 2008 2007
261 295 353 377 400976 1,044 947 1,014 927634 654 618 624 634
1,936 1,608 1,918 1,960 1,915
49,107 47,981 48,485 48,032 48,0043,287 3,276 3,551 3,806 3,811
7,024 6,852 8,261 8,680 8,8241,949 1,900 1,931 2,001 2,044
242 233 215 239 231
909 930 953 960 753743 768 800 842 882
3,001 2,874 3,334 3,369 3,412
3,827 3,856 3,750 3,800 3,9438,757 8,635 8,355 8,341 8,3615,576 5,622 5,957 5,550 5,540
2,627 2,533 2,671 2,668 2,7002,380 2,442 2,314 2,457 2,2959,656 9,623 10,437 10,802 10,4566,262 6,314 6,285 6,441 6,454
2,483 2,461 2,581 2,472 1,938267 257 252 241 26582 77 74 50 48
111,986 110,235 114,042 114,726 113,837

328 Commonwealth of Virginia
Operating Indicators by FunctionLast Ten Fiscal Years
2016 2015 2014 2013
General GovernmentVirginia Department of Taxation Number of Returns Processed (calendar year) (1) Not yet available 7,746,235 7,575,225 7,520,463Department of Accounts Number of Payments Processed Via Check 1,100,507 1,297,646 1,466,309 1,530,548 Number of Payments Processed Electronically 8,955,761 9,047,340 9,729,332 9,552,890 Percentage Processed Electronically 89.1% 87.5% 86.9% 86.2%
EducationState Council of Higher Education Number of Students Enrolled at State-supported Colleges and Universities 528,673 534,280 537,370 539,025Department of Education Number of Public Primary and Secondary School Enrollment 1,267,591 1,279,773 1,273,211 1,264,880
Resources and Economic DevelopmentDepartment of Environmental Quality Number of Permits Issued 2,564 7,173 5,890 1,750 Number of Inspections Conducted 7,962 7,848 8,307 9,044Department of Housing and Community Development Number of Housing Units Improved to Define Standards through Housing Programs 3,031 3,491 3,677 7,396Department of Agriculture and Consumer Services Number of Food Inspections Conducted 8,246 5,583 8,886 10,441 Number of Weights/Measure Equipment Inspected 79,876 82,355 76,342 62,488Department of Forestry Number of Firefighters Trained in Forest Fire Control 892 1,178 1,233 1,197
Individual and Family ServicesComprehensive Services for At-Risk Youth and Families Number of Youth Served 16,135 15,700 15,025 13,516Department for Aging and Rehabilitative Services Number of Medicare Recipients 1,358,179 1,328,435 1,203,462 1,244,136Department of Medical Assistance Services Number of Medicaid Recipients 1,319,227 1,255,960 1,177,922 1,046,790Department of Behavioral Health and Developmental Services (2) Number of Patients Served 2,104 2,229 2,269 2,455 Number of Beds Used 2,619 2,813 2,822 3,071Department of Social Services Average Number of Households Receiving Food Stamps 391,632 411,768 451,640 453,244 Number of Households Receiving Child Support Enforcement Assistance 310,933 314,377 320,942 347,729Department of Health Number of WIC Participants 239,711 249,499 244,181 267,465 Number of Childhood Immunizations Administered 1,371,582 1,534,373 1,675,572 1,736,396

Commonwealth of Virginia 329
2012 2011 2010 2009 2008 2007
7,446,060 6,969,581 6,998,747 7,079,611 6,893,047 6,746,596
1,624,902 1,658,227 1,625,763 1,715,164 2,597,746 1,431,9189,856,757 9,912,627 11,141,067 10,059,109 8,065,038 2,861,979
85.8% 85.7% 87.2% 85.4% 75.6% 66.7%
535,294 519,772 501,866 467,093 449,671 428,642
1,258,521 1,253,038 1,245,937 1,236,546 1,232,436 1,221,939
4,063 2,486 2,780 1,925 2,389 3,4919,834 10,441 11,804 11,599 11,721 11,730
7,279 7,675 7,231 5,198 3,248 3,392
12,966 12,003 13,516 14,639 17,551 14,62368,292 66,760 53,329 57,275 84,481 77,921
1,178 1,192 1,123 1,034 1,200 1,300
15,425 16,617 17,242 17,957 19,658 18,498
1,190,827 1,143,243 1,122,522 1,104,765 1,071,681 1,039,059
996,835 992,816 937,522 857,662 818,452 805,458
2,608 2,724 2,754 2,877 2,915 3,0033,471 3,317 3,396 3,533 2,891 2,988
434,223 396,613 350,599 277,498 240,821 228,116349,661 352,825 359,317 359,487 359,977 363,272
270,962 270,219 275,580 270,378 258,593 270,9181,439,233 1,773,402 1,602,907 1,470,403 1,455,166 1,076,412
Continued on next page

330 Commonwealth of Virginia
Operating Indicators by Function (Continued from previous page)Last Ten Fiscal Years
2016 2015 2014 2013
Administration of JusticeSupreme Court Number of Criminal Trials (calendar year) 642,216 686,795 699,270 720,630
Number of Civil Trials (calendar year) 1,166,073 1,171,042 1,232,899 1,264,219 Number of Traff ic Hearings (calendar year) 1,714,779 1,903,845 1,887,252 1,891,207
Compensation Board Number of Constitutional Off icers Receiving Financial Support 649 650 649 651
Department of State Police Number of Traff ic Citations Issued (calendar year) 592,670 644,218 686,812 588,307 Number of Arrests (calendar year) 22,320 20,608 21,777 19,611Department of Corrections
Number of Inmates 30,038 30,258 30,275 29,803
Virginia Lottery Number of Plays Sold - Pick 3 272,748,955 272,253,482 265,144,318 253,682,839 Number of Plays Sold - Pick 4 279,841,494 268,645,030 244,143,030 232,184,205
Number of Plays Sold - Cash 5 30,419,782 29,895,533 30,114,799 28,302,849 Number of Plays Sold - Megamillions 87,404,430 94,283,607 115,298,827 89,518,093
Number of Plays Sold - Win for Life (3) - 2,979,902 14,870,716 15,950,166 Number of Plays Sold - Decades of Dollars (3) - 9,365,110 12,236,092 13,243,504 Number of Plays Sold - Millionaire Raff le 6,600,000 6,600,000 6,600,000 6,945,500 Number of Plays Sold - Fast Play Bingo 29,243,465 24,205,141 20,095,274 16,581,338 Number of Plays Sold - Pow erball (4) 163,892,079 96,580,238 113,724,880 145,690,841 Number of Plays Sold - Bank A Million (5) 14,520,460 - - - Number of Plays Sold - Money Ball (6) 2,616,104 16,766,958 - - Number of Plays Sold - Cash 4 Life (6) 19,037,030 3,812,708 - - Number of Tickets Sold - Instant Tickets 1,100,574,151 1,018,488,394 988,592,675 887,139,810
Virginia College Savings Plan Number of Virginia529 prePAID Tuition Contractholders 65,101 66,364 70,490 68,637
Virginia Employment Commission Number of Individuals Receiving Unemployment Benefits 87,685 92,762 115,155 127,091 New Unemployment Benefit Claims 185,558 202,040 253,310 284,218
Business-type Activities
(1) Information for fiscal year 2016 is not yet available.(2) This agency is structured to provide services primarily in a community setting. Although they have a significant amount of capital and operating
costs in facility operations, inpatient treatment methodology is being deemphasized over time. Their inpatient census will continue to decline in the future. Over $250 million of community funding (state and Federal dollars) each fiscal year supports 40 community services boards across the Commonwealth. These entities serve approximately 300,000 Virginians each year.
(3) Win for Life and Decades for Dollars ended during fiscal year 2015; therefore, information for fiscal year 2016 and thereafter is not available.(4) Powerball began during fiscal year 2010; therefore, information for fiscal year 2009 and prior years is not available. (5) Bank A Million began during fiscal year 2016; therefore, information for fiscal year 2015 and prior years is not available. (6) Money Ball and Cash 4 Life began during fiscal year 2015; therefore, information for fiscal year 2014 and prior years is not available.

Commonwealth of Virginia 331
2012 2011 2010 2009 2008 2007
708,943 697,360 705,777 731,609 741,701 733,714 1,299,053 1,289,633 1,372,483 1,397,850 1,366,596 1,335,192
1,956,836 2,069,668 2,143,109 2,050,896 2,019,753 1,973,047
650 650 650 654 649 650
550,122 567,480 686,173 647,396 652,837 646,16619,460 20,132 22,713 23,996 22,475 23,348
29,685 32,116 31,735 32,708 33,157 31,647
243,270,273 241,963,816 246,899,030 250,634,329 256,605,411 265,398,821222,774,015 207,174,550 197,460,420 185,418,033 183,990,214 179,922,714
26,677,286 26,657,009 28,242,740 29,267,637 29,022,974 27,520,707140,240,940 138,496,457 174,882,294 162,095,735 166,144,927 130,299,581
17,682,922 21,052,138 28,440,948 32,128,730 37,717,958 41,323,62515,467,376 8,377,354 - - - -6,625,456 6,600,000 6,600,000 8,905,555 8,798,720 13,005,307
12,094,785 8,915,566 6,884,748 6,772,764 9,229,805 6,600,00089,046,990 66,614,340 34,562,352 - - -
- - - - - -- - - - - -- - - - - -
842,121,604 756,837,222 711,155,383 690,382,366 694,902,491 698,271,837
69,847 70,955 71,373 71,898 71,812 71,382
136,753 162,025 190,370 219,646 122,144 106,554318,935 360,657 418,431 474,777 279,939 260,804
Sources: Compensation BoardComprehensive Services for At-Risk Youth and FamiliesDepartment for Aging and Rehabilitative ServicesDepartment of Agriculture and Consumer ServicesDepartment of Behavioral Health and Developmental ServicesDepartment of CorrectionsDepartment of EducationDepartment of Environmental QualityDepartment of ForestryDepartment of HealthDepartment of Housing and Community DevelopmentDepartment of Medical Assistance ServicesDepartment of Social ServicesDepartment of State PoliceDepartment of TaxationDepartment of TransportationState Council of Higher EducationSupreme CourtVirginia College Savings PlanVirginia Employment CommissionVirginia Lottery

332 Commonwealth of Virginia
Capital Asset Statistics by Function (1)Last Ten Fiscal Years
2016 2015 2014 2013
General GovernmentDepartment of General Services Number of Buildings 64 65 63 62 Total Square Footage of Buildings 4,901,754 5,032,991 5,026,991 4,961,416 Vehicles 14,519 14,669 14,769 14,424
EducationState Council of Higher Education Campuses of In-State Institutions 246 231 276 252 Campuses of Out-of-State Institutions 129 132 146 142
TransportationDepartment of Transportation Bridges Maintained (1) Not yet available 13,098 13,089 13,049 State Maintained Highw ay Lane Miles (calendar year) (1) Not yet available 72,210 72,089 71,937 Vehicles 7,754 7,503 7,768 7,762 Number of Buildings (2) 3,489 3,492 3,488 3,501 Total Square Footage of Buildings 8,262,042 8,269,556 8,158,974 8,119,018
Resources and Economic DevelopmentDepartment Conservation & Recreation State Parks 39 39 37 37 Acres of State Parks (in thousands) 73 71 68 67 Natural Area Preserves 39 39 39 39 Acres of Natural Area Preserves (in thousands) 34 34 34 35 Historic Sites 3 3 3 3 Acres of Historic Sites (in thousands) 0.3 0.3 0.3 0.3 Number of Buildings (3) 1,359 1,360 1,345 1,345 Total Square Footage of Buildings 2,562,851 2,583,309 2,560,662 2,560,662Department of Forestry State Forests 23 23 23 23 Buildings 295 295 295 295 Total Square Footage of Buildings 600,602 600,602 600,602 600,602
Individual and Family ServicesDepartment of Behavioral Health and Developmental Services Number of Buildings 407 409 409 408 Total Square Footage of Buildings 5,568,709 5,571,068 5,534,625 5,523,762
Administration of JusticeDepartment of State Police Number of Stations 66 65 65 65 Number of Buildings 147 147 147 148 Total Square Footage of Buildings 685,109 685,109 685,109 681,987Department of Corrections Number of Buildings 1,858 1,823 1,843 1,881 Total Square Footage of Buildings 12,105,357 11,826,751 11,799,780 11,889,055
Business-type ActivitiesDepartment of Alcoholic Beverage Control Number of Buildings 24 24 24 24 Total Square Footage of Buildings 1,180,501 1,180,501 1,180,501 1,180,501
(1) Information not yet available for fiscal year 2016. (2) Includes storage sheds(3) Includes cabins

Commonwealth of Virginia 333
2012 2011 2010 2009 2008 2007
62 54 55 48 48 474,961,416 5,259,506 5,053,912 4,718,480 4,409,026 4,358,746
14,161 13,983 13,534 13,322 13,262 12,779
262 250 244 254 258 207158 166 121 87 67 63
13,042 12,926 12,949 12,912 12,603 12,60371,779 71,668 71,561 71,349 71,091 70,7847,797 7,593 7,734 8,185 9,060 9,4433,487 3,520 3,513 3,526 3,562 3,595
7,830,447 7,916,019 7,713,617 7,683,384 7,734,267 7,750,199
37 37 37 37 37 3769 69 71 69 68 6739 39 39 39 38 3531 30 30 29 28 253 3 3 3 3 3
0.3 0.3 0.3 0.3 0.3 0.31,164 1,164 1,164 1,168 991 991
1,152,257 1,152,257 1,152,257 1,154,487 1,223,427 1,223,427
22 22 19 19 19 17295 295 295 295 295 295
600,602 600,602 600,602 600,602 600,602 600,602
407 429 438 435 441 4495,169,937 5,901,505 5,744,389 5,743,088 6,037,953 6,161,843
65 65 64 66 66 66144 145 145 145 145 143
562,736 562,736 562,736 550,736 550,736 526,617
1,858 1,820 1,835 1,826 1,817 1,80911,872,765 11,771,319 11,920,234 12,160,909 11,963,087 11,787,810
25 25 25 24 22 211,185,501 1,185,501 1,185,501 1,142,273 787,348 784,548
Sources: Department of Conservation and Recreation Department of TransportationDepartment of Forestry Department of the TreasuryDepartment of Motor Vehicles State Council of Higher Education for VirginiaDepartment of State Police

334 Commonwealth of Virginia
Employees of the Department of Accounts
Deborah J. Abbott — Marla L. Anderson — Srikanth R. Annem — Diana K. Atusso — Kayla B. Barton — Demetria R. Baugh —Pamela P. Benos — Kristen N. Bolden — Henry A. Bosman — Jonolyn Brevard-Wills — Hope A. Broughman — Donna R. Brown— Maria A. Bryant — Megan R. Buchanan — Rudy B. Burgess — Rebecca G. Burton — Amy C. Butler — George W. Byrd —William H. Campbell — Adrian L. Carr — Donna L. Choice — David W. Clark — Kevita L. Clayborne — Sharon H. Cole —Shauntell D. Cox — Teresa P. Cox — Joseph M. Crawford — Monica T. Darden — Pamela W. Dodson — Keadra S. Dorman —Geneva G. Douglass — Bryan L. Duffee — Sarah B. Duncan — Valerie Dunmars-Hurdle — Robert D. Eddleton — Christine K. Elam — Constance H. Fisher — Lanine M. Fisher — Gwendolyn T. Fleming — Abigail C. Folliard — LaTanya M. Foreman —Wayne A. Gabbert — Kimberly M. Ganzert — Lora L. George — Cheryl M. Gibson — Hannah M. Goodman — Cathy P. Gravatt —Virginia G. Grigsby — Shannon M. Gulasky — Denise L. Halderman — Michael D. Hall — Michael J. Hall — Daniel J. Heilbronner — Dymesha J. Henderson — Tanesha N. Hill — Aimee N. Holland — Tiffany D. Hopkins — Robbin C. Huddleston — Rhonda S. Hutsell — Ashlyn S. Jinnette — Connie T. Jones — Marcy D. Jones — Shirleen L. Jones — Susan L. Jones — Lance O. Kaeberle — Christopher K. Kain — Jane V. Kearney — Esther Kim — Sharon H. Lawrence — Verna P. Left — Betsy M. Lewerenz —Steven W. Lewerenz — Alex C. Link — Shawn E. Livingston — Lewis R. McCabe, Jr. — Andrew C. McCarty — Nilca K. McClatchie — Stacy D. McCracken — Cathy C. McGill — Carlton R. McKinnon — JoAnne T. Macklin — Marianne P. Madison —Keeya L. Majors — Jessica B. Martin — Nancy W. Martin — Joan K. Matanic — Cynthia D. Matthews — William E. Matthews —Thomas E. Mays — Amanda R. Morris — Sandra Muir — Sarah K. Nearhood — Dirk K. North — Austin F. Oakes — Barbara S. Orndorff — Anne C. Pace — Douglas N. Page — Sara L. G. Page — Aneri Patel — Melinda L. Pearson — Richard M. Perconte —Kimberly T. Phillips — Frank J. Pitera — David E. Porter — Donna K. Rabender — Robert E. Ramey — Norma J. Roberts —Patrice A. Robinson — Catherine A. Royal — Timothy N. Sartini — Linda W. Scott — Joseph P. Schiavone — Brandon W. Shearin — Andrew Short — Felecia S. Smith — John J. Sotos — Jamie Z. Spears — Erin E. Sprouse — Fredrica J. Spurlock — Christina A. Stickler — Laura L. Swecker — Pamela W. Tauer — Joseph J. Teleoglou — Audra M. Terrell — Andrea P. Thornton — Imelda B. Tran — M. Christy Tuck — Jean S. Turlington — Elizabeth J. Vlahos — David A. Von Moll — Denise B. Waddy — Brandon W. Walton — Nekheeta S. Washington — Lynn K. Watley — Kim G. Webster — Kimberly N. White — Matthew K. Wiggins — John C. Willard — Eunice R. Williams — Lori L. Williams — Penny B. Williams — Raymond L. Williams, Jr. — Taylor E. Williams — Vera D. Williams — Lisa Wilson — Kim G. Wood — Jennifer A. Wykoff — Carol H. York — Janet L. Yu
Desktop Publishing and Graphics:Marianne P. Madison, Financial Reporting Analyst
and Knowledge Center AdministratorFinancial Reporting, Virginia Department of Accounts
This report was prepared by staff of the Virginia Department of Accountsand printed on a Konica Minolta 554e at a cost of $3.45 per copy.
This report is available for download from the World Wide Web.Our Internet address is www.doa.virginia.gov.

APPENDIX E
BOOK-ENTRY ONLY SYSTEM

[THIS PAGE INTENTIONALLY LEFT BLANK]

E-1
BOOK-ENTRY ONLY SYSTEM
The description that follows of the procedures and recordkeeping with respect to beneficial ownership interests in the 2017C Bonds, payments of principal, premium, if any, and interest on the 2017C Bonds to DTC, its nominee, Direct Participants, Indirect Participants, or Beneficial Owners, each as hereinafter defined, confirmation and transfer of beneficial ownership interests in the 2017C Bonds and other bond-related transactions by and between DTC, Direct Participants, and Indirect Participants and Beneficial Owners is based solely on information furnished by DTC.
The Depository Trust Company ("DTC"), New York, New York, will act as securities depository for the 2017C Bonds. The 2017C Bonds will be issued as fully-registered bonds registered in the name of Cede & Co. (DTC's partnership nominee) or such other name as may be requested by an authorized representative of DTC. One fully-registered certificate will be issued for each of the 2017C Infrastructure Revenue Bonds and the 2017C Moral Obligation Bonds, each in the aggregate principal amount of such series, and will be deposited with DTC.
DTC, the world's largest securities depository, is a limited-purpose trust company organized under the New York Banking Law, a "banking organization" within the meaning of the New York Banking Law, a member of the Federal Reserve System, a "clearing corporation" within the meaning of the New York Uniform Commercial Code, and a "clearing agency" registered pursuant to the provisions of Section 17A of the Securities Exchange Act of 1934. DTC holds and provides asset servicing for over 3.5 million issues of U.S. and non-U.S. equity issues, corporate and municipal debt issues, and money market instruments (from over 100 countries) that DTC's participants ("Direct Participants") deposit with DTC. DTC also facilitates the post-trade settlement among Direct Participants of sales and other securities transactions in deposited securities, through electronic computerized book-entry transfers and pledges between Direct Participants' accounts. This eliminates the need for physical movement of 2017C Bond certificates. Direct Participants include both U.S. and non-U.S. securities brokers and dealers, banks, trust companies, clearing corporations, and certain other organizations. DTC is a wholly-owned subsidiary of The Depository Trust & Clearing Corporation ("DTCC"). DTCC is the holding company for DTC, National Securities Clearing Corporation and Fixed Income Clearing Corporation, all of which are registered clearing agencies. DTCC is owned by the users of its regulated subsidiaries. Access to the DTC system is also available to others such as both U.S. and non-U.S. securities brokers and dealers, banks, trust companies, and clearing corporations that clear through or maintain a custodial relationship with a Direct Participant, either directly or indirectly ("Indirect Participants"). DTC has a Standard & Poor's rating of AA+. The DTC Rules applicable to its Participants are on file with the Securities and Exchange Commission. More information about DTC can be found at www.dtcc.com.
Purchases of 2017C Bonds under the DTC system must be made by or through Direct Participants, which will receive a credit for the 2017C Bonds on DTC's records. The ownership interest of each actual purchaser of each 2017C Bond ("Beneficial Owner") is in turn to be recorded on the records of Direct Participants and Indirect Participants, as applicable. Beneficial Owners will not receive written confirmation from DTC of their purchase. Beneficial Owners are, however, expected to receive written confirmations providing details of the transaction, as well as periodic statements of their holdings, from the Direct Participant or Indirect Participant, as applicable, through which the Beneficial Owner entered into the transaction. Transfers of ownership interests in the 2017C Bonds are to be accomplished by entries made on the books of Direct Participants and/or Indirect Participants acting on behalf of Beneficial Owners. Beneficial Owners will not receive certificates representing their ownership interests in 2017C Bonds, except in the event that use of the book-entry system for the 2017C Bonds is discontinued.
To facilitate subsequent transfers, all 2017C Bonds deposited by Direct Participants with DTC are registered in the name of DTC's partnership nominee, Cede & Co., or such other name as may be

E-2
requested by an authorized representative of DTC. The deposit of 2017C Bonds with DTC and their registration in the name of Cede & Co. or such other DTC nominee do not effect any change in beneficial ownership. DTC has no knowledge of the actual Beneficial Owners of the 2017C Bonds; DTC's records reflect only the identity of the Direct Participants to whose accounts such 2017C Bonds are credited, which may or may not be the Beneficial Owners. The Direct Participants and Indirect Participants will remain responsible for keeping account of their holdings on behalf of their customers.
Conveyance of notices and other communications by DTC to Direct Participants, by Direct Participants to Indirect Participants, and by Direct Participants and Indirect Participants to Beneficial Owners will be governed by arrangements among them, subject to any statutory or regulatory requirements as may be in effect from time to time.
Redemption notices shall be sent to DTC. If less than all of the 2017C Bonds within a series are being redeemed, DTC's practice is to determine by lot the amount of the interest of each Direct Participant in such issue to be redeemed.
Neither DTC nor Cede & Co. (nor any other DTC nominee) will consent or vote with respect to 2017C Bonds unless authorized by a Direct Participant in accordance with DTC's MMI Procedures. Under its usual procedures, DTC mails an omnibus proxy (an "Omnibus Proxy") to VRA as soon as possible after the record date. The Omnibus Proxy assigns Cede & Co.'s consenting or voting rights to those Direct Participants to whose accounts 2017C Bonds are credited on the record date (identified in a listing attached to the Omnibus Proxy).
Redemption proceeds and payments on the 2017C Bonds will be made to Cede & Co., or such other nominee as may be requested by an authorized representative of DTC. DTC's practice is to credit Direct Participants' accounts upon DTC's receipt of funds and corresponding detail information from VRA or the Trustee on payable date in accordance with their respective holdings shown on DTC's records. Payments by Direct Participants and/or Indirect Participants to Beneficial Owners will be governed by standing instructions and customary practices, as is the case with securities held for the accounts of customers in bearer form or registered in "street name," and will be the responsibility of such Direct Participant or Indirect Participant, as applicable, and not of DTC, the Trustee, or VRA, subject to any statutory or regulatory requirements as may be in effect from time to time. Payment of redemption proceeds and payments to Cede & Co. (or such other nominee as may be requested by an authorized representative of DTC) is the responsibility of VRA or the Trustee, disbursement of such payments to Direct Participants will be the responsibility of DTC, and disbursement of such payments to the Beneficial Owners will be the responsibility of Direct Participants and Indirect Participants.
DTC may discontinue providing its services as depository with respect to the 2017C Bonds at any time by giving reasonable notice to VRA or the Trustee. Under such circumstances, in the event that a successor depository is not obtained, 2017C Bond certificates are required to be printed and delivered.
VRA may decide to discontinue use of the system of book-entry-only transfers through DTC (or a successor securities depository). In that event, 2017C Bond certificates will be printed and delivered to DTC.
The foregoing information in this Appendix concerning DTC and DTC's book-entry system has been obtained from sources that VRA believes to be reliable, but VRA takes no responsibility for the accuracy thereof.
NEITHER VRA, THE TRUSTEE, ANY LOCAL GOVERNMENT, THE UNDERWRITERS, NOR THE WINNING BIDDER WILL HAVE ANY RESPONSIBILITY OR OBLIGATION TO DIRECT PARTICIPANTS, TO INDIRECT PARTICIPANTS OR TO ANY BENEFICIAL OWNER

E-3
WITH RESPECT TO (I) THE ACCURACY OF ANY RECORDS MAINTAINED BY DTC, ANY DIRECT PARTICIPANT, OR ANY INDIRECT PARTICIPANT; (II) THE PAYMENT BY DTC OR ANY DIRECT PARTICIPANT OR INDIRECT PARTICIPANT OF ANY AMOUNT WITH RESPECT TO THE PRINCIPAL OF, PREMIUM, IF ANY, OR INTEREST ON, THE 2017C BONDS; (III) ANY NOTICE WHICH IS PERMITTED OR REQUIRED TO BE GIVEN TO BONDHOLDERS; (IV) ANY CONSENT GIVEN BY DTC OR OTHER ACTION TAKEN BY DTC AS BONDHOLDER; OR (V) THE SELECTION BY DTC OR ANY DIRECT PARTICIPANT OR INDIRECT PARTICIPANT OF ANY BENEFICIAL OWNERS TO RECEIVE PAYMENT IN THE EVENT OF A PARTIAL REDEMPTION OF THE 2017C BONDS.
So long as Cede & Co. is the registered owner of the 2017C Bonds, as nominee of DTC, references in this Official Statement to the Owner or Owners of the 2017C Bonds or Owners shall mean Cede & Co. and shall not mean the Beneficial Owners, and the Trustee will treat Cede & Co. as the only Owner or Bondholder of the 2017C Bonds for all purposes under the Indenture.
VRA may enter into amendments to its agreement with DTC or any successor depository without the consent of the Beneficial Owners.

[THIS PAGE INTENTIONALLY LEFT BLANK]
APPENDIX F
PROPOSED FORM OF BOND COUNSEL OPINION LETTER

[THIS PAGE INTENTIONALLY LEFT BLANK]

November 15, 2017 Virginia Resources Authority 1111 East Main Street, Suite 1920 Richmond, Virginia 23219
Virginia Resources Authority
$56,630,000 Infrastructure Revenue Bonds (Virginia Pooled Financing Program)
Series 2017C
and
$30,315,000 State Moral Obligation Revenue Bonds (Virginia Pooled Financing Program)
Series 2017C
Ladies and Gentlemen:
We have served as Bond Counsel to the Virginia Resources Authority ("VRA") in connection with the issuance of VRA's $56,630,000 Infrastructure Revenue Bonds (Virginia Pooled Financing Program), Series 2017C (the "2017C Infrastructure Revenue Bonds") and $30,315,000 State Moral Obligation Revenue Bonds (Virginia Pooled Financing Program), Series 2017C (the "2017C Moral Obligation Bonds," and, together with the 2017C Infrastructure Revenue Bonds, the "2017C Bonds"). The issuance of the 2017C Bonds has been authorized pursuant to resolutions adopted by VRA's Board of Directors on June 13, 2017, and the 2017C Bonds have been issued under (i) the Virginia Resources Authority Act, Chapter 21, Title 62.1, Code of Virginia of 1950, as amended (the "VRA Act"), and (ii) a Master Indenture of Trust dated as of December 1, 2003, as previously supplemented and amended (the "Master Indenture"), between VRA and U.S. Bank National Association, as successor trustee (the "Trustee"), and as further supplemented by a Fortieth Supplemental Series Indenture of Trust dated as of November 1, 2017 (the "Fortieth Supplemental Series Indenture," and, together with the Master Indenture, the "Indenture"), between VRA and the Trustee. We refer you to the 2017C Bonds and the Indenture for a description of the purposes for which the 2017C Bonds are issued, their terms and the security for them. Unless otherwise defined, each capitalized term used in this opinion has the meaning given it in the Indenture.
In connection with our opinion, we have examined the Constitution of Virginia and the applicable laws of both the Commonwealth of Virginia (the "Commonwealth"), including the VRA Act, and the United States of America, including the Internal Revenue Code of 1986, as

F-2
amended (the "Code"), and such certified proceedings and other documents relating to the issuance of the 2017C Bonds and VRA as we deem necessary to render this opinion.
Without undertaking to verify them by independent investigation, as to questions of fact material to this opinion we have relied upon (i) representations of VRA contained in the Indenture and related documents, (ii) certifications of public officials furnished to us, including certifications made on behalf of the 2017C Local Governments (as defined in VRA's Official Statement dated November 1, 2017), and (iii) certifications and representations contained in certificates of VRA and others delivered at closing. In addition, without undertaking to verify the same by independent investigation, we have relied on computations provided to us by Davenport & Company LLC, VRA's financial advisor, the mathematical accuracy of which was verified by Bingham Arbitrage Rebate Services, Inc., Richmond, Virginia, relating to the sufficiency of and the yield on investments in the refunding escrow funds established with a portion of the proceeds of the 2017C Bonds and the arbitrage yield on the 2017C Bonds.
We have assumed that all signatures on documents, certificates and instruments examined by us are genuine, all documents, certificates and instruments submitted to us as originals are authentic, and all documents, certificates and instruments submitted to us as copies conform to the originals. In addition, we have assumed that all documents, certificates and instruments relating to this transaction have been duly authorized, executed, and delivered by all parties to them other than VRA, and we have further assumed the due organization, existence, and powers of all parties other than VRA.
Based on the foregoing, we are of the opinion that, under current law:
(1) VRA is a public body corporate and a political subdivision of the Commonwealth duly created by the VRA Act and vested with all of the rights and powers conferred by the VRA Act.
(2) VRA has the requisite authority and power under the VRA Act to enter into the Indenture, to issue and sell the 2017C Bonds, and to apply the proceeds from the issuance and sale of the 2017C Bonds as set forth in the Indenture. All conditions precedent to the issuance of the 2017C Bonds as set forth in the VRA Act and the Indenture have been fulfilled.
(3) The 2017C Infrastructure Revenue Bonds have been duly authorized, executed, and delivered in accordance with the VRA Act and the Indenture and constitute valid and binding limited obligations of VRA, payable solely from the revenues, money and property of VRA specifically pledged for such purpose under the Indenture on a parity with the other Outstanding Infrastructure Revenue Bonds heretofore or hereafter issued under the Indenture.
(4) The 2017C Moral Obligation Bonds have been duly authorized, executed, and delivered in accordance with the VRA Act and the Indenture and constitute valid and binding limited obligations of VRA, payable solely from the revenues, money and property of VRA specifically pledged for such purpose under the Indenture, which pledge is (i) on a parity with the other Outstanding Moral Obligation Bonds heretofore or hereafter issued under the Indenture and (ii) subordinate as to certain revenues, money and property to the pledge thereof securing the
F-3
2017C Infrastructure Revenue Bonds issued on the date hereof and the other Outstanding Infrastructure Revenue Bonds heretofore or hereafter issued under the Indenture.
(5) The Indenture has been duly authorized, executed and delivered by VRA, constitutes the valid and binding obligation of VRA, pledges the Revenues and the Infrastructure Revenue Bond Revenues to the Trustee as security for the Infrastructure Revenue Bonds, pledges the Revenues on a subordinate basis to the Moral Obligation Bonds, and is enforceable against VRA in accordance with its terms. The Fortieth Supplemental Series Indenture is authorized and permitted by the Master Indenture and will have no adverse effect on the excludability of the interest on any of the Bonds Outstanding on the date hereof from gross income for federal income tax purposes.
(6) Additional Infrastructure Revenue Bonds and Moral Obligation Bonds may be issued from time to time under the conditions, limitations, and restrictions set forth in the Indenture, and may be secured equally and ratably thereunder with the 2017C Infrastructure Revenue Bonds and the other Outstanding Infrastructure Revenue Bonds or the 2017C Moral Obligation Bonds and the other Outstanding Moral Obligation Bonds, as the case may be.
(7) Interest on the 2017C Bonds, including any accrued "original issue discount" properly allocable to the owners of the 2017C Bonds, (i) is excludable from gross income for federal income tax purposes under Section 103 of the Code and (ii) is not a specific item of tax preference for purposes of the federal alternative minimum tax imposed on individuals and corporations (a "Specific Tax Preference Item"). However, for purposes of the alternative minimum tax imposed on corporations (as defined for federal income tax purposes) under Section 56 of the Code, interest on the 2017C Bonds must be included in computing adjusted current earnings. The "original issue discount" on any 2017C Bond is the excess of its stated redemption price at maturity over the initial offering price to the public at which price a substantial amount of the 2017C Bonds of the same maturity was sold. The "public" does not include bond houses, brokers, or similar persons or organizations acting in the capacity of underwriters, placement agents or wholesalers. We express no opinion regarding other federal tax consequences arising with respect to the 2017C Bonds.
In delivering this opinion, we are (i) relying on opinions from other firms of municipal bond attorneys serving as bond counsel to all of the 2017C Local Governments regarding the application of the proceeds of the 2017C Bonds and the ownership, use and operation of the property financed or refinanced thereby, and (ii) assuming continuing compliance with the Covenants, as hereinafter defined, by VRA and each of the 2017C Local Governments, so that interest on the 2017C Bonds will (x) remain excludable from gross income for federal income tax purposes and (y) not become a Specific Tax Preference Item. It should be noted that this firm has served as bond counsel to the City of Suffolk, the County of Buckingham, the County of Roanoke, and the County of Stafford, Virginia. VRA and the 2017C Local Governments, as applicable, have covenanted in their respective tax agreements to comply with the provisions of the Code applicable to the 2017C Bonds including, among other things, requirements as to the use, expenditure and investment of the proceeds thereof, the use of the property financed or refinanced thereby, the source of the payment thereof and the security therefor, the arbitrage yield restrictions and rebate payment obligations imposed by the Code and certain other actions that could cause interest thereon to be includable in gross income of their owners (the

F-4
"Covenants"). Failure by VRA or any of the 2017C Local Governments, as applicable, to comply with the Covenants could cause interest on the 2017C Bonds to become includable in gross income for federal income tax purposes retroactive to their date of issue. In the event of noncompliance with the Covenants, the available enforcement remedies may be limited by applicable provisions of law and, therefore, may not be adequate to prevent interest on the 2017C Bonds from becoming includible in gross income for federal income tax purposes.
We have no responsibility to monitor compliance with the Covenants after the date of issue of the 2017C Bonds.
Certain requirements and procedures contained, incorporated or referred to in the above-referenced tax agreements, including the Covenants, may be changed and certain actions may be taken or omitted under the circumstances and subject to the terms and conditions set forth in such agreements. We express no opinion concerning any effect on the excludability of interest on the 2017C Bonds from gross income for federal income tax purposes of any such subsequent change or action that may be made, taken or omitted upon the advice or approval of counsel other than this firm.
(8) In accordance with Section 62.1-219 of the VRA Act, the 2017C Bonds and the income from them, including any profit made on their sale, are exempt from taxation by the Commonwealth and any of its political subdivisions. We express no opinion regarding (i) other tax consequences arising with respect to the 2017C Bonds under the laws of the Commonwealth or (ii) any consequences arising with respect to the 2017C Bonds under the tax laws of any state or local jurisdiction other than the Commonwealth and its political subdivisions.
The rights of the registered owners of the 2017C Bonds and the enforceability of VRA's obligations under the 2017C Bonds and the Indenture may be limited or otherwise affected by bankruptcy, insolvency, reorganization, moratorium, and similar laws now or hereafter in effect affecting creditors' rights. The enforceability of those rights and obligations is also subject to the exercise of judicial discretion in accordance with general principles of equity.
The principal of, premium, if any, and interest on the 2017C Bonds do not constitute a debt of the Commonwealth or any of its political subdivisions other than VRA. Neither the Commonwealth nor any of its political subdivisions, including VRA, is legally obligated to pay the principal of, premium, if any, or interest on the 2017C Bonds or other costs incident to them except from the revenues, money and property of VRA pledged for such purpose, and neither the faith and credit nor the taxing power of the Commonwealth or any of its political subdivisions, including VRA, is pledged to the payment of the principal of, premium, if any, or interest on the 2017C Bonds.
Our services as Bond Counsel have been limited to rendering the foregoing opinion based on our review of such legal proceedings as we deem necessary to approve the validity of the 2017C Bonds and the tax-exempt status of the interest on them and the enforceability of the Indenture. The foregoing opinion is in no respect an opinion as to VRA's business or financial resources or its ability to provide for the payment of the 2017C Bonds or the accuracy or completeness of any information, including VRA's Preliminary Official Statement dated October

F-5
23, 2017, and Official Statement dated November 1, 2017, that anyone may have relied upon in making the decision to purchase the 2017C Bonds.
This opinion is given as of the date hereof, and we assume no obligation to revise or supplement this opinion to reflect any facts or circumstances that may hereafter come to our attention, or any changes in law that may hereafter occur.
Very truly yours,

[THIS PAGE INTENTIONALLY LEFT BLANK]

APPENDIX G
FORM OF CONTINUING DISCLOSURE AGREEMENT OF THE COMMONWEALTH OF VIRGINIA

[THIS PAGE INTENTIONALLY LEFT BLANK]
Commonwealth of VirginiaVirginia Resources Authority
CONTINUING DISCLOSURE AGREEMENT
This Continuing Disclosure Agreement (the "Disclosure Agreement") is executed and delivered by the Commonwealth of Virginia (the "Commonwealth") in connection with the issuance by the Virginia Resources Authority (the "Authority") of $86,945,000 aggregate principal amount of its Infrastructure and State Moral Obligation Revenue Bonds (Virginia Pooled Financing Program), Series 2017C (the "Bonds") pursuant to the provisions of a Master Indenture of Trust dated as of December 1, 2003, as supplemented by a Fortieth Supplemental Series Indenture of Trust dated as of November 1, 2017, between the Authority and U.S. Bank National Association, as trustee. The proceeds of the Bonds are being used by the Authority to finance and refinance qualified infrastructure projects for various localities in the Commonwealth. The Authority has advised the Commonwealth that it has determined that the Commonwealth constitutes an "obligated person" within the meaning of the Rule in respect of the Bonds and the Commonwealth concurs in such determination. The Commonwealth hereby covenants and agrees as follows:
SECTION 1. Purpose of the Disclosure Agreement. This Disclosure Agreement is being executed and delivered by the Commonwealth for the benefit of the Holders and in order to assist the Participating Underwriters in complying with the Rule. The Commonwealth acknowledges that it is undertaking primary responsibility for any reports, notices or disclosures that may be required under this Agreement.
SECTION 2. Definitions. In addition to the definitions set forth in the Indenture, which apply to any capitalized term used in this Disclosure Agreement unless otherwise defined in this Section, the following capitalized terms shall have the following meanings:
"Annual Report" shall mean any Annual Report provided by the Commonwealth pursuant to, and as described in, Sections 3 and 4 of this Disclosure Agreement.
"Dissemination Agent" shall mean the Commonwealth, acting in its capacity as Dissemination Agent hereunder, or any successor Dissemination Agent designated in writing by the Commonwealth and which has filed with the Commonwealth a written acceptance of such designation.
"EMMA" shall mean the MSRB's Electronic Municipal Market Access system, the internet address of which is http://emma.msrb.org/, and any successor thereto.
"Fiscal Year" shall mean the twelve-month period, at the end of which the financial position of the Commonwealth and results of its operations for such period are determined. Currently, the Commonwealth's Fiscal Year begins July 1 and continues through June 30 of the next year.
"Holder" shall mean, for purposes of this Disclosure Agreement, any person who is a record owner or beneficial owner of a Bond.
"MSRB" shall mean the Municipal Securities Rulemaking Board.
"Participating Underwriter" shall mean any of the original underwriters of the Bonds required to comply with the Rule in connection with the offering of such Bonds.
"Rule" shall mean Rule 15c2-12 adopted by the Securities and Exchange Commission under the Securities Exchange Act of 1934, as the same may be amended from time to time.
G-1

SECTION 3. Provision of Annual Reports; Audited Financial Statements.
(a) Not later than seven months following the end of each Fiscal Year of the Commonwealth, commencing with the Fiscal Year ending June 30, 2017 the Commonwealth shall, or shall cause the Dissemination Agent (if different from the Commonwealth) to, submit to EMMA an Annual Report which is consistent with the requirements of Section 4 of this Disclosure Agreement. Not later than 10 days prior to said date, the Commonwealth shall provide the Annual Report to the Dissemination Agent (if applicable). In each case, the Annual Report (i) may be submitted as a single document or as separate documents comprising a package, (ii) may cross-reference other information as provided in Section 4 of this Disclosure Agreement, and (iii) shall include such financial statements as may be required by the Rule.
(b) The annual financial statements of the Commonwealth shall be prepared on the basis of generally accepted accounting principles and will be audited. Copies of the audited annual financial statements, which may be filed separately from the Annual Report, will be submitted to EMMA when they become publicly available.
(c) If the Commonwealth fails to submit an Annual Report to EMMA by the date required in subsection (a) hereof, or to submit its audited annual financial statements to EMMA when they become publicly available, the Commonwealth shall send an appropriate notice to the MSRB in substantially the form attached hereto as Exhibit A in a timely manner.
SECTION 4. Content of Annual Reports. Each Annual Report required to be filed hereunder shall include, at a minimum, the information referred to in Exhibit B as it relates to the Commonwealth, all with a view toward assisting Participating Underwriters in complying with the Rule. Any or all of such information may be incorporated by reference from other documents, including official statements containing information with respect to the Commonwealth, which have been filed with the MSRB or the Securities and Exchange Commission. If the document incorporated by reference is a final official statement, it must be available from the MSRB. The Commonwealth shall clearly identify each such other document so incorporated by reference.
SECTION 5. Notice of Rating Changes. The Commonwealth will provide in a timely manner not in excess of ten business days after the occurrence of the event to the Board and to EMMA notice of any changes in the ratings of the Commonwealth’s general obligation bonds by the rating agencies requested by the Commonwealth to rate such bonds.
SECTION 6. Notice of Bankruptcy, Insolvency, Receivership or Similar Event. The Commonwealth will provide in a timely manner not in excess of ten business days after the occurrence of the event to the Board and to EMMA notice of any bankruptcy, insolvency, receivership or similar event of the Commonwealth. For purposes of this Section, a bankruptcy, insolvency, receivership or similar event of the Commonwealth is considered to occur when any of the following occur: the appointment of a receiver, fiscal agent or similar officer for the Commonwealth in a proceeding under the U.S. Bankruptcy Code or in any other proceeding under state or federal law in which a court or governmental authority has assumed jurisdiction over substantially all of the assets or business of the Commonwealth, or if such jurisdiction has been assumed by leaving the existing governing body and officials or officers in possession but subject to the supervision and orders of a court or governmental authority, or the entry of an order confirming a plan or reorganization, arrangement or liquidation by a court or governmental authority having supervision or jurisdiction over substantially all of the assets or business of the Commonwealth.
SECTION 7. Notice of Merger, Consolidation, Acquisition or Similar Event. The Commonwealth will provide in a timely manner not in excess of ten business days after the occurrence of the event to the Board and to EMMA notice of any consummation of a merger, consolidation, or acquisition involving the Commonwealth or the sale of all or substantially all of the assets of the Commonwealth, other than in the ordinary course of business, the entry into a definitive agreement to undertake such an action or the termination of a definitive agreement relating to any such actions, other than pursuant to its terms, if material.
SECTION 8. Termination of Reporting Obligation. The obligations of the Commonwealth under this Disclosure Agreement shall terminate upon the earlier to occur of the legal defeasance or final retirement of the Bonds,and the Board shall notify the Commonwealth promptly upon the occurrence of either such event.
SECTION 9. Dissemination Agent. The Commonwealth may, from time to time, appoint or engage a Dissemination Agent to assist it in carrying out its obligations under this Disclosure Agreement and may discharge any such Agent, with or without appointing a successor Dissemination Agent. If at any time there is not any other designated Dissemination Agent, the Commonwealth shall be the Dissemination Agent.
G-2

SECTION 10. Amendment. Notwithstanding any other provision of this Disclosure Agreement, theCommonwealth may amend this Disclosure Agreement, if such amendment is supported by an opinion of independent counsel with expertise in federal securities laws to the effect that such amendment is permitted or required by the Rule.
SECTION 11. Additional Information. Nothing in this Disclosure Agreement shall be deemed to prevent the Commonwealth from disseminating any other information, using the means of dissemination set forth in this Disclosure Agreement or any other means of communication, or including any other information in any Annual Report or notices described in Section 5, Section 6, and Section 7 above, in addition to that which is required by this Disclosure Agreement. If the Commonwealth chooses to include any information in any Annual Report or notices described in Section 5, Section 6, and Section 7 above, in addition to that which is specifically required by this Disclosure Agreement, the Commonwealth shall have no obligation under this Disclosure Agreement to update such information or include it in any future Annual Report or notice.
SECTION 12. Default. Any person referred to in Section 13 (other than the Commonwealth) may take such action as may be permitted by law against the appropriate public official to secure compliance with the obligation of the Commonwealth to file its Annual Report or to give notices as described in Section 5, Section 6, and Section 7hereinabove. In addition, Holders of not less than a majority in aggregate principal amount of Bonds outstanding may take such actions as may be permitted by law to challenge the adequacy of any information provided pursuant to this Disclosure Agreement, or to enforce any other obligation of the Commonwealth hereunder. A default under this Disclosure Agreement shall not be deemed an event of default under any applicable resolution or other debt authorization of the Commonwealth, and the sole remedy under this Disclosure Agreement in the event of any failure of the Commonwealth to comply herewith shall be an action to compel performance. Nothing in this provision shall be deemed to restrict the rights or remedies of any Holder pursuant to the Securities Exchange Act of 1934, the rules and regulations promulgated thereunder, or other applicable laws.
SECTION 13. Beneficiaries. This Disclosure Agreement shall inure solely to the benefit of the Commonwealth, the Board, the Participating Underwriters, and Holders from time to time of the Bonds, and shall create no rights in any other person or entity.
SECTION 14. Counterparts. This Disclosure Agreement may be executed in several counterparts, each of which shall be an original and all of which shall constitute but one and the same instrument.
SECTION 15. EMMA. All filings under this Disclosure Agreement shall be made solely by transmitting such filings to the Municipal Securities Rulemaking Board via EMMA, as described in 1934 Act Release No. 59062. Should the Securities and Exchange Commission approve any additional or subsequent internet-based electronic filing system for satisfying the continuing disclosure filing requirements of the Rule, any filings required under this Disclosure Agreement may be made by transmitting such filing to such system, as described in the applicable Securities and Exchange Commission regulation or release approving such filing system.
Date: November 15, 2017
COMMONWEALTH OF VIRGINIA
By: __________________________________ State Treasurer
AGREED TO & ACKNOWLEDGED:
VIRGINIA RESOURCES AUTHORITY
By: _________________________________ Executive Director
G-3

EXHIBIT A
NOTICE OF FAILURE TO FILE ANNUAL REPORT[AUDITED ANNUAL FINANCIAL STATEMENT]
COMMONWEALTH OF VIRGINIA
in connection withVirginia Resources Authority
$86,945,000Infrastructure and State Moral Obligation Revenue Bonds
(Virginia Pooled Financing Program), Series 2017C
Dated: November 15, 2017
$56,630,000Infrastructure Revenue Bonds
Series 2017C
CUSIP Numbers 92818M RE2 – SA9
$30,315,000State Moral Obligation Revenue Bonds
Series 2017C
CUSIP Numbers 92818M SB7 – TD2
NOTICE IS HEREBY GIVEN that the Commonwealth of Virginia has not provided an Annual Report [Audited Annual Financial Statements] as required by Section 3 of the Continuing Disclosure Agreement, which was entered into in connection with the above-named bonds issued pursuant to a Master Indenture of Trust dated as of December 1, 2003, as supplemented by a Fortieth Supplemental Series Indenture of Trust dated as of November 1, 2017, between the Authority and U.S. Bank National Association, as trustee. The Commonwealth anticipates that the Annual Report [Audited Annual Financial Statements] will be filed by _____________.
Dated:_______________
COMMONWEALTH OF VIRGINIA
By: ____________________________ State Treasurer
G-4

EXHIBIT B
CONTENT OF ANNUAL REPORT
General Fund. Information concerning revenues, sources of revenues, expenditures, categories of expenditures and balances of the General Fund of the Commonwealth for the preceding fiscal year.
Appropriation Act. A summary of the material budgetary aspects of the Appropriation Act for the current biennium.
Debt. Updated information respecting tax-supported and other outstanding debt of the Commonwealth including a historical summary of outstanding tax-supported debt; a summary of authorized but unissued tax-supported debt and a summary of annual debt service on outstanding tax-supported debt.
Retirement Plans. Updated information (to the extent not shown in the latest audited annual financial statements) respecting pension and retirement plans administered by the Commonwealth including a summary of membership, revenues, expenses and actuarial valuation(s) of such plans.
Litigation. A summary of material litigation pending against the Commonwealth.
Demographic Information. Updated demographic information respecting the Commonwealth such as its population and tax base.
Economic Information. Updated economic information respecting the Commonwealth such as income, employment, industry and infrastructure data.
In general, the foregoing will include information as of the end of the most recent fiscal year or as of the most recent practicable date. Where information for the fiscal year just ended is provided, it may be preliminary and unaudited. Where information has historically been provided for more than a single period, comparable information will in general be provided for the same number of periods where valid and available. Where comparative demographic or economic information for the Commonwealth and the United States as a whole is contemporaneously available and, in the judgment of the Commonwealth, informative, such information may be included. Where, in the judgment of the Commonwealth, an accompanying narrative is required to make data presented not misleading, such narrative will be provided.
G-5

[THIS PAGE INTENTIONALLY LEFT BLANK]

APPENDIX H
SUMMARY OF CONTINUING DISCLOSURE UNDERTAKINGS BY VIRGINIA RESOURCES AUTHORITY

[THIS PAGE INTENTIONALLY LEFT BLANK]

H-1
The following is a summary of the continuing disclosure undertaking made by VRA pursuant to the Fortieth Supplemental Series Indenture for the benefit of the holders of the 2017C Bonds. Unless otherwise defined, each capitalized term used herein will have the meaning given it above in this Official Statement.
Annual Disclosure
(a) Directly or through a below-described Dissemination Agent, VRA shall provide annually the following financial information or operating data in each case as of the end of VRA's most recent fiscal year:
(i) an update of the table (the "Participating Local Governments Table") contained under the heading "Aggregate Participation in the Virginia Pooled Financing Program" in the subsection "THE 2017C LOCAL GOVERNMENTS AND THE OTHER PARTICIPATING LOCAL GOVERNMENTS" in Section Three of this Official Statement;
(ii) a list showing each Local Government constituting a "Material Local Government," which may be included in the updated Participating Local Governments Table provided under (a)(1) above; and
(iii) the balance and a list of the investments, if any, held in each of the Infrastructure Revenue Debt Service Reserve Fund, the Capital Reserve Fund and the Operating Reserve Fund and a statement as to whether the balance was at least equal to the level required under the Indenture.
(b) VRA shall provide annually the financial information or operating data described in subsection (a) above (collectively, the "Annual Disclosure") on or before March 31 after the end of each of VRA's fiscal years, commencing with VRA's fiscal year ended June 30, 2018, to the Municipal Securities Rulemaking Board (the "MSRB") in an electronic format as prescribed by the MSRB.
(c) Any Annual Disclosure may be included by specific reference to other documents available to the public on the MSRB's internet web site or previously filed with the SEC; provided, however, that any final official statement incorporated by reference must be available from the MSRB.
(d) VRA shall provide in a timely manner to the MSRB, in an electronic format as prescribed by the MSRB, notice specifying any failure of VRA to provide the Annual Disclosure by the date specified.
Event Disclosure
VRA shall provide, or cause to be provided through the Dissemination Agent, to the MSRB, notice of the occurrence of any of the following events that may from time to time occur with respect to the 2017C Bonds, such notice to be given in a timely manner not in excess of 10 business days after the occurrence of the event:
(a) principal and interest payment delinquencies;
(b) non-payment related defaults, if material;
(c) unscheduled draws on debt service reserves reflecting financial difficulties;
(d) unscheduled draws on any credit enhancement maintained with respect to the 2017C Bonds reflecting financial difficulties;

H-2
(e) substitution of credit or liquidity providers, or their failure to perform;
(f) adverse tax opinions, the issuance by the Internal Revenue Service of proposed or final determinations of taxability, Notices of Proposed Issue (IRS Form 5701 – TEB) or other material notices or determinations with respect to the tax status of the 2017C Bonds, or other material events affecting the tax status of the 2017C Bonds;
(g) modifications to rights of the Owners of the 2017C Bonds, if material;
(h) bond calls, if material, and tender offers;
(i) defeasance of all or any portion of the 2017C Bonds;
(j) release, substitution, or sale of property securing repayment of the 2017C Bonds, if material;
(k) rating changes;
(l) bankruptcy, insolvency, receivership or similar event of VRA, which event is considered to occur when any of the following occur: the appointment of a receiver, fiscal agent or similar officer for VRA in a proceeding under the U.S. Bankruptcy Code or in any other proceeding under state or federal law in which a court or governmental authority has assumed jurisdiction over substantially all of the assets or business of VRA, or if such jurisdiction has been assumed by leaving the existing governing body and officials or officers in possession but subject to the supervision and orders of a court or governmental authority, or the entry of an order confirming a plan of reorganization, arrangement or liquidation of a court or governmental authority having supervision or jurisdiction over substantially all of the assets or business of VRA;
(m) the consummation of a merger, consolidation, or acquisition involving VRA or the sale of all or substantially all of the assets of VRA, other than in the ordinary course of business, the entry into a definitive agreement to undertake such an action or the termination of a definitive agreement relating to any such action, other than pursuant to its terms, if material;
(n) appointment of a successor or additional trustee or the change of name of a trustee, if material; and
(o) the failure of VRA on or before the date required by this Disclosure Agreement to provide Annual Financial Information to the persons and in the manner required by the Fortieth Supplemental Series Indenture.
Objective Criteria
(a) The objective criteria for identifying a Material Local Government with respect to the 2017C Bonds shall be based upon a determination by VRA on the date of sale of each Series of Bonds pursuant to the Indenture (each a "Sale Date") and as of the end of each of VRA's fiscal years of the level of participation of each Local Government in the Program, which is funded by the Bonds issued under the Indenture. Any Local Government, the aggregate outstanding principal amount of Local Obligations of which represents 15% or more of the aggregate outstanding principal amount of all Local Obligations purchased or acquired with proceeds of Bonds issued under the Master Indenture, shall be a Material Local Government with respect to the 2017C Bonds as long as such Local Government satisfies such objective criteria. VRA shall determine whether any of the Local Governments are (or remain) Material Local Governments as of each Sale Date and as of the end of each of VRA's fiscal years, commencing June 30, 2018.

H-3
(b) VRA covenants to require that each Agreement and Financing Lease with a Local Government contain a continuing disclosure undertaking substantially in the form summarized in Appendix I to this Official Statement.
(c) VRA shall, within 45 days of the end of each fiscal year of VRA, notify each Local Government satisfying the objective criteria set forth above that such Local Government is a "Material Local Government" as of the end of such fiscal year.
Format of Disclosure
All documents provided to the MSRB pursuant to the requirements of the Rule shall be accompanied by identifying information as prescribed by the MSRB. Termination
The obligations of VRA will terminate upon the redemption, defeasance (within the meaning of the Rule) or payment in full of all the 2017C Bonds.
Amendment
VRA may modify its continuing disclosure obligations without the consent of the underwriters of the 2017C Bonds or Owners of any of the Bonds, provided that the undertaking as so modified complies with the Rule as it exists at the time of modification. VRA shall within a reasonable time thereafter send to the MSRB a description of such modification(s).
Defaults
(a) If VRA fails to comply with any covenant or obligation described in this Appendix H, any holder (within the meaning of the Rule) of Bonds then Outstanding may, by notice to VRA, proceed to protect and enforce its rights and the rights of the holders by an action for specific performance of such covenant or obligation.
(b) Notwithstanding anything in the Fortieth Supplemental Series Indenture to the contrary, any failure of VRA to comply with any covenant or obligation described in this Appendix H shall not (i) be deemed to constitute an event of default under the Bonds or the Indenture or (ii) give rise to any right or remedy other than that described in paragraph (a) above.
Additional Disclosure
VRA may from time to time disclose certain information and data in addition to that described in this Appendix H. Notwithstanding anything in the Indenture to the contrary, VRA shall not incur any obligation to continue to provide, or to update, such additional information or data.
Dissemination Agent
VRA may, in its discretion, from time to time appoint or engage an entity to serve as Dissemination Agent to assist VRA in fulfilling its covenants and obligations described in this Appendix H. VRA may engage or appoint as Dissemination Agent, among others, Digital Assurance Certification LLC or similar organizations that may exist from time to time. It is not necessary that the Dissemination Agent have any agency or other legal, contractual or implied relationship with VRA for purposes of state law.

[THIS PAGE INTENTIONALLY LEFT BLANK]
APPENDIX I
SUMMARY OF CONTINUING DISCLOSURE UNDERTAKINGS BY LOCAL GOVERNMENTS

[THIS PAGE INTENTIONALLY LEFT BLANK]

I-1
Part I
SUMMARY OF CONTINUING DISCLOSURE UNDERTAKINGS BY LOCAL GOVERNMENTS
The following is a summary of the continuing disclosure undertakings that each Local
Government will be required to make under its respective Agreement or Financing Lease for the benefit of the Owners of the 2017C Bonds. Unless otherwise defined, each capitalized term used herein will have the meaning given it above in this Official Statement.
Annual Disclosure
The provisions described under this heading shall apply from the time the Local Government has been notified by VRA that it is a Material Local Government until it has been further notified by VRA that it is no longer a Material Local Government.
(a) The Local Government shall provide or cause to be provided annually financial information and operating data in accordance with the provisions of Section (b)(5)(i) of the Rule as follows:
(i) audited financial statements of the Local Government, prepared in accordance with generally accepted accounting principles; and
(ii) the operating data of the type set forth in Part II hereof for a General Obligation Bond Local Government, a Financing Lease Local Government, a Revenue Bond Local Government or a Double Barrel Bond Local Government, as appropriate.
If the financial statements filed pursuant to this subsection (a) are not audited, the Local Government shall file such statements as audited when available.
(b) The Local Government shall provide or cause to be provided annually the financial
information and operating data described in subsection (a) above (collectively, the "Annual Disclosure") to the Municipal Securities Rulemaking Board (the "MSRB") in an electronic format as prescribed by the MSRB within seven months after the end of the Local Government's fiscal year, but only as of the end of a fiscal year during which such Local Government constitutes a "Material Local Government.
(c) Any Annual Disclosure may be included by specific reference to other documents available to the public on the MSRB's internet web site or previously filed with the SEC; provided, however, that any final official statement incorporated by reference must be available from the MSRB.
(d) The Local Government shall provide or cause to be provided in a timely manner to the MSRB, in an electronic format as prescribed by the MSRB, notice specifying any failure of the Local Government to provide the Annual Disclosure by the date specified.
Event Disclosure
Each 2017C Local Government shall notify VRA of the occurrence of any of the following events that may from time to time occur with respect to the Local Obligation, such notice to be given in a timely manner not in excess of five business days after the occurrence of the event:
(a) principal and interest payment delinquencies;

I-2
(b) non-payment related defaults;
(c) unscheduled draws on debt service reserves reflecting financial difficulties;
(d) unscheduled draws on any credit enhancement maintained with respect to the Local Bond reflecting financial difficulties;
(e) substitution of credit or liquidity providers, or their failure to perform;
(f) adverse tax opinions, the issuance by the Internal Revenue Service of proposed or final determinations of taxability, Notices of Proposed Issue (IRS Form 5701 – TEB) or other material notices or determinations with respect to the Local Obligation that could affect the tax status of the 2017C Bonds, or other material events with respect to the Local Obligation that could affect the tax status of the 2017C Bonds;
(g) modifications to rights of holders, if material;
(h) bond calls, if material, and tender offers;
(i) defeasances;
(j) release, substitution, or sale of property securing repayment of the Local Obligation, if material;
(k) rating changes;
(l) bankruptcy, insolvency, receivership or similar event of the Local Government, which event is considered to occur when any of the following occur: the appointment of a receiver, fiscal agent or similar officer for the Local Government in a proceeding under the U.S. Bankruptcy Code or in any other proceeding under state or federal law in which a court or governmental authority has assumed jurisdiction over substantially all of the assets or business of the Local Government, or if such jurisdiction has been assumed by leaving the existing governing body and officials or officers in possession but subject to the supervision and orders of a court or governmental authority, or the entry of an order confirming a plan of reorganization, arrangement or liquidation of a court or governmental authority having supervision or jurisdiction over substantially all of the assets or business of the Local Government;
(m) the consummation of a merger, consolidation, or acquisition involving the Local Government or the sale of all or substantially all of the assets of the Local Government, other than in the ordinary course of business, the entry into a definitive agreement to undertake such an action or the termination of a definitive agreement relating to any such action, other than pursuant to its terms;
(n) appointment of a successor or additional trustee for the Local Obligation, if any, or the change of name of a trustee; and
(o) the failure of the Local Government on or before the date required by the Financing Agreement to provide Annual Financial Information to the persons and in the manner required by the Financing Agreement.
I-3
Termination
The obligations of the Local Government will terminate upon the redemption, defeasance (within the meaning of the Rule) or payment in full of all the Bonds.
Amendment
The Local Government may modify its continuing disclosure obligations in the Agreement without the consent of Bondholders, provided that the Agreement as so modified complies with the Rule as it exists at the time of modification. The Local Government shall within a reasonable time thereafter send to VRA and to the MSRB a description of such modifications.
Defaults
(a) If the Local Government fails to comply with any covenant or obligation regarding Annual Disclosure specified in the Agreement, any holder (within the meaning of the Rule) of Bonds then Outstanding may, by notice to the Local Government, proceed to protect and enforce its rights and the rights of the holders by an action for specific performance of the Local Government's covenant to provide the Annual Disclosure.
(b) Notwithstanding anything herein to the contrary, any failure of the Local Government to comply with any obligation regarding Annual Disclosure specified in the Agreement (i) shall not be deemed to constitute an event of default under the Local Obligations, the Bonds or the Indenture and (ii) shall not give rise to any right or remedy other than that described in subsection (a) above.
Additional Disclosure
The Local Government may from time to time disclose certain information and data in addition to the Annual Disclosure. Notwithstanding anything in the Agreement to the contrary, the Local Government shall not incur any obligation to continue to provide, or to update, such additional information or data.
Format of Disclosure
All documents provided to the MSRB pursuant to the requirements of the Rule shall be accompanied by identifying information as prescribed by the MSRB. Dissemination Agent
The Local Government may, in its discretion, from time to time appoint or engage an entity to serve as Dissemination Agent to assist the Local Government in providing its Annual Disclosure under this Agreement.

I-4
Part II
CONTENT OF ANNUAL DISCLOSURE Operating Data for General Obligation Bond Local Government and Financing Lease Local Government
Description of Local Government. A description of the Local Government, including a summary of its form of government and budgetary processes.
Debt. A description of the terms of the Local Government's outstanding tax-supported and other debt, including capital leases and moral obligations, including a historical summary of outstanding tax-supported debt; a summary of authorized but unissued tax-supported debt; a summary of legal debt margin; a summary of overlapping debt; and a summary of annual debt service on outstanding tax-supported debt as of the end of the preceding fiscal year. The Annual Disclosure should also include (to the extent not shown in the latest audited financial statements) a description of contingent obligations as well as pension plans administered by the Local Government and any unfunded pension liabilities.
Financial Information and Operating Data. Financial information and operating data respecting the Local Government including a description of revenues and expenditures for its major funds and a summary of its tax policy, structure and collections as of the end of the preceding fiscal year.
Operating Data for Revenue Bond Local Government
Description of Local Government. A description of the Local Government, including a summary description of the revenue-producing system (the "System").
Debt. A description of the terms of the Local Government's outstanding debt including a historical summary of outstanding debt and a summary of annual debt service on outstanding debt as of the end of the preceding fiscal year. The Annual Disclosure should also include (to the extent not shown in the latest audited financial statements) a description of contingent obligations as well as pension plans administered by the Local Government and any unfunded pension liabilities.
Financial Information and Operating Data. Financial information for the System as of the end of the preceding fiscal year, including a description of revenues and expenditures, largest users, a summary of rates, fees and other charges of the System, and a historical summary of debt service coverage.

APPENDIX J
REFUNDED BONDS

[THIS PAGE INTENTIONALLY LEFT BLANK]

J-1
The Refunded Bonds include the outstanding principal amount of (i) the Isle of Wight County General Obligation Public Improvement Bonds, Series 2010C (Taxable – Build America Bonds) after March 1, 2020; (ii) the Economic Development Authority of Stafford County Virginia, Lease Revenue Bonds, Series 2008; and (iii) all or a portion of the maturities of the VRA bond issues listed below.
Issue
Maturities or Portions Thereof Being Refunded (Years Inclusive)
Aggregate Principal
Amount to be Refunded
Redemption Date or
Maturity Date
Redemption Price
Virginia Pooled Financing Program, Subordinate Series 2004B (Non-AMT)
2035 $1,230,000 12/20/2017 100%
Virginia Pooled Financing Program, Subordinate Series 2006A (Non-AMT)
2026, 2031-2032, 2036
1,145,000 12/20/2017 100%
Virginia Pooled Financing Program, Subordinate Series 2006B (Non-AMT)
2030 575,000 12/20/2017 100%
Virginia Pooled Financing Program, Subordinate Series 2007A
2027 825,000 12/20/2017 100%
Virginia Pooled Financing Program, Subordinate Series 2007B (Non-AMT)
2027, 2037 1,445,000 12/20/2017 100%
Virginia Pooled Financing Program, Infrastructure Revenue Series 2010A
2021-2040 9,345,000 11/01/2020 100%
Virginia Pooled Financing Program, Moral Obligation Series 2010A
2021-2040 3,895,000 11/01/2020 100%
Virginia Pooled Financing Program, Infrastructure Revenue Series 2010C (Tax-Exempt)
2021-2033 3,715,000 11/01/2020 100%
Virginia Pooled Financing Program, Moral Obligation Series 2010C (Tax-Exempt)
2021-2033 1,565,000 11/01/2020 100%

[THIS PAGE INTENTIONALLY LEFT BLANK]


VIR
gIN
Ia R
eS
Ou
RC
eS
au
th
OR
Ity
• In
fr
as
tr
uc
tu
re a
nd s
ta
te M
or
al o
bl
Iga
tIo
n re
ve
nu
e bo
nd
s (vIr
gIn
Ia Po
ol
ed f
Ina
nc
Ing P
ro
gr
aM
) se
rIe
s 2017c


![John Erskine - The Moral Obligation [Incomplete]](https://img.dokumen.tips/doc/110x75/577cdb001a28ab9e78a71af0/john-erskine-the-moral-obligation-incomplete.jpg)
