Embed Size (px)
Citation preview

8 5 0 7 6 T H S T R E E T S W | P O B O X 8 7 0 0 | G R A N D R A P I D S , M I C H I G A N 4 9 5 1 8w w w . s p a r t a n s t o r e s . c o m
S P A R T A N S T O R E S A N N U A L R E P O R T 2 0 1 0
Spartan AR 10 Final.indd 2 6/15/2010 9:15:19 AM

Financial HighlightsSpartan Stores, Inc. and SubsidiariesThe results of discontinued operations are not reflected in the operating data below. Adjusted EBITDA is a non-GAAP financial measure. Please see page 32 of the enclosed form 10-K for a reconciliation.
(In millions except per share data, percentage data and ratio).
2010 2009 2008 2007 2006
Net sales $2,552 $2,577 $2,477 $2,206 $1,873
Gross margin $559 $536 $495 $431 $345
Gross margin percentage 21.9% 20.8% 20.0% 19.6% 18.4%
Adjusted EBITDA $103 $108 $92 $77 $57
Adjusted EBITDA percentage 4.0% 4.2% 3.7% 3.5% 3.0%
Operating earnings* $59 $73 $62 $49 $34
Operating earnings percentage 2.3% 2.8% 2.5% 2.2% 1.8%
Net earnings* $26 $37 $33 $25 $18
Net earnings percent of net sales 1.0% 1.4% 1.3% 1.1% 1.0%
Diluted earnings per share* $1.14 $1.66 $1.48 $1.16 $0.86
Cash from operating activities $92 $81 $68 $59 $50
Working capital $16 $21 $20 $27 $21
Long-term debt to equity 0.66 0.79 0.54 0.62 0.44
Shareholders’ equity $274 $247 $221 $173 $145
Total assets $753 $723 $609 $487 $379
*Fiscal years 2010 and 2007 includes $4.8 million ($3.2 million net of taxes) and $4.5 million ($2.9 million net of taxes), respectively, of non-recurring restructuring and asset impairments costs. These items reduced diluted earning per share by $0.14 and $0.13 in fiscal years 2010 and 2007, respectively.
During fiscal 2010, our retail and distribution businesses generated a combined operating profit of $59 million, and, for only the second time in our public company history, achieved over $100 million in Adjusted Earnings Before Interest, Taxes, Depreciation & Amortization (EBITDA). These financial measures are just a few of the many ways that we gauge our success. We are very proud of these performance achievements, particularly in context of such a turbulent economic cycle.
Company ProfileSpartan Stores, Inc. and Subsidiaries
2010 2009 2008 2007 2006
Stores 96 100 99 87 73
Fuel Stations 24 19 16 10 6
Pharmacies 68 66 51 42 40
Stores serviced by Distribution 358 372 393 408 443
Private label items 3,114 2,822 2,442 3,000 2,751
S P A R T A N S T O R E S A N N U A L R E P O R T 2 0 1 0
Spartan AR 10 Final.indd 3 6/15/2010 9:15:19 AM

LETTER TO OUR SHAREHOLDERS
Market and Performance OverviewWe have been working in the grocery industry for more than 35 years and have not witnessed a more disruptive economic period during our industry careers. The past two years have been characterized by great economic uncertainty, high and sustained unemployment, a depressed housing market, restricted credit conditions for both businesses and consumers, and very cautious consumers who have swiftly adopted value as a top priority in their purchasing decisions. In addition, during the past year, we experienced significant product price deflation, a rare and infrequent occurrence in the grocery industry.
Despite these challenges and those related more specifically to the Michigan economy, our businesses continued to produce historically high levels of operating profits
and cash flow, albeit lower than last year’s record financial performance. These relatively high financial performance levels are a true testament to the highly skilled talents and execution capabilities of our management team and associates. During fiscal 2010, our retail and distribution businesses generated a combined operating profit of $59 million, the third highest level in the past eight years, and, for only the second time in our public company history, we generated over $100 million in Adjusted Earnings Before Interest, Taxes, Depreciation and Amortization (Adjusted EBITDA). These financial measures are just a few of the many ways that we gauge our business success. We are very proud of these performance achievements, particularly in the context of such a turbulent economic cycle.
Competitive LandscapeThe prevailing economic climate has provoked vigorous competitive responses, as we witnessed a significant increase in supercenter retail grocery square footage in our markets this year. In addition, the number of retail channels selling grocery products continued to expand, and we confronted temporary, sometimes irrational and unsustainable retail pricing strategies. The current competitive trends are forcing industry participants to become much more efficient operators and, although we have made progress in this area, we firmly believe that there is more room to improve our overall operational efficiency.
Rising to meet the challenges of an intensely competitive market is not new to us. In fact, the state of Michigan ranks among the nation’s most saturated supercenter markets. During fiscal 2005 and 2006, we experienced one of the most rapid periods of supercenter expansions in our company’s history as nine new supercenters opened in our markets during that period. Despite the supercenter expansion, operating profits continued to improve. While competition is a fact of business, we expect the pace of this activity to diminish significantly in fiscal 2011.
Business StrategyWe operate two business segments - retail and distribution – and employ a hybrid business model that seeks to capitalize on the best growth opportunities that are available in each segment.
During the “great recession” that began in December 2007, we continued to execute our core consumer centric business strategy and capital investment program. Since the beginning of fiscal 2008, we have invested almost $150 million in our physical facilities and technology systems. Today, our store base is in excellent physical condition, our distribution operation utilizes some of the latest technology and is highly efficient, and we operate a modern fleet of trucks. We are the largest grocery distributor in Michigan, our retail stores hold the number one or two market share position among conventional operators in our core markets, and we remain a strong market competitor.
Our business strategy during the recession has been focused on striking an appropriate balance between investing in growth initiatives while improving operating efficiency and lowering our cost structure in areas that will not jeopardize the success of our consumer-centric business strategy. We also believe in maintaining a healthy balance sheet so that we can capitalize on acquisition opportunities as they become available. As of March 27, 2010, our total debt-to-EBITDA ratio was 1.8 to 1 and we have $131 million of borrowing capacity available under our existing credit facility.
Dennis Eidson,President and Chief Executive Officer
Craig C. SturkenExecutive Chairman

We understood the notion of bringing consumers good value many years ago and long before the economic recession ushered in a new era of focusing on consumer value. Beginning in fiscal 2004, we embarked on a strategic plan to significantly improve our private brand product offerings. Today, our private brand penetration rate is at record levels and among the most widely recognized and trusted brands in the marketplace. Consumer acceptance of our brands is exemplified by our unit sales penetration rate that outpaces the national average. This fiscal year, we introduced more than 300 new private brand products, including many products in the fresh food categories. We have a significant opportunity to improve our brands’ penetration rate in the fresh food categories and plan to launch up to 70 new items in these important product categories during fiscal 2011. We believe that our private brand portfolio provides us with a distinct and sustainable competitive advantage in the marketplace for both our retail and distribution business segments.
Business SegmentsDistributionWe are proud of the consistent performance of our distribution operation. Our distribution business enjoys a very loyal customer base with one of the industry’s lowest attrition rates. On average, 8 of our 10 largest independent store operators have been customers for more than 43 years, and they are among the best and most savvy store operators in their respective markets. We attribute our distribution success to a strong and seasoned customer base, an outstanding suite of value added services, sought-after private brand products, and strong relationships that have been built through a business philosophy of open communications and information sharing that is rare in today’s competitive environment.
Growth in our distribution segment has come through the addition of new accounts and increased sales penetration with existing customers. We believe that supporting and aligning our interests with our distribution customers is the best path to success. As such, we constantly strive to use our technology, retail sales data collection and analysis, market insight, and retail marketing and merchandising strategies to help our independent operators succeed. The heightened level of market competition has raised the value of our distribution support services, as independent store owners seek ways to gain a competitive edge and improve their operational efficiency. We offer a comprehensive array of value added support services that help our customers operate more efficiently and effectively. Our services include advertising design and printing, marketing, retail information technology, real estate and store development, payroll, tax and accounting services, and human resources support. We also provide customers with market visibility, data analysis, and execution strategy, and work diligently to facilitate a rich exchange of ideas through events such as our Model Stores, Fresh Experience trade show, and customer advisory committees. The most significant development in our distribution business this year was the consolidation of the Plymouth, Michigan satellite warehouse into our Grand Rapids facility. This initiative was the result of an extensive two-year study of our distribution operations and coincides with the completion of our Grand Rapids distribution center re-racking project last year. Our Grand Rapids facility now has additional capacity and better space utilization and is better organized to improve the speed, flow, and efficiency of product movement. We expect the consolidation project to produce a higher inventory turnover rate, and improve through-put and capacity utilization, as well as improve service levels to our customers, while lowering annual pre-tax operating costs by approximately $3.4 million. This project will help ensure that we remain a leading low cost and efficient distributor for many years to come.
Our future distribution growth will stem from the addition of new accounts and higher sales penetration with existing customers, but we will also look for opportunities to take advantage of industry consolidation in contiguous states through acquisitions. Expansion into contiguous states provides the opportunity to apply our successful hybrid retail and distribution business model to other markets. We firmly believe that the attributes of our distribution services will also resonate with prospective customers in neighboring states.
RetailWe have achieved considerable success in our retail segment since fiscal 2004. Our fundamental strategy has been to be a consumer-centric driven organization. Retail sales growth has come primarily through acquisitions, supplemented by organic growth resulting from major remodel and relocation projects. Implementing more effective category management practices and marketing and merchandising efforts have also contributed to our retail sales and profit growth.
We completed the acquisition of VG’s Food and Pharmacy late in fiscal 2009’s third quarter and the stores have now been integrated into our operations. These stores are well managed, are in excellent physical condition, and represent a strong retail market brand that provides a good platform for future geographic expansion. Although the economic and competitive conditions in the southeastern Michigan market have affected the near-term performance of these stores, we remain confident in their long-term potential.

Since fiscal 2007, we have completed three retail acquisitions consisting of 53 total stores. All have been successfully integrated with common systems and operating platforms. The acquisitions were either existing or former distribution customers, which provided us with strong insight about their markets and operations. This knowledge helps to ensure a smooth operational transition and integration and gives us a keen understanding of the available growth opportunities. Future acquisitions are likely to follow this pattern because our distribution operation serves approximately 360 independent retail stores, and we are a logical option for customers that may want to exit the market.
Investing selectively in retail growth opportunities continues to be an important element of our business strategy. This fiscal year, we remodeled five retail stores, closed or sold four stores, re-bannered one store, and built two new stores as part of our store relocation/consolidation program. Fuel centers are another area where we have been investing. We believe fuel provides us another vehicle to provide value to our customers and, in fiscal 2005, we began that business initiative with a single Quick Stop Fuel and Convenience center and today, we operate 24 locations. These fuel centers have been a key component of our retail business and will remain an important element of our strategy going forward.
Among some of our more important retail initiatives this year was the introduction of a loyalty card program, a program to continuously monitor customer satisfaction, a nutritional guide program to address the increasing desire of the consumer to lead a healthier life style, and a continuous focus on delivering good consumer value and strengthening loyalty.
The loyalty card program was introduced at our Glen’s Markets retail stores late in the first quarter of fiscal 2010, but has significant potential throughout our entire retail store base. The program provides excellent visibility into customer purchasing preferences and allows us to better understand, and more precisely measure, the effects of specific marketing programs. We expect this program to make our marketing investments much more effective and efficient as we harness its full potential. At his time, nearly 85 percent of the purchases at our Glen’s stores are made by customers enrolled in our loyalty program.
We have also been working more aggressively to raise our consumer value proposition, which will better align our retail tactics with the prevailing market trends. Last year we significantly expanded our low-cost generic prescription drug programs and introduced a number of successful fuel promotions. In addition to the new private brand products introduced this year, we rolled out new product shelf tags that are color coded by major FDA categories in support of healthy living, studies of which have shown adds value to customers’ shopping experience. Most recently, we initiated a more aggressive merchandising and marketing campaign to improve the value proposition for our customers. The campaign includes a redesigned ad circular emphasizing deeper value on key items, as well as an in-store sign program that will more effectively highlight the daily values offered to our customers.
Growth opportunities in this segment will continue to be primarily through acquisitions in contiguous markets where our insight and understanding is the strongest and in providing a high quality, unique, and a more intimate shopping experience that is difficult for big box retailers to replicate. Conclusion Regardless of the economic cycles, we diligently evaluate and test every aspect of our business model to ensure that it remains effective and appropriately aligned with the evolving market trends and conditions while staying fundamentally grounded in our core consumer-centric business strategy. We are confident that Spartan Stores is well positioned to strengthen our market position, realize solid sales and profit growth, and improve cash flow as the economy begins to recover.
We and our Board of Directors extend our sincere thanks to all of our associates for their continued dedication and hard work, without which, our success would not have been possible. We also sincerely thank our shareholders, customers, and suppliers for their continued support.
Craig C. Sturken Dennis EidsonExecutive Chairman President and Chief Executive Officer

This page intentionally left blank.

UNITED STATES SECURITIES AND EXCHANGE COMMISSION
WASHINGTON, D.C. 20549
FORM 10-K
Annual report pursuant to Section 13 or 15(d) of the Securities Exchange Act of 1934 For the fiscal year ended March 27, 2010.
OR Transition report pursuant to Section 13 or 15(d) of the Securities Exchange Act of 1934
For the transition period from _______________ to _______________.
Commission File Number: 000-31127
SPARTAN STORES, INC. (Exact Name of Registrant as Specified in Its Charter)
Michigan
(State or Other Jurisdiction) of Incorporation or Organization)
38-0593940 (I.R.S. Employer Identification No.)
850 76th Street, S.W.
P.O. Box 8700 Grand Rapids, Michigan
(Address of Principal Executive Offices)
49518-8700 (Zip Code)
Registrant’s telephone number, including area code: (616) 878-2000
Securities registered pursuant to Section 12(b) of the Securities Exchange Act:
Title of Class Common Stock, no par value
Name of Exchange on which Registered NASDAQ Global Select Market
Securities registered pursuant to Section 12(g) of the Securities Exchange Act: None Indicate by check mark if the registrant is a well-known seasoned issuer, as defined in Rule 405 of the Securities Act. Yes No Indicate by check mark if the registrant is not required to file reports pursuant to Section 13 or Section 15(d) of the Act. Yes No Indicate by check mark whether the registrant: (1) has filed all reports required to be filed by Section 13 or 15(d) of the Securities Exchange Act of 1934 during the preceding 12 months (or for such shorter period that the registrant was required to file such reports), and (2) has been subject to such filing requirements for the past 90 days. Yes No Indicate by a check mark whether the registrant has submitted electronically and posted on its corporate Web site, if any, every Interactive Data File requirement to be submitted and posted pursuant to Rule 405 of Regulation S-T (§ 229.405 of this chapter) during the preceding 12 months (or for such shorter period that the registrant was required to submit and post such files). Yes No Indicate by check mark if disclosure of delinquent filers pursuant to Item 405 of Regulation S-K is not contained herein, and will not be contained, to the best of registrant’s knowledge, in definitive proxy or information statements incorporated by reference in Part III of this Form 10-K or any amendment to this Form 10-K.
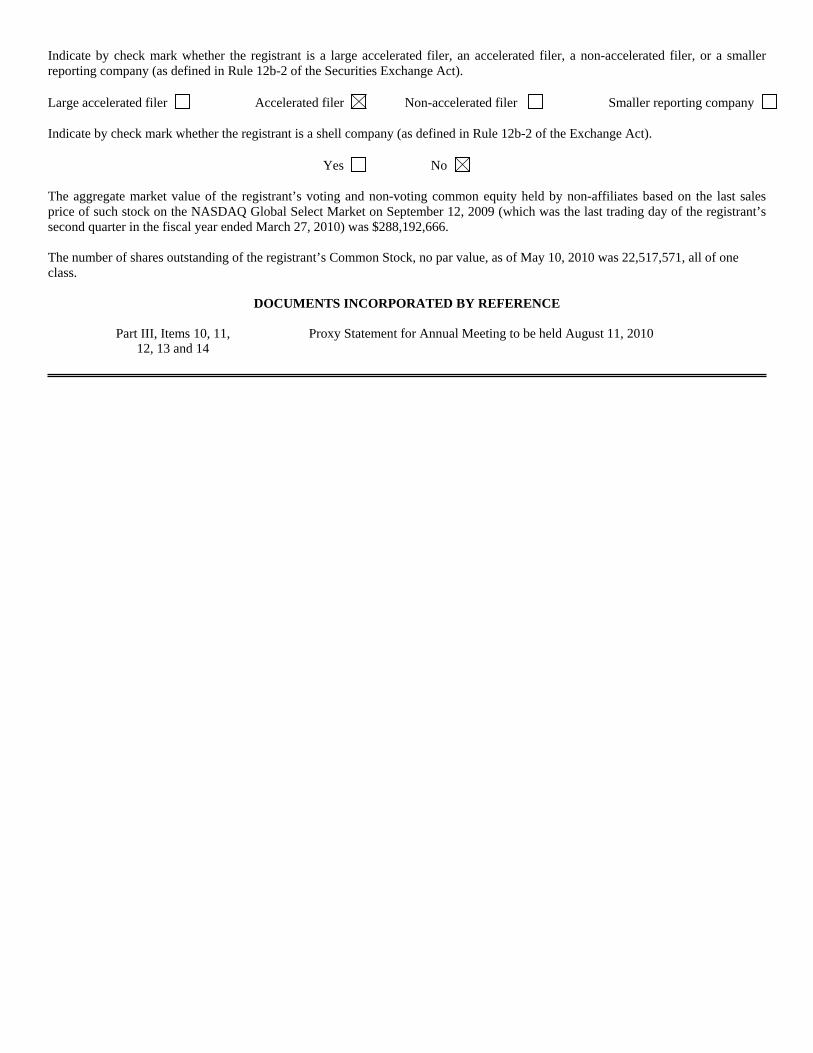
Indicate by check mark whether the registrant is a large accelerated filer, an accelerated filer, a non-accelerated filer, or a smaller reporting company (as defined in Rule 12b-2 of the Securities Exchange Act). Large accelerated filer Accelerated filer Non-accelerated filer Smaller reporting company Indicate by check mark whether the registrant is a shell company (as defined in Rule 12b-2 of the Exchange Act). Yes No The aggregate market value of the registrant’s voting and non-voting common equity held by non-affiliates based on the last sales price of such stock on the NASDAQ Global Select Market on September 12, 2009 (which was the last trading day of the registrant’s second quarter in the fiscal year ended March 27, 2010) was $288,192,666. The number of shares outstanding of the registrant’s Common Stock, no par value, as of May 10, 2010 was 22,517,571, all of one class.
DOCUMENTS INCORPORATED BY REFERENCE Part III, Items 10, 11,
12, 13 and 14 Proxy Statement for Annual Meeting to be held August 11, 2010

-3-
Forward-Looking Statements The matters discussed in this Annual Report on Form 10-K include “forward-looking statements” about the plans, strategies, objectives, goals or expectations of Spartan Stores, Inc. (together with its subsidiaries, “Spartan Stores”). These forward-looking statements are identifiable by words or phrases indicating that Spartan Stores or management “expects,” “anticipates,” “plans,” “believes,” “estimates,” “intends,” is “optimistic” or “confident” that a particular occurrence or event “will,” “may,” “could,” “should” or “will likely” result or occur or “continue” in the future, that the “outlook” or “trend” is toward a particular result or occurrence, that a development is an “opportunity,” a “priority” or “strategy” or similarly stated expectations. Accounting estimates, such as those described under the heading “Critical Accounting Policies” in Item 7 of this Annual Report on Form 10-K, are inherently forward-looking. Our asset impairment and exit cost provisions are estimates and actual costs may be more or less than these estimates and differences may be material. You should not place undue reliance on these forward-looking statements, which speak only as of the date of this Annual Report.
In addition to other risks and uncertainties described in connection with the forward-looking statements contained in this Annual Report on Form 10-K and other periodic reports filed with the Securities and Exchange Commission, there are many important factors that could cause actual results to differ materially. Our ability to maintain and strengthen our retail-store performance; assimilate acquired stores; maintain or grow sales; respond successfully to competitors; maintain gross margin; anticipate and successfully respond to openings of competitors; maintain and improve customer and supplier relationships; realize expected benefits of restructuring; realize growth opportunities; maintain or expand our customer base; reduce operating costs; sell on favorable terms assets held for sale; generate cash; continue to meet the terms of our debt covenants; continue to pay dividends, and successfully implement and realize the expected benefits of the other programs, plans, priorities, strategies, objectives, goals or expectations described in this Annual Report, our other reports, our press releases and our public comments will be affected by changes in economic conditions generally or in the markets and geographic areas that we serve, adverse effects of the changing food and distribution industries and other factors including, but not limited to, those discussed in the “Risk Factors” discussion in Item 1A of this Annual Report.
This section and the discussions contained in Item 1A, “Risk Factors,” and in Item 7, subheading “Critical
Accounting Policies” in this report, both of which are incorporated here by reference, are intended to provide meaningful cautionary statements for purposes of the safe harbor provisions of the Private Securities Litigation Reform Act of 1995. This should not be construed as a complete list of all of the economic, competitive, governmental, technological and other factors that could adversely affect our expected consolidated financial position, results of operations or liquidity. Additional risks and uncertainties not currently known to Spartan Stores or that Spartan Stores currently believes are immaterial also may impair its business, operations, liquidity, financial condition and prospects. We undertake no obligation to update or revise our forward-looking statements to reflect developments that occur or information obtained after the date of this Annual Report.

-4-
PART I Item 1. Business Overview
Spartan Stores is a leading regional grocery distributor and grocery retailer, operating principally in Michigan and Indiana. We operate two reportable business segments: Distribution and Retail. We estimate that we are the eleventh largest wholesale distributor to supermarkets in the United States and the largest wholesale distributor to supermarkets in Michigan. According to Trade Dimensions Market Scope, our distribution and retail operations hold a combined #1 or #2 market share in the Northern Michigan and Western Michigan markets we serve and a #3 market share in other Michigan markets. For the fiscal year ended March 27, 2010 (“fiscal 2010”), we generated net sales of $2.6 billion.
Established in 1917 as a cooperative grocery distributor, Spartan Stores converted to a for-profit business
corporation in 1973. In January 1999, we began to acquire retail supermarkets in our focused geographic regions. In August 2000, our common stock became listed on the NASDAQ Stock Market under the symbol “SPTN.” With approximately 8,800 associates, Spartan Stores distributes a wide variety of products to approximately 375 independent grocery stores and operates 96 conventional supermarkets.
Spartan Stores’ hybrid business model supports the close functioning of its Distribution and Retail
operations, optimizing the natural complements of each business segment. The model produces operational efficiencies, helps stimulate distribution product demand, and provides sharper market visibility and broader business growth options. In addition, the Distribution and Retail diversification provides added flexibility to pursue the best growth opportunities in each segment.
Spartan Stores has established four key management priorities that focus on the longer-term strategy of the
Company, including establishing a well-differentiated market offering for our Distribution and Retail segments, and additional strategies designed to create value for our shareholders, retailers and customers. These priorities are:
Retail sales growth: Continue refining our capital plan focusing on remodels, replacement stores, adjacent
acquisitions, expansions and new stores to fill in existing markets, leverage investments in fuel centers and pharmacy operations to drive related supermarket customer traffic and continue to focus on categorymanagement initiatives, specifically focusing on fresh offerings.
Distribution sales growth: Focus on increasing penetration of existing customers, attracting new in-market customers and adjacent-state customers, continue to share “best retail practices” with customers, provide asuperior value-added relationship and pursue acquisitions.
Margin enhancement: Continued focus on increasing penetration of private brand programs, enhancingofferings in our fresh department, lowering the cost of merchandise through vendor partnerships andimproving retail shrink.
Selling, general and administrative (“SG&A”) expense cost containment: Continue to focus on improving efficiency and general cost containment in all areas to allow us to remain cost competitive in the long-term and help offset recessionary impacts on our business in the short-term.
We believe significant progress has been made towards achieving these long-term priorities in recent years
and we will continue to focus on these priorities.
Distribution Segment
Our Distribution segment provides a selection of approximately 43,000 stock-keeping units (SKU's), including dry groceries, produce, dairy products, meat, deli, bakery, frozen food, seafood, floral products, general merchandise, pharmacy and health and beauty care items to approximately 375 independent grocery stores and our 96 corporate-owned stores. Also included are approximately 3,200 private brand grocery and general merchandise items. Total revenues from our Distribution segment, including shipments to our corporate-owned stores which are eliminated in the consolidated financial statements, were $1.8 billion for fiscal 2010.

-5-
Customers. Our Distribution segment supplies a diverse group of independent grocery store operators that range from a single store to supermarket chains with as many as 20 stores and our corporate-owned stores. Pricing to our customers is generally based upon a "cost plus" model for grocery, frozen, dairy, pharmacy and health and beauty care items and a "variable mark-up" model for meat, deli, bakery, produce, seafood, floral and general merchandise products.
Our Distribution customer base is very diverse, with no single customer, excluding corporate-owned stores, exceeding 5% of consolidated net sales. Our five largest Distribution customers (excluding corporate-owned stores) accounted for approximately 18% of our fiscal 2010 Distribution net sales. In addition, approximately 61% of Distribution net sales, including corporate-owned stores, are covered under supply agreements with our Distribution customers or are directly controlled by Spartan Stores.
Distribution Functions. Our Distribution business utilized approximately 1.8 million square feet of warehouse, distribution and office space through March 2010. Upon the closing of the Plymouth, Michigan distribution facility, discussed below, our Distribution business operates 1.4 million square feet of warehouse, distribution and office space. We supply our independent Distribution customers and our corporate-owned stores from our distribution center located in Grand Rapids, Michigan. We believe that our distribution facility is strategically located to efficiently serve our customers. We are continually evaluating our inventory movement and assigning SKU's to appropriate areas within our distribution center facilities to reduce the time required to stock and pick products in order to achieve additional efficiencies.
During the fourth quarter of fiscal 2010, we implemented the final stages of a comprehensive, multi-year supply chain optimization strategy. As a part of these optimization efforts we transitioned our Plymouth, Michigan dry grocery distribution operation to our Grand Rapids facility. This transition is expected to improve operational efficiency by increasing inventory turns, warehouse thru-put, and capacity utilization while reducing inventory investment requirements. This was another important step in our ongoing strategy of continuously improving efficiency and maintaining a low cost grocery distribution operation.
To supply our Distribution customers, we operate a fleet of approximately 105 tractors, 205 conventional dry trailers and 180 refrigerated trailers, substantially all of which are leased. In March 2010, 15 tractors and 5 conventional dry trailers were added to the fleet to support the supply chain network optimization initiative. This investment to our fleet meets new emission level requirements to support our sustainability initiatives as well as provides a world-class appearance on the road as we continue to introduce more Spartan private brand logo visibility. We take pride in our "rolling billboards" that showcase over 27 different colorful designs of Spartan private brand products and create positive visual impressions to the consumer as the fleet travels approximately 14 million miles annually.
During fiscal 2010, we successfully replaced the fleet on-board computer equipment with the new Fleet Management System, installed new dispatch software, began integration of driver payroll processing, and implemented trailer & door sensor tracking.
The Fleet Management System upgrade will provide significant benefits to our operations. On-board computer technology and related services such as hours of service, critical event reporting and performance monitoring, will help enhance our commitment to vehicle safety and efficiency of the fleet. The on-board system technological and communication advancements will allow for more real time data transfer and interaction between the fleet and our distribution centers. The new system software functionality uses a Web-Based concept as a service model eliminating the current application and database servers. In addition, this allows for future software updates to be handled wirelessly, eliminating the time company resources previously had to spend updating fleet equipment individually.
The new dispatch software will provide greater visibility to end-to-end transportation processes. This will allow users to control all dispatch activities from one central location, with real-time access to resources, simplified and controlled reporting, and enabling more cost effective labor and equipment resource alternatives to be utilized. Management can view all available shipments, determine load priorities and needs, match moves with available equipment resources, and provide data to expand and increase fleet inbound freight program profitability. In addition, payroll processing will be integrated with current operating systems to effectively and accurately manage department payroll, eliminating the need for manual input of driver payroll.

-6-
The installation of trailer and door sensor tracking was also implemented during fiscal 2010. This will work to ensure the security of assets and goods throughout the transit process, while providing remote visibility to refrigeration unit settings, service history, and fuel levels. This system will allow us to enhance our asset tracking and security strategies as well as give us the ability to complete chain of custody and cold chain integrity for contents in the transit process.
For fiscal 2011, we will continue to focus on leveraging technology to support efficiency improvements in equipment fuel economy and increased cube utilization of our trailers that should allow us to improve our sales dollars delivered per mile, resulting in a reduction in our cost to deliver products.
Additional Services. We also offer and provide many of our independent Distribution customers with value-added services, including: • Site identification and market analyses • Coupon redemption • Store planning and development • Product reclamation • Marketing, promotion and advertising • Printing • Technology and information services • Category management • Accounting and tax preparation • Real estate services • Human resource services • Construction management services Retail Segment
Our neighborhood market strategy distinguishes our stores from supercenters and limited assortment stores by emphasizing convenient locations, demographically targeted merchandise selections, high-quality fresh offerings, customer service, value pricing and community involvement.
Our Retail segment operates 96 retail supermarkets predominantly in midsize metropolitan, tourist and
lake communities of Michigan. Our retail supermarkets are operated under the banners Glen’s Markets, Family Fare Supermarkets, D&W Fresh Markets, Felpausch Food Centers and VG’s Food and Pharmacy.
Our 96 retail supermarkets typically offer dry groceries, produce, dairy products, meat, frozen food,
seafood, floral products, general merchandise, beverages, tobacco products, health and beauty care products, delicatessen items and bakery goods. Sixty-six of our supermarkets also offer pharmacy services. In addition to nationally advertised products, the stores carry private brand items, including our flagship Spartan brand, Top Care, a health and beauty care brand, Valu Time, a value brand, and Full Circle, a natural and organic brand. These private brand items provide above-average retail margins and we believe they help generate increased customer loyalty. See “Merchandising and Marketing – Corporate Brands.” Our retail supermarkets range in size from approximately 20,300 to 65,800 total square feet and average approximately 42,000 total square feet per store.
We operate 24 fuel centers at our supermarket locations operating under the banners D&W Quick Stop,
Family Fare Quick Stop, Glen’s Quick Stop, Felpausch Quick Stop and V.G.’s Quick Stop. These fuel centers offer refueling facilities and in the adjacent convenience store, a limited variety of immediately consumable products. Our prototypical Quick Stop stores are approximately 1,100 square feet in size and are located adjacent to our supermarkets. We have experienced increases in supermarket sales upon opening fuel centers and initiating cross-merchandising activities. We are planning to continue to open additional fuel centers at our supermarket locations each year over the next few years.

-7-
We acquired our stores primarily as a result of acquisitions from January 1999 to December 2008. The
following chart details the changes in the number of our retail stores over the last five fiscal years:
Fiscal Year
Number of Stores at
Beginning of Fiscal Year
Stores
Acquired or Added During
Fiscal Year
Stores
Closed or Sold During
Fiscal Year
Number of Stores at
End of Fiscal Year
2006 75 - 2 73 2007 73 16 2 87 2008 87 20 8 99 2009 99 17 16 100 2010 100 - 4 96
During fiscal 2010, we completed five major remodels of our stores in addition to many other limited
remodels and store resets. In addition, we completed one store relocation, substantially completed the construction of one new store and opened five new fuel centers. Two stores were sold to Distribution segment customers.
We expect to continue making meaningful progress with our capital investment program during fiscal
2011, by completing the construction of one new store in May 2010, relocating one store, and opening two new fuel centers. We evaluate proposed retail projects based on demographics and competition within each market, and prioritize projects based on their expected returns on investment. Approval of proposed capital projects requires a projected internal rate of return that meets or exceeds our policy; however, we may undertake projects that do not meet this standard to the extent they represent required maintenance or necessary infrastructure improvements. We believe that focusing on such measures provides us with an appropriate level of discipline in our capital expenditures process. Products
The Company offers a wide variety of grocery products, general merchandise and health and beauty care, pharmacy, fuel and other items and services. The Company’s consolidated net sales include the net sales of the Company’s corporate-owned stores and fuel centers and the net sales of the Company’s Distribution business, net of sales to affiliated stores.
The following table presents sales by type of similar product and services:
(Dollars in thousands) 2010 2009 2008 Non-perishables (1) $ 1,367,298 53% $ 1,374,566 53% $ 1,315,621 53% Perishables (2) 895,005 35 904,999 35 857,278 35 Fuel 95,937 4 98,258 4 81,185 3 Pharmacy 193,716 8 198,915 8 222,738 9 Consolidated net sales $ 2,551,956 100% $ 2,576,738 100% $ 2,476,822 100%
(1) Consists primarily of general merchandise, grocery, beverages, snacks and frozen foods. (2) Consists primarily of produce, dairy, meat, bakery, deli, floral and seafood.
-8-
Reporting Segment Financial Data More detailed information about our reporting segments may be found in Note 16 to the consolidated financial statements included in Item 8, which is herein incorporated by reference. All of our sales and substantially all of our assets are in the United States of America. Discontinued Operations
Certain of our retail and grocery distribution operations have been recorded as discontinued operations.
Accordingly, for all years presented, all Consolidated Statements of Earnings information in this Annual Report on Form 10-K has been adjusted and the discontinued operations information is excluded, unless otherwise noted. Discontinued retail operations consist of certain stores that have been closed or sold. Discontinued Distribution operations consist of our Maumee, Ohio and Toledo, Ohio distribution centers that previously serviced retail stores that have since been closed or sold.
Marketing and Merchandising
General. We continue to align our marketing and merchandising strategies with current consumer behaviors by providing initiatives centered on value, health and wellness, and meals at home. These strategies focus on consumer driven programs to effectively leverage the use of category management principles and satisfy the consumers’ needs.
Our over-arching focus on the consumer gives us keen insight about purchasing behavior and the flexibility
to adapt to rapidly changing market conditions by making tactical adjustments to our marketing and merchandising programs that deliver even more tangible value to our customers. We have and will look to expand these offerings and partner with our independent customers over time to continue to realize incremental benefits.
As we expand our service offerings, we believe that we differentiate ourselves from our competitors by
offering a full set of services, from value added services in our distribution segment to the addition of fuel centers and Starbucks Coffee shops in our retail stores. Our stores offer a program that provides fuel savings depending on shoppers’ spending level and products purchased in the retail stores. Fuel centers have proven to be effective traffic-builders for fuel-purchasing customers who wish to take advantage of cross-promotions between the stores and the Quick Stop fuel centers. Consumers are focusing on value in today's economy, and coupons such as the fuel savings program are helping us to meet that need. We continue to evolve our Pharmacy Plus program by connecting with the consumer and focusing on health and wellness. As noted above, 66 of our supermarkets now offer pharmacy services. We believe the pharmacy service offering is an important part of the consumer experience. We offer generic drugs for $4 and $10 as well as offer food solutions for preventative health and education for our customers. In 2009, we introduced an innovative partnership that resulted in the formation of one of the first employer-pharmacy health benefit plans in Michigan, a model to leverage opportunities in health management involving employees, pharmacists, and physicians. Through the continued utilization of this plan, employees have access to a network of pharmacists specially prepared to provide individualized health and wellness information, and consultation as part of their benefits plan. The alliance is an important step in our health and wellness initiative, and offers covered employees the opportunity to utilize the benefits that the supermarkets offer for a total health and nutrition solution that the drugstore platform cannot provide. During fiscal 2010, we completed the consolidation of our multiple pharmacy software systems into one system. This consolidation improves our ability to serve customers as well as reduce the cost and effort involved in supporting a multiple system format.
We also implemented a customer loyalty card program in our Glens’ Markets banner in the first quarter of fiscal 2010. This program is providing us with more sophisticated information to better understand our customers' purchasing behavior, which we are using to improve the effectiveness of our promotions, marketing and merchandising programs. We also expect the program will help solidify our long-term customer loyalty, improve

-9-
our sales growth opportunities and further strengthen our market position. We continue to enhance the program to improve our consumer offers and will continue to evaluate the program for roll out to other banners in the future. At Spartan Stores, we are committed to being a consumer driven retailer. In fiscal 2009, we implemented a new customer satisfaction program that gives consumers a new channel for communicating their store experiences. Retail customers are randomly selected via point-of-sale receipts and invited to give us feedback by taking an online survey. Results of the survey will help assess overall customer satisfaction and identify how well we are executing on key drivers of customer satisfaction and loyalty. We value the opinions of our consumers and believe the best way to deliver a satisfactory shopping experience is to let customers tell us what they want and need. We believe this survey dialogue will better enable us to identify opportunities for continuous improvements for consistency and excellence in the overall consumer experience. Corporate Brands. We currently market and distribute over 3,200 private brand items including our flagship Spartan brand, Top Care, a health and beauty care brand, Valu Time, a value brand, and Full Circle, a natural and organic brand. We believe that our private brand offerings are part of our most valuable strategic assets, demonstrated through customer loyalty and profitability. These product offerings are serving us particularly well as the consumer shifts toward a more value orientation. We have worked diligently to develop a premier private brand program. We have added more than 1,500 corporate brand products to our consumer offer in the past six years, with approximately 300 products introduced in fiscal 2010. Our products are continually recognized for excellence, and this year marked the seventh consecutive year that we have been recognized for award-winning private brand products. These awards underscore our continued commitment to providing the consumer with quality products. Additionally, we continue to focus on pursuing opportunities in fresh department consumer offerings with Spartan Fresh Selections, which was launched in fiscal 2010. The expansion of our Spartan fresh product offerings will include up to 70 new products in fiscal 2011.
Competition
Our Distribution and Retail segments operate in highly competitive markets, which typically result in low profit margins for the industry as a whole. Our Distribution and Retail segments compete with, among others, regional and national grocery distributors, independently owned retail grocery stores, large chain stores that have integrated wholesale and retail operations, mass merchandisers, limited assortment stores and wholesale membership clubs, some of whom have greater resources than we do. The principal competitive factors in the retail grocery business include the location and image of the store; the price, quality and variety of the perishable products; and the quality and consistency of service.
We believe we have developed and implemented strategies and processes that allow us to remain
competitive in our Retail segment. We monitor planned store openings by our competitors and have established proactive strategies to respond to new competition both before and after the competitive store opening. Strategies to combat competition vary based on many factors, such as the competitor’s format, strengths, weaknesses, pricing and sales focus. During the past three fiscal years, 24 competitor supercenters opened in markets in which we operate corporate-owned stores. Three additional openings are expected to occur during fiscal 2011 against our corporate-owned stores. As a result of these openings we believe the majority of our supermarkets compete with one, if not multiple, supercenters.
The primary competitive factors in the distribution business include price, product quality, variety and service. We believe our overall service level, defined as actual units shipped divided by actual units ordered, is among industry leading performance and that we effectively compete in our Distribution segment.

-10-
Seasonality
Our sales and operating performance vary with seasonality. Our first and fourth quarters are typically our lowest sales quarters and therefore operating results are generally lower during these two quarters. Additionally, these two quarters can be affected by the timing of the Easter holiday, which results in a strong sales week. Many northern Michigan stores are dependent on tourism and therefore, are most affected by seasons and weather patterns, including, but not limited to, the amount and timing of snowfall during the winter months and the range of temperature during the summer months. All quarters are 12 weeks, except for our third quarter, which is 16 weeks and includes the Thanksgiving and Christmas holidays. Suppliers
We purchase products from a large number of national, regional and local suppliers of name brand and private brand merchandise. We have not encountered any material difficulty in procuring or maintaining an adequate level of products to serve our customers. No single supplier accounts for more than 8% of our purchases. We continue to develop strategic relationships with key suppliers. We believe this will prove valuable in the development of enhanced promotional programs and consumer value perceptions.
Intellectual Property We own valuable intellectual property, including trademarks and other proprietary information, some of which are of material importance to our business. Technology
We invest in technology as a means of maximizing the efficiency of our operations, improving service to our customers, and where possible, deploying technology to provide a competitive advantage in the marketplace. Supply Chain. During fiscal 2010, we implemented a new on-board transportation management system, a new inventory optimization system for use in our distribution centers and a yard and dock management system for campus wide scheduling in our distribution centers. Retail Systems. We installed a new price optimization system for retail pricing in our corporate stores. During fiscal 2010, we continued the installation of our computer-assisted ordering and perpetual inventory system in our corporate-owned stores for grocery, frozen, dairy, general merchandise and health and beauty care. This system is now being expanded into produce and packaged meats. Installation of a new pharmacy system was completed in all of our corporate pharmacies. We deployed and have continued to enhance a customer loyalty system in one of our regions. We implemented a scan based trading system for use in our corporate locations and it is now being expanded to additional vendors. Financial Systems. During fiscal 2010, we upgraded our human resource and payroll systems and developed a new union labor administration system. We completed a number of other enhancements to our organizational management system. We continued the implementation of a new labor management system in our corporate retail sites. We are in the process of installing a new purchasing system for non-product items. Information Technology. We completed a major upgrade to our consolidated data center server environment and continued to enhance the processing infrastructure at our back up data center. As a result of the Payment Card Industry Data Security Standard (PCI-DSS) we have made major investments in our security systems and processes. Subsidiaries Our Distribution segment consists primarily of our wholly-owned subsidiary, Spartan Stores Distribution, LLC. We operate our Retail segment through our wholly-owned subsidiary, Seaway Food Town, Inc. and its respective subsidiaries.

-11-
Associates
We currently employ approximately 8,800 associates, 4,400 of which are full-time and 4,400 of which are
part-time.
Unions represent approximately 8% of our associates. A contract covering 720 distribution center and transportation associates expires in October 2011.
We consider our relations with our union and non-union associates to be good and have not had any
material work stoppages in over twenty years. Regulation
We are subject to federal, state and local laws and regulations covering the purchase, handling, sale and transportation of our products. Several of our products are subject to federal Food and Drug Administration regulation. We believe that we are in substantial compliance with Food and Drug Administration and other federal, state and local laws and regulations governing our businesses. Forward-Looking Statements The matters discussed in this Item 1 include forward-looking statements. See “Forward-Looking Statements” at the beginning of this Annual Report on Form 10-K. Available Information The address of our web site is www.spartanstores.com. The inclusion of our website address in this Form 10-K does not include or incorporate by reference the information on or accessible through our website, and you should not consider information contained on or accessible through those websites as part of this Form 10-K. We make our Annual Reports on Form 10-K, Quarterly Reports on Form 10-Q, Current Reports on Form 8-K and other reports (and amendments to those reports) filed or furnished pursuant to Section 13(a) of the Securities Exchange Act available on our web site as soon as reasonably practicable after we electronically file or furnish such materials with the Securities and Exchange Commission. Interested persons can view such materials without charge by clicking on “Investor Information” and then “SEC Filings” on our web site. Spartan Stores is an “accelerated filer” within the meaning of Rule 12b-2 under the Securities Exchange Act. Item 1A. Risk Factors
Our business faces many risks. If any of the events or circumstances described in the following risk factors occurs, our financial condition or results of operations may suffer, and the trading price of our common stock could decline. This discussion of risk factors should be read in conjunction with the other information in this Annual Report on Form 10-K. All of our forward-looking statements are affected by the risk factors discussed in this item and this discussion of risk factors should be read in conjunction with the discussion of forward-looking statements which appears at the beginning of this report. We operate in an extremely competitive industry. Many of our competitors are much larger than we are and may be able to compete more effectively.
Our Distribution and Retail segments compete with, among others, regional and national grocery distributors, independently owned retail grocery stores, large chain stores that have integrated wholesale and retail operations, mass merchandisers, limited assortment stores and wholesale membership clubs, some of whom have greater resources than we do.
This competition may result in reduced profit margins and other harmful effects on us and the independent retail grocery stores that we supply. Ongoing industry consolidation could result in our loss of customers that we

-12-
currently supply and could confront our retail operations with competition from larger and better-capitalized chains in existing or new markets. We may not be able to compete successfully in this environment. Government regulation could harm our business.
Our business is subject to extensive governmental laws and regulations including, but not limited to, employment and wage laws and regulations, regulations governing the sale of alcohol and tobacco, minimum wage requirements, working condition requirements, public accessibility requirements, citizenship requirements, and other laws and regulations. A violation or change of these laws could have a material effect on our business, financial condition and results of operations.
Like other companies that sell food, our stores are subject to various federal, state, local, and foreign laws,
regulations, and administrative practices affecting our business. We must comply with numerous provisions regulating health and sanitation standards, facilities inspection, food labeling, and licensing for the sale of food, drugs, and alcoholic beverages.
We cannot predict the nature of future laws, regulations, interpretations, or applications, or determine what effect either additional government regulations or administrative orders, when and if promulgated, or disparate federal, state, local, and foreign regulatory requirements would have on our future business. They could, however, require that we recall or discontinue sale of certain products, make substantial changes to our facilities or operations, or otherwise result in substantial increases in operating expense. Furthermore, if the federal Employee Free Choice Act is passed it could adversely affect our flexibility to run our business in the most efficient manner to remain competitive. Any or all of such requirements could have an adverse effect on our results of operations and financial condition.
We are subject to state and federal environmental regulations. Under various federal, state and local laws, ordinances and regulations, we may, as the owner or operator of our locations, be liable for the costs of removal or remediation of contamination at these or our former locations, whether or not we knew of, or were responsible for, the presences of such contamination. The failure to properly remediate such contamination may subject us to liability to third parties and may adversely affect our ability to sell or lease such property or to borrow money using such property as collateral. Compliance with existing and future environmental laws regulating underground storeage tanks may require significant capital expenditures and increased operating and maintenance costs. The remediation costs and other costs required to clean up or treat contaminated sites could be substantial. In the future, we may incur substantial expenditures for remediation of contamination that has not been discovered at existing or acquired locations. We cannot assure you that we have identified all environmental liabilities at all of our current and former locations; that material environmental conditions not known to us do not exist; that future laws, ordinances or regulations will not impose material environmental liability on us; or that a material environmental condition does not otherwise exist as to any one or more of our locations. In addition, failure to comply with any environmental laws, ordinances or regulations or an increase in regulations could adversely affect our operating results and financial condition. Safety concerns regarding our products could harm our business.
Concerns regarding the safety of food products sold by us could cause shoppers to avoid purchasing certain products from us, or to seek alternative sources of supply for some or all of their food needs, even if the basis for concern is outside of our control. Any loss of confidence on the part of our customers would be difficult and costly to re-establish. Any real or perceived issue regarding the safety of any food items sold by us, regardless of the cause, could have a substantial and adverse effect on our business. We may not be able to implement our strategy of growth through acquisitions.
Part of our growth strategy involves selected acquisitions of additional retail grocery stores or grocery store chains. We may not be able to implement this part of our growth strategy or ultimately be successful. We may not
-13-
be able to identify suitable acquisition candidates in the future, complete acquisitions or obtain the necessary financing.
Because we operate in the Distribution business, future acquisitions of retail grocery stores could result in us competing with our independent grocery store customers and could have adverse effects on existing business relationships with our distribution customers.
The success of our retail store acquisitions will depend, in part, on whether we obtain the business synergies and related cost savings that we anticipated in connection with these transactions and any future acquisitions. Accordingly, we may not achieve forecasted results and long-term business goals. Our business is subject to risks from regional economic conditions and other factors in our markets.
Our business is sensitive to changes in general economic conditions. The United States economy and financial markets have declined and experienced volatility due to uncertainties related to energy prices, availability of credit, difficulties in the banking and financial services sector, the decline in the housing market, diminished market liquidity, falling consumer confidence and rising unemployement rates. Furthermore, most of our sales are to customers located in Michigan and Indiana and the Michigan economy in particular is dependent upon the automotive industry which is evolving. Michigan has the highest unemployment rate in the country. These adverse economic conditions in our markets, potential reduction in the populations in our markets and the loss of purchasing power by residents in our markets could reduce the amount of groceries purchased, adversely affecting our revenues and profitability. Further adverse developments in the automotive and auto supply industries in Michigan and Indiana could have an additional adverse affect on purchasing power of our customers and prospective customers in some markets served by our retail stores and those of our distribution customers. This could lead to additional reductions in consumer spending, to consumers trading down to less expensive mix of products or to consumers trading down to discounters, all of which may affect our financial condition and results of operations.
In addition, many of our retail grocery stores, as well as stores operated by our independent grocery store customers, are located in areas of northern Michigan that are heavily dependent upon tourism. Unseasonable weather conditions and the economic conditions discussed above may decrease tourism activity and could result in decreased sales by our retail grocery stores and decreased sales to our distribution customers, adversely affecting our business. We may be unable to retain our key management personnel. Our success depends to a significant degree upon the continued contributions of senior management. The loss of any key member of our management team may prevent us from implementing our business plans in a timely manner. We cannot assure you that successors of comparable ability will be identified and appointed and that our business will not be adversely affected. A number of our associates are covered by collective bargaining agreements.
Certain of our associates in our distribution business segment are covered by a collective bargaining agreement which expires in October 2011. In future negotiations with the labor union, we expect that rising health care, pension and other employee benefit costs, among other issues, will continue to be important topics of negotiation. Upon the expiration of our collective bargaining agreement, work stoppages by the affected workers could occur if we are unable to negotiate an acceptable contract with the labor union. This could significantly disrupt our operations. Further, if we are unable to control health care and pension costs provided for in the collective bargaining agreement, we may experience increased operating costs and an adverse impact on future results of operations. Unions may attempt to organize additional employees. While we believe that relations with our employees are good, we cannot be assured that we will not become the target of campaigns similar to those faced by our competitors. The potential for unionization could increase if the federal Employee Free Choice Act or similar legislation is passed. We respect our employees’ right to unionize or not to unionize. However, the unionization of a significant portion of our workforce could increase our overall costs
-14-
at the affected locations and adversely affect our flexibility to run our business in the most efficient manner to remain competitive or acquire new business. In addition, significant union representation would require us to negotiate wages, salaries, benefits and other terms with many of our employees collectively and could adversely affect our results of operations by increasing our labor costs or otherwise restricting our ability to maximize the efficiency of our operations. Costs related to multi-employer pension plans and other postretirement plans could increase.
We contribute to several multi-employer pension plans based on obligations arising under collective bargaining agreements. These plans are not administered by or in any way controlled by us and we have relatively little control over the level of contributions we are required to make to these plans. Currently, a number of these multi-employer plans are underfunded. As a result, contributions are scheduled to increase and we expect that contributions to these plans may be subject to further increases. Additionally, the benefit levels and related issues will continue to create collective bargaining challenges. The amount of any increase or decrease in our required contributions to these multi-employer pension plans will depend upon the outcome of collective bargaining, actions taken by trustees who manage the plans, governmental regulations, the actual return on assets held in the plan, the continued viability and contributions of other employers which contribute to the plan, and the potential payment of a withdrawal liability if we choose to exit a market, among other factors.
Under current law, an employer that withdraws or partially withdraws from a multi-employer pension plan
may incur a withdrawal liability to the plan, which represents the portion of the plan’s underfunding that is allocable to the withdrawing employer under very complex actuarial and allocation rules. Withdrawal liabilities may be incurred under a variety of circumstances, including selling, closing or substantially reducing employment at a facility. Withdrawal liabilities could be material, and potential exposure to withdrawal liabilities may influence business decisions and could cause the company to forgo business opportunities.
We maintain defined benefit retirement plans for substantially all of our employees that do not participate in multi-employer pension plans. Expenses associated with the defined benefit plans may significantly increase with changes to actuarial assumptions or investment returns on plan assets that are less favorable than projected. In addition, changes in our funding status could adversely affect our financial position. Risks associated with insurance plan claims could increase future expenses.
We use a combination of insurance and self-insurance to provide for potential liabilities for workers’ compensation, automobile and general liability, property insurance, director and officers’ liability insurance, and employee health care benefits. The liabilities that have been recorded for these claims represent our best estimate, using generally accepted actuarial reserving methods, of the ultimate obligations for reported claims plus those incurred but not reported for all claims incurred through March 27, 2010. Any actuarial projection of losses is subject to a high degree of variability. Changes in legal trends and interpretations, variability in inflation rates, changes in the nature and method of claims settlement, benefit level changes due to changes in applicable laws, and changes in discount rates could all affect the level of reserves required and could cause material future expense to maintain reserves at appropriate levels. Costs related to associate healthcare benefits could increase. We provide health benefits for a large number of associates. Our costs to provide such benefits continue to increase annually and recent legislative and private sector initiatives regarding healthcare reform are likely to result in significant changes to the U.S. healthcare system. At this time we are not able to determine the impact that healthcare reform will have on the Company-sponsored healthcare plans. In addition, we participate in various multi-employer health plans for our union associates, and we are required to make contributions to these plans in amounts established under collective bargaining agreements. The cost of providing benefits through such plans has escalated rapidly in recent years. The amount of any increase or decrease in our required contributions to these multi-employer plans will depend upon many factors, many of which are beyond our control. If we are unable to control the costs of providing healthcare to associates, we may experience increased operating costs, which may adversely affect our financial condition and results of operations.

-15-
Changes in vendor promotions or allowances, including the way vendors target their promotional spending, and our ability to effectively manage these programs could significantly impact our margins and profitability.
We cooperatively engage in a variety of promotional programs with our vendors. As the parties assess the results of specific promotions and plan for future promotions, the nature of these programs and the allocation of dollars among them change over time. We manage these programs in order to maintain or improve margins while at the same time increasing sales for us and for the vendors. A reduction in overall promotional spending or a shift in promotional spending away from certain types of promotions that we and our distribution customers have historically utilized could have a significant impact on profitability. Threats to security or the occurrence of a health pandemic could harm our business.
Our business could be severely impacted by wartime activities, threats or acts of terrorism or a widespread health pandemic may adversely impact our business by disrupting delivery of products to our corporate stores or our independent retail customers, by affecting our ability to appropriately staff our stores and by causing customers to avoid public places.
We have large, complex information technology systems that are important to our business operations.
Although we have implemented security programs and disaster recovery facilities and procedures, security could be compromised and systems disruptions, data theft or other criminal activity could occur. This could result in a loss of sales or profits or cause us to incur significant costs to reimburse third parties for damages.
Severe weather and natural disasters could harm our business. Severe weather conditions and natural disasters, whether a result of climate change or otherwise, could affect the suppliers from whom we purchase products and could cause disruptions in our operations. Additionally, unseasonably adverse climatic conditions that impact growing conditions and the crops of food producers may adversely affect the availability or cost of certain products.
Damage to our facilities could harm our business. A majority of the product we supply to our retail stores and distribution customers flows through our distribution center. While we believe we have adopted commercially reasonable precautions, insurance programs, and contingency plans, destruction of, or substantial damage to our distribution center due to natural disaster, severe weather conditions, accident, terrorism, or other causes could substantially compromise our ability to distribute products to our retail stores and distribution customers. This could result in a substantial loss of sales, profits and asset value. We are subject to restrictive covenants imposed by our credit facility. Our ability to borrow additional funds is governed by the terms of our credit facilities. The credit facilities contain financial and other covenants that, among other things, limit the Company’s ability to draw down the full amount of facility, incur additional debt outside of the credit facility, create new liens on property, make acquisitions, or pay dividends. These covenants may affect our operating flexibility and may require us to seek the consent of the lenders to certain transactions that we may wish to carry out. We are not currently restricted by these covenants. We believe that cash generated from operating activities and available borrowings under our credit facility will be sufficient to meet anticipated requirements for working capital, capital expenditures, and debt service obligations for the foreseeable future. However, there can be no assurance that our business will continue to generate cash flow at or above current levels or that we will maintain our ability to borrow under our credit facility. Item 1B. Unresolved Staff Comments None.
-16-
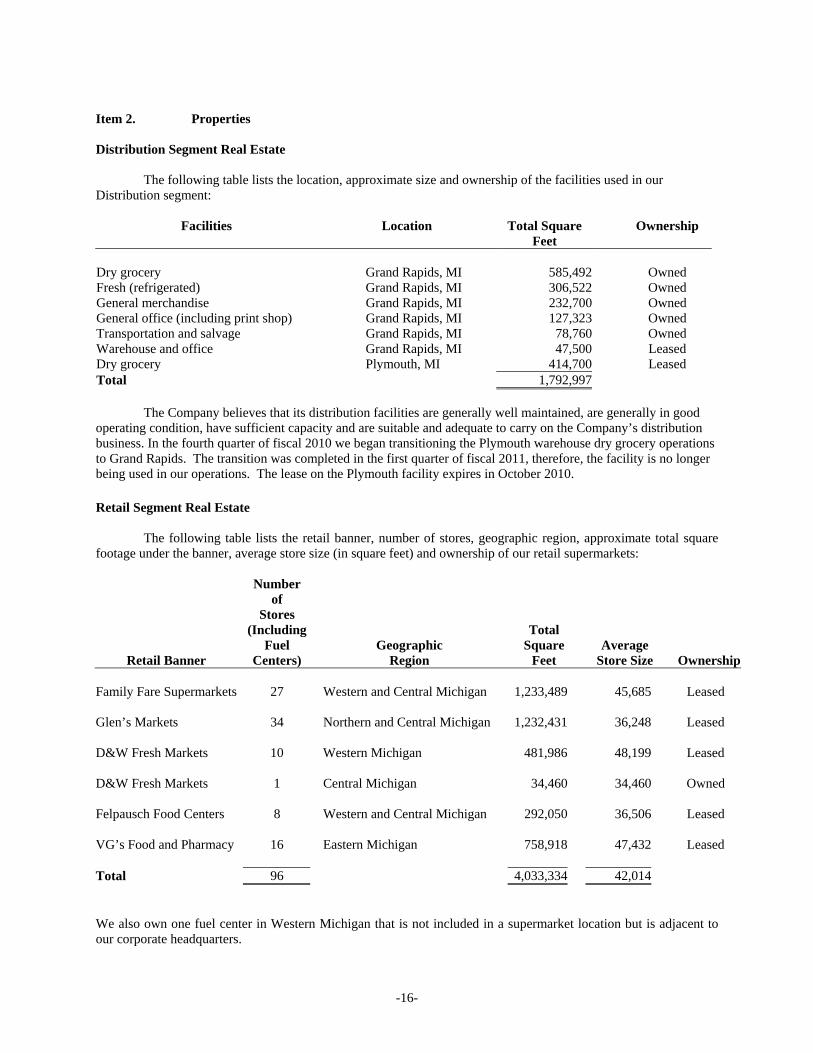
Item 2. Properties Distribution Segment Real Estate
The following table lists the location, approximate size and ownership of the facilities used in our Distribution segment:
Facilities Location Total Square
Feet Ownership
Dry grocery Grand Rapids, MI 585,492 Owned Fresh (refrigerated) Grand Rapids, MI 306,522 Owned General merchandise Grand Rapids, MI 232,700 Owned General office (including print shop) Grand Rapids, MI 127,323 Owned Transportation and salvage Grand Rapids, MI 78,760 Owned Warehouse and office Grand Rapids, MI 47,500 Leased Dry grocery Plymouth, MI 414,700 Leased Total 1,792,997
The Company believes that its distribution facilities are generally well maintained, are generally in good operating condition, have sufficient capacity and are suitable and adequate to carry on the Company’s distribution business. In the fourth quarter of fiscal 2010 we began transitioning the Plymouth warehouse dry grocery operations to Grand Rapids. The transition was completed in the first quarter of fiscal 2011, therefore, the facility is no longer being used in our operations. The lease on the Plymouth facility expires in October 2010. Retail Segment Real Estate
The following table lists the retail banner, number of stores, geographic region, approximate total square
footage under the banner, average store size (in square feet) and ownership of our retail supermarkets:
Retail Banner
Number of
Stores (Including
Fuel Centers)
Geographic
Region
Total Square
Feet
Average
Store Size
Ownership Family Fare Supermarkets 27 Western and Central Michigan 1,233,489 45,685 Leased Glen’s Markets 34 Northern and Central Michigan 1,232,431 36,248 Leased D&W Fresh Markets 10 Western Michigan 481,986 48,199 Leased D&W Fresh Markets 1 Central Michigan 34,460 34,460 Owned Felpausch Food Centers 8 Western and Central Michigan 292,050 36,506 Leased VG’s Food and Pharmacy 16 Eastern Michigan 758,918 47,432 Leased Total 96 4,033,334 42,014 We also own one fuel center in Western Michigan that is not included in a supermarket location but is adjacent to our corporate headquarters.

-17-
Item 3. Legal Proceedings
Various lawsuits and claims, arising in the ordinary course of business, are pending or have been asserted against Spartan Stores and its subsidiaries. While the ultimate effect of such lawsuits and claims cannot be predicted with certainty, management believes that their outcome will not result in a material adverse effect on the consolidated financial position, operating results or liquidity of Spartan Stores. Item 4. Reserved

-18-
PART II Item 5. Market for Registrant’s Common Equity and Related Stockholder Matters
Spartan Stores common stock is traded on the NASDAQ Global Select Market under the trading symbol “SPTN.”
Stock sale prices are based on transactions reported on the NASDAQ Global Select Market. Information on quarterly high and low sales prices for Spartan Stores’ common stock appears in Note 17 to the consolidated financial statements and is incorporated here by reference. At May 10, 2010, there were approximately 505 shareholders of record of Spartan Stores common stock.
The Company has paid a quarterly cash dividend of $0.05 per common share since the fiscal 2006 fourth quarter. Under its senior revolving credit facility, the Company is generally permitted to pay dividends in any fiscal year up to an amount such that all cash dividends, together with any cash distributions or share repurchases, do not exceed $15.0 million. Although we expect to continue to pay a quarterly cash dividend, adoption of a dividend policy does not commit the board of directors to declare future dividends. Each future dividend will be considered and declared by the board of directors at its discretion. The ability of the board of directors to continue to declare dividends will depend on a number of factors, including our future financial condition and profitability and compliance with the terms of our credit facilities.
The equity compensation plans table in Item 12 is here incorporated by reference. There were no transactions regarding Company purchases of its own common stock during the fourth
quarter. The Company has no public stock repurchase plans or programs.

-19-
Performance Graph Set forth below is a graph comparing the cumulative total shareholder return on Spartan Stores’ common
stock to that of the Russell 2000 Total Return Index and the NASDAQ Retail Trade Index, over a period beginning March 24, 2005 and ending on March 26, 2010.
Cumulative total shareholder return is measured by the sum of (1) the cumulative amount of dividends for
the measurement period, assuming dividend reinvestment and (2) the difference between the share price at the end and the beginning of the measurement period, divided by the share price at the beginning of the measurement period.
Comparison of 5 Year Cumulative Total ReturnAssumes Initial Investment of $100
March 2010
0.00
50.00
100.00
150.00
200.00
250.00
300.00
03/24/2005 03/24/2006 03/30/2007 03/28/2008 03/27/2009 03/26/2010
Spartan Stores Inc. Russell 2000 Total Return Index NASDAQ Retail Trade Index
The dollar values for total shareholder return plotted above are shown in the table below:
March 24, 2005
March 24, 2006
March 30, 2007
March 28, 2008
March 27, 2009
March 26, 2010
Spartan Stores $ 100.00 $ 116.09 $ 249.84 $ 191.32 $ 144.19 $ 139.72 Russell 2000 Total
Return Index 100.00 123.85 133.17 115.24 73.95 118.36 NASDAQ Retail
Trade 100.00 113.21 116.36 97.28 73.81 110.39
The information set forth under the Heading “Performance Graph” shall not be deemed to be “soliciting
material” or to be “filed” with the Commission or subject to Regulation 14A or 14C, or to the liabilities of Section 18 of the Exchange Act, except to the extent that the registrant specifically requests that such information be treated as soliciting material or specifically incorporates it by reference into a filing under the Securities Act or the Exchange Act.

-20-
Item 6. Selected Financial Data
The following table provides selected historical consolidated financial information of Spartan Stores. The historical information was derived from our audited consolidated financial statements as of and for each of the five fiscal years ended March 25, 2006 through March 27, 2010. As noted elsewhere in this Form 10-K, for all years presented, Consolidated Statements of Earnings information in this Form 10-K has been adjusted for the reclassification of discontinued operations information, unless otherwise noted. See Note 15 to the consolidated financial statements in Item 8 for additional information on discontinued operations. For all years presented, Consolidated Balance Sheets and Consolidated Statements of Earnings information in this Form 10-K has been adjusted for the adoption of the provisions of Accounting Standards Codification (ASC) Subtopic 470-20 (originally issued as Financial Accounting Standards Board (FASB) Staff Position No. APB 14-1, “Accounting for Convertible Debt Instruments That May Be Settled in Cash upon Conversion (Including Partial Cash Settlement)”) and for the adoption of updated provisions of ASC Topic 260 (originally issued as FSP No. EITF 03-6-1, “Determining Whether Instruments Granted in Share-Based Payment Transactions Are Participating Securities”). See Note 2 to the consolidated financial statements in Item 8 for additional information on the adoption of the updated ASC provisions. Fiscal 2007 consisted of 53 weeks. All other years presented consisted of 52 weeks. (In thousands, except per share data)
Year Ended March 27,
2010 March 28,2009 (C)
March 29, 2008 (C)
March 31, 2007 (C)
March 25,2006
Statements of Operations Data: Net sales $ 2,551,956 $ 2,576,738 $ 2,476,822 $ 2,206,270 $ 1,872,854Cost of sales 1,993,306 2,040,625 1,981,854 1,774,816 1,527,736Gross margin 558,650 536,113 494,968 431,454 345,118Selling, general and administrative expenses
493,832
463,369
433,346
378,324
310,013
Restructuring and asset impairment costs (A) 6,154 - - 4,464 985Operating earnings 58,664 72,744 61,622 48,666 34,120 Interest expense 16,394 14,138 13,842 12,132 7,138Other, net (138) (341) (287) (647 ) (1,317)
Earnings before income taxes and discontinued operations
42,408
58,947
48,067
37,181
28,299
Income taxes 16,475 23,914 17,216 13,013 9,650 Earnings from continuing operations
25,933
35,033
30,851
24,168
18,649
Earnings (loss) from discontinued operations, net of taxes (B)
(375)
1,838
1,795
992
(477)
Net earnings $ 25,558 $ 36,871 $ 32,646 $ 25,160 $ 18,172 Basic weighted average shares outstanding
22,406
22,102
21,847
21,463
20,796
Diluted weighted average shares outstanding
22,480 22,262 22,058 21,738 21,174
Basic earnings from continuing operations per share
$ 1.16
$ 1.59
$ 1.41
$
1.13
$ 0.89
Diluted earnings from continuing operations per share 1.15 1.57 1.40 1.11 0.88
Basic earnings per share 1.14 1.67 1.49 1.17 0.87 Diluted earnings per share 1.14 1.66 1.48 1.16 0.86Cash dividends declared per share 0.20 0.20 0.20 0.20 0.05 Balance Sheet Data: Total assets $ 753,481 $ 723,311 $ 609,395 $ 487,499 $ 378,597Property and equipment, net 247,961 234,806 183,185 143,213 115,178Working capital 15,739 20,969 20,499 27,213 20,736

-21-
Long-term debt and capital lease obligations 181,066 194,115 118,742 106,341 64,015Shareholders’ equity 273,905 247,205 221,406 172,741 145,417
(A) See Note 5 to Consolidated Financial Statements (B) See Note 15 to Consolidated Financial Statements (C) Spartan Stores acquired certain assets and assumed certain liabilities of VG’s in fiscal 2009, Felpausch in fiscal 2008 and
D&W in fiscal 2007. See Note 3 to the Consolidated Financial Statements set forth in Part II, Item 8 of this report. Historical data is not necessarily indicative of the Company’s future results of operations or financial condition. See discussion of “Risk Factors” in Part I, Item 1A of this report, “Management’s Discussion and Analysis of Financial Condition and Results of Operations” in Part II, Item 7 of this report, and the Consolidated Financial Statements and notes thereto in Part II, Item 8 of this Annual Report on Form 10-K.

-22-
Item 7. Management’s Discussion and Analysis of Financial Condition and Results of Operations Executive Overview
Spartan Stores is a leading regional grocery distributor and grocery retailer, operating principally in Michigan and Indiana.
We currently operate two reportable business segments: Distribution and Retail. Our Distribution segment provides a full line of grocery, general merchandise, health and beauty care, frozen and perishable items to approximately 375 independently owned grocery stores and our 96 corporate owned stores. Our Retail segment operates 96 retail supermarkets in Michigan under the banners Glen’s Markets, Family Fare Supermarkets, D&W Fresh Markets, Felpausch Food Centers, and VG’s Food and Pharmacy, and 24 fuel centers/convenience stores, included at our supermarket locations, under the banners Glen’s Quick Stop, Family Fare Quick Stop, D&W Fresh Markets Quick Stop, Felpausch Quick Stop, and VG’s Quick Stop. Our retail supermarkets have a “neighborhood market” focus to distinguish them from supercenters and limited assortment stores.
Our sales and operating performance vary with seasonality. Our first and fourth quarters are typically our lowest sales quarters and therefore operating results are generally lower during these two quarters. Additionally, these two quarters can be affected by the timing of the Easter holiday, which results in a strong sales week. Many northern Michigan stores are dependent on tourism and, therefore, are most affected by seasons and weather patterns, including, but not limited to, the amount and timing of snowfall during the winter months and the range of temperature during the summer months. All quarters are 12 weeks, except for our third quarter, which is 16 weeks and includes the Thanksgiving and Christmas holidays.
We have established four key management priorities that focus on the longer-term strategy of the
Company, including establishing a well-differentiated market offering for our Distribution and Retail segments, and additional strategies designed to create value for our shareholders, retailers and customers. These priorities are:
Retail sales growth: Continue refining our capital plan focusing on remodels, replacement stores, adjacent
acquisitions, expansions and new stores to fill in existing markets, leverage investments in fuel centers andpharmacy operations to drive related supermarket customer traffic and continue to focus on category management initiatives, specifically focusing on the continued enhancement of the value offered ourconsumers.
Distribution sales growth: Focus on increasing penetration of existing customers, attracting new in-market customers and adjacent-state customers, continue to share “best retail practices” with customers, provide asuperior value-added relationship and pursue acquisitions.
Margin enhancement: Continued focus on increasing penetration of private brand programs, enhancingofferings in our fresh department, lowering the cost of merchandise through vendor partnerships andimproving retail shrink.
Selling, general and administrative expense cost containment: Continue to focus on improving efficiencyand general cost containment in all areas to allow us to remain cost competitive in the long-term and help offset recessionary impacts on our business in the short-term. We continued the execution of our capital investment program by completing one store relocation,
completing five major store remodels, substantially completing one new store and opening five new fuel centers. We also acquired three pharmacies raising the total number of stores with pharmacies to 66. We introduced approximately 80 new private brand offerings in fresh food categories.
We launched four retail programs in fiscal 2010 that are intended to enhance the value delivered to
consumers. As part of our emphasis on consumer health and wellness, we began a major nutrition guide program in our D&W and Family Fare retail stores early in the third quarter. Our program introduces new shelf tags that clearly and simply identify the health and nutrition benefits on approximately 16,000 products. The labels are color coded by FDA category, and we believe are easy to understand, simple to follow and help consumers to quickly identify the health and nutrition attributes of the food they buy. We also launched our Michigan’s Best initiative which clearly identifies and promotes 2,400 products grown, made or processed in Michigan. We also implemented a

-23-
customer loyalty card program in our Glens’ Markets banner late in the first quarter of fiscal 2010. This program is beginning to provide us with more sophisticated information to better understand our customers' purchasing behavior, which we are using to improve the effectiveness of our promotions, marketing and merchandising programs. We also expect the program will help solidify our long-term customer loyalty, improve our sales growth opportunities and further strengthen our market position. We continue to enhance the program to improve our consumer offers and will continue to evaluate the program for roll out to other banners in the future. In addition, we also implemented our first continuous customer satisfaction monitoring system which allows customers to rate individual stores on multiple dimensions of shopping satisfaction.
At the beginning of the fourth quarter of fiscal 2010, we began implementing the conclusions of a
comprehensive, multi-year supply chain optimization study. This is another important step in our ongoing strategy of maintaining a low cost grocery distribution operation. We reached an agreement with the Teamsters Local 337 to transition our Plymouth, Michigan dry grocery distribution operation to our Grand Rapids, Michigan facility. The transition was substantially complete at the end of the fourth quarter of fiscal 2010. During the past several years, we have prudently invested capital to upgrade our distribution system technology, expand our produce ripening operations, upgrade our entire fleet of trucks, and completed a major warehouse re-racking project at our Grand Rapids grocery distribution center that significantly increased warehouse capacity and improved space utilization. In addition to improved customer service through a centralized Grand Rapids facility, this decision along with our other cost reduction initiatives will also ensure better alignment between the current level of business activity and our cost structure. In conjunction with the warehouse optimization, we implemented another administrative cost reduction initiative by eliminating certain positions. As a result of the closing of the warehouse facility and elimination of certain administrative positions, we incurred charges of $4.2 million for severance, asset impairment and other related one-time costs. We also expect to incur a fiscal 2011 first quarter after tax net benefit of approximately $0.5 million for a favorable LIFO inventory benefit due to inventory reductions, net of lease termination and additional distribution center closing costs that are anticipated to occur during the quarter. Annualized after tax cost savings from these initiatives are expected to range from approximately $2.0 million to $2.5 million.
We introduced over 300 new private brand products during fiscal 2010. These products are typically less
expensive and produce higher gross margins than national brands and tend to be more frequently purchased by consumers in challenging economic times. In fiscal 2011, we plan to expand our private brand offerings and are targeting over 300 items.
Although we expect the near term economic climate in markets where we operate to remain challenging,
we are encouraged by the recent, more favorable macro economic trends, including stabilizing employment trends, more robust automobile sales and a favorable trend in consumer sentiment. We believe that these signals indicate the early stages of an economic recovery which should bode well for the Michigan economy and our markets. We are also encouraged by the lower rate of product price deflation and inflationary trends in certain product categories such as produce. As a result of these developments, we expect a more favorable operating environment to develop in the second half of fiscal 2011.
The matters discussed in this Item 7 include forward-looking statements. See “Forward-Looking
Statements” at the beginning and “Risk Factors” in Item 1A of this Annual Report on Form 10-K.

-24-
Results of Operations
The following table sets forth items from our Consolidated Statements of Earnings as a percentage of net sales and the year-to-year percentage change in dollar amounts: Percentage of Net Sales Percentage Change March 27,
2010 March 28,
2009 March 29,
2008
2010/2009
2009/2008Net sales 100.0 100.0 100.0 (1.0) 4.0 Gross margin 21.9 20.8 20.0 4.2 8.3 Selling, general and administrative expenses 19.4 18.0 17.5 6.6
6.9
Restructuring and asset impairment costs 0.2 - - * - Operating earnings 2.3 2.8 2.5 (19.4) 18.0 Other income and expenses 0.6 0.5 0.6 17.8 1.7 Earnings before income taxes and discontinued operations 1.7
2.3 1.9 (28.1)
22.6
Income taxes 0.7 0.9 0.7 (31.1) 38.9 Earnings from continuing operations 1.0 1.4 1.2 (26.0) 13.6 (Loss) earnings from discontinued
operations, net of taxes 0.0 0.0 0.1 (120.4)
2.4
Net earnings 1.0 1.4 1.3 (30.7) 12.9 * Percentage change is not meaningful
Results of Continuing Operations for the Fiscal Year Ended March 27, 2010 Compared to the Fiscal Year Ended March 28, 2009 Net Sales. Net sales decreased $24.8 million, or 1.0%, from $2,576.7 million in fiscal 2009 to $2,551.9 million in fiscal 2010. The sales decrease was primarily driven by the economic and competitive environments, product price deflation in certain primary product categories and the closure or sale of six retail stores during fiscal 2010 and 2009. Net sales in our Distribution segment, after intercompany eliminations, decreased $157.3 million, or 12.6%, from $1,248.6 million to $1,091.3 million primarily due to the elimination of sales to VG’s stores of $110.8 million (due to our acquisitions of the stores), negative 3.3% comparable sales to existing independent customers, and lower sales in our marginally profitable pharmacy distribution program of $10.5 million.
Net sales in our Retail segment increased $132.6 million, or 10.0%, from $1,328.1 million to $1,460.7 million. The sales increase was primarily due to incremental sales related to the VG's acquisition of $199.2 million, partially offset by a decrease in supermarket comparable store sales of $56.0 million and lost sales of $12.1 million relating to six stores that were closed or sold in fiscal 2010 and 2009. Total retail comparable store sales decreased 4.9 percent in fiscal 2010 principally due to the weakened economic environment. We define a retail store as comparable when it is in operation for 14 accounting periods (a period equals four weeks), and we include remodeled, expanded and relocated stores in comparable stores.
Gross Margin. Gross margin represents net sales less cost of sales, which include purchase costs and promotional allowances. Vendor allowances that relate to our buying and merchandising activities consist primarily of promotional allowances, which are generally allowances on purchased quantities and, to a lesser extent, slotting allowances, which are billed to vendors for our merchandising costs, such as setting up warehouse infrastructure. Vendor allowances associated with product cost are recognized as a reduction in cost of sales when the product is sold. Lump sum payments received for multi-year contracts are amortized over the life of the contracts based on contractual terms.
Gross margin increased by $22.5 million, or 4.2%, from $536.1 million to $558.6 million. As a percent of net sales, gross margin increased from 20.8% to 21.9%. The gross margin rate improvement was due principally to

-25-
an increase in the mix of higher margin retail sales as a percentage of consolidated sales and slightly higher margin rates in both segments due to a decrease in LIFO expense of $2.7 million.
Selling, General and Administrative Expenses. Selling, general and administrative (“SG&A”) expenses consist primarily of salaries and wages, employee benefits, warehousing costs, store occupancy costs, utilities, equipment rental, depreciation and other administrative costs.
SG&A expenses increased $30.5 million, or 6.6%, from $463.4 million to $493.8 million, and were 19.4%
of net sales compared to 18.0% last year. The net increase in SG&A is due primarily to the following:
Additional operating expenses of $49.7 million associated with having the acquired VG’s retail stores for a full year in fiscal 2010.
Increased depreciation and amortization of $3.2 million, excluding $3.3 million related to VG’s. Reductions in non-store incentive compensation of $4.6 million. Reductions in store labor of $4.5 million due to lower sales volumes and efficiency improvements, net of a
$0.9 million charge for a payment resulting from the restructuring of an employee benefit program. Reductions in operating expenses of $3.5 million related to the sale or closure of six stores in fiscal 2010
and 2009. Reductions in occupancy costs of $2.7 million driven by utilities and rent. Decreased transportation and fuel costs of $2.0 million. Other reductions in general and administrative expenses due to a overriding focus on cost containment
initiatives. We expect to realize annualized expense savings of $4.0 million to $4.5 million as a result of the the
warehouse consolidation and corporate workforce reduction that occurred in the fourth quarter of fiscal 2010. Restructuring and Asset Impairment Costs. Fiscal 2010 restructuring and asset impairment costs include
$4.2 million in severance and other one-time costs directly related to the transition of the Plymouth, Michigan warehouse operations to the Grand Rapids, Michigan facilities, $1.1 million for the provision of lease and related ancillary costs, net of sublease income, related to the closure of two stores, a reduction of $0.9 million related to changes in estimated costs and sublease recoveries in excess of previous estimates, and $1.7 million in asset impairment charges for assets at closed stores, assets at underperforming stores and abandoned development projects.
Interest Expense. Interest expense increased $2.3 million, or 16.0%, from $14.1 million to $16.4 million, and was 0.6% of net sales in fiscal 2010 compared to 0.5% of net sales in fiscal 2009. The increase in interest expense is primarily due to an increase in average outstanding borrowings related to the acquisition of VG’s late in fiscal 2009. On January 2, 2009, we entered into an interest rate swap agreement. The interest rate swap is considered to be a cash flow hedge of interest payments on $45.0 million of borrowings under our senior secured revolving credit facility by effectively converting a portion of the variable rate debt to a fixed rate basis. Under the terms of the agreement, we have agreed to pay the counterparty a fixed interest rate of 3.33% and the counterparty has agreed to pay Spartan Stores a floating interest rate based upon the 1-month LIBOR plus 1.25% (1.48% at March 27, 2010) on a notional amount of $45 million. The interest rate swap agreement expires concurrently with our senior secured revolving credit facility on December 24, 2012.
Income Taxes. The effective tax rate is 38.8% and 40.6% for fiscal 2010 and fiscal 2009, respectively. The difference from the statutory rate is primarily due to State of Michigan income taxes, partially offset by tax credits. The effective tax rate decreased in fiscal 2010 due to an increase in tax credits and charitable product contributions.

-26-
Results of Continuing Operations for the Fiscal Year Ended March 28, 2009 Compared to the Fiscal
Year Ended March 29, 2008
Net Sales. Net sales increased $99.9 million, or 4.0%, from $2,476.8 million in fiscal 2008 to $2,576.7 million in fiscal 2009. The sales increase was primarily due to incremental sales from the Felpausch and VG's retail acquisitions, comparable store sales growth in our supermarkets, new distribution customer business and product cost inflation.
Net sales in our Distribution segment, after intercompany eliminations, decreased $35.7 million, or 2.8%, from $1,284.3 million to $1,248.6 million primarily due to the elimination of sales to VG's and Felpausch stores of $37.8 million and $20.6 million, respectively, (due to our acquisitions of the stores), lower sales in our marginally profitable pharmacy distribution program of $26.1 million, partially offset by incremental sales of $53.5 million to new distribution customers primarily obtained in fiscal 2008.
Net sales in our Retail segment increased $135.6 million, or 11.4%, from $1,192.5 million to $1,328.1 million. The sales increase was primarily due to incremental sales from the acquired VG's stores of $72.7 million and Felpausch retail stores of $43.2 million, supermarket comparable store sales growth of $23.3 million and increases in fuel center sales of $19.4 million, partially offset by lost sales of $23.4 million relating to three stores that were sold in fiscal 2008, one store that was closed early in fiscal 2009 and one store that was sold in the third quarter of fiscal 2009. Excluding sales from fuel centers and Easter holiday sales in the fiscal 2008 first and fourth quarters, comparable store sales increased 2.7 percent principally due to our marketing programs, ongoing capital investment program, including store remodels, and product cost inflation.
Gross Margin. Gross margin represents net sales less cost of sales, which include purchase costs and promotional allowances. Vendor allowances that relate to our buying and merchandising activities consist primarily of promotional allowances, which are generally allowances on purchased quantities and, to a lesser extent, slotting allowances, which are billed to vendors for our merchandising costs, such as setting up warehouse infrastructure. Vendor allowances associated with product cost are recognized as a reduction in cost of sales when the product is sold. Lump sum payments received for multi-year contracts are amortized over the life of the contracts based on contractual terms.
Gross margin increased by $41.1 million, or 8.3%, from $495.0 million to $536.1 million. As a percent of net sales, gross margin increased from 20.0% to 20.8%. The gross margin rate improvement was due principally to an increase in the mix of higher margin retail sales as a percentage of consolidated sales and an improvement in distribution segment gross margin.
Selling, General and Administrative Expenses. Selling, general and administrative ("SG&A") expenses consist primarily of salaries and wages, employee benefits, warehousing costs, store occupancy costs, utilities, equipment rental, depreciation and other administrative costs.
SG&A expenses increased $30.0 million, or 6.9%, from $433.3 million to $463.4 million, and were 18.0%
of net sales compared to 17.5% last year. The net increase in SG&A is due primarily to the following:
Additional operating costs associated with the acquired VG's retail stores of $17.8 million, including approximately $0.3 million of training and other start-up related costs.
Additional operating costs, excluding incremental grand re-opening costs for remodeled stores, associated with the acquired Felpausch retail stores of $7.5 million.
Increases in compensation and benefits, excluding VG's, Felpausch and fuel centers, of $6.7 million. Incremental costs of $1.0 million related to grand re-opening costs for remodeled stores. Increased depreciation and amortization, excluding VG's, Felpausch and fuel centers, of $1.6 million. The cost of operating additional fuel centers of $1.4 million. Increased utilities costs, excluding VG's, Felpausch and fuel centers, of $1.2 million. Reduced operating costs related to the sale of four retail stores and closure of one store since the prior year
of $6.0 million. Reclassification of operating expenses due to replacement of $1.5 million of the Michigan Single Business
Tax (MSBT) with a new income tax for the State of Michigan. The MSBT was not considered an incometax and was included in operating expenses.

-27-
Interest Expense. Interest expense increased $0.3 million, or 2.1%, from $13.8 million to $14.1 million, and was 0.5% of net sales in fiscal 2009 and 0.6% of net sales in fiscal 2008. The increase in interest expense is due to an increase in average outstanding borrowings of $14.9 million and an increase in non-cash interest expense related to our convertible senior notes, partially offset by a decrease in interest rates.
Income Taxes. The effective tax rate is 40.6% and 35.8% for fiscal 2009 and fiscal 2008, respectively. The difference from the statutory rate is primarily due to State of Michigan income taxes. On January 1, 2008 a new income tax for the State of Michigan became effective which replaced the Michigan Single Business Tax ("MSBT"). The MSBT was not considered an income tax and was included in SG&A expenses. Total Michigan taxes, net of the Federal income tax benefit, were $3.3 million in fiscal 2009 compared to $1.3 million in fiscal 2008. The fiscal 2008 amount is comprised of MSBT expense of $0.8 million and $0.5 million for the new Michigan income tax, both net of the Federal tax benefit.
Discontinued Operations
Certain of our retail and grocery distribution operations have been recorded as discontinued operations. Results of the discontinued operations are excluded from the accompanying notes to the condensed consolidated financial statements for all periods presented, unless otherwise noted.
During the second quarter of fiscal year 2008, Spartan Stores decided to close five The Pharm stores and
one Felpausch Xpressmart. The decision to close the stores was based on a comprehensive evaluation of the stores’ performance trends, long-term growth prospects, on-going capital requirements and lease expiration dates. As Spartan Stores has no continuing interest in the operations of these stores, they have been classified as discontinued operations for all years presented. Prescription lists and pharmacy inventories were sold for $4.7 million, and asset impairment charges of $0.9 million were recognized. The stores were closed early in the third quarter of fiscal 2008.
During the fourth quarter of fiscal year 2008, Spartan Stores approved a plan to close the remaining 14 The
Pharm stores. In fiscal 2009, we completed the closure and sale of prescription files of all The Pharm stores, allowing us to concentrate efforts and resources on business opportunities with the best long-term growth potential and focus more on core distribution and conventional supermarket operations. Cash proceeds of $13.8 million were received. Asset impairment charges and exit costs of $5.6 million were recognized.
Critical Accounting Policies This discussion and analysis of our financial condition and results of operations is based upon our consolidated financial statements. The preparation of these financial statements requires us to make estimates and assumptions that affect the reported amounts. On an ongoing basis, we evaluate our estimates, including those related to bad debts, inventories, intangible assets, assets held for sale, long-lived assets, income taxes, self-insurance reserves, exit costs, retirement benefits, stock-based compensation and contingencies and litigation. We base our estimates on historical experience and on various other assumptions and factors that we believe to be reasonable under the circumstances. Based on our ongoing review, we make adjustments we consider appropriate under the facts and circumstances. We have discussed the development, selection and disclosure of these policies with the Audit Committee of the Board of Directors. We believe that the following represent the more critical estimates and assumptions used in the preparation of our consolidated financial statements. Inventories. Inventories are valued at the lower of cost or market using the last-in, first-out (“LIFO”) method. If replacement cost had been used, inventories would have been $46.6 million and $46.8 million higher at March 27, 2010 and March 28, 2009, respectively. We use the retail inventory method (“RIM”) and replacement cost method to determine the cost of our inventory. Under the RIM method, inventory is stated at cost with cost of sales and gross margin calculated by applying a cost ratio to the retail value of inventories. The replacement cost method utilizes the most current unit purchase cost to calculate the value of inventories. We evaluate inventory shortages throughout the year based on actual physical counts in our facilities. We record allowances for inventory
-28-
shortages based on the results of recent physical counts to provide for estimated shortages from the last physical count to the financial statement date. Vendor Funds. We receive funds from many of the vendors whose products we buy for resale in our corporate-owned stores and to our independent retail customers. Given the highly promotional nature of the retail supermarket industry, vendor allowances are generally intended to defray the costs of promotion, advertising and selling the vendor’s products. Vendor allowances that relate to our buying and merchandising activities consist primarily of promotional allowances, which are generally allowances on purchased quantities and, to a lesser extent, slotting allowances, which are billed to vendors for our merchandising costs such as setting up warehouse infrastructure. The proper recognition and timing of accounting for these items are significant to the reporting of the results of our operations. Vendor allowances are recognized as a reduction in cost of sales when the related product is sold. Lump sum payments received for multi-year contracts are amortized over the life of the contracts based on contractual terms.
Goodwill. Goodwill is reviewed for impairment on an annual basis (during the fourth quarter), or whenever events occur or circumstances change that would more likely than not reduce the fair value of a reporting unit below its carrying amount. Fair values are determined based on the discounted cash flows and comparable market values of each reporting segment. If the fair value of the reporting unit is less than its carrying value, the fair value of the implied goodwill is calculated as the difference between the fair value of the reporting unit and the fair value of the underlying assets and liabilities, excluding goodwill. An impairment charge is recorded for any excess of the carrying value over the implied fair value. Our goodwill impairment analysis also includes a comparison of the aggregate estimated fair value of each reporting segment to our total market capitalization. Therefore, a significant and sustained decline in our stock price could result in goodwill impairment charges. During times of financial market volatility, significant judgment is given to determine the underlying cause of the decline and whether stock price declines are short-term in nature or indicative of an event or change in circumstances.
Determining market values using a discounted cash flow method requires that we make significant
estimates and assumptions, including long-term projections of cash flows, market conditions and appropriate discount rates. Our judgments are based on historical experience, current market trends and other information. In estimating future cash flows, we rely on internally generated five-year forecasts for sales and operating profits, including capital expenditures and a 3% long-term assumed growth rate of cash flows for periods after the five-year forecast for the Retail segment and 2.5% for the Distribution segment. The future estimated cash flows were discounted using a rate of 10.9% and 12.0% for the Retail and Distribution segments, respectively. We generally develop these forecasts based on recent sales data for existing operations and other factors. While we believe that the estimates and assumptions underlying the valuation methodology are reasonable, different assumptions could result in different outcomes. Based on our annual review during fiscal years 2010, 2009 and 2008, no goodwill impairment charge was required to be recorded. No goodwill impairment charge would be required even if the current estimate of future discounted cash flows was 10% lower. Furthermore, no goodwill impairment charge would be required if the discount rate was increased 1%.
Impairment of Long-Lived Assets Other Than Goodwill. Long-lived assets to be held and used are evaluated for impairment when events or circumstances indicate that the carrying amount of an asset may not be recoverable. When the undiscounted future cash flows are not sufficient to recover an asset’s carrying amount, the fair value is compared to the carrying value to determine the impairment loss to be recorded. Long-lived assets are evaluated at the asset-group level which is the lowest level for which identifiable cash flows are largely independent of the cash flows of other assets and liabilities. In fiscal 2010, asset impairments for long-lived assets totaled $1.9 million. No material impairments for long-lived assets to be held and used were determined to exist for fiscal years 2009 and 2008.
Long-lived assets to be disposed of are reported at the lower of carrying amount or fair value, less cost to
sell. Management determines fair values using independent appraisals, quotes or expected sales prices developed by internal real estate professionals. Estimates of expected sales prices are judgments based upon our experience, knowledge of market conditions and current offers received. Changes in market conditions, the economic environment and other factors can significantly impact these estimates. While we believe that the estimates and assumptions underlying the valuation methodology are reasonable, different assumptions could result in a different outcome. If the current estimate of future discounted cash flows was 10% lower an additional impairment reserve of $0.3 million would be required.
-29-
Insurance Reserves. We are primarily self-insured for costs related to workers’ compensation, general
liability and health insurance. We record our self-insurance liabilities based on reported claims experience and an estimate of claims incurred but not yet reported. Workers’ compensation and general liability are actuarially determined on a discounted basis. We have purchased stop-loss coverage to limit our exposure to any significant exposure on a per claim basis. Our exposure for workers’ compensation and general liability is $0.5 million per claim and for health insurance our exposure is $0.3 million per associate per year.
Any projection of losses concerning workers’ compensation, general liability and health insurance is
subject to a considerable degree of variability. Among the causes of variability are unpredictable external factors affecting future inflation rates, discount rates, litigation trends, legal interpretations, benefit level changes and claim settlement patterns. Although our estimates of liabilities incurred do not anticipate significant changes in historical trends for these variables, such changes could have a material impact on future claim costs and currently recorded liabilities. The impact of many of these variables is difficult to estimate. As of March 27, 2010, a one percentage point decrease in the discount rate, or 100 basis points, would increase our liability less than $0.1 million and a one percentage point increase in the discount rate would decrease our liability by less than $0.1 million. Restructuring Costs. We record restructuring costs for closed stores that are subject to long-term lease commitments based upon the future minimum lease payments and related ancillary costs from the date of closure to the end of the remaining lease term, net of estimated sublease rentals that could be reasonably expected to be obtained for the property. Future cash flows are based on contractual lease terms and knowledge of the market in which the closed store is located. These estimates are subject to multiple factors, including inflation, ability to sublease the property and other economic conditions. Internally developed estimates of sublease rentals are based upon the market in which the property is located, the results of previous efforts to sublease similar property and the current economic environment. Reserves may be adjusted in the future based upon the actual resolution of each of these factors. At March 27, 2010 exit costs for store lease and ancillary costs totaling $33.9 million are recorded net of approximately $0.2 million of existing sublease rentals. Based upon the current economic environment we do not believe that we will be able to obtain any additional sublease rentals. A 10% increase/decrease in future estimated ancillary costs would increase/decrease the exit costs reserve by approximately $1.4 million.
Pension. Accounting for defined benefit cash balance pension plans involves estimating the cost of benefits
to be provided in the future, based on vested years of service, and attributing those costs over the time period each employee works. The significant factors affecting our pension costs are the fair value of plan assets and the selection of management’s key assumptions, including the expected return on plan assets, rate of compensation increases and discount rate used by our actuary to calculate our liability. We consider current market conditions, including changes in interest rates and investment returns, in selecting these assumptions. Our discount rate is based on current investment yields on high quality fixed-income investments and projected cash flow obligations. The discount rate used to determine fiscal 2010 pension expense was 7.00%. Expected return on plan assets is based on projected returns by asset class on broad, publicly traded equity and fixed-income indices, as well as target asset allocation. Our target allocation mix is designed to meet our long-term pension requirements. For fiscal 2010, our assumed rate of return was 8.25%. Over the ten-year period ended March 27, 2010, the average actual return was approximately 5.2%. The deteriorating conditions in the global financial markets during 2008 led to a substantial reduction in the 10-year average rate of return on pension assets. We expect that the markets will eventually recover to our assumed long-term rate of return. We maintained our rate of increases in compensation at 4.00%. While we believe the assumptions selected are reasonable, significant differences in our actual experience, plan amendments or significant changes in the fair value of our plan assets may materially affect our pension obligations and our future expense. A 25 basis point increase or decrease in the discount rate would have decreased/increased fiscal 2010 pension expense by less than $0.1 million. A 25 basis point increase or decrease in the expected return on plan assets would have decreased/increased fiscal 2010 pension expense by $0.1 million. A 50 basis point increase or decrease in the compensation increases would have increased/decreased fiscal 2010 pension expense by $0.1 million.
The unfunded status of our defined benefit plans was $10.7 million and $17.6 million for 2010 and 2009,
respectively. The decrease in the unfunded balance during fiscal 2010 is a result of an actual gain on plan assets of $13.5 million, partially offset by service and interest costs exceeding contributions by $0.7 million and an actuarial loss of $5.9 million. Plan assets increased by 41.2% primarily due to market gains on assets and company contributions of $6.0 million, partially offset by benefit payments of $4.3 million. Pension expense was $2.7 million and $1.3 million in fiscal 2010 and fiscal 2009, respectively.

-30-
Liquidity and Capital Resources The following table summarizes our consolidated statements of cash flows for fiscal years 2010, 2009 and 2008: (In thousands)
March 27,
2010 March 28,
2009 March 29,
2008 Net cash provided by operating activities $ 91,702 $ 80,922 $ 67,777 Net cash used in investing activities (58,028) (159,736) (87,946) Net cash (used in) provided by financing activities (27,896) 52,554 21,940 Net cash (used in) provided by discontinued operations (3,127) 12,912 6,033 Net increase (decrease) increase in cash and cash
equivalents 2,651 (13,348) 7,804
Cash and cash equivalents at beginning of year 6,519 19,867 12,063 Cash and cash equivalents at end of year $ 9,170 $ 6,519 $ 19,867
Net cash provided by operating activities increased during fiscal 2010 primarily due to improved timing of payments. The increase during fiscal 2009 was primarily due to an increase in net earnings, timing of new business in fiscal 2008 and collection of new customer advances made in fiscal 2008 with delayed payment terms.
During fiscal 2010, we did not pay any Federal income taxes due to application of fiscal 2009
overpayments. Net cash used in investing activities decreased in fiscal 2010 due to decreased acquisition and capital
expenditure activity. We paid a total cash purchase price of $6.4 million and $103.4 million for acquisitions in fiscal years 2010 and 2009, respectively. Net cash used in investing activities was higher in fiscal 2009 due to increased acquisition and capital expenditure activity. Excluding the acquisitions, our Distribution and Retail segments utilized 15% and 85%, respectively, of our capital expenditure dollars for fiscal 2010. Expenditures were used for new stores, land, store remodels and refurbishments, new fuel centers and new equipment and software. Under the terms of our senior secured revolving credit facility, should our available borrowings fall below certain levels, our capital expenditures would be restricted each fiscal year. Our current available borrowings are approximately $101 million above these limits as of March 27, 2010 and we do not expect to fall below these levels. As a result of our aggressive capital improvement program in fiscal years 2010 and 2009, our retail store base is in good physical condition. Consequently, we expect capital expenditures to decrease to a range of $30 million to $35 million in fiscal 2011, primarily for the completion of one new store, one relocated store, store remodels, fuel centers, new equipment and software. The reduced capital expenditure activity will result in incremental cash flow that is available for strategic purposes or further debt reductions.
Net cash used in or provided by financing activities includes cash paid and received related to our long-
term borrowings, dividends paid, tax benefits of stock compensation and proceeds from the issuance of common stock. The decrease in cash from financing activities in fiscal 2010 was primarily due to borrowings on our senior secured revolving credit facility that were used to finance the VG’s acquisition in fiscal 2009 and other debt repayments. The increase in cash provided from financing activities in fiscal 2009 was primarily due to the VG’s acquisition, partially offset by other debt repayments. Although we currently expect to continue to pay a quarterly cash dividend, adoption of a dividend policy does not commit the board of directors to declare future dividends. Each future dividend will be considered and declared by the board of directors in its discretion. Whether the board of directors continues to declare dividends depends on a number of factors, including our future financial condition and profitability and compliance with the terms of our credit facilities. Our current maturities of long-term debt and capital lease obligations at March 27, 2010 are $4.2 million. Our ability to borrow additional funds is governed by the terms of our credit facilities.
On January 2, 2009, Spartan Stores entered into an interest rate swap agreement. The interest rate swap is
considered to be a cash flow hedge of interest payments on $45.0 million of borrowings under Spartan Stores’ senior secured revolving credit facility by effectively converting a portion of the variable rate debt to a fixed rate basis.

-31-
Under the terms of the agreement, Spartan Stores has agreed to pay the counterparty a fixed interest rate of 3.33% and the counterparty has agreed to pay Spartan Stores a floating interest rate based upon the 1-month LIBOR plus 1.25% (1.48% at March 27, 2010) on a notional amount of $45 million. The interest rate swap agreement expires concurrently with its senior secured revolving credit facility on December 24, 2012.
Net cash (used in) provided by discontinued operations contains the net cash flows of our discontinued operations and consists primarily of the payment of store exit cost reserves, insurance run-off claims and other liabilities and proceeds from the sale of assets. Included in fiscal years 2009 and 2008 cash flows from discontinued operations are proceeds on the sale of assets of $13.8 million and $3.6 million, respectively.
Our principal sources of liquidity are cash flows generated from operations and our senior secured revolving credit facility. Interest on our convertible senior notes is payable on May 15 and November 15 of each year. The revolving credit facility matures December 2012, and is secured by substantially all of our assets. As of March 27, 2010, our revolving credit facility had outstanding borrowings of $45.0 million, available borrowings of $121.4 million and maximum availability of $131.4 million, which exceeds the minimum excess availability levels, as defined in the credit agreement.
Prior to amending our credit facility in the first quarter of fiscal 2008, we had a $225.0 million senior secured revolving credit facility maturing December 2010. The amended credit facility extended the maturity by two years, and, at our option, we may increase the maximum amount available under the credit facility up to $275.0 million through increased commitments from lenders. Additional borrowing would be subject to existing asset levels. On August 17, 2007, Spartan Stores entered into an agreement to increase the maximum credit available under its existing senior secured credit facility from $225.0 million to $255.0 million.
Available borrowings under the credit facility are based on stipulated advance rates on eligible assets, as
defined in the credit agreement. The credit facility contains covenants that include a minimum fixed charge coverage ratio and maximum capital expenditures, as defined in the credit agreement. These covenants are not effective as long as we maintain minimum excess availability levels, as defined in the credit agreement. The credit facility provides for the issuance of letters of credit of which $1.7 million were outstanding and unused as of March 27, 2010. Borrowings under the revolving credit portion of the facility bear interest at the London InterBank Offered Rate (“LIBOR”) plus 1.25%, adjusted based upon availability levels, or the prime rate (weighted average interest rate of 3.33% at March 27, 2010 including the effects of the interest rate swap).
Our current ratio decreased slightly to 1.09:1.00 at March 27, 2010 from 1.13:1.00 at March 28, 2009 and our investment in working capital was $15.7 million at March 27, 2010 versus $21.0 million at March 28, 2009. Our debt to total capital ratio decreased to 0.40:1.00 at March 27, 2010 versus 0.44:1.00 at March 28, 2009, primarily due to reductions in long-term debt.
Our total capital structure includes borrowings under our credit facility, convertible senior notes, various other debt instruments, leases and shareholders’ equity. Historically, we have financed our capital needs through a combination of internal and external sources. Management believes that cash generated from operating activities and available borrowings under the credit facility will be sufficient to meet anticipated requirements for working capital, capital expenditures, dividend payments, and debt service obligations for the foreseeable future. However, there can be no assurance that our business will continue to generate cash flow at or above current levels or that we will maintain our ability to borrow under our credit facility.
Adjusted EBITDA is a non-GAAP financial measure that our credit facility defines as net earnings from
continuing operations plus depreciation and amortization, and other non-cash charges including imputed interest, deferred (stock) compensation, LIFO expense and costs associated with the closing of operational locations, plus interest expense, the provision for income taxes and Michigan Single Business Tax to the extent deducted in the computation of net earnings.
Adjusted EBITDA is not a measure of performance under accounting principles generally accepted in the
United States of America, and should not be considered as a substitute for net earnings, cash flows from operating activities and other income or cash flow statement data. The adjusted EBITDA information has been included as one measure of our operating performance and historical ability to service debt. We believe that investors find the information useful because it reflects the resources available for strategic opportunities including, among others, to

-32-
invest in the business, make strategic acquisitions and to service debt. Adjusted EBITDA as defined by us may not be comparable to similarly titled measures reported by other companies.
Following is a reconciliation of net earnings to adjusted EBITDA for fiscal years 2010, 2009 and 2008.
(In thousands) 2010 2009
2008
Net earnings $ 25,558 $ 36,871 $ 32,646Add: Discontinued operations 375 (1,838) (1,795) Income taxes 16,475 23,914 17,216 Interest expense 16,394 14,138 13,842 Other income and expenses (138) (341) (287)Operating earnings 58,664 72,744 61,622Add: Depreciation and amortization 34,640 28,133 23,781 LIFO (income) expense (176) 2,531 2,578 Restructuring and asset impairment costs 6,154 - - Michigan Single Business Tax expense
(benefit)
(100)
(320) 1,213 Other non-cash charges 4,096 4,815 2,780Adjusted EBITDA $ 103,278 $ 107,903 $ 91,974 Reconciliation of operating earnings to adjusted EBITDA by segment:
Retail: Operating earnings $ 20,591 $ 29,560 $ 26,941Add: Depreciation and amortization 26,042 20,031 16,139 LIFO expense 185 2,208 639 Restructuring and asset impairment costs 1,948 - - Michigan Single Business Tax expense
(benefit)
(50)
(170) 177 Other non-cash charges (148) 125 (108)Adjusted EBITDA $ 48,568 $ 51,754 $ 43,788 Distribution: Operating earnings $ 38,073 $ 43,184 $ 34,681Add: Depreciation and amortization 8,598 8,102 7,642 LIFO (income) expense (361) 323 1,939 Restructuring and asset impairment costs 4,206 - - Michigan Single Business Tax expense
(benefit) (50) (150) 1,036 Other non-cash charges 4,244 4,690 2,888Adjusted EBITDA $ 54,710 $ 56,149 $ 48,186

-33-
The table below presents our significant contractual obligations as of March 27, 2010 (1):
Payment Due by Period
Total Less than 1
year
1-3 years
3-5 years More than 5
years (In thousands) Long-term debt $ 137,466 $ 140 $ 45,140 $ 92,061 $ 125Estimated interest on long-
term debt (2)
17,535
4,233 8,081 5,213 8Capital leases (3) 47,809 4,069 8,534 6,866 28,340Interest on capital leases 27,390 3,882 6,736 5,451 11,321Operating leases (3) 151,995 31,448 49,236 31,394 39,917Lease and ancillary costs
of closed stores, including imputed interest
39,040 7,702 11,241 9,480 10,617Purchase obligations
(merchandise) (4)
570,856 176,784 347,055 35,517 11,500FIN 48 unrecognized tax
liability 2,232 569 6 1,657 -Self-insurance liability 8,013 5,552 1, 482 543 436Total $ 1,002,336 $ 234,379 $ 477,511 $ 188,182 $ 102,264 (1) Excludes funding of pension and other postretirement benefit obligations, which totaled approximately $6.3 million in fiscal 2010. Spartan Stores is required to make a contribution of $2.9 million to its defined benefit pension plan in fiscal 2011 to meet minimum pension funding requirements Also excludes contributions under various multi-employer pension plans, which totaled $7.5 million in fiscal 2010. For additional information, refer to Note 11 to the consolidated financial statements. (2) Interest payments on long-term debt assume the remaining convertible subordinated notes are repurchased in whole on May 15, 2014 in accordance with the applicable terms. For additional information refer to Note 6 to the consolidated financial statements. (3) Operating and capital lease obligations do not include common area maintenance, insurance or tax payments for which the Company is also obligated. In fiscal 2010, these charges totaled approximately $11.1 million. (4) The majority of our purchases involve supply orders to purchase products for resale in the ordinary course of business. These contracts are typically cancelable and therefore no amounts have been included in the table above. Also excluded are contracts that do not contain minimum annual purchase commitments but include other standard contractual considerations that must be fulfilled in order to earn $2.0 million in advanced contract monies that has been received where recognition has been deferred on the Consolidated Balance Sheet. The purchase obligations shown in this table represent the amount of product we are contractually obligated to purchase to earn $8.3 million in advanced contract monies that are receivable under the contracts. At March 27, 2010, $4.1 million in advanced contract monies has been received under these contracts where recognition has been deferred on the Consolidated Balance Sheet. If we do not fulfill these purchase obligations, we would only be obligated to repay the unearned upfront contract monies.
Cash Dividends
We paid a quarterly cash dividend of $0.05 per common share in each quarter of fiscal years 2010, 2009
and 2008. Under our senior revolving credit facility, we are generally permitted to pay dividends in any fiscal year up to an amount such that all cash dividends together with any cash distributions or share repurchases, do not exceed $15.0 million. Although we currently expect to continue to pay a quarterly cash dividend, adoption of a dividend policy does not commit the board of directors to declare future dividends. Each future dividend will be considered and declared by the board of directors in its discretion. Whether the board of directors continues to declare dividends depends on a number of factors, including our future financial condition and profitability and compliance with the terms of our credit facilities.

-34-
Indebtedness and Liabilities of Subsidiaries
On May 30, 2007, the Company sold $110 million aggregate principal amount of 3.375% Convertible Senior Notes due 2027 (the “Notes”). The Notes are general unsecured obligations and rank equally in right of payment with all of the Company’s other existing and future obligations that are unsecured and unsubordinated. Because the Notes are unsecured, they are structurally subordinated to our subsidiaries’ existing and future indebtedness and other liabilities and any preferred equity issued by our subsidiaries. We rely in part on distributions and advances from our subsidiaries in order to meet our payment obligations under the notes and our other obligations. The Notes are not guaranteed by our subsidiaries. Many of our subsidiaries serve as guarantors with respect to our existing credit facility. Creditors of each of our subsidiaries, including trade creditors, and preferred equity holders, generally have priority with respect to the assets and earnings of the subsidiary over the claims of our creditors, including holders of the Notes. The Notes, therefore, are effectively subordinated to the claims of creditors, including trade creditors, judgment creditors and equity holders of our subsidiaries. In addition, our rights and the rights of our creditors, including the holders of the notes, to participate in the assets of a subsidiary during its liquidation or reorganization are effectively subordinated to all existing and future liabilities and preferred equity of that subsidiary. The Notes are effectively subordinated to our existing and future secured indebtedness to the extent of the assets securing such indebtedness and to existing and future indebtedness and other liabilities of our subsidiaries (including subsidiary guarantees of our senior credit facility). The following table shows the indebtedness and other liabilities of our subsidiaries as of March 27, 2010:
Spartan Stores Subsidiaries Only
(In thousands)
(unaudited) March 27,
2010 Current Liabilities Accounts payable $ 114,397 Accrued payroll and benefits 31,833 Other accrued expenses 21,151 Current portion of restructuring costs 8,877 Current maturities of long-term debt and capital lease obligations 4,209 Total current liabilities 180,467 Long-term Liabilities Postretirement benefits 20,081 Other long-term liabilities 17,730 Restructuring costs 27,061 Long-term debt and capital lease obligations 44,104 Total long-term liabilities 108,976 Total Subsidiary Liabilities 289,443Operating Leases 149,215Total Subsidiary Liabilities and Operating Leases $ 438,658
Ratio of Earnings to Fixed Charges
Our ratio of earnings to fixed charges was 2.51:1.00 and 3.38:1.00 for fiscal 2010 and fiscal 2009,
respectively. For purposes of calculating the ratio of earnings to fixed charges, earnings consist of pretax earnings from continuing operations plus fixed charges (excluding capitalized interest). Fixed charges consist of interest costs, whether expensed or capitalized, the interest component of rental expense and amortization of debt issue costs, whether expensed or capitalized.

-35-
Off-Balance Sheet Arrangements We had letters of credit of $1.7 million outstanding and unused at March 27, 2010. The letters of credit are
maintained primarily to support payment or deposit obligations. We pay a commission of approximately 2% on the face amount of the letters of credit. Recently Adopted Accounting Standards
In September 2006, the FASB issued ASC Topic 820 (“ASC 820”, originally issued as SFAS No. 157,
“Fair Value Measurements”). ASC 820 defines fair value, establishes a framework for measuring fair value under generally accepted accounting principles, and expands disclosures about fair value measurements. This statement does not require any new fair value measurements, but applies under other accounting pronouncements that require or permit fair value measurements. Effective March 30, 2008, we adopted the provisions of ASC 820 related to financial assets and liabilities recognized or disclosed on a recurring basis. Additionally, on March 29, 2009, we began applying the principles of ASC 820 to non-financial assets and liabilities. Adoption of ASC 820 had no impact on the consolidated financial statements. See Note 8 in Part II, Item 8 for additional information.
In May 2008, the FASB issued ASC Topic 470-20 (originally issued as FASB Staff Position No. APB 14-
1, “Accounting for Convertible Debt Instruments That May Be Settled in Cash upon Conversion (Including Partial Cash Settlement)”) that changes the accounting treatment for convertible debt instruments that allow for either mandatory or optional cash settlements. ASC 470-20 requires us to recognize non-cash interest expense on our $110 million convertible senior notes based on the market rate for similar debt instruments without the conversion feature as of the date of debt issuance. ASC 470-20 was adopted on March 29, 2009 and was applied on a retrospective basis. As required, upon adoption on March 29, 2009, we retroactively recorded additional non-cash interest expense of approximately $3.1 million and $2.7 million for fiscal years 2009 and 2008, respectively. We also retroactively recorded an increase in shareholders’ equity of $16.4 million, net of deferred taxes, and a decrease in long-term debt of $27.6 million. See Note 2 in Part II, Item 8 for additional information.
In June 2008, the FASB updated ASC Topic 260 (originally issued as FSP No. EITF 03-6-1, “Determining
Whether Instruments Granted in Share-Based Payment Transactions Are Participating Securities”). The updated provisions of ASC 260 clarify that unvested share-based payment awards that contain nonforfeitable rights to dividends or dividend equivalents are participating securities and must be included in the computation of earnings per share pursuant to the two-class method. The updated provisions of ASC 260 were adopted on March 29, 2009 and applied on a retrospective basis as required. See Note 2 in Part II, Item 8 for additional information.
Recently Issued Accounting Standards
In January 2010, the Financial Accounting Standards Board (“FASB”) issued guidance which amends and
clarifies existing guidance related to fair value measurements and disclosures. This guidance requires new disclosures for (1) transfers in and out of Level 1 and Level 2 and reasons for such transfers; and (2) the separate presentation of purchases, sales, issuances and settlement in the Level 3 reconciliation. It also clarifies guidance around disaggregation and disclosures of inputs and valuation techniques for Level 2 and Level 3 fair value measurements. This guidance is effective for us for the first quarter of fiscal 2011, except for the new disclosures in the Level 3 reconciliation. The Level 3 disclosures are effective for the first quarter of fiscal 2012. We do not expect that this guidance will have a material impact on our consolidated financial statements.
In June 2009, the FASB issued guidance for the consolidation of variable interest entities (“VIE”). This guidance establishes a new criteria for determining the primary beneficiary. It also requires an ongoing assessment to determine whether a company is the primary beneficiary of a VIE. The guidance is effective beginning in fiscal 2011. We do not expect that this guidance will have a material impact on our consolidated financial statements.

-36-
Item 7A. Quantitative and Qualitative Disclosure About Market Risk
We are exposed to industry related price changes on several commodities, such as dairy, meat and produce that we buy and sell in both our Distribution and Retail segments. These products are purchased for and sold from inventory in the ordinary course of business. We are also exposed to other general commodity price changes such as utilities, insurance and fuel costs.
We are currently exposed to interest rate risk on our outstanding debt. The senior secured revolving credit
facility currently bears interest at the LIBOR plus 1.25% or the prime rate (weighted average interest rate of 3.33% at March 27, 2010 including the effects of the interest rate swap) on the revolving credit portion of the facility. The weighted average interest rates on outstanding debt including loan fee amortization for fiscal years 2010, 2009 and 2008 were 7.59%, 8.37% and 9.24%, respectively.
On January 2, 2009, Spartan Stores entered into an interest rate swap agreement. The interest rate swap is
considered to be a cash flow hedge of interest payments on $45.0 million of borrowings under our senior secured revolving credit facility by effectively converting a portion of the variable rate debt to a fixed rate basis. Under the terms of the agreement, we have agreed to pay the counterparty a fixed interest rate of 3.33% and the counterparty has agreed to pay Spartan Stores a floating interest rate based upon the 1-month LIBOR plus 1.25% (1.48% at March 27, 2010) on a notional amount of $45 million. The interest rate swap agreement expires concurrently with its senior secured revolving credit facility on December 24, 2012. As of March 27, 2010, the net unrealized loss on the interest rate swap agreement was $0.7 million. We do not use financial instruments or derivatives for any trading or other speculative purposes.
At March 27, 2010 and March 28, 2009, the estimated fair value of our long-term debt, including current
maturities, was lower than book value by approximately $18.2 million and a $35.5 million, respectively. The estimated fair values were based on market quotes for similar instruments.
The following table sets forth the principal cash flows of our debt outstanding and related weighted average
interest rates by year of maturity as of March 27, 2010: (In thousands, except rates)
March 27, 2010 Aggregate Payments by Fiscal Year Fair
Value
Total
2011 2012 2013 2014 2015 ThereafterFixed rate debt Principal payable $ 125,561 $ 140,275 $ 4,209 $ 4,396 $ 4,278 $ 3,459 $ 95,468 $ 28,465 Average interest rate 8.15% 8.16% 8.21% 8.16% 8.14% 8.15% 8.46%Variable rate debt Principal payable $ - $ - - - - Average interest rate 1.48%Interest rate swap $ (653) Variable to fixed $ 41,519 $ 45,000 $ 45,000 Average pay rate 3.33% 3.33% Average receive rate 1.48% 1.48%
-37-
Item 8. Financial Statements and Supplementary Data REPORT OF INDEPENDENT REGISTERED PUBLIC ACCOUNTING FIRM To the Board of Directors and Shareholders of Spartan Stores, Inc. and subsidiaries Grand Rapids, Michigan We have audited the accompanying consolidated balance sheets of Spartan Stores, Inc. and subsidiaries (the “Company”) as of March 27, 2010 and March 28, 2009, and the related consolidated statements of earnings, shareholders’ equity and cash flows for each of the three years in the period ended March 27, 2010. These consolidated financial statements are the responsibility of the Company’s management. Our responsibility is to express an opinion on these financial statements based on our audits. We conducted our audits in accordance with the standards of the Public Company Accounting Oversight Board (United States). Those standards require that we plan and perform the audit to obtain reasonable assurance about whether the financial statements are free of material misstatement. An audit includes examining, on a test basis, evidence supporting the amounts and disclosures in the financial statements. An audit also includes assessing the accounting principles used and significant estimates made by management, as well as evaluating the overall financial statement presentation. We believe that our audits provide a reasonable basis for our opinion. In our opinion, such consolidated financial statements present fairly, in all material respects, the financial position of Spartan Stores, Inc. and subsidiaries as of March 27, 2010 and March 28, 2009, and the results of their operations and their cash flows for each of the three years in the period ended March 27, 2010, in conformity with accounting principles generally accepted in the United States of America. We have also audited, in accordance with the standards of the Public Company Accounting Oversight Board (United States), the effectiveness of the Company’s internal control over financial reporting as of March 27, 2010, based on the criteria established in Internal Control–Integrated Framework issued by the Committee of Sponsoring Organizations of the Treadway Commission and our report dated May 13, 2010 expressed an unqualified opinion on the Company’s internal control over financial reporting. /s/ Deloitte & Touche LLP Grand Rapids, Michigan May 13, 2010
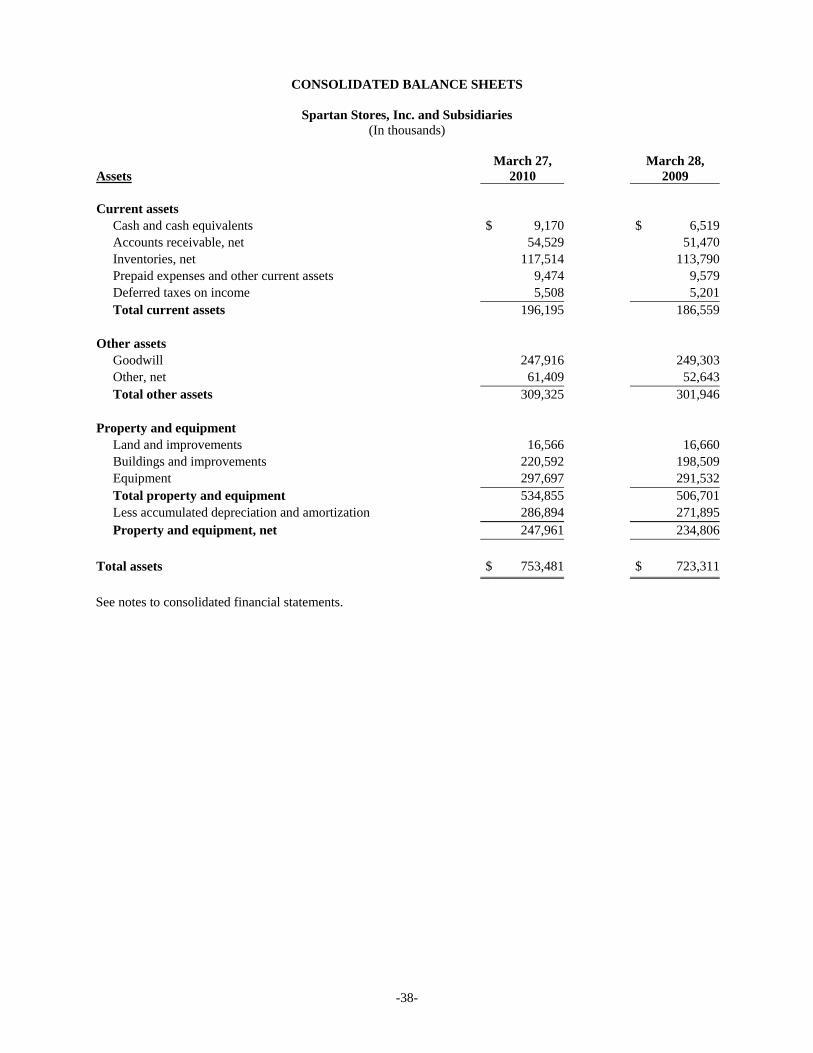
-38-
CONSOLIDATED BALANCE SHEETS
Spartan Stores, Inc. and Subsidiaries (In thousands)
Assets
March 27, 2010
March 28, 2009
Current assets Cash and cash equivalents $ 9,170 $ 6,519 Accounts receivable, net 54,529 51,470 Inventories, net 117,514 113,790 Prepaid expenses and other current assets 9,474 9,579 Deferred taxes on income 5,508 5,201 Total current assets 196,195 186,559 Other assets Goodwill 247,916 249,303 Other, net 61,409 52,643 Total other assets 309,325 301,946 Property and equipment Land and improvements 16,566 16,660 Buildings and improvements 220,592 198,509 Equipment 297,697 291,532 Total property and equipment 534,855 506,701 Less accumulated depreciation and amortization 286,894 271,895 Property and equipment, net 247,961 234,806
Total assets $ 753,481 $ 723,311
See notes to consolidated financial statements.

-39-
CONSOLIDATED BALANCE SHEETS (continued)
Spartan Stores, Inc. and Subsidiaries (In thousands)
Liabilities and Shareholders’ Equity
March 27, 2010
March 28,2009
Current liabilities Accounts payable $ 114,549 $ 97,248 Accrued payroll and benefits 31,983 35,456 Other accrued expenses 20,838 19,195 Current portion of restructuring costs 8,877 9,759 Current maturities of long-term debt and capital lease obligations 4,209 3,932 Total current liabilities 180,456 165,590 Long-term liabilities Deferred income taxes 49,996 35,338 Postretirement benefits 21,060 25,401 Other long-term liabilities 19,937 20,876 Restructuring costs 27,061 34,786 Long-term debt and capital lease obligations 181,066 194,115 Total long-term liabilities 299,120 310,516 Commitments and contingencies (Note 9) Shareholders’ equity Common stock, voting, no par value; 50,000 shares authorized; 22,450 and 22,213 shares outstanding 158,225
153,778
Preferred stock, no par value, 10,000 shares authorized; no shares outstanding -
-
Accumulated other comprehensive loss (12,973) (14,151) Retained earnings 128,653 107,578 Total shareholders’ equity 273,905 247,205 Total liabilities and shareholders’ equity $ 753,481 $ 723,311 See notes to consolidated financial statements.

-40-
CONSOLIDATED STATEMENTS OF EARNINGS
Spartan Stores, Inc. and Subsidiaries (In thousands, except per share data)
Year Ended
March 27,
2010 March 28,
2009 March 29,
2008 Net sales $ 2,551,956 $ 2,576,738 $ 2,476,822Cost of sales 1,993,306 2,040,625 1,981,854Gross margin 558,650 536,113 494,968 Operating expenses Selling, general and administrative 493,832 463,369 433,346 Restructuring and asset impairment costs 6,154 - -Total operating expenses 499,986 463,369 433,346 Operating earnings 58,664 72,744 61,622 Other income and expenses Interest expense 16,394 14,138 13,842 Other, net (138) (341) (287)Total other income and expenses 16,256 13,797 13,555 Earnings before income taxes and discontinued operations 42,408 58,947 48,067 Income taxes 16,475 23,914 17,216Earnings from continuing operations 25,933 35,033 30,851Earnings (loss) from discontinued operations, net of
taxes (375) 1,838 1,795Net earnings $ 25,558 $ 36,871 $ 32,646
Basic earnings per share: Earnings from continuing operations $ 1.16 $ 1.59 $ 1.41Earnings (loss) from discontinued operations (0.02) 0.08 0.08Net earnings $ 1.14 $ 1.67 $ 1.49 Diluted earnings per share: Earnings from continuing operations $ 1.15 $ 1.57 $ 1.40Earnings (loss) from discontinued operations (0.01)* 0.09* 0.08Net earnings $ 1.14 $ 1.66 $ 1.48
Weighted average shares outstanding: Basic 22,406 22,102 21,847
Diluted 22,480 22,262 22,058
*Includes rounding. See notes to consolidated financial statements.

-41-
CONSOLIDATED STATEMENTS OF SHAREHOLDERS’ EQUITY
Spartan Stores, Inc. and Subsidiaries (In thousands)
Shares Outstanding
CommonStock
AccumulatedOther
ComprehensiveIncome (Loss)
Retained Earnings
Total Balance – April 1, 2007 21,658 $ 126,447 $ 126 $ 46,168 $ 172,741
Adjustment to initially apply updated
accounting guidance for taxes - - - 967 967
Adjustment to initially apply updated accounting guidance for convertible debt, net of taxes of $10,379 16,420 16,420
Comprehensive income, net of tax: Net earnings - - - 32,646 32,646
Pension liability adjustment, net of taxes
of $770 - - (1,268) - (1,268) Total comprehensive income - - - - 31,378 Dividends - $.20 per share - - - (4,371 ) (4,371) Stock-based employee compensation - 3,018 - - 3,018
Issuances of common stock and related tax benefit on stock option exercises 118 1,573 - - 1,573
Issuances of restricted stock and related income tax benefits 178 783 - - 783
Cancellations of restricted stock (45) (1,103) - - (1,103) Balance – March 29, 2008 21,909 147,138 (1,142) 75,410 221,406
Effects of changing the pension plans’ measurement date pursuant updated
guidance in for pensions, net of taxes - - (55) (275 ) (330
)
Comprehensive income, net of tax: Net earnings - - - 36,871 36,871
Pension liability adjustment, net of taxes
of $8,029 - - (12,671) - (12,671)
Change in fair value of interest rate swap, net of taxes of $179 - - (283) - (283)
Total comprehensive income - - - - 23,917 Dividends - $.20 per share - - - (4,428 ) (4,428) Stock-based employee compensation - 4,879 - - 4,879
Issuances of common stock and related tax benefit on stock option exercises 158 2,034 - - 2,034
Issuances of restricted stock and related income tax benefits 232 777 - - 777
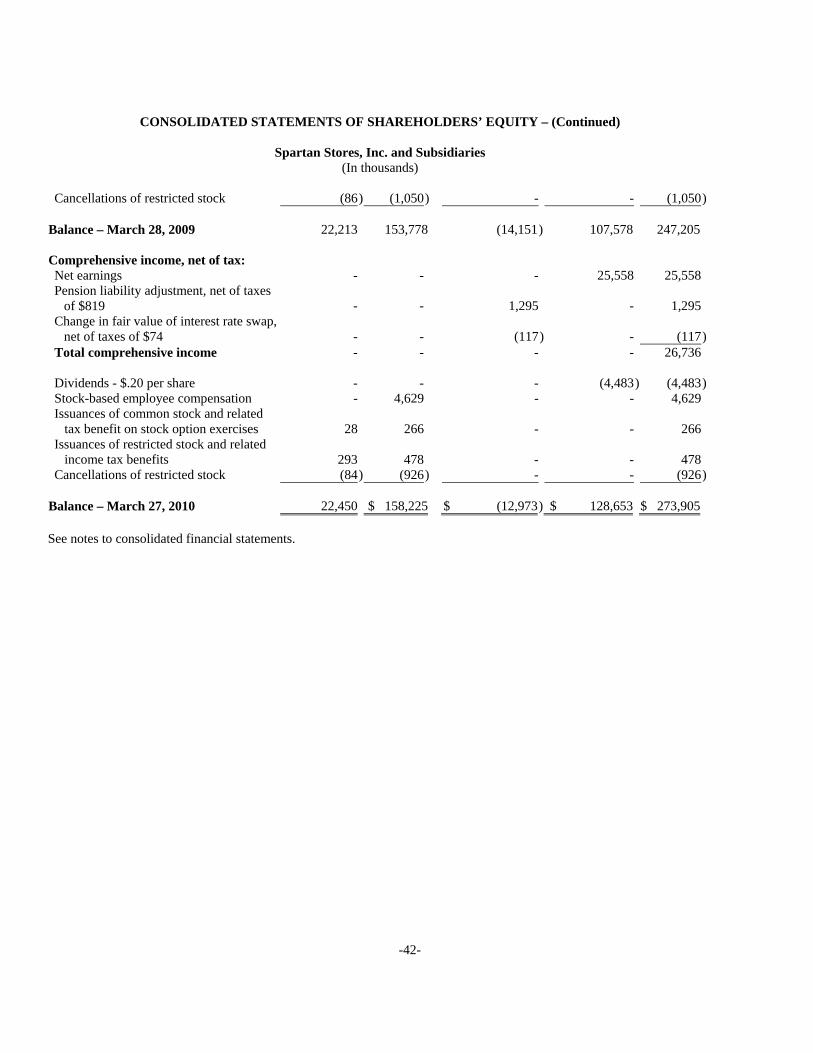
-42-
CONSOLIDATED STATEMENTS OF SHAREHOLDERS’ EQUITY – (Continued)
Spartan Stores, Inc. and Subsidiaries (In thousands)
Cancellations of restricted stock (86) (1,050) - - (1,050) Balance – March 28, 2009 22,213 153,778 (14,151) 107,578 247,205 Comprehensive income, net of tax: Net earnings - - - 25,558 25,558
Pension liability adjustment, net of taxes
of $819 - - 1,295 - 1,295
Change in fair value of interest rate swap,
net of taxes of $74 - - (117) - (117) Total comprehensive income - - - - 26,736 Dividends - $.20 per share - - - (4,483 ) (4,483) Stock-based employee compensation - 4,629 - - 4,629
Issuances of common stock and related tax benefit on stock option exercises 28 266 - - 266
Issuances of restricted stock and related income tax benefits 293 478 - - 478
Cancellations of restricted stock (84) (926) - - (926) Balance – March 27, 2010 22,450 $ 158,225 $ (12,973 ) $ 128,653 $ 273,905 See notes to consolidated financial statements.

-43-
CONSOLIDATED STATEMENTS OF CASH FLOWS
Spartan Stores, Inc. and Subsidiaries (In thousands)
Year Ended
March 27,
2010 March 28,
2009 March 29,
2008 Cash flows from operating activities Net earnings $ 25,558 $ 36,871 $ 32,646 Loss (earnings) from discontinued operations 375 (1,838) (1,795) Earnings from continuing operations 25,933 35,033 30,851 Adjustments to reconcile net earnings to net cash provided by operating activities: Non-cash restructuring and asset impairment costs 5,654 - - Non-cash convertible debt interest 3,533 3,261 2,789 Depreciation and amortization 34,895 28,798 24,341 Postretirement benefits expense 3,373 1,559 2,195 Deferred taxes on income 12,030 16,927 17,178 Stock-based compensation expense 4,627 4,878 3,013 Excess tax benefit on stock compensation (344) (2,099) - Loss on disposal of assets 138 105 15 Change in operating assets and liabilities: Accounts receivable (2,487) 3,294 (16,866) Inventories (3,702) 4,130 (117) Prepaid expenses and other assets 1,181 (1,190) (4,376) Accounts payable 18,095 (3,296) 13,917 Accrued payroll and benefits (3,436) 481 1,603 Postretirement benefits payments (6,032) (4,279) (7,339) Other accrued expenses and other liabilities (1,756) (6,680) 573 Net cash provided by operating activities 91,702 80,922 67,777 Cash flows from investing activities Purchases of property and equipment (50,472) (57,249) (40,076) Net proceeds from the sale of assets 77 422 58 Acquisitions, net of cash acquired (6,375) (103,386) (49,145) Proceeds from business divestitures - 414 1,266 Other (1,258) 63 (49) Net cash used in investing activities (58,028) (159,736) (87,946)

-44-
CONSOLIDATED STATEMENTS OF CASH FLOWS – (Continued) Spartan Stores, Inc. and Subsidiaries
(In thousands)
Year Ended
March 27,
2010 March 28,
2009 March 29,
2008 Cash flows from financing activities Proceeds from revolving credit facility $ 504,690 $ 225,122 $ 575,531 Payments on revolving credit facility (524,630) (160,182) (652,350) Proceeds from long-term borrowings - - 110,000 Repayment of long-term borrowings (4,007) (11,437) (3,830) Financing fees paid - - (3,775) Excess tax benefit on stock compensation 344 2,099 - Proceeds from exercise of stock options 190 1,380 735 Dividends paid (4,483) (4,428) (4,371) Net cash (used in) provided by financing activities (27,896) 52,554 21,940 Cash flows from discontinued operations Net cash (used in) provided by operating activities (3,145) (885) 3,287 Net cash provided by investing activities 18 13,797 2,746 Net cash (used in) provided by discontinued operations (3,127) 12,912 6,033 Net increase (decrease) in cash and cash equivalents 2,651 (13,348) 7,804 Cash and cash equivalents at beginning of year 6,519 19,867 12,063 Cash and cash equivalents at end of year $ 9,170 $ 6,519 $ 19,867
Supplemental Cash Flow Information: Cash paid for interest $ 11,896 $ 9,965 $ 9,765 Cash paid for income taxes $ 884 $ 6,610 $ 2,100
See notes to consolidated financial statements.

SPARTAN STORES, INC. AND SUBSIDIARIES NOTES TO CONSOLIDATED FINANCIAL STATEMENTS
-45-
Note 1 Summary of Significant Accounting Policies and Basis of Presentation Principles of Consolidation: The consolidated financial statements include the accounts of Spartan Stores, Inc. and its subsidiaries (“Spartan Stores”). All significant intercompany accounts and transactions have been eliminated. Use of Estimates: The preparation of financial statements in conformity with accounting principles generally accepted in the United States of America requires management to make estimates and assumptions that affect amounts reported therein. Due to the inherent uncertainty involved in making estimates, actual results reported in future periods might differ from those estimates. Fiscal Year: Spartan Stores’ fiscal year ends on the last Saturday of March. The fiscal years ended March 27, 2010, March 28, 2009 and March 29, 2008 consisted of 52 weeks. Revenue Recognition: The Retail segment recognizes revenues from the sale of products at the point of sale. Customer returns are immaterial. Discounts provided to customers by Spartan Stores at the time of sale are recognized as a reduction in sales as the products are sold. Spartan Stores does not recognize a sale when it sells gift cards and gift certificates, rather, a sale is recognized when the gift card or gift certificate is redeemed to purchase product. The Distribution segment recognizes revenues when products are delivered or ancillary services are provided. Sales and excise taxes are excluded from revenue. Cost of Sales: Cost of sales includes purchase costs, freight, physical inventory adjustments, markdowns and promotional allowances. Vendor allowances that relate to our buying and merchandising activities consist primarily of promotional allowances, which are generally allowances on purchased quantities and, to a lesser extent, slotting allowances, which are billed to vendors for our merchandising costs such as setting up warehouse infrastructure. Vendor allowances are recognized as a reduction in cost of sales when the related product is sold. Lump sum payments received for multi-year contracts are amortized over the life of the contracts based on contractual terms. Cash and Cash Equivalents: Cash and cash equivalents consist of cash and highly liquid investments with an original maturity of three months or less at the date of purchase. Accounts Receivable: Accounts receivable are shown net of allowances for credit losses of $2.3 million in fiscal 2010 and $1.8 million in fiscal 2009. Spartan Stores evaluates the adequacy of its allowances by analyzing the aging of receivables, customer financial condition, historical collection experience, the value of collateral and other economic and industry factors. Operating results include bad debt expense of $1.3 million, $0.8 million, and $0.1 million for fiscal years 2010, 2009 and 2008, respectively. Inventory Valuation: Inventories are stated at the lower of cost or market using the last-in, first-out (“LIFO”) method. If replacement cost had been used, inventories would have been $46.6 million and $46.8 million higher at March 27, 2010 and March 28, 2009, respectively. During fiscal years 2010, 2009 and 2008, certain inventory quantities were reduced. The reductions resulted in liquidation of LIFO inventory carried at lower costs prevailing in prior years, the effect of which decreased the LIFO provision in fiscal years 2010, 2009 and 2008 by $0.4 million, $2.9 million and $1.3 million, respectively. Spartan Stores utilizes the retail inventory method to value inventory for the Retail segment. Under the retail inventory method, inventory is stated at cost with cost of sales and gross margin calculated by applying a cost ratio to the retail value of inventories. Long-Lived Assets Other than Goodwill: Spartan Stores reviews and evaluates long-lived assets for impairment when events or circumstances indicate that the carrying amount of an asset may not be recoverable. When the undiscounted future cash flows are not sufficient to recover an asset’s carrying amount, the fair value is compared to the carrying value to determine the impairment loss to be recorded. Long-lived assets to be disposed of are reported at the lower of carrying amount or fair value, less the cost to sell. Fair values are determined by independent appraisals or expected sales prices based upon market participant data developed by internal licensed real estate professionals. Estimates of future cash flows and expected sales prices are judgments based upon Spartan Stores’

SPARTAN STORES, INC. AND SUBSIDIARIES NOTES TO CONSOLIDATED FINANCIAL STATEMENTS
-46-
experience and knowledge of operations. These estimates project cash flows several years into the future and are affected by changes in the economy, real estate market conditions and inflation. Goodwill: Goodwill represents the excess purchase price over the fair value of tangible net assets acquired in business combinations after amounts have been allocated to intangible assets. Goodwill is not amortized, but is reviewed for impairment during the fourth quarter of each year, or whenever events occur or circumstances change that would more likely than not reduce the fair value of a reporting unit below its carrying amount, using a discounted cash flow model and comparable market values of each reporting segment. Other Assets: Included in Other assets are intangible assets and debt issuance costs. Intangible assets primarily consist of trade name, favorable lease agreements, prescription lists, non-compete agreements, liquor licenses and franchise fees. Favorable leases are amortized on a straight-line basis over the related lease terms. Prescription lists are amortized on a straight-line basis over the period of expected benefit. Non-compete agreements are amortized on a straight-line basis over the length of the agreements. Franchise fees are amortized on a straight-line basis over the term of the franchise agreement. Debt issuance costs are amortized over the term of the related financing agreement. The trade name and liquor licenses are not amortized as they have indefinite lives. Property and Equipment: Property and equipment are recorded at cost and depreciated over the shorter of the estimated useful lives or lease periods of the assets. Expenditures for normal repairs and maintenance are charged to operations as incurred. Depreciation is computed using the straight-line method as follows:
Land improvements 15 years Buildings and improvements 15 to 40 years Equipment 3 to 15 years
Losses on the disposal of property and equipment totaled $0.1 million in fiscal years 2010, 2009 and 2008. Gains and losses on the disposal of property and equipment is included in “Selling, general and administrative expenses” and “Other, net” in the Consolidated Statements of Earnings. Insurance Reserves: Spartan Stores is primarily self-insured for workers’ compensation and general liability costs. Losses are recorded when reported and consist of individual case estimates. Incurred but not reported losses are actuarially estimated based on available historical information. Also included is a provision for losses related to reinsurance policies that insure the run-off of retained risk associated with the discontinued Insurance segment. We have purchased stop-loss coverage to limit our exposure to any significant exposure on a per claim basis. Our exposure for workers’ compensation and general liability is $0.5 million per claim. A summary of changes in Spartan Stores’ self-insurance liability is as follows: (In thousands) March 27, 2010 March 28, 2009 March 29, 2008 Beginning balance $ 3,848 $ 6,979 $ 8,082 Expense 2,762 2,214 2,187 Claim payments (2,561 ) (5,345 ) (3,290 ) Ending balance 4,049 3,848 6,979
The current portion of the self-insurance liability is included in “Other accrued expenses” and the long-term portion is included in “Other long-term liabilities” in the Consolidated Balance Sheets. Income Taxes: Deferred income tax assets and liabilities are computed for differences between the financial statement and tax bases of assets and liabilities that will result in taxable or deductible amounts in the future. Such deferred income tax asset and liability computations are based on enacted tax laws and rates applicable to periods in which the differences are expected to affect taxable income. Valuation allowances are established when necessary to reduce deferred tax assets to the amounts expected to be realized. Income tax expense is the tax payable or refundable for the period plus or minus the change during the period in deferred tax assets and liabilities.

SPARTAN STORES, INC. AND SUBSIDIARIES NOTES TO CONSOLIDATED FINANCIAL STATEMENTS
-47-
On March 30, 2008, Spartan Stores adopted new accounting guidance on the accounting for uncertainty in income taxes. This accounting guidance prescribes a recognition threshold and measurement attribute for the financial statement recognition and measurement of tax positions taken or expected to be taken in tax returns. For benefits to be recognized, a tax position must be more likely than not to be sustained upon examination. The amount recognized is measured as the largest amount of benefit that is more likely than not of being realized upon settlement. The adoption of this new accounting guidance increased retained earnings by approximately $1.0 million as of the beginning of fiscal year 2008. Earnings per share: Basic earnings per share (“EPS”) excludes dilution and is computed by dividing net earnings by the weighted average number of common shares outstanding for the period. Diluted EPS is computed by increasing the weighted average number of common shares outstanding by the dilutive effect of the issuance of common stock for options outstanding under Spartan Stores’ stock incentive plans. Unvested restricted stock awards contain nonforfeitable rights to dividends and, therefore, are considered participating securities and included in the computation of basic earnings per share pursuant to the two-class method. The following table sets forth the computation of basic and diluted earnings per share for continuing operations: (In thousands, except per share amounts) March 27,
2010 March 28,
2009 March 29,
2008
Numerator: Earnings from continuing operations $ 25,933 $ 35,033 $ 30,851 Denominator: Weighted average shares outstanding – basic 22,406 22,102 21,847 Effect of dilutive stock options 74 160 211 Weighted average shares outstanding – diluted 22,480 22,262 22,058 Basic earnings per share from continuing operations $ 1.16 $ 1.59 $ 1.41 Diluted earnings per share from continuing operations $ 1.15 $ 1.57 $ 1.40 Weighted average shares issuable upon the exercise of stock options that were not included in the earnings per share calculations because they were antidilutive were 571,008 in fiscal 2010, 307,014 in fiscal 2009, and 84,824 in fiscal 2008. Restricted stock units granted in fiscal 2010 are only issuable if certain performance criteria are met, making these shares contingently issuable under ASC Topic 260. Therefore, the restricted stock units are included in diluted earnings per share at the expected payout percentage based on performance criteria results as of the end of the respective reporting period. Accordingly, the impact of 79,983 restricted stock units for fiscal 2010 were excluded from the computation of diluted shares as the performance criteria was not met. The senior subordinated convertible notes due 2027 will be convertible at the option of the holder, only upon the occurrence of certain events, at an initial conversion rate of 28.0310 shares of Spartan Stores common stock per $1,000 principal amount at maturity of the notes (equal to an initial conversion price of approximately $35.67 per share). Upon conversion, Spartan Stores will pay the holder the conversion value in cash up to the accreted principal amount of the note and the excess conversion value, if any, in shares of Spartan Stores common stock – unless Spartan Stores elects to satisfy its obligation under such conversion by delivering only shares of common stock. Therefore, the notes are not currently dilutive to earnings per share as they are only dilutive above the accreted value. (See Note 6.) Stock-Based Compensation: All share-based payments to employees are recognized in the financial statements as compensation cost based on the fair value on the date of grant. Spartan Stores determines the fair value of stock option awards using the Black-Scholes option-pricing model. The grant date closing price per share of Spartan Stores stock is used to estimate the fair value of restricted stock awards and restricted stock units. The value of the portion of awards expected to vest is recognized as expense over the requisite service period. Shareholders’ Equity: Spartan Stores’ restated articles of incorporation provide that the board of directors may at any time, and from time to time, provide for the issuance of up to 10 million shares of preferred stock in one or more
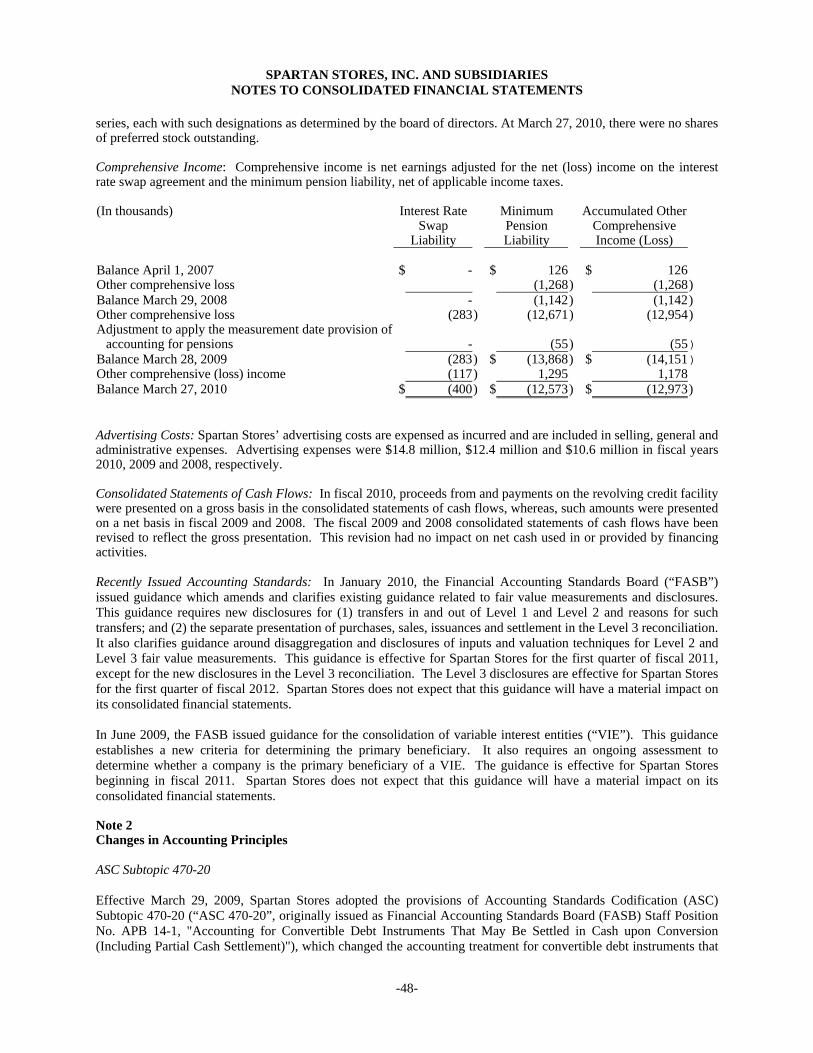
SPARTAN STORES, INC. AND SUBSIDIARIES NOTES TO CONSOLIDATED FINANCIAL STATEMENTS
-48-
series, each with such designations as determined by the board of directors. At March 27, 2010, there were no shares of preferred stock outstanding. Comprehensive Income: Comprehensive income is net earnings adjusted for the net (loss) income on the interest rate swap agreement and the minimum pension liability, net of applicable income taxes. (In thousands) Interest Rate
Swap Liability
Minimum Pension Liability
Accumulated Other Comprehensive Income (Loss)
Balance April 1, 2007 $ - $ 126 $ 126 Other comprehensive loss (1,268) (1,268) Balance March 29, 2008 - (1,142) (1,142) Other comprehensive loss (283) (12,671) (12,954) Adjustment to apply the measurement date provision of
accounting for pensions - (55) (55) Balance March 28, 2009 (283) $ (13,868) $ (14,151) Other comprehensive (loss) income (117) 1,295 1,178 Balance March 27, 2010 $ (400) $ (12,573) $ (12,973) Advertising Costs: Spartan Stores’ advertising costs are expensed as incurred and are included in selling, general and administrative expenses. Advertising expenses were $14.8 million, $12.4 million and $10.6 million in fiscal years 2010, 2009 and 2008, respectively. Consolidated Statements of Cash Flows: In fiscal 2010, proceeds from and payments on the revolving credit facility were presented on a gross basis in the consolidated statements of cash flows, whereas, such amounts were presented on a net basis in fiscal 2009 and 2008. The fiscal 2009 and 2008 consolidated statements of cash flows have been revised to reflect the gross presentation. This revision had no impact on net cash used in or provided by financing activities. Recently Issued Accounting Standards: In January 2010, the Financial Accounting Standards Board (“FASB”) issued guidance which amends and clarifies existing guidance related to fair value measurements and disclosures. This guidance requires new disclosures for (1) transfers in and out of Level 1 and Level 2 and reasons for such transfers; and (2) the separate presentation of purchases, sales, issuances and settlement in the Level 3 reconciliation. It also clarifies guidance around disaggregation and disclosures of inputs and valuation techniques for Level 2 and Level 3 fair value measurements. This guidance is effective for Spartan Stores for the first quarter of fiscal 2011, except for the new disclosures in the Level 3 reconciliation. The Level 3 disclosures are effective for Spartan Stores for the first quarter of fiscal 2012. Spartan Stores does not expect that this guidance will have a material impact on its consolidated financial statements. In June 2009, the FASB issued guidance for the consolidation of variable interest entities (“VIE”). This guidance establishes a new criteria for determining the primary beneficiary. It also requires an ongoing assessment to determine whether a company is the primary beneficiary of a VIE. The guidance is effective for Spartan Stores beginning in fiscal 2011. Spartan Stores does not expect that this guidance will have a material impact on its consolidated financial statements. Note 2 Changes in Accounting Principles ASC Subtopic 470-20 Effective March 29, 2009, Spartan Stores adopted the provisions of Accounting Standards Codification (ASC) Subtopic 470-20 (“ASC 470-20”, originally issued as Financial Accounting Standards Board (FASB) Staff Position No. APB 14-1, "Accounting for Convertible Debt Instruments That May Be Settled in Cash upon Conversion (Including Partial Cash Settlement)"), which changed the accounting treatment for convertible debt instruments that

SPARTAN STORES, INC. AND SUBSIDIARIES NOTES TO CONSOLIDATED FINANCIAL STATEMENTS
-49-
allow for either mandatory or optional cash settlements. Spartan Stores is required to recognize non-cash interest expense on its $110 million convertible senior notes based on the market rate for similar debt instruments without the conversion feature. Convertible debt instruments are separated into their debt and equity components. The value assigned to the debt component is the estimated fair value, as of the issuance date, of a similar debt instrument without the conversion feature, and the difference between the proceeds from the issuance and the amount reflected as a debt liability is assigned to equity. As a result, the debt is effectively recorded at a discount reflecting its below market coupon interest rate. The debt is subsequently accreted to its par value over its expected life, with the rate of interest that reflects the market rate at issuance being reflected in the consolidated statements of earnings. Additionally, transaction costs incurred with third parties shall be allocated to and accounted for as debt issuance costs and equity issuance costs in proportion to the allocation of proceeds between the liability and equity component, respectively. Retrospective application to all periods presented is required.

SPARTAN STORES, INC. AND SUBSIDIARIES NOTES TO CONSOLIDATED FINANCIAL STATEMENTS
-50-
The following table sets forth the retrospective accounting impacts of the adoption of ASC 470-20 on the Consolidated Statement of Earnings for fiscal years 2009 and 2008. (In thousands, except per share amounts) Year Ended March 28, 2009 As Reported Adjustment As Adjusted Consolidated Statement of Earnings: Interest expense $ 10,998 $ 3,140 $ 14,138 Income taxes 25,130 (1,216) 23,914 Earnings from continuing operations 36,957 (1,924) 35,033 Net earnings 38,795 (1,924) 36,871 Basic earnings per share: Earnings from continuing operations 1.67(1) (0.08) 1.59 Net earnings 1.76(1) (0.09) 1.67 Diluted earnings per share: Earnings from continuing operations 1.66(1) (0.09) 1.57 Net earnings 1.74(1) (0.08) 1.66 Year Ended March 29, 2008
As Reported Adjustment As Adjusted
Interest expense $ 11,133 $ 2,709 $ 13,842 Income taxes 18,265 (1,049) 17,216 Earnings from continuing operations 32,511 (1,660) 30,851 Net earnings 34,306 (1,660) 32,646 Basic earnings per share: Earnings from continuing operations 1.49(1) (0.08) 1.41 Net earnings 1.57(1) (0.08) 1.49 Diluted earnings per share: Earnings from continuing operations 1.47(1) (0.07) 1.40 Net earnings 1.56(1) (0.08) 1.48 (1) Amounts are after giving effect to the adoption of ASC 260 (see below) (In thousands) March 28, 2009 As Reported Adjustment As Adjusted
Consolidated Balance Sheet Other, net $ 53,264 $ (621) $ 52,643 Deferred income taxes 27,224 8,114 35,338 Long-term debt 215,686 (21,571) 194,115 Common stock 137,358 16,420 153,778 Retained earnings 111,162 (3,584) 107,578 Total shareholders’ equity 234,369 12,836 247,205

SPARTAN STORES, INC. AND SUBSIDIARIES NOTES TO CONSOLIDATED FINANCIAL STATEMENTS
-51-
ASC Topic 260 Effective March 29, 2009, Spartan Stores adopted the updated provisions of ASC Topic 260 ( originally issued as FSP No. EITF 03-6-1, "Determining Whether Instruments Granted in Share-Based Payment Transactions Are Participating Securities"). The updated provisions of ASC 260 clarify that unvested share-based payment awards that contain nonforfeitable rights to dividends or dividend equivalents are participating securities and must be included in the computation of basic earnings per share pursuant to the two-class method. The updated provisions of ASC 260 must be applied on a retrospective basis. Historically, Spartan Stores’ unvested restricted shares have been included in the calculation of diluted earnings per share under the treasury stock method. These shares are now included in the computation of basic earnings per share. For fiscal 2009, basic earnings per share from continuing operations and net earnings and diluted earnings per share from continuing operations and net earnings were reduced by $0.04. For fiscal 2008, basic earnings per share from continuing operations and net earnings were reduced by $0.04 and diluted earnings per share from continuing operations and net earnings were reduced by $0.03 and $0.02, respectively. The following table sets forth the computation of basic and diluted earnings per share for continuing operations and net earnings: (In thousands, except per share amounts)
2009 As Reported Adjustment As AdjustedNumerator: Earnings from continuing operations (1) $ 36,957 $ (1,924) $ 35,033 Denominator: Weighted average shares outstanding -
basic
21,516 586 22,102Effect of dilutive options and restricted shares outstanding
286
(126) 160
Weighted average shares outstanding - diluted 21,802 460 22,262
Basic earnings per share:
Earnings from continuing operations $ 1.71 $ (0.12) $ 1.59Net earnings 1.80 (0.13) 1.67
Diluted earnings per share:
Earnings from continuing operations $ 1.70 $ (0.13) $ 1.57Net earnings 1.78 (0.12) 1.66
(1) Retrospective application of ASC 470-20 resulted in the recognition of additional non-cash interest expense for fiscal 2009. See above.

SPARTAN STORES, INC. AND SUBSIDIARIES NOTES TO CONSOLIDATED FINANCIAL STATEMENTS
-52-
(In thousands, except per share amounts)
2008 As Reported Adjustment As AdjustedNumerator: Earnings from continuing operations (1) $ 32,511 $ (1,660) $ 30,851 Denominator: Weighted average shares outstanding –
basic
21,275 572 21,847Effect of dilutive options and restricted shares outstanding
393
(182) 211
Weighted average shares outstanding – diluted 21,668 390 22,058
Basic earnings per share:
Earnings from continuing operations $ 1.53 $ (0.12) $ 1.41Net earnings 1.61 (0.12) 1.49
Diluted earnings per share:
Earnings from continuing operations $ 1.50 $ (0.10) $ 1.40Net earnings 1.58 (0.10) 1.48
(1) Retrospective application of ASC 470-20 resulted in the recognition of additional non-cash interest expense for fiscal 2008. See above. Note 3 Acquisitions of Assets VG’s Food Center, Inc. On December 29, 2008, Spartan Stores acquired certain assets and assumed certain liabilities related to VG’s Food Center, Inc. and VG’s Pharmacy, Inc. (collectively, “VG’s”). The results of operations of the VG’s acquisition are included in the accompanying consolidated financial statements from the date of acquisition. VG’s was a privately-held operator of 17 retail grocery stores based in Eastern Michigan. Prior to the acquisition, VG’s was a customer of Spartan Stores’ Distribution segment. The cash purchase price paid to VG’s was $85.0 million plus $16.7 million for inventories and cash acquired. Spartan Stores acquired the store locations and operations of VG’s in an effort to establish its retail presence in Eastern Michigan. The purchased assets included inventories, prescription files, trade names, land, leasehold improvements, equipment and licenses. Spartan Stores assumed VG’s lease obligations for the 17 stores.
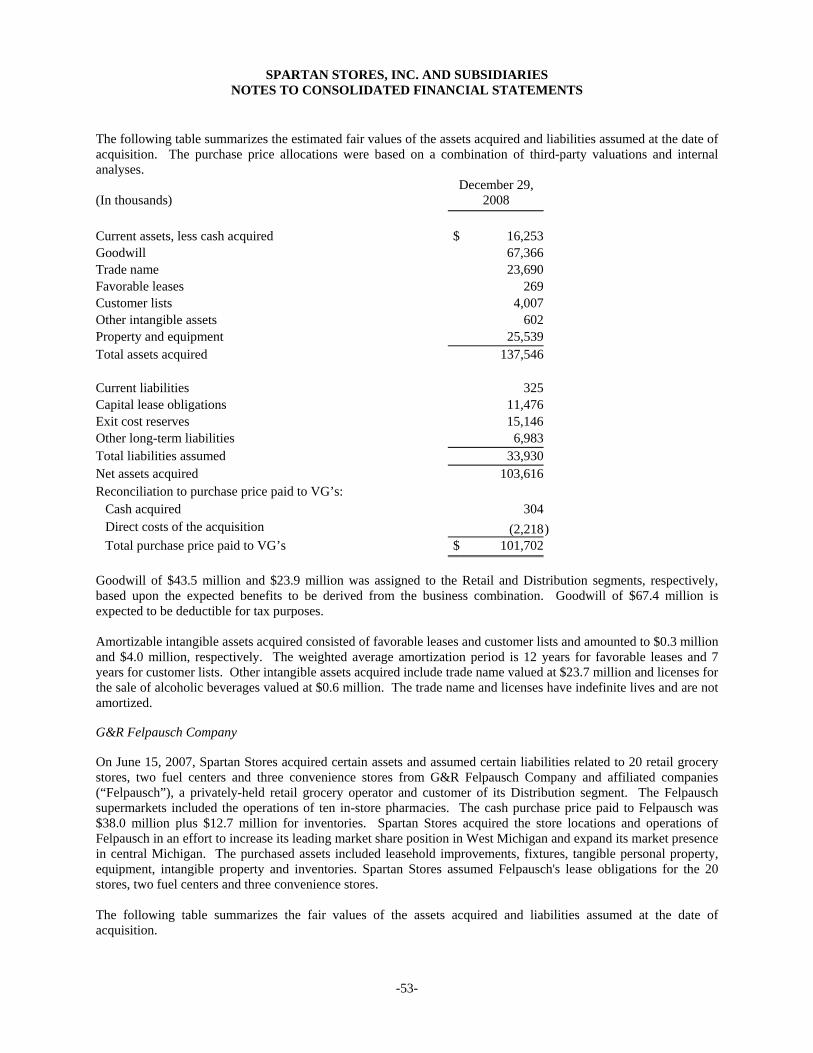
SPARTAN STORES, INC. AND SUBSIDIARIES NOTES TO CONSOLIDATED FINANCIAL STATEMENTS
-53-
The following table summarizes the estimated fair values of the assets acquired and liabilities assumed at the date of acquisition. The purchase price allocations were based on a combination of third-party valuations and internal analyses. (In thousands)
December 29,2008
Current assets, less cash acquired $ 16,253Goodwill 67,366Trade name 23,690Favorable leases 269Customer lists 4,007Other intangible assets 602Property and equipment 25,539Total assets acquired 137,546 Current liabilities 325Capital lease obligations 11,476Exit cost reserves 15,146Other long-term liabilities 6,983Total liabilities assumed 33,930Net assets acquired 103,616Reconciliation to purchase price paid to VG’s:
Cash acquired 304Direct costs of the acquisition (2,218) Total purchase price paid to VG’s $ 101,702
Goodwill of $43.5 million and $23.9 million was assigned to the Retail and Distribution segments, respectively, based upon the expected benefits to be derived from the business combination. Goodwill of $67.4 million is expected to be deductible for tax purposes. Amortizable intangible assets acquired consisted of favorable leases and customer lists and amounted to $0.3 million and $4.0 million, respectively. The weighted average amortization period is 12 years for favorable leases and 7 years for customer lists. Other intangible assets acquired include trade name valued at $23.7 million and licenses for the sale of alcoholic beverages valued at $0.6 million. The trade name and licenses have indefinite lives and are not amortized. G&R Felpausch Company On June 15, 2007, Spartan Stores acquired certain assets and assumed certain liabilities related to 20 retail grocery stores, two fuel centers and three convenience stores from G&R Felpausch Company and affiliated companies (“Felpausch”), a privately-held retail grocery operator and customer of its Distribution segment. The Felpausch supermarkets included the operations of ten in-store pharmacies. The cash purchase price paid to Felpausch was $38.0 million plus $12.7 million for inventories. Spartan Stores acquired the store locations and operations of Felpausch in an effort to increase its leading market share position in West Michigan and expand its market presence in central Michigan. The purchased assets included leasehold improvements, fixtures, tangible personal property, equipment, intangible property and inventories. Spartan Stores assumed Felpausch's lease obligations for the 20 stores, two fuel centers and three convenience stores. The following table summarizes the fair values of the assets acquired and liabilities assumed at the date of acquisition.
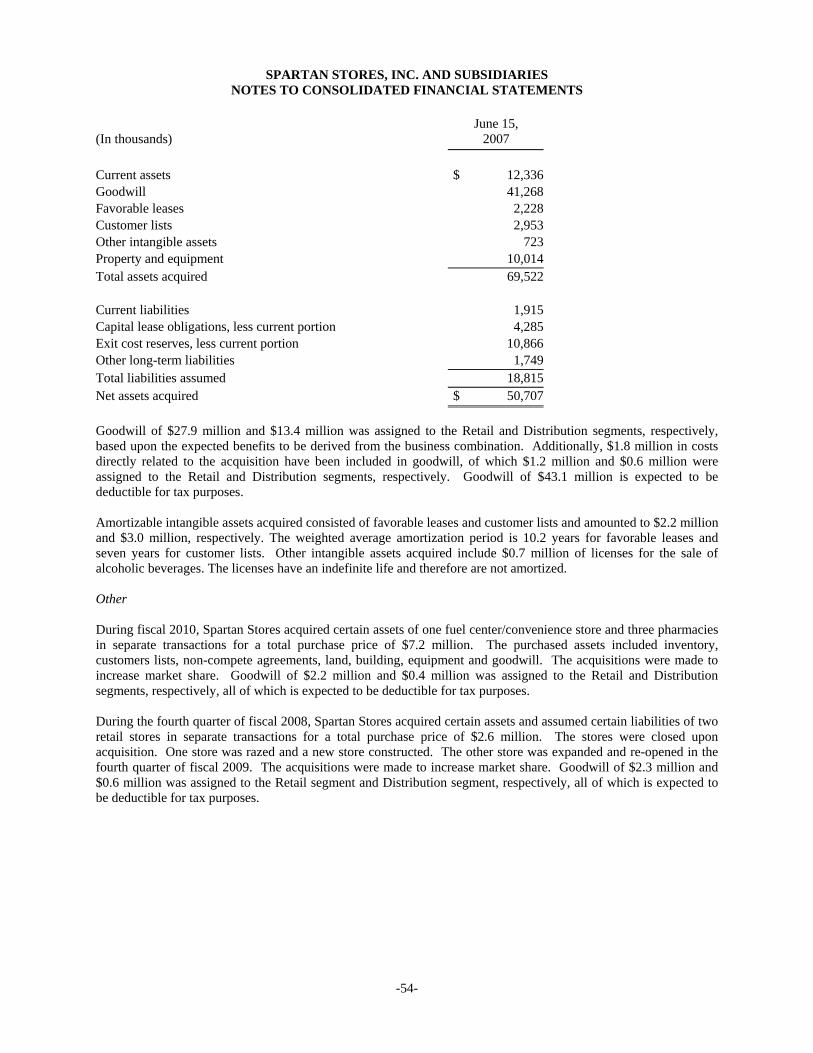
SPARTAN STORES, INC. AND SUBSIDIARIES NOTES TO CONSOLIDATED FINANCIAL STATEMENTS
-54-
(In thousands)
June 15, 2007
Current assets $ 12,336Goodwill 41,268Favorable leases 2,228Customer lists 2,953Other intangible assets 723Property and equipment 10,014Total assets acquired 69,522 Current liabilities 1,915Capital lease obligations, less current portion 4,285Exit cost reserves, less current portion 10,866Other long-term liabilities 1,749Total liabilities assumed 18,815Net assets acquired $ 50,707
Goodwill of $27.9 million and $13.4 million was assigned to the Retail and Distribution segments, respectively, based upon the expected benefits to be derived from the business combination. Additionally, $1.8 million in costs directly related to the acquisition have been included in goodwill, of which $1.2 million and $0.6 million were assigned to the Retail and Distribution segments, respectively. Goodwill of $43.1 million is expected to be deductible for tax purposes. Amortizable intangible assets acquired consisted of favorable leases and customer lists and amounted to $2.2 million and $3.0 million, respectively. The weighted average amortization period is 10.2 years for favorable leases and seven years for customer lists. Other intangible assets acquired include $0.7 million of licenses for the sale of alcoholic beverages. The licenses have an indefinite life and therefore are not amortized. Other During fiscal 2010, Spartan Stores acquired certain assets of one fuel center/convenience store and three pharmacies in separate transactions for a total purchase price of $7.2 million. The purchased assets included inventory, customers lists, non-compete agreements, land, building, equipment and goodwill. The acquisitions were made to increase market share. Goodwill of $2.2 million and $0.4 million was assigned to the Retail and Distribution segments, respectively, all of which is expected to be deductible for tax purposes. During the fourth quarter of fiscal 2008, Spartan Stores acquired certain assets and assumed certain liabilities of two retail stores in separate transactions for a total purchase price of $2.6 million. The stores were closed upon acquisition. One store was razed and a new store constructed. The other store was expanded and re-opened in the fourth quarter of fiscal 2009. The acquisitions were made to increase market share. Goodwill of $2.3 million and $0.6 million was assigned to the Retail segment and Distribution segment, respectively, all of which is expected to be deductible for tax purposes.

SPARTAN STORES, INC. AND SUBSIDIARIES NOTES TO CONSOLIDATED FINANCIAL STATEMENTS
-55-
Note 4 Goodwill and Other Intangible Assets Changes in the carrying amount of goodwill were as follows: (In thousands)
Retail
Distribution
Total
Balance at March 30, 2008: Goodwill $ 204,855 $ 68,276 $ 273,131 Accumulated impairment charges (86,600) - (86,600) Goodwill, net 118,255 68,276 186,531 VG’s acquisition (Note 3) 43,514 23,852 67,366 Other (Note 5) (4,594) - (4,594) Balance at March 28, 2009: Goodwill 243,775 92,128 335,903 Accumulated impairment charges (86,600) - (86,600) Goodwill, net 157,175 92,128 249,303 Acquisitions (Note 3) 2,234 365 2,599 Other (Note 5) (3,986) - (3,986) Balance at March 27, 2010: Goodwill 242,023 92,493 334,516 Accumulated impairment charges (86,600) - (86,600) Goodwill, net $ 155,423 $ 92,493 $ 247,916 The following table reflects the components of amortized intangible assets, included in “Other, net” on the Consolidated Balance Sheets: (In thousands) March 27, 2010 March 28, 2009 Gross
Carrying Amount
AccumulatedAmortization
Gross Carrying Amount
AccumulatedAmortization
Non-compete agreements $ 3,410 $ 1,983 $ 3,769 $ 1,976Favorable leases 5,262 2,119 5,844 2,205Customer lists 10,738 3,302 9,744 1,863Franchise fees and other 575 154 535 110Total $ 19,985 $ 7,558 $ 19,892 $ 6,154 The weighted average amortization period for amortizable intangible assets is as follows:
Non-compete agreements 8.7 years Favorable leases 13.7 years Customer lists 7.5 years Franchise fees and other 12.1 years Total 8.9 years

SPARTAN STORES, INC. AND SUBSIDIARIES NOTES TO CONSOLIDATED FINANCIAL STATEMENTS
-56-
Amortization expense for intangible assets was $2.3 million, $1.9 million and $1.8 million for fiscal years 2010, 2009 and 2008, respectively. Estimated amortization expense for each of the five succeeding fiscal years is as follows: (In thousands)
Fiscal Year
Amortization Expense
2011 $ 2,256 2012 2,176 2013 2,175 2014 1,975 2015 1,307 Indefinite-lived intangible assets that are not amortized consist primarily of a trade name and licenses for the sale of alcoholic beverages and amounted to $26.7 million as of March 27, 2010 and March 28, 2009. Note 5 Restructuring and Asset Impairment Costs The following table provides the activity of restructuring costs for fiscal years 2010, 2009 and 2008. Restructuring costs recorded in the Consolidated Balance Sheets are included in “Current portion of restructuring costs” in Current liabilities and “Restructuring costs” in Long-term liabilities based on when the obligations are expected to be paid. (In thousands) Lease and
Ancillary Costs Severance Other Total
Balance at April 1, 2007 $ 32,703 $ - $ - $ 32,703 Exit costs assumed in Felpausch acquisition (see Note 3) 11,305
- - 11,305
Change in estimates (1,868) - - (1,868) (a)Payments, net of interest accretion (6,013) - - (6,013) Balance at March 29, 2008 36,127 - - 36,127 Exit costs related to disposition of The Pharm stores 4,562
- - 4,562 (b)
Exit costs assumed in VG’s acquisition (see Note 3) 15,146
- - 15,146
Changes in estimates (4,392) - - (4,392) (a)Payments, net of interest accretion (6,898) - - (6,898) Balance at March 28, 2009 44,545 - - 44,545 Provision for lease and related ancillary costs, net of sublease income 1,111
1,111 Provision for severance and other costs -
2,915 1,109 4,024
Changes in estimates (4,860) - - (4,860) (a) Payments, net of interest accretion (6,914) (859) (1,109) (8,882) Balance at March 27, 2010 $ 33,882 $ 2,056 $ - $ 35,938
(a) Goodwill was reduced by $3.9 million, $4.4 million and $1.9 million in fiscal 2010, 2009 and 2008,
respectively, as a result of these changes in estimates as the initial charges for certain stores were established in the purchase price allocations for previous acquisitions. In fiscal 2010, $0.1 million was included in discontinued operations.
(b) In fiscal 2009, the Retail segment recorded restructuring costs of $4.6 million related to the closure of The Pharm stores (Note 15). In addition, asset impairment charges of $1.0 million were recorded for unsold assets. These charges are included in discontinued operations.
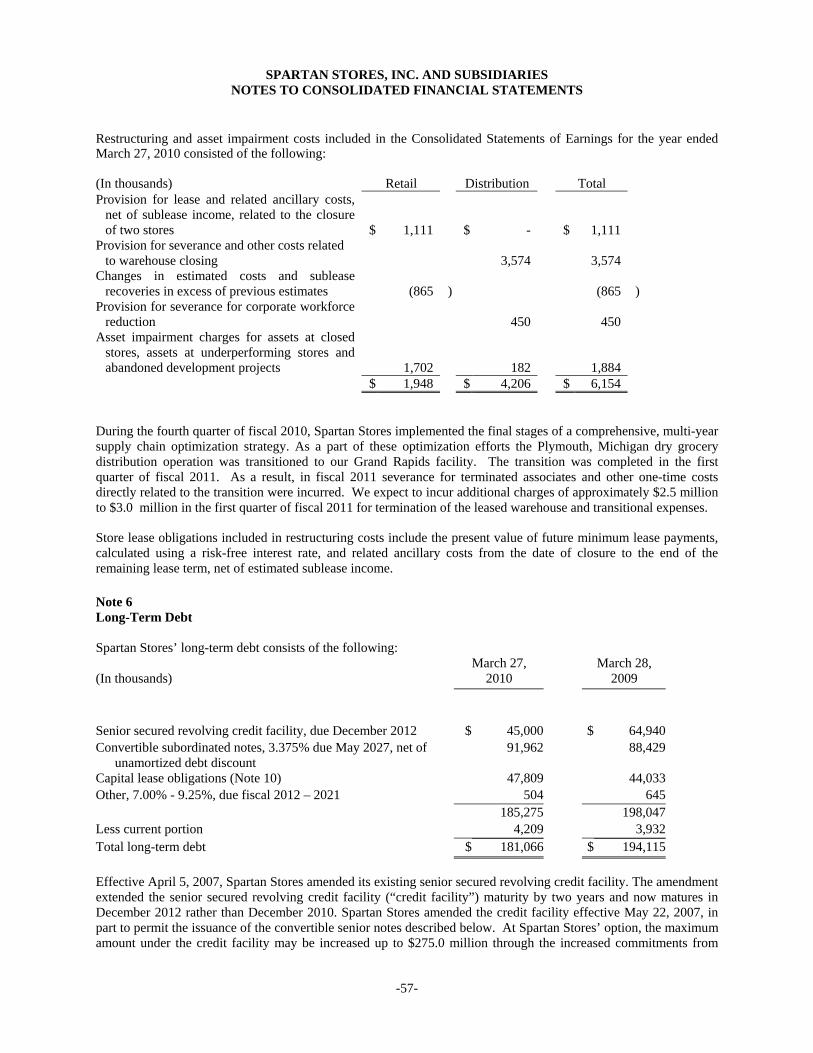
SPARTAN STORES, INC. AND SUBSIDIARIES NOTES TO CONSOLIDATED FINANCIAL STATEMENTS
-57-
Restructuring and asset impairment costs included in the Consolidated Statements of Earnings for the year ended March 27, 2010 consisted of the following: (In thousands) Retail Distribution Total Provision for lease and related ancillary costs,
net of sublease income, related to the closure of two stores $ 1,111 $ - $ 1,111
Provision for severance and other costs related to warehouse closing 3,574 3,574
Changes in estimated costs and sublease recoveries in excess of previous estimates (865 ) (865 )
Provision for severance for corporate workforce reduction 450 450
Asset impairment charges for assets at closed stores, assets at underperforming stores and abandoned development projects 1,702 182 1,884
$ 1,948 $ 4,206 $ 6,154 During the fourth quarter of fiscal 2010, Spartan Stores implemented the final stages of a comprehensive, multi-year supply chain optimization strategy. As a part of these optimization efforts the Plymouth, Michigan dry grocery distribution operation was transitioned to our Grand Rapids facility. The transition was completed in the first quarter of fiscal 2011. As a result, in fiscal 2011 severance for terminated associates and other one-time costs directly related to the transition were incurred. We expect to incur additional charges of approximately $2.5 million to $3.0 million in the first quarter of fiscal 2011 for termination of the leased warehouse and transitional expenses. Store lease obligations included in restructuring costs include the present value of future minimum lease payments, calculated using a risk-free interest rate, and related ancillary costs from the date of closure to the end of the remaining lease term, net of estimated sublease income. Note 6 Long-Term Debt Spartan Stores’ long-term debt consists of the following: (In thousands)
March 27, 2010
March 28, 2009
Senior secured revolving credit facility, due December 2012 $ 45,000 $ 64,940 Convertible subordinated notes, 3.375% due May 2027, net of
unamortized debt discount 91,962 88,429
Capital lease obligations (Note 10) 47,809 44,033 Other, 7.00% - 9.25%, due fiscal 2012 – 2021 504 645
185,275 198,047 Less current portion 4,209 3,932 Total long-term debt $ 181,066 $ 194,115
Effective April 5, 2007, Spartan Stores amended its existing senior secured revolving credit facility. The amendment extended the senior secured revolving credit facility (“credit facility”) maturity by two years and now matures in December 2012 rather than December 2010. Spartan Stores amended the credit facility effective May 22, 2007, in part to permit the issuance of the convertible senior notes described below. At Spartan Stores’ option, the maximum amount under the credit facility may be increased up to $275.0 million through the increased commitments from

SPARTAN STORES, INC. AND SUBSIDIARIES NOTES TO CONSOLIDATED FINANCIAL STATEMENTS
-58-
lenders, and provided that asset levels are increased sufficient to support the increased borrowings. Interest rates under the amended agreement may be up to 50 basis points lower depending on levels of excess availability under the agreement. The credit facility is secured by substantially all of Spartan Stores’ assets. On August 17, 2007, Spartan Stores entered into an agreement to increase the maximum credit available under its existing senior secured credit facility from $225.0 million to $255.0 million. Available borrowings under the credit facility are based on stipulated advance rates on eligible assets, as defined in the credit agreement. The credit facility contains covenants that include a minimum fixed charge coverage ratio and maximum capital expenditures, as defined in the credit agreement. These covenants are not effective as long as Spartan Stores maintains minimum excess availability levels of $25.0 million with respect to the minimum fixed charge coverage ratio and $20 million with respect to maximum capital expenditures. Spartan Stores had available borrowings of $121.4 million at March 27, 2010 and excess availability of $131.4 million. Payment of dividends and repurchases of outstanding shares are permitted up to a total of $15.0 million per year, provided that excess availability of $20.0 million is maintained. The credit facility provides for the issuance of letters of credit of which $1.7 million were outstanding and unused as of March 27, 2010. Borrowings under the revolving credit portion of the facility bear interest at LIBOR plus 1.25% or the prime rate (weighted average interest rate of 3.33% at March 27, 2010 including the effect of the interest rate swap (see Note 7)). On May 30, 2007, Spartan Stores issued $110 million in aggregate principal amount of unsecured 3.375% convertible senior notes due May 15, 2027. The notes are general unsecured obligations and rank equally in right of payment with all of our other existing and future unsecured and unsubordinated obligations. They are effectively subordinated to our existing and any future secured indebtedness to the extent of the assets securing such indebtedness. The notes are structurally subordinated to our subsidiaries’ indebtedness and other liabilities. The Notes are not guaranteed by our subsidiaries. The net proceeds from the sale of the notes after deducting selling discounts of 2.5% and offering expenses of $0.6 million were approximately $106.5 million, and were used to pay down amounts owed under our senior secured revolving credit facility and partially fund the Felpausch stores acquisition. Interest at an annual rate of 3.375% is payable semi-annually on May 15 and November 15 of each year. Contingent interest will be paid to holders of the notes during the period commencing May 20, 2012 and ending on November 14, 2012 and for any six-month period thereafter, if the average contingent interest trading price per $1,000 principal amount of the notes for the five-consecutive-trading-day-period ending on the third trading day immediately preceding the first day of such interest period equals 120% or more of the principal amount of the notes. Contingent interest payable with respect to any six-month period will equal 0.25% per annum of the average contingent interest trading price of $1,000 principal amount of notes during the five-consecutive-trading-day measurement period described above. Spartan Stores may redeem the notes for cash in whole or in part, at any time or from time to time, on or after May 15, 2014 at 100% of the principal amount of the notes to be redeemed, and prior to that date on or after May 20, 2012 at a price equal to a specified percentage of the principal amount, plus, in each case, any accrued and unpaid interest. Holders may require Spartan Stores to repurchase their notes, in whole or in part, on May 15, 2014, May 15, 2017 and May 15, 2022 for a cash price equal to 100% of the principal amount of the notes to be redeemed, plus accrued and unpaid interest. In addition, upon certain fundamental change transactions, each holder would have the option, subject to certain conditions, to require Spartan Stores to repurchase for cash, in whole or in part, such holder’s notes. For the purposes of the notes, a “fundamental change” would include, among other events set forth in the Indenture governing the notes, the acquisition of 50% or more of our common stock by a person or group, a consolidation, merger, or sale of all or substantially all of our assets, certain changes in our board of directors, or a termination of trading of our common stock. The notes will be convertible at the option of the holder only under certain circumstances summarized as follows:
1. If the closing sale price per share of Spartan Stores common stock is greater than 130% of the applicable conversion price for a specified period of time,
2. If the trading price of the notes was less than 98% of the product of the closing sale price per share of Spartan Stores common stock and the conversion rate in effect for the notes for a specified period of time,

SPARTAN STORES, INC. AND SUBSIDIARIES NOTES TO CONSOLIDATED FINANCIAL STATEMENTS
-59-
3. If the notes are called for redemption, 4. At any time on or after February 15, 2027 until the close of business on the business day immediately
preceding the maturity date, 5. Upon the occurrence of specified corporate transactions.
Upon conversion by the holder, the notes convert at an initial conversion rate of 28.0310 shares of Spartan Stores common stock per $1,000 principal amount of notes (equal to an initial conversion price of approximately $35.67 per share), subject to adjustments upon certain events. Upon a surrender of notes for conversion, Spartan Stores will deliver cash equal to the lesser of the aggregate principal amount of notes to be converted and the total conversion obligation, and shares of Spartan Stores common stock in respect of the remainder, if any, of the conversion obligation, unless Spartan Stores has elected to satisfy its obligation under such conversion by delivering only shares of common stock. In connection with the closing of the sale of the notes, Spartan Stores entered into a registration rights agreement with the initial purchasers of the notes, pursuant to which Spartan Stores filed with the Securities and Exchange Commission (SEC) a shelf registration statement covering resale by security holders of the notes and the shares of Spartan Stores common stock issuable upon conversion of the notes. The registration statement was declared effective by the SEC on September 27, 2007. The amount of interest expense recognized and the effective interest rate for Spartan Stores’ convertible senior notes were as follows: (In thousands) 2010 2009 2008 Contractual coupon interest $ 3,712 $ 3,712 $ 3,089 Amortization of discount on
convertible senior notes 3,533 3,261 2,789 Interest expense $ 7,245 $ 6,973 $ 5,878 Effective interest rate 8.125% 8.125% 8.125% The debt and equity components recognized for Spartan Stores’ convertible senior notes were as follows: (In thousands) March 27,
2010 March 28,
2009
Principal amount of convertible senior notes $ 110,000 $ 110,000 Unamortized discount 18,038(1) 21,571 Net carrying amount 91,962 88,429 Common stock 16,420 16,420 (1) Will be recognized over a remaining period of 4.1 years. The weighted average interest rates including loan fee amortization for fiscal 2010, 2009 and fiscal 2008 were 7.59%, 8.37% and 9.24%, respectively.

SPARTAN STORES, INC. AND SUBSIDIARIES NOTES TO CONSOLIDATED FINANCIAL STATEMENTS
-60-
At March 27, 2010, long-term debt was due as follows: (In thousands) Fiscal Year
2011 $ 4,209 2012 4,396 2013 49,278 2014 3,459 2015 95,468 Thereafter 28,465
$ 185,275
Note 7 Derivative Instruments Spartan Stores has limited involvement with derivative financial instruments and uses them only to manage well-defined interest rate risk exposure when appropriate, based on market conditions. Spartan Stores’ objective in managing exposure to changes in interest rates is to reduce fluctuations in earnings and cash flows, and consequently, from time to time Spartan Stores uses interest rate swap agreements to manage this risk. Spartan Stores does not use financial instruments or derivatives for any trading or other speculative purposes. On January 2, 2009, Spartan Stores entered into an interest rate swap agreement. The interest rate swap is considered to be a cash flow hedge of interest payments on $45.0 million of borrowings under Spartan Stores’ senior secured revolving credit facility by effectively converting a portion of the variable rate debt to a fixed rate basis. Under the terms of the agreement, Spartan Stores has agreed to pay the counterparty a fixed interest rate of 3.33% and the counterparty has agreed to pay Spartan Stores a floating interest rate based upon the 1-month LIBOR plus 1.25% (1.48% at March 27, 2010) on a notional amount of $45 million. The interest rate swap agreement expires concurrently with its senior secured revolving credit facility on December 24, 2012. For derivative instruments that are designated and qualify as cash flow hedges, the effective portion of the gain or loss on the derivative is reported as a component of other comprehensive income and reclassified into earnings in the same period during which the hedged transaction affects earnings. Gains and losses on the derivative representing hedge ineffectiveness are recognized in current earnings. There was no impact on earnings in fiscal 2010 and 2009 as the cash flow hedge is highly effective and, assuming the swap agreement continues to qualify as a hedge on the related debt, Spartan Stores expects no material impact on earnings in the next twelve months. The following table provides a summary of the fair value and balance sheet classification of the derivative financial instrument designated as an interest rate cash flow hedge:
Balance Sheet Classification March 27, 2010 March 28, 2009 Other long-term liabilities $ 653 $ 462
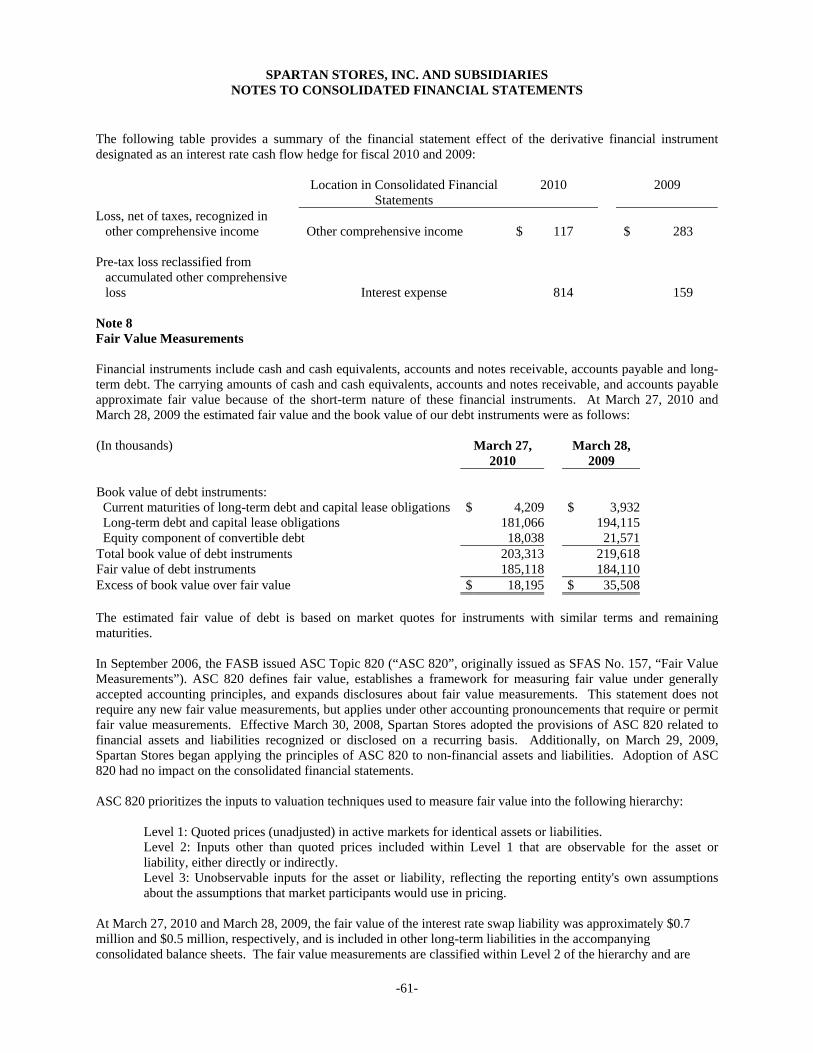
SPARTAN STORES, INC. AND SUBSIDIARIES NOTES TO CONSOLIDATED FINANCIAL STATEMENTS
-61-
The following table provides a summary of the financial statement effect of the derivative financial instrument designated as an interest rate cash flow hedge for fiscal 2010 and 2009: Location in Consolidated Financial
Statements 2010 2009
Loss, net of taxes, recognized in other comprehensive income Other comprehensive income $ 117
$ 283
Pre-tax loss reclassified from
accumulated other comprehensive loss Interest expense
814
159 Note 8 Fair Value Measurements Financial instruments include cash and cash equivalents, accounts and notes receivable, accounts payable and long-term debt. The carrying amounts of cash and cash equivalents, accounts and notes receivable, and accounts payable approximate fair value because of the short-term nature of these financial instruments. At March 27, 2010 and March 28, 2009 the estimated fair value and the book value of our debt instruments were as follows: (In thousands) March 27,
2010 March 28,
2009
Book value of debt instruments: Current maturities of long-term debt and capital lease obligations $ 4,209 $ 3,932 Long-term debt and capital lease obligations 181,066 194,115 Equity component of convertible debt 18,038 21,571Total book value of debt instruments 203,313 219,618 Fair value of debt instruments 185,118 184,110 Excess of book value over fair value $ 18,195 $ 35,508 The estimated fair value of debt is based on market quotes for instruments with similar terms and remaining maturities. In September 2006, the FASB issued ASC Topic 820 (“ASC 820”, originally issued as SFAS No. 157, “Fair Value Measurements”). ASC 820 defines fair value, establishes a framework for measuring fair value under generally accepted accounting principles, and expands disclosures about fair value measurements. This statement does not require any new fair value measurements, but applies under other accounting pronouncements that require or permit fair value measurements. Effective March 30, 2008, Spartan Stores adopted the provisions of ASC 820 related to financial assets and liabilities recognized or disclosed on a recurring basis. Additionally, on March 29, 2009, Spartan Stores began applying the principles of ASC 820 to non-financial assets and liabilities. Adoption of ASC 820 had no impact on the consolidated financial statements. ASC 820 prioritizes the inputs to valuation techniques used to measure fair value into the following hierarchy:
Level 1: Quoted prices (unadjusted) in active markets for identical assets or liabilities. Level 2: Inputs other than quoted prices included within Level 1 that are observable for the asset or liability, either directly or indirectly. Level 3: Unobservable inputs for the asset or liability, reflecting the reporting entity's own assumptions about the assumptions that market participants would use in pricing.
At March 27, 2010 and March 28, 2009, the fair value of the interest rate swap liability was approximately $0.7 million and $0.5 million, respectively, and is included in other long-term liabilities in the accompanying consolidated balance sheets. The fair value measurements are classified within Level 2 of the hierarchy and are

SPARTAN STORES, INC. AND SUBSIDIARIES NOTES TO CONSOLIDATED FINANCIAL STATEMENTS
-62-
determined using prices from a financial institution that develops values based on observable inputs in active markets. Long-lived assets totaling $6.9 million were measured at fair value on a nonrecurring basis using Level 3 inputs as defined in the fair value heirarchy. Fair value of long-lived assets is determined by estimating the amount and timing of net future cash flows, discounted using a risk-adjusted rate of interest. Spartan Stores estimates future cash flows based on experience and knowledge of the market in which the assets are located, and when necessary, uses real estate brokers. See Note 5 for discussion of long-lived asset impairment charges. Note 9 Commitments and Contingencies Spartan Stores subleases property at certain locations and received rental income of $2.1 million in fiscal 2010. In the event of the customer’s default, Spartan would be responsible for fulfilling these lease obligations. The future payment obligations under these leases are disclosed in Note 10. Unions represent approximately 8% of Spartan Stores’ associates. Contracts covering 720 distribution center and transportation associates expire in October 2011. Various lawsuits and claims, arising in the ordinary course of business, are pending or have been asserted against Spartan Stores. While the ultimate effect of such actions cannot be predicted with certainty, management believes that their outcome will not result in a material adverse effect on the consolidated financial position, operating results or liquidity of Spartan Stores. Note 10 Leases Most of the Company’s retail stores are operated in leased facilities. The Company also leases certain warehouse facilities, its tractor and trailer fleet and certain other equipment. Most of the property leases contain renewal options of varying terms. Terms of certain leases contain provisions requiring payment of percentage rent based on sales and payment of executory costs such as property taxes, utilities, insurance and maintenance. Terms of certain leases of transportation equipment contain provisions requiring payment of percentage rent based upon miles driven. Portions of certain property are subleased to others. Rental expense, net of sublease income, under operating leases consisted of the following: (In thousands) 2010 2009 2008 Minimum rentals $ 33,706 $ 30,665 $ 29,083 Contingent payments 1,013 1,063 1,056Sublease income (2,064) (1,816) (1,609) $ 32,655 $ 29,912 $ 28,530

SPARTAN STORES, INC. AND SUBSIDIARIES NOTES TO CONSOLIDATED FINANCIAL STATEMENTS
-63-
Total future lease commitments of Spartan Stores under capital and operating leases in effect at March 27, 2010 are as follows: (In thousands) Capital Operating
Fiscal Year Used in
OperationsUsed in
OperationsSubleasedto Others Total
2011 $ 7,951 $ 30,313 $ 1,135 $ 31,448 2012 7,886 25,597 971 26,568 2013 7,384 22,003 665 22,668 2014 6,274 17,581 394 17,975 2015 6,043 13,116 303 13,419 Thereafter 39,661 39,740 177 39,917 Total 75,199 $ 148,350 $ 3,645 $ 151,995 Interest (27,390) Present value of minimum lease obligations 47,809
Current portion 4,069 Long-term obligations $ 43,740 Amortization expense for property under capital leases was $4.1 million, $3.2 million and $2.5 million in fiscal years 2010, 2009 and 2008, respectively. Assets held under capital leases consisted of the following: (In thousands)
March 27, 2010
March 28, 2009
Buildings and improvements $ 47,098 $ 39,436Equipment 3,924 4,096 51,022 43,532Less accumulated depreciation 13,520 9,636Net property $ 37,502 $ 33,896
One of Spartan Stores’ subsidiaries leases retail store facilities to non-related entities. Of the stores leased, several are owned and others were obtained through leasing arrangements and are accounted for as operating leases. A majority of the leases provide for minimum and contingent rentals based upon stipulated sales volumes and contain renewal options. Certain of the leases contain escalation clauses. Owned assets, included in property and equipment, which are leased to others are as follows: (In thousands)
March 27, 2010
March 28, 2009
Land and improvements $ 1,173 $ 1,172Buildings 5,942 5,617 7,115 6,789Less accumulated depreciation 3,491 3,653Net property $ 3,624 $ 3,136

SPARTAN STORES, INC. AND SUBSIDIARIES NOTES TO CONSOLIDATED FINANCIAL STATEMENTS
-64-
Future minimum rentals to be received under operating leases in effect at March 27, 2010 are as follows: (In thousands)
Fiscal Year
Owned Property
Leased Property
Total
2011 $ 1,077 $ 1,343 $ 2,420 2012 691 1,050 1,741 2013 531 707 1,238 2014 442 418 860 2015 444 321 765
Thereafter 1,188 187 1,375 Total $ 4,373 $ 4,026 $ 8,399
Note 11 Associate Retirement Plans Spartan Stores’ retirement programs include pension plans providing non-contributory benefits and salary reduction defined contribution plans providing contributory benefits. Substantially all of Spartan Stores’ associates not covered by collective bargaining agreements are covered by either a non-contributory cash balance pension plan (“Company Plan”), a defined contribution plan or both. Associates covered by collective bargaining agreements are included in multi-employer pension plans. Spartan Stores’ Company Plan benefit formula utilizes a cash balance approach. Under the cash balance formula, credits are added annually to a participant’s “account” based on a percent of the participant’s compensation and years of vested service at the beginning of each calendar year. Transition credits were also added at Spartan Stores’ discretion to certain participants’ accounts until the year 2007 if certain age and years-of-service requirements were met. At Spartan Stores’ discretion, interest credits are also added annually to a participant’s account based upon the participant’s account balance as of the last day of the immediately preceding calendar year. Annual payments to the pension trust fund are determined in compliance with the Employee Retirement Income Security Act of 1976 (“ERISA”). Company Plan assets consist principally of common stocks and U.S. government and corporate obligations. The Company Plan does not hold any Spartan Stores stock. Spartan Stores also maintains a Supplemental Executive Retirement Plan (“SERP”), which provides nonqualified deferred compensation benefits to Spartan Stores’ officers. Benefits under the SERP are paid from Spartan Stores’ general assets, as there is no separate trust established to fund benefits. Matching contributions made by Spartan Stores to salary reduction defined contribution plans totaled $1.7 million, $2.9 million and $2.4 million in fiscal years 2010, 2009 and 2008, respectively. In addition to the plans described above, Spartan Stores participates in several multi-employer and other defined contribution plans for substantially all associates covered by collective bargaining agreements. The expense for these plans totaled approximately $7.5 million, $7.4 million and $7.7 million in fiscal years 2010, 2009 and 2008, respectively. The Multi-Employer Pension Plan Amendments Act of 1980 amended ERISA to establish funding requirements and obligations for employers participating in multi-employer plans, principally related to employer withdrawal from or termination of such plans. Separate actuarial calculations of Spartan Stores’ position with respect to the multi-employer plans are not available. Spartan Stores and certain subsidiaries provide health care benefits to retired associates who have at least 30 years of service or 10 years of service and have attained age 55, and who were not covered by collective bargaining arrangements during their employment (“covered associates”). Qualified covered associates that retired prior to

SPARTAN STORES, INC. AND SUBSIDIARIES NOTES TO CONSOLIDATED FINANCIAL STATEMENTS
-65-
March 31, 1992 receive major medical insurance with deductible and coinsurance provisions until age 65 and Medicare supplemental benefits thereafter. Covered associates retiring after April 1, 1992 are eligible for monthly postretirement health care benefits of $5 multiplied by the associate’s years of service. This benefit is in the form of a credit against the monthly insurance premium. The balance of the premium is paid by the retiree.

SPARTAN STORES, INC. AND SUBSIDIARIES NOTES TO CONSOLIDATED FINANCIAL STATEMENTS
-66-
The following tables set forth the change in benefit obligation, change in plan assets, weighted average assumptions used in actuarial calculations and components of net periodic benefit costs for Spartan Stores’ pension and postretirement benefit plans. The accrued benefit costs are reported in Postretirement benefits in the Consolidated Balance Sheets. The measurement date was December 31 for fiscal 2008. In accordance with new accounting guidance, in fiscal 2009 Spartan Stores changed its measurement date to coincide with its fiscal year end. Spartan Stores adopted the measurement date provisions of the new accounting guidance on March 30, 2008, the first day of fiscal year 2009, and recorded the cumulative effect of adopting these provisions by decreasing shareholders’ equity by $0.3 million.
(In thousands, except percentages) Pension Benefits SERP Benefits Postretirement Benefits March 27,
2010 March 28,
2009 March 27,
2010 March 28,
2009 March 27,
2010 March 28,
2009
Change in benefit obligation Benefit obligation at beginning of year $ 53,777 $ 53,069 $ 917 $ 728 $ 6,431 $ 6,089 Service cost 2,949 2,660 82 52 133 168 Interest cost 3,605 3,189 57 43 439 370 Plan amendments - 568 - 6 - - Actuarial (gain) loss 5,840 (2,427) 58 138 1,424 10 Benefits paid (4,184) (3,569) (67) (59) (278) (272)Adjustment for change in measurement date - 287 - 9 - 66
Benefit obligation at end of year $ 61,987 $ 53,777 $ 1,047 $ 917 $ 8,149 $ 6,431
Change in plan assets Plan assets at fair value at beginning of year $ 37,069 $ 53,937 $ - $ - $ - $ - Actual return on plan assets 13,475 (16,091) - - - - Actuarial loss - - - - - 539 Company contributions 5,970 3,343 67 59 278 272 Benefits paid (4,184) (3,569) (67) (59) (278) (817)Adjustment for change in measurement date - (551) - - - 6
Plan assets at fair value at measurement date $ 52,330 $ 37,069 $ - $ - $ - $ -
Funded (unfunded) status $ (9,657) $ (16,708) $ (1,047) $ (917) $ (8,149) $ (6,431) Components of net amount recognized in financial position:
Current liabilities - - (74) (212) (304) (328)Noncurrent liabilities (9,657) (16,708) (973) (705) (7,845) (6,103) $ (9,657) $ (16,708) $ (1,047) $ (917) $ (8,149) $ (6,431)
Amounts recognized in accumulated other comprehensive income:
Net actuarial loss $ 22,645 $ 26,869 $ 531 $ 515 $ 2,307 $ 903 Prior service credit (4,453) (5,089) (7 ) (7 ) (503) (557) $ 18,192 $ 21,780 $ 524 $ 508 $ 1,804 $ 346 Weighted average assumptions at Measurement date Discount rate 5.25% 7.00% 5.25% 7.00% 5.25% 7.00% Expected return on plan assets 8.25% 8.25% N/A N/A N/A N/A Rate of compensation increase 4.00% 4.00% 4.00% 4.00% N/A N/A

SPARTAN STORES, INC. AND SUBSIDIARIES NOTES TO CONSOLIDATED FINANCIAL STATEMENTS
-67-
The benefit obligation for pension plans is measured as the projected benefit obligation; the benefit obligation for postretirement benefit plans is measured as the accumulated benefit obligation. The accumulated benefit obligation for both of the defined benefit pension plans was $60.4 million and $53.3 million at March 27, 2010 and March 28, 2009, respectively. Components of net periodic benefit cost (In thousands) Pension Benefits SERP March 27,
2010 March 28,
2009 March 29,
2008 March 27,
2010 March 28,
2009 March 29,
2008
Service cost $ 2,949 $ 2,660 $ 3,532 $ 82 $ 52 $ 53 Interest cost 3,605 3,190 2,733 57 43 35 Expected return on plan assets (4,069) (4,330) (3,732) - - - Amortization of prior service cost (637) (690) (690) - (1) (1)Recognized actuarial net loss 658 346 290 42 36 27 Net periodic benefit cost $ 2,506 $ 1,176 $ 2,133 $ 181 $ 130 $ 114
Postretirement Benefits March 27,
2010 March 28,
2009 March 29,
2008
Service cost $ 133 $ 168 $ 211Interest cost 440 371 401Amortization of prior service cost (54) (54) (64)Recognized actuarial net loss 20 - 39Net periodic benefit cost $ 539 $ 485 $ 587 The net actuarial loss, prior service cost and transition obligation included in “Accumulated Other Comprehensive Income” and expected to be recognized in net periodic benefit cost during fiscal year 2011 are as follows: (In thousands)
Pension Benefits
SERP Benefits
Postretirement Benefits
Net actuarial loss $ 1,497 $ 41 $ 123Prior service credit (637) - (54) $ 860 $ 41 $ 69
Prior service costs are amortized on a straight-line basis over the average remaining service period of active participants. Actuarial gains and losses are amortized over the average remaining service life of active participants when the accumulation of such gains and losses exceeds 10% of the greater of the projected benefit obligation and the fair value of plan assets. Spartan Stores has assumed an average long-term expected return on pension plan assets of 8.25% as of March 27, 2010. The expected return assumption was modeled by third-party investment portfolio managers, based on asset allocations and the expected return and risk components of the various asset classes in the portfolio. The expected return was developed by determining projected stock and bond returns and then applying these returns to the target asset allocations of the plan assets. Equity returns were based primarily on historical returns of the S&P 500 Index. Fixed-income projected returns were based primarily on historical returns for the broad U.S. bond market. This overall return assumption is believed to be reasonable over a longer-term period that is consistent with the liabilities. Assumed health care cost trend rates have a significant effect on the amounts reported for the postretirement plan. The assumed health care cost trend rate used in measuring the accumulated postretirement benefit obligation was 9.00% for fiscal 2010, 9.50% for fiscal 2009 and 10.00% for fiscal 2008, decreasing .50% per year to 5.00%. A 1% increase in the assumed health care cost trend rate would increase the accumulated postretirement benefit obligation

SPARTAN STORES, INC. AND SUBSIDIARIES NOTES TO CONSOLIDATED FINANCIAL STATEMENTS
-68-
by 0.40% and the periodic postretirement benefit cost by 0.75%. A 1% decrease in the assumed health care cost trend rate would decrease the accumulated postretirement benefit obligation by 0.31% and total service and interest cost by 0.81%. Spartan Stores has an investment policy for the pension plan with a long-term asset allocation mix designed to meet the long-term retirement obligations. The asset allocation mix is reviewed annually and, on a regular basis, actual allocations are rebalanced to approximate the prevailing targets. The following table summarizes actual allocations as of March 27, 2010 and March 28, 2009: Plan Assets Target
Range March 27,
2010 March 28,
2009
Asset Category Equity securities 55.0 - 75.0% 66.1% 55.1% Fixed income 25.0 - 45.0 33.9 44.9 Total 100.0 % 100.0% 100.0% The investment policy emphasizes the following key objectives: (1) maintain the purchasing power of the current assets and all future contributions by producing positive real rates of return on plan assets; (2) maximize return within reasonable and prudent levels of risk in order to minimize contributions and (3) control costs of administering the plan and managing the investments. Expected rates of return on plan assets were developed by determining projected stock and bond returns and then applying these returns to the target asset allocations, resulting in a weighted-average rate of return on plan assets. Equity returns were based primarily on historical returns of the S&P 500 Index. Fixed-income projected returns were based primarily on historical returns for the broad U.S. bond market. The fair value of Spartan Stores’ pension plan assets at March 27, 2010 by asset category are as follows: Fair Value Measurements (In thousands)
Total
Quoted prices in
markets for identical
assets (Level 1)
Significant observable
inputs (Level 2)
Significant unobservable
inputs (Level 3)
Mutual funds $ 44,528 $ 44,528 $ $ Money market fund 3,414 3,414 Guaranteed annuity contract 4,388 4,388 Total fair value $ 52,330 $ 44,528 $ 3,414 $ 4,388

SPARTAN STORES, INC. AND SUBSIDIARIES NOTES TO CONSOLIDATED FINANCIAL STATEMENTS
-69-
A reconciliation of the beginning and ending balances for Level 3 assets for the fiscal year 2010 follows: (In thousands)
Guaranteed Annuity Contract
Balance as of March 29, 2009 $ 3,748 Purchases, sales, issuances and settlements (net) (505) Realized gains 246 Unrealized gains 899 Balance as of March 27, 2010 $ 4,388
No payments were required to be made in fiscal 2010 to meet the minimum funding requirements. However, Spartan Stores made a voluntary contribution of $5.2 million to move the plan closer to a fully funded status and reduce future pension expense. Spartan Stores is required to make a contribution of $2.9 million to its defined benefit pension plan in fiscal 2011 to meet minimum pension funding requirements. The following estimated benefit payments, which reflect expected future service, as appropriate, are expected to be paid in the following fiscal years: (In thousands)
Pension Benefits and
SERP Benefits
Other
Benefits 2011 $ 4,697 $ 337 2012 5,452 365 2013 5,066 400 2014 6,021 420 2015 5,716 447 2016 to 2020 32,279 2,698 Note 12 Taxes on Income The income tax provision for continuing operations is summarized as follows: (In thousands) March 27,
2010 March 28,
2009 March 29,
2008 Currently payable: Federal $ 3,199 $ 4,816 $ 3,080 State 1,246 2,171 800 Total currently payable 4,445 6,987 3,880 Deferred: Federal 10,424 14,223 13,336 State 1,606 2,704 - Total deferred 12,030 16,927 13,336 Total $ 16,475 $ 23,914 $ 17,216

SPARTAN STORES, INC. AND SUBSIDIARIES NOTES TO CONSOLIDATED FINANCIAL STATEMENTS
-70-
The effective income tax rates are different from the statutory federal income tax rates for the following reasons: 2010 2009 2008 Federal statutory income tax rate 35.0% 35.0 % 35.0%State taxes, net of federal income tax benefit 4.5 5.4 0.8 Tax credits (0.2) (0.1 ) (0.2) Charitable product donations (0.4) - - Other (0.1) 0.3 0.2 Effective income tax rate 38.8% 40.6 % 35.8%
During fiscal 2008, the Michigan legislature enacted a new business income tax effective January 1, 2008, which replaced the former Michigan Single Business Tax (“MSBT”) that was in effect through December 31, 2007. The new income tax, or Michigan Business Tax, is reported in Income taxes in the accompanying consolidated statements of earnings, whereas the former MSBT was included in Selling, general and administrative expenses. Deferred tax assets and liabilities resulting from temporary differences as of March 27, 2010 and March 28, 2009 are as follows: (In thousands)
2010 2009 Deferred tax assets: Employee benefits $ 17,996 $ 16,077 Accounts receivable 900 704 Asset impairment and closed store reserves 1,368 3,630 Deferred revenue 1,071 853 State taxes 974 1,274 All other 3,143 2,610Total deferred tax assets 25,452 25,148 Deferred tax liabilities: Depreciation 25,351 22,049 Inventory 5,041 4,422 Goodwill 21,685 13,940 Convertible debt interest 13,482 12,149 Leases 3,423 1,999 All other 958 726Total deferred tax liabilities 69,940 55,285
Net deferred tax liability $ (44,488) $ (30,137)
On March 30, 2008, Spartan Stores adopted new accounting guidance on the accounting for uncertainty in income taxes. This accounting guidance prescribes a recognition threshold and measurement attribute for the financial statement recognition and measurement of tax positions taken or expected to be taken in tax returns. For benefits to be recognized, a tax position must be more likely than not to be sustained upon examination. The amount recognized is measured as the largest amount of benefit that is more likely than not of being realized upon settlement. The adoption of this new accounting guidance increased retained earnings by approximately $1.0 million as of the beginning of fiscal year 2008.
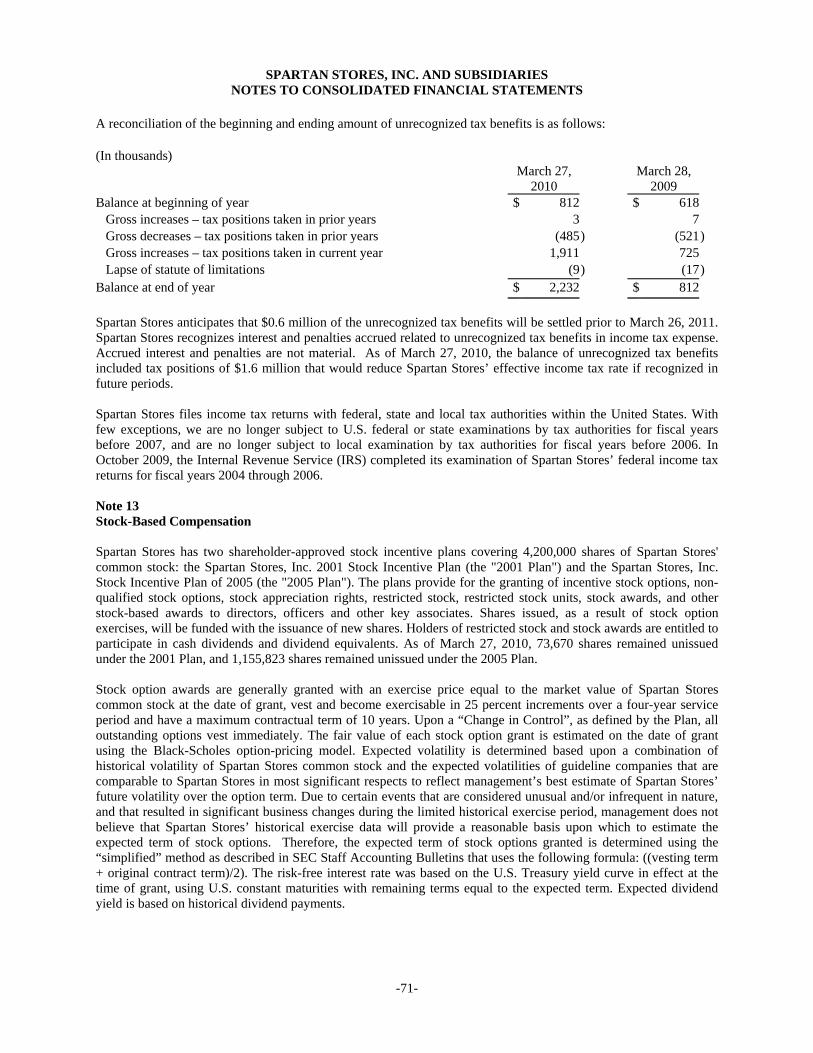
SPARTAN STORES, INC. AND SUBSIDIARIES NOTES TO CONSOLIDATED FINANCIAL STATEMENTS
-71-
A reconciliation of the beginning and ending amount of unrecognized tax benefits is as follows: (In thousands) March 27,
2010 March 28,
2009
Balance at beginning of year $ 812 $ 618 Gross increases – tax positions taken in prior years 3 7 Gross decreases – tax positions taken in prior years (485) (521) Gross increases – tax positions taken in current year 1,911 725 Lapse of statute of limitations (9) (17)Balance at end of year $ 2,232 $ 812
Spartan Stores anticipates that $0.6 million of the unrecognized tax benefits will be settled prior to March 26, 2011. Spartan Stores recognizes interest and penalties accrued related to unrecognized tax benefits in income tax expense. Accrued interest and penalties are not material. As of March 27, 2010, the balance of unrecognized tax benefits included tax positions of $1.6 million that would reduce Spartan Stores’ effective income tax rate if recognized in future periods. Spartan Stores files income tax returns with federal, state and local tax authorities within the United States. With few exceptions, we are no longer subject to U.S. federal or state examinations by tax authorities for fiscal years before 2007, and are no longer subject to local examination by tax authorities for fiscal years before 2006. In October 2009, the Internal Revenue Service (IRS) completed its examination of Spartan Stores’ federal income tax returns for fiscal years 2004 through 2006. Note 13 Stock-Based Compensation Spartan Stores has two shareholder-approved stock incentive plans covering 4,200,000 shares of Spartan Stores' common stock: the Spartan Stores, Inc. 2001 Stock Incentive Plan (the "2001 Plan") and the Spartan Stores, Inc. Stock Incentive Plan of 2005 (the "2005 Plan"). The plans provide for the granting of incentive stock options, non-qualified stock options, stock appreciation rights, restricted stock, restricted stock units, stock awards, and other stock-based awards to directors, officers and other key associates. Shares issued, as a result of stock option exercises, will be funded with the issuance of new shares. Holders of restricted stock and stock awards are entitled to participate in cash dividends and dividend equivalents. As of March 27, 2010, 73,670 shares remained unissued under the 2001 Plan, and 1,155,823 shares remained unissued under the 2005 Plan. Stock option awards are generally granted with an exercise price equal to the market value of Spartan Stores common stock at the date of grant, vest and become exercisable in 25 percent increments over a four-year service period and have a maximum contractual term of 10 years. Upon a “Change in Control”, as defined by the Plan, all outstanding options vest immediately. The fair value of each stock option grant is estimated on the date of grant using the Black-Scholes option-pricing model. Expected volatility is determined based upon a combination of historical volatility of Spartan Stores common stock and the expected volatilities of guideline companies that are comparable to Spartan Stores in most significant respects to reflect management’s best estimate of Spartan Stores’ future volatility over the option term. Due to certain events that are considered unusual and/or infrequent in nature, and that resulted in significant business changes during the limited historical exercise period, management does not believe that Spartan Stores’ historical exercise data will provide a reasonable basis upon which to estimate the expected term of stock options. Therefore, the expected term of stock options granted is determined using the “simplified” method as described in SEC Staff Accounting Bulletins that uses the following formula: ((vesting term + original contract term)/2). The risk-free interest rate was based on the U.S. Treasury yield curve in effect at the time of grant, using U.S. constant maturities with remaining terms equal to the expected term. Expected dividend yield is based on historical dividend payments.

SPARTAN STORES, INC. AND SUBSIDIARIES NOTES TO CONSOLIDATED FINANCIAL STATEMENTS
-72-
The following weighted average assumptions were used to estimate the fair value of stock options at the date of grant using the Black-Scholes option-pricing model: 2010 2009 2008 Dividend yield 1.43% 0.86% - 1.01% 0.70% - 0.89% Expected volatility 41.50% - 42.30% 37.55% - 39.82% 32.84% - 34.51%Risk-free interest rate 2.28% 2.25% - 3.28% 4.27% - 4.76% Expected life of option 6.25 years 6.25 years 6.25 years The following table summarizes stock option activity for the three years ended March 27, 2010:
Shares Under
Options
Weighted Average
Exercise Price
Weighted Average
Remaining Contractual Life Years
Aggregate Intrinsic Value
(In thousands)
Options outstanding at April 1, 2007 609,397 9.44 6.87 10,553Granted 97,138 28.00 Exercised (117,620) 6.24 2,370Cancelled (8,283) 9.92 Options outstanding at March 29, 2008 580,632 13.16 6.56 5,059Granted 290,780 22.72 Exercised (157,554) 8.94 2,302Cancelled (7,491) 17.79 Options outstanding at March 28, 2009 706,367 $ 17.99 7.20 $ 1,506Granted 179,382 13.87 Exercised (27,869) 6.99 201Cancelled (25,937) 20.62 Options outstanding at March 27, 2010 831,943 $ 17.39 6.90 $ 1,279
Options exercisable at March 29, 2008 293,321 $ 8.85 4.94 $ 3,461
Options exercisable at March 28, 2009 244,111 $ 11.29 4.65 $ 1,329
Options exercisable at March 27, 2010 366,113 $ 15.15 5.15 $ 1,111
Vested and expected to vest in the future at March 27, 2010 812,059 $ 17.35 6.86 $ 1,271 The weighted average grant-date fair value of stock options granted during fiscal years 2010, 2009 and 2008 was $5.26, $8.90 and $10.91, respectively. Cash received from option exercises was $0.2 million, $1.4 million and $0.7 million during fiscal years 2010, 2009 and 2008, respectively.

SPARTAN STORES, INC. AND SUBSIDIARIES NOTES TO CONSOLIDATED FINANCIAL STATEMENTS
-73-
The following tables summarize information concerning options outstanding and options exercisable at March 27, 2010:
Options Outstanding
Exercise Prices
Options Outstanding
Weighted AverageRemaining
Contractual Life Years
Weighted Average Exercise Price
$ 2.29 – 13.75 235,482 4.58 $ 9.77 13.76 – 22.00 231,887 7.63 14.62 22.01 – 23.00 259,303 8.14 22.69 23.01 – 28.28 105,271 7.40 27.47$ 2.29 – 28.28 831,943 6.90 $ 17.39
Options Exercisable
Exercise Prices
Options Exercisable
Weighted Average Exercise Price
$ 2.29 – 13.75 198,498 $ 9.04 13.76 – 22.00 51,062 16.73 22.01 – 23.00 67,376 22.68 23.01 – 28.28 49,177 27.85
$ 2.29 – 28.28 366,113 $ 15.15
Restricted shares awarded to employees vest ratably over a five-year service period. Awards granted to directors prior to May 10, 2006 vest 100 percent after three years and awards granted on or after May 10, 2006 vest in one-third increments over a three-year service period. Awards are subject to certain transfer restrictions and forfeiture prior to vesting. All shares fully vest upon a “Change in Control” as defined by the Plan. Compensation expense, representing the fair value of the stock at the measurement date of the award, is recognized over the vesting period. Historically, awards have been granted in the form of stock options and restricted stock. In fiscal 2010, Spartan Stores also granted restricted stock units (“RSU’s”) to certain executive employees of the Company. The RSU’s have a service condition and a performance condition that must be met in order for the awards to vest. Depending on whether the Company achieves specified threshold, target, or maximum levels of earnings per share as defined in the award documents, an employee could receive a number of shares of Spartan Stores common stock ranging from zero to 200 percent of the number of RSU’s granted. Any shares received upon conversion are subject to a cliff vesting period ending on the third anniversary of the grant date as designated in the award documents. Compensation expense is recognized over the service vesting period if and when the Company concludes it is probable that the performance vesting condition will be satisfied. If the performance condition is not satisfied, then no compensation cost is recorded and any compensation cost previously recognized will be reversed. The performance condition was not met for fiscal 2010.
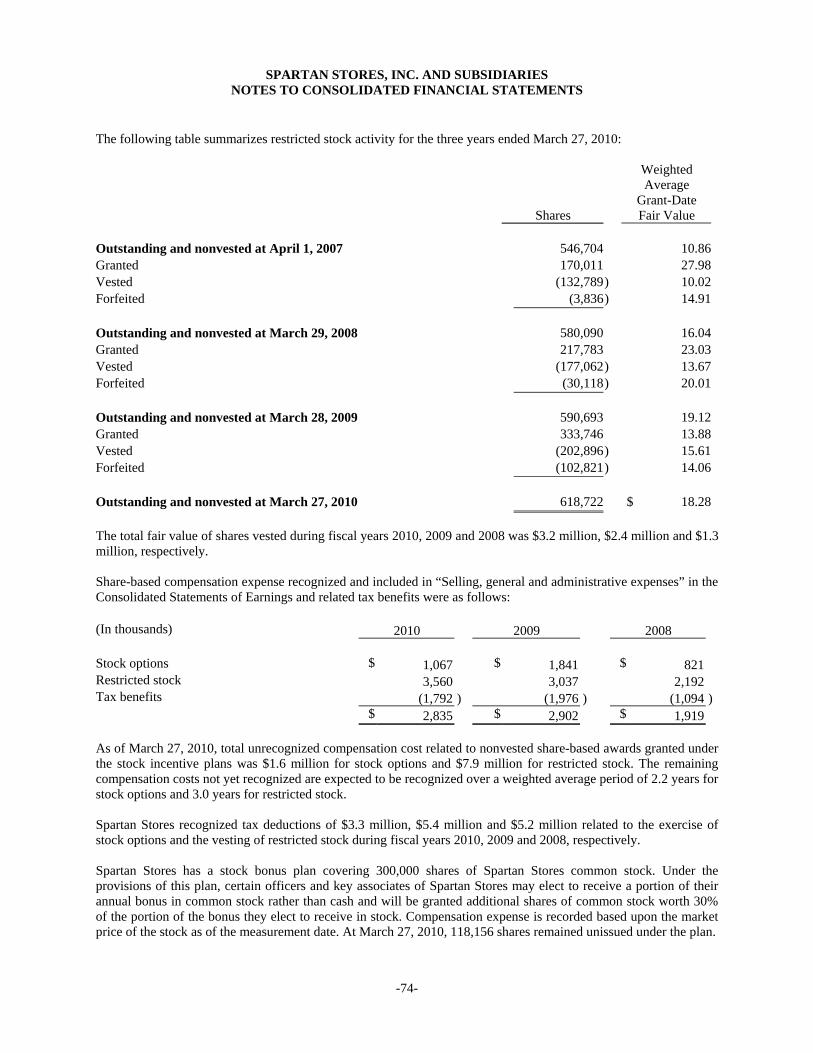
SPARTAN STORES, INC. AND SUBSIDIARIES NOTES TO CONSOLIDATED FINANCIAL STATEMENTS
-74-
The following table summarizes restricted stock activity for the three years ended March 27, 2010:
Shares
Weighted Average
Grant-Date Fair Value
Outstanding and nonvested at April 1, 2007 546,704 10.86Granted 170,011 27.98Vested (132,789) 10.02Forfeited (3,836) 14.91 Outstanding and nonvested at March 29, 2008 580,090 16.04Granted 217,783 23.03Vested (177,062) 13.67Forfeited (30,118) 20.01 Outstanding and nonvested at March 28, 2009 590,693 19.12Granted 333,746 13.88Vested (202,896) 15.61Forfeited (102,821) 14.06 Outstanding and nonvested at March 27, 2010 618,722 $ 18.28
The total fair value of shares vested during fiscal years 2010, 2009 and 2008 was $3.2 million, $2.4 million and $1.3 million, respectively. Share-based compensation expense recognized and included in “Selling, general and administrative expenses” in the Consolidated Statements of Earnings and related tax benefits were as follows: (In thousands) 2010 2009 2008 Stock options $ 1,067 $ 1,841 $ 821 Restricted stock 3,560 3,037 2,192 Tax benefits (1,792 ) (1,976 ) (1,094 ) $ 2,835 $ 2,902 $ 1,919 As of March 27, 2010, total unrecognized compensation cost related to nonvested share-based awards granted under the stock incentive plans was $1.6 million for stock options and $7.9 million for restricted stock. The remaining compensation costs not yet recognized are expected to be recognized over a weighted average period of 2.2 years for stock options and 3.0 years for restricted stock. Spartan Stores recognized tax deductions of $3.3 million, $5.4 million and $5.2 million related to the exercise of stock options and the vesting of restricted stock during fiscal years 2010, 2009 and 2008, respectively. Spartan Stores has a stock bonus plan covering 300,000 shares of Spartan Stores common stock. Under the provisions of this plan, certain officers and key associates of Spartan Stores may elect to receive a portion of their annual bonus in common stock rather than cash and will be granted additional shares of common stock worth 30% of the portion of the bonus they elect to receive in stock. Compensation expense is recorded based upon the market price of the stock as of the measurement date. At March 27, 2010, 118,156 shares remained unissued under the plan.

SPARTAN STORES, INC. AND SUBSIDIARIES NOTES TO CONSOLIDATED FINANCIAL STATEMENTS
-75-
Spartan Stores has an associate stock purchase plan covering 200,000 shares of Spartan Stores common stock. The plan provides that associates of Spartan Stores and its subsidiaries may purchase shares at 95% of the fair market value. At March 27, 2010, 2,045 shares had been issued under the plan. Note 14 Supplemental Cash Flow Information Non-cash financing activities include the issuance of restricted stock to employees and directors of $4.6 million, $5.0 million and $4.8 million for fiscal years 2010, 2009 and 2008, respectively. Non-cash investing and financing activities include capital leases and notes payable of $7.6 million, $0.3 million and $7.6 million for fiscal years 2010, 2009 and 2008, respectively. Non-cash investing activities also include capital expenditures included in accounts payable of $2.3 million, $3.8 million and $7.0 million for fiscal years 2010, 2009 and 2008. Note 15 Discontinued Operations Certain of our retail and grocery distribution operations have been recorded as discontinued operations. Results of the discontinued operations are excluded from the accompanying notes to the condensed consolidated financial statements for all periods presented, unless otherwise noted. During the second quarter of fiscal year 2008, Spartan Stores decided to close five The Pharm stores and one Felpausch Xpressmart. The decision to close the stores was based on a comprehensive evaluation of the stores’ performance trends, long-term growth prospects, on-going capital requirements and lease expiration dates. As Spartan Stores will have no continuing interest in the operations of these stores, they have been classified as discontinued operations for all years presented. Prescription lists and pharmacy inventories were sold for $4.7 million, and asset impairment charges of $0.9 million were recognized. The stores were closed early in the third quarter of fiscal 2008. During the fourth quarter of fiscal year 2008, Spartan Stores approved a plan to close the remaining 14 The Pharm stores and sell the prescription files. In the first quarter of fiscal 2009, Spartan Stores completed the closure and disposition of the prescription files of 13 of the 14 remaining The Pharm stores, allowing Spartan Stores to concentrate efforts and resources on business opportunities with the best long-term growth potential and focus more on core distribution and conventional supermarket operations. In the second quarter of fiscal 2009, the closure and disposition of the prescription file of the last remaining store was completed. Total net cash proceeds of $13.8 million were received during fiscal 2008. Asset impairment charges and exit costs of $5.6 million were also recognized (Note 5). The following table details the results of discontinued operations reported on the Consolidated Statements of Earnings: (In thousands) March 27,
2010
March 28,2009
March 29,2008
Loss from discontinued operations (net of taxes of $159, $4,204 and $90) $ (375) $ (6,380) $ (93)Gain on disposal of discontinued operations (net of taxes of $5,415 and $1,027) - 8,218 1,888 Total earnings from discontinued operations $ (375) $ 1,838 $ 1,795

SPARTAN STORES, INC. AND SUBSIDIARIES NOTES TO CONSOLIDATED FINANCIAL STATEMENTS
-76-
Sales of discontinued operations for fiscal years 2010, 2009 and 2008 were $0.0 million, $22.3 million and $139.2 million, respectively. Significant assets and liabilities of discontinued operations are as follows: (In thousands) March 27, 2010 March 28, 2009 Current assets $ 74 $ 169Property, net 5,007 5,627Other long-term assets 434 36Current liabilities 1,447 4,256Long-term liabilities 951 2,342 Note 16 Reporting Segment Information Spartan Stores has two reportable segments. The Distribution segment supplies independent retail customers and its own retail stores with dry grocery, produce, dairy, meat, delicatessen, bakery, beverages, frozen food, seafood, floral, general merchandise, pharmacy and health and beauty care items. Sales to independent retail customers and inter-segment sales are recorded based upon a “cost plus” model for grocery, frozen, dairy, pharmacy and health and beauty care items and a “variable mark-up” model for meat, deli, bakery, produce, seafood, floral and general merchandise products. To supply its wholesale customers, Spartan Stores operates a fleet of tractors, conventional trailers and refrigerated trailers, substantially all of which are leased by Spartan Stores. The Retail segment operates supermarkets in Michigan that typically offer dry grocery, produce, frozen, dairy, meat, beverages, floral, seafood, health and beauty care, delicatessen and bakery goods. Approximately 69% of the stores offer pharmacy services and 24 fuel centers were in operation as of March 27, 2010. Identifiable assets represent total assets directly associated with the reporting segments. Eliminations in assets identified to segments include intercompany receivables, payables and investments.
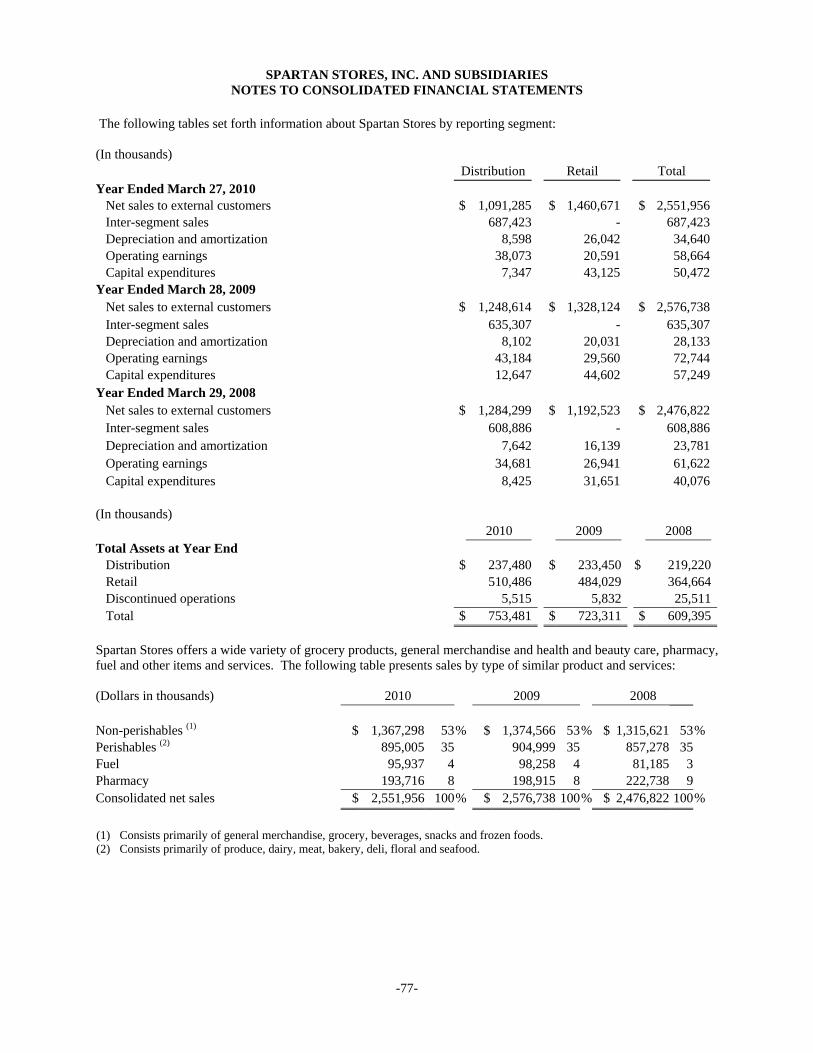
SPARTAN STORES, INC. AND SUBSIDIARIES NOTES TO CONSOLIDATED FINANCIAL STATEMENTS
-77-
The following tables set forth information about Spartan Stores by reporting segment: (In thousands) Distribution Retail Total Year Ended March 27, 2010 Net sales to external customers $ 1,091,285 $ 1,460,671 $ 2,551,956 Inter-segment sales 687,423 - 687,423 Depreciation and amortization 8,598 26,042 34,640 Operating earnings 38,073 20,591 58,664 Capital expenditures 7,347 43,125 50,472Year Ended March 28, 2009 Net sales to external customers $ 1,248,614 $ 1,328,124 $ 2,576,738 Inter-segment sales 635,307 - 635,307 Depreciation and amortization 8,102 20,031 28,133 Operating earnings 43,184 29,560 72,744 Capital expenditures 12,647 44,602 57,249Year Ended March 29, 2008 Net sales to external customers $ 1,284,299 $ 1,192,523 $ 2,476,822 Inter-segment sales 608,886 - 608,886 Depreciation and amortization 7,642 16,139 23,781 Operating earnings 34,681 26,941 61,622 Capital expenditures 8,425 31,651 40,076 (In thousands) 2010 2009 2008 Total Assets at Year End Distribution $ 237,480 $ 233,450 $ 219,220 Retail 510,486 484,029 364,664 Discontinued operations 5,515 5,832 25,511 Total $ 753,481 $ 723,311 $ 609,395
Spartan Stores offers a wide variety of grocery products, general merchandise and health and beauty care, pharmacy, fuel and other items and services. The following table presents sales by type of similar product and services: (Dollars in thousands) 2010 2009 2008 Non-perishables (1) $ 1,367,298 53% $ 1,374,566 53 % $ 1,315,621 53%Perishables (2) 895,005 35 904,999 35 857,278 35 Fuel 95,937 4 98,258 4 81,185 3 Pharmacy 193,716 8 198,915 8 222,738 9 Consolidated net sales $ 2,551,956 100% $ 2,576,738 100 % $ 2,476,822 100%
(1) Consists primarily of general merchandise, grocery, beverages, snacks and frozen foods. (2) Consists primarily of produce, dairy, meat, bakery, deli, floral and seafood.

SPARTAN STORES, INC. AND SUBSIDIARIES NOTES TO CONSOLIDATED FINANCIAL STATEMENTS
-78-
Note 17 Quarterly Financial Information (unaudited) Earnings per share amounts for each quarter are required to be computed independently and may not equal the amount computed for the total year. Common stock prices are the high and low sales prices for transactions reported on the NASDAQ Global Select Market for each period.
(In thousands, except per share data) Fiscal 2010 Full Year
(52 weeks) 4th Quarter(12 weeks)
3rd Quarter(16 weeks)
2nd Quarter (12 weeks)
1st Quarter(12 weeks)
Net sales $ 2,551,956 $ 558,777 $ 786,930 $ 610,222 $ 596,027 Gross margin 558,650 126,132 165,491 136,013 131,014 Restructuring and asset impairment
costs
6,154 4,838 715 - 601 Earnings from continuing operations
before income taxes
42,408 5,082 8,533 17,342 11,451 Earnings from continuing operations 25,933 3,331 5,261 10,497 6,844 Discontinued operations, net of taxes (375) (95) (232) (63) 15 Net earnings 25,558 3,236 5,029 10,434 6,859 Earnings from continuing operations per share:
Basic $ 1.16 $ 0.15 $ 0.23 $ 0.47 $ 0.31 Diluted 1.15 0.15 0.23 0.47 0.31 Net earnings per share: Basic $ 1.14 $ 0.14 $ 0.22 $ 0.47 $ 0.31 Diluted 1.14 0.14 0.22 0.46 0.31 Dividends paid $ 4,483 $ 1,116 $ 2,246 $ - $ 1,121Common stock price – High 17.02 15.03 15.70 15.06 17.02Common stock price – Low 11.54 12.08 13.11 11.78 11.54
(In thousands, except per share data)
Fiscal 2009 Full Year 4th Quarter 3rd Quarter 2nd Quarter 1st Quarter (52 weeks) (12 weeks) (16 weeks) (12 weeks) (12 weeks)
Net sales $ 2,576,738 $ 581,254 $ 781,949 $ 626,830 $ 586,705 Gross margin 536,113 135,625 157,440 127,518 115,530 Earnings from continuing operations
before income taxes
58,947 13,612 13,840 19,568 11,927 Earnings from continuing operations 35,033 8,200 8,086 11,599 7,148 Discontinued operations, net of taxes 1,838 230 229 (963) 2,342 Net earnings 36,871 8,430 8,315 10,636 9,490 Earnings from continuing operations per share:
Basic $ 1.59 $ 0. 37 $ 0.37 $ 0.52 $ 0.32 Diluted 1.57 0.37 0.36 0.52 0.32 Net earnings per share: Basic $ 1.67 $ 0.38 $ 0.38 $ 0.48 $ 0.43 Diluted 1.66 0.38 0.37 0.48 0.43 Dividends paid $ 4,428 $ 1,111 $ 2,212 $ - $ 1,105Common stock price – High 27.26 22.38 27.26 25.87 24.53Common stock price – Low 12.25 12.25 20.40 22.04 18.24
-79-
Item 9. Changes in and Disagreements With Accountants on Accounting and Financial Disclosure Not applicable.
Item 9A. Controls and Procedures
Disclosure Controls and Procedures An evaluation of the effectiveness of the design and operation of Spartan Stores’ disclosure controls and
procedures (as currently defined in Rule 13a-15(e) under the Securities Exchange Act of 1934) was performed as of March 27, 2010 (the “Evaluation Date”). This evaluation was performed under the supervision and with the participation of Spartan Stores’ management, including its Chief Executive Officer (“CEO”) and Chief Financial Officer (“CFO”). As of the Evaluation Date, Spartan Stores’ management, including the CEO and CFO, concluded that Spartan Stores’ disclosure controls and procedures were effective as of the Evaluation Date to ensure that material information required to be disclosed in the reports that we file or submit under the Exchange Act is recorded, processed, summarized and reported within the time periods specified by the Securities and Exchange Commission’s rules and forms. Disclosure controls and procedures include, without limitation, controls and procedures designed to ensure that information required to be disclosed in the reports that we file or submit under the Securities and Exchange Act of 1934 is accumulated and communicated to management, including our principal executive and principal financial officers as appropriate to allow for timely decisions regarding required disclosure.
Management’s Report on Internal Control Over Financial Reporting
The management of Spartan Stores, including the Chief Executive Officer and the Chief Financial Officer, is
responsible for establishing and maintaining adequate internal control over financial reporting, as defined in Rules 13a-15(f) and 15d-15(f) under the Securities Exchange Act of 1934. Spartan Stores’ internal controls were designed by, or under the supervision of, the Chief Executive Officer and Chief Financial Officer, and effected by the Company’s Board of Directors, management and other personnel, to provide reasonable assurance regarding the reliability of its financial reporting and the preparation and presentation of the consolidated financial statements for external purposes in accordance with accounting principles generally accepted in the United States and includes those policies and procedures that (1) pertain to the maintenance of records that in reasonable detail accurately and fairly reflect the transactions and dispositions of the assets of Spartan Stores; (2) provide reasonable assurance that transactions are recorded as necessary to permit preparation of financial statements in accordance with generally accepted accounting principles, and that receipts and expenditures of Spartan Stores are being made only in accordance with authorizations of management and directors of Spartan Stores; and (3) provide reasonable assurance regarding prevention or timely detection of unauthorized acquisition, use or disposition of Spartan Stores’ assets that could have a material effect on the financial statements.
Management of Spartan Stores conducted an evaluation of the effectiveness of its internal controls over financial reporting based on the framework in Internal Control—Integrated Framework issued by the Committee of Sponsoring Organizations of the Treadway Commission. This evaluation included review of the documentation of controls, evaluation of the design effectiveness of controls, testing of the operating effectiveness of controls and a conclusion on this evaluation. Through this evaluation, management did not identify any material weakness in the Company’s internal control. There are inherent limitations in the effectiveness of any system of internal control over financial reporting. Based on the evaluation, management has concluded that Spartan Stores’ internal control over financial reporting was effective as of March 27, 2010.
The registered public accounting firm that audited the consolidated financial statements included in this Form 10-
K Annual Report has issued an attestation report on the effectiveness of the Company’s internal control over financial reporting as of March 27, 2010 as stated in their report on the following page.

80
Report of Independent Registered Public Accounting Firm
To the Board of Directors and Shareholders of Spartan Stores, Inc. and subsidiaries Grand Rapids, Michigan
We have audited the internal control over financial reporting of Spartan Stores, Inc. and subsidiaries (the “Company”) as of March 27, 2010, based on criteria established in Internal Control—Integrated Framework issued by the Committee of Sponsoring Organizations of the Treadway Commission. The Company’s management is responsible for maintaining effective internal control over financial reporting and for its assessment of the effectiveness of internal control over financial reporting, included in the accompanying Management’s Report on Internal Control Over Financial Reporting. Our responsibility is to express an opinion on the Company’s internal control over financial reporting based on our audit.
We conducted our audit in accordance with the standards of the Public Company Accounting Oversight Board (United States). Those standards require that we plan and perform the audit to obtain reasonable assurance about whether effective internal control over financial reporting was maintained in all material respects. Our audit included obtaining an understanding of internal control over financial reporting, assessing the risk that a material weakness exists, testing and evaluating the design and operating effectiveness of internal control based on the assessed risk, and performing such other procedures as we considered necessary in the circumstances. We believe that our audit provides a reasonable basis for our opinion.
A company’s internal control over financial reporting is a process designed by, or under the supervision of, the company’s principal executive and principal financial officers, or persons performing similar functions, and effected by the company’s board of directors, management, and other personnel to provide reasonable assurance regarding the reliability of financial reporting and the preparation of financial statements for external purposes in accordance with generally accepted accounting principles. A company’s internal control over financial reporting includes those policies and procedures that (1) pertain to the maintenance of records that, in reasonable detail, accurately and fairly reflect the transactions and dispositions of the assets of the company, (2) provide reasonable assurance that transactions are recorded as necessary to permit preparation of financial statements in accordance with generally accepted accounting principles, and that receipts and expenditures of the company are being made only in accordance with authorizations of management and directors of the company, and (3) provide reasonable assurance regarding prevention or timely detection of unauthorized acquisition, use, or disposition of the company’s assets that could have a material effect on the financial statements.
Because of the inherent limitations of internal control over financial reporting, including the possibility of collusion or improper management override of controls, material misstatements due to error or fraud may not be prevented or detected on a timely basis. Also, projections of any evaluation of the effectiveness of the internal control over financial reporting to future periods are subject to the risk that the controls may become inadequate because of changes in conditions, or that the degree of compliance with the policies or procedures may deteriorate.
In our opinion, the Company maintained, in all material respects, effective internal control over financial reporting as of March 27, 2010, based on the criteria established in Internal Control–Integrated Framework issued by the Committee of Sponsoring Organizations of the Treadway Commission.
We have also audited, in accordance with the standards of the Public Company Accounting Oversight Board (United States), the consolidated financial statements as of and for the year ended March 27, 2010 of the Company and our report dated May 13, 2010, expressed an unqualified opinion on those consolidated financial statements. /s/ Deloitte & Touche LLP Grand Rapids, Michigan May 13, 2010

81
Changes in Internal Controls Over Financial Reporting
During the last fiscal quarter, there was no change in Spartan Stores’ internal control over financial reporting that
has materially affected, or is reasonably likely to materially affect, Spartan Stores’ internal control over financial reporting.
Item 9B. Other Information None.

82
PART III
Item 10. Directors, Executive Officers and Corporate Governance The information required by this item is here incorporated by reference from the sections titled “The Board of Directors,” “Spartan Stores’ Executive Officers,” “Section 16(a) Beneficial Ownership Reporting Compliance,” “Corporate Governance Principles,” and “Transactions with Related Persons” in Spartan Stores’ definitive proxy statement relating to its annual meeting of shareholders to be held in 2010. Item 11. Executive Compensation
The information required by this item is here incorporated by reference from the sections entitled “Executive Compensation,” “Potential Payments Upon Termination or Change in Control,” “Compensation of Directors,” “Compensation Committee Interlocks and Insider Participation” and “Compensation Committee Report” in Spartan Stores’ definitive proxy statement relating to its annual meeting of shareholders to be held in 2010. Item 12. Security Ownership of Certain Beneficial Owners and Management and Related
Stockholder Matters
The information required by this item is here incorporated by reference from the sections titled “Ownership of Spartan Stores Stock” in Spartan Stores’ definitive proxy statement relating to its annual meeting of shareholders to be held in 2010. The following table provides information about Spartan Stores’ equity compensation plans regarding the number of securities to be issued under these plans, the weighted-average exercise prices of options outstanding under these plans and the number of securities available for future issuance as of the end of fiscal 2010.
EQUITY COMPENSATION PLANS
Plan Category
Number of securities to be issued upon exercise of outstanding options,
warrants and rights
Weighted-average exercise price of
outstanding options, warrants and rights
Number of securities remaining available for future issuance
under equity compensation plans (excluding securities reflected in column
(a)) (a) (b) (c) Equity compensation
plans approved by security holders (1)
831,943 $ 17.39 1,347,649 Equity compensation
plans not approved by security holders
0
Not applicable
0 Total 831,943 $ 17.39 1,347,649
83
(1) Consists of the Spartan Stores, Inc. 1991 Stock Option Plan, the Spartan Stores, Inc. 2001 Stock Incentive Plan, the Spartan Stores, Inc. 2001 Stock Bonus Plan, and the Stock Incentive Plan of 2005. Stock options may no longer be issued under the 1991 Stock Option Plan. The numbers of shares reflected in column (c) in the table above with respect to the Stock Incentive Plan of 2005 (1,155,823 shares), the 2001 Stock Incentive Plan (73,670 shares) and the 2001 Stock Bonus Plan (118,156 shares) represent shares that may be issued other than upon the exercise of an option, warrant or right. Each plan listed above contains customary anti-dilution provisions that are applicable in the event of a stock split or certain other changes in Spartan Stores’ capitalization.
Item 13. Certain Relationships and Related Transactions, and Director Independence
The information required by this item is here incorporated by reference from the section titled “Transactions with Related Persons” and the table captioned “Board of Directors Committee Membership” in Spartan Stores’ definitive proxy statement relating to its annual meeting of shareholders to be held in 2010. Item 14. Principal Accountant Fees and Services
The information required by this item is here incorporated by reference from the section titled “Independent
Auditors” in Spartan Stores’ definitive proxy statement relating to its annual meeting of shareholders to be held in 2010.
84
PART IV Item 15. Exhibits and Financial Statement Schedules (a) The following documents are filed as part of this Report: 1. Financial Statements. A. In Item 8. Reports of Independent Registered Public Accounting Firm of Deloitte & Touche LLP
dated May 13, 2010 Consolidated Balance Sheets at March 27, 2010 and March 28, 2009 Consolidated Statements of Earnings for each of the three years in the period ended
March 27, 2010 Consolidated Statements of Shareholders’ Equity for each of the three years in the period
ended March 27, 2010 Consolidated Statements of Cash Flows for each of the three years in the period ended
March 27, 2010 Notes to Consolidated Financial Statements 2. Financial Statement Schedules. Schedules are omitted because the required information is either inapplicable or presented in the
consolidated financial statements or related notes. 3. Exhibits. Exhibit Number
Document
2.1 Asset Purchase Agreement dated December 17, 2005, by and among Family Fare LLC, Prevo’s
Family Markets, Inc., D&W Food Centers, Inc., and D&W Associate Resources, LLC. Previously filed as an exhibit to Spartan Stores’ Current Report on Form 8-K, filed December 22, 2005. Here incorporated by reference. Exhibits and schedules to this agreement are listed and identified in theagreement. Omitted exhibits and schedules will be furnished supplementally to the Commissionupon request.
2.2 First Amendment to Asset Purchase Agreement dated March 24, 2006 by and among Family Fare
LLC, Prevo’s Family Markets, Inc., D&W Food Centers, Inc., and D&W Associate Resources,LLC. Previously filed as an exhibit to Spartan Stores’ Current Report on Form 8-K, filed March 30, 2006. Here incorporated by reference. Exhibits and schedules to this agreement are listed andidentified in the agreement. Omitted exhibits and schedules will be furnished supplementally to theCommission upon request.

85
Exhibit Number
Document
2.3 Asset Purchase Agreement, dated March 19, 2007, by and among G&R Felpausch Company, Felpausch Food Centers, LLC, Hastings Catalog Sales, Inc., and Felpausch Kalamazoo, LLC asSeller, and Family Fare, LLC, Prevo’s Family Markets, Inc., MSFC, LLC, and Spartan Stores Fuel,LLC as Purchaser, previously filed as an exhibit to Spartan Stores’ Current Report on Form 8-K, as filed March 23, 2007. Here incorporated by reference. Exhibits and schedules to this agreement are listed and identified in the agreement. Omitted exhibits and schedules will be furnishedsupplementally to the Commission upon request.
2.4 Third Amendment to the Asset Purchase Agreement, dated June 15, 2007, by and among G&R
Felpausch Company, Felpausch Food Centers, LLC, Hastings Catalog Sales, Inc., FelpauschKalamazoo, LLC, and Felpausch-Kelly, L.L.C. as Seller, and Family Fare, LLC, Prevo’s FamilyMarkets, Inc., MSFC, LLC, and Spartan Stores Fuel, LLC as Purchaser, previously filed as anexhibit to Spartan Stores’ Current Report on Form 8-K, filed June 21, 2007. Here incorporated by reference. Exhibits and schedules to this agreement are listed and identified in the agreement.Omitted exhibits and schedules will be furnished supplementally to the Commission upon request.
2.5 Asset Purchase Agreement dated March 31, 2008 between Rite Aid of Ohio, Inc. and Seaway Food
Town, Inc. Previously filed as an exhibit to Spartan Stores’ Annual Report on Form 10-K for the fiscal year ended March 29, 2008. Here incorporated by reference. Exhibits and schedules to this agreement are listed and identified in the agreement. Omitted exhibits and schedules will befurnished supplementally to the Commission upon request.
2.6 Asset Purchase Agreement dated October 13, 2008 by and among V.G.’s Food Center, Inc. and
VG’s Pharmacy, Inc. as Seller and Family Fare, LLC as Purchaser. Previously filed as an exhibitto Spartan Stores’ Current Report on Form 8-K filed October 15, 2008. Here incorporated by reference. Exhibits and schedules to this agreement are listed and identified in the agreement.Omitted exhibits and schedules will be furnished supplementally to the Commission upon request.
3.1 Amended and Restated Articles of Incorporation of Spartan Stores, Inc. Previously filed as an
exhibit to Spartan Stores’ Quarterly Report on Form 10-Q for the quarter ended September 10, 2005. Here incorporated by reference.
3.2 Amended and Restated Bylaws of Spartan Stores, Inc. Previously filed as an exhibit to Spartan
Stores’ Current Report on Form 8-K on August 20, 2007. Here incorporated by reference. 4.1 Indenture by and between Spartan Stores, Inc. and The Bank of New York Trust Company, N.A. as
Trustee dated as of May 30, 2007. Previously filed as an exhibit to Spartan Stores’ Current Reporton Form 8-K, filed May 30, 2007. Here incorporated by reference.
4.2 Registration Rights Agreement among Spartan Stores, Inc. and Banc of America Securities LLC
and Bear, Stearns & Co., Inc., as representatives of the Initial Purchasers named therein dated as ofMay 30, 2007. Previously filed as an exhibit to Spartan Stores’ Current Report on Form 8-K, filed May 30, 2007. Here incorporated by reference.
4.3 Form of 3.375% Convertible Senior Note due 2027. Previously filed as an exhibit to Spartan
Stores’ Current Report on Form 8-K, filed May 30, 2007. Here incorporated by reference. 10.1 Purchase Agreement by and among Spartan Stores, Inc. and the Initial Purchasers named therein
dated as of May 23, 2007. Previously filed as an exhibit to Spartan Stores’ Annual Report on Form10-K for the year ended March 28, 2009. Here incorporated by reference.

86
Exhibit Number
Document
10.2 Loan and Security Agreement dated December 23, 2003, by and among Spartan Stores, Inc. andcertain subsidiaries as borrowers, Congress Financial Corporation (Central) as agent, the lenders named therein as lenders, and joined in by certain subsidiaries of Spartan Stores, Inc. as guarantors.Previously filed as an exhibit to Spartan Stores’ Annual Report on Form 10-K for the year ended March 28, 2009. Here incorporated by reference.
10.3 Amendment No. 2 to Loan and Security Agreement dated December 22, 2004, between Spartan
Stores, Inc. and its subsidiaries and Congress Financial Corporation, Key Bank NationalAssociation, Fleet Capital Corporation, National City Business Credit, General Electric Capital Corporation, and Fifth Third Bank. Previously filed as an exhibit to Spartan Stores’ Quarterly Report on Form 10-Q for the quarter ended January 1, 2005. Here incorporated by reference.
10.4 Amendment No. 3 to Loan and Security Agreement dated December 9, 2005 between Spartan
Stores, Inc. and its subsidiaries and Wachovia Capital Finance Corporation (Central), Key BankNational Association, Bank of America Leasing & Capital, LLC, National City Business Credit,General Electric Capital Corporation, and Fifth Third Bank. Previously filed as an exhibit toSpartan Stores’ Current Report on Form 8-K, filed December 12, 2005. Here incorporated by reference.
10.5 Amendment No. 4 to Loan and Security Agreement dated March 17, 2006 between Spartan Stores,
Inc. and its subsidiaries and Wachovia Capital Finance Corporation (Central), Key Bank NationalAssociation, Bank of America Leasing & Capital, LLC, National City Business Credit, GeneralElectric Capital Corporation, and Fifth Third Bank. Previously filed as an exhibit to Spartan Stores’ Current Report on Form 8-K, filed March 23, 2006. Here incorporated by reference.
10.6 Amendment No. 5 to Loan and Security Agreement dated April 5, 2007 between Spartan Stores,
Inc. and its subsidiaries and Wachovia Capital Finance Corporation (Central), Key Bank NationalAssociation, Bank of America Leasing & Capital, LLC, National City Business Credit, GeneralElectric Capital Corporation, and Fifth Third Bank. Previously filed as an exhibit to Spartan Stores’ Current Report on Form 8-K, filed April 11, 2007. Here incorporated by reference.
10.7 Amendment No. 6 to Loan and Security Agreement dated May 22, 2007 between Spartan Stores,
Inc. and its subsidiaries and Wachovia Capital Finance Corporation (Central), Key Bank National Association, Bank of America N.A., National City Business Credit, Inc., General Electric CapitalCorporation, and Fifth Third Bank. Previously filed as an exhibit to Spartan Stores’ Annual Reporton Form 10-K for the year ended March 28, 2009. Here incorporated by reference.
10.8 Amendment No. 7 to Loan and Security Agreement dated May 20, 2009 between Spartan Stores,
Inc. and subsidiaries and Wachovia Capital Finance Corporation (Central), Key Bank NationalAssociation, Bank of America N.A., National City Business Credit, Inc., General Electric CapitalCorporation, and Fifth Third Bank. Previously filed as an exhibit to Spartan Stores’ Current Reporton Form 8-K filed May 22, 2009. Here incorporated by reference.
10.9 Swap Transaction Confirmation. Previously filed as an exhibit to Spartan Stores’ Current Report
on Form 8-K on January 8, 2009. Here incorporated by reference. 10.10 Letter Agreement between Spartan Stores, Inc. and Wachovia Capital Finance Corporation
(Central) as Agent for the Lenders, dated August 17, 2007. Previously filed as an exhibit toSpartan Stores’ Current Report on Form 8-K, filed August 17, 2007. Here incorporated by reference.
10.11* Spartan Stores, Inc. Annual Executive Incentive Plan of 2005. Previously filed as Appendix A to
Spartan Stores’ 2005 Proxy Statement filed on June 24, 2005. Here incorporated by reference.This plan will expire by its term on the date of the Annual Meeting of Shareholders to be held in2010.

87
Exhibit Number
Document
10.12* Spartan Stores, Inc. Stock Incentive Plan of 2005, as amended 10.13 Determination of Compensation Committee pursuant to the Spartan Stores, Inc. Stock Incentive
Plan of 2005. Previously filed as an exhibit to Spartan Stores’ Current Report on Form 8-K on August 3, 2009. Here incorporated by reference.
10.14* Spartan Stores, Inc. 1991 Stock Option Plan, as amended. Previously filed as an exhibit to Spartan
Stores’ Registration Statement on Form S-3 filed January 12, 2001. Here incorporated by reference. 10.15* Spartan Stores, Inc. Supplemental Executive Retirement Plan, as amended. 10.16* Spartan Stores, Inc. Supplemental Executive Savings Plan. Previously filed as an exhibit to Spartan
Stores Form S-8 Registration Statement filed on December 21, 2001. Here incorporated by reference.
10.17* Spartan Stores, Inc. 2000 Annual Incentive Plan. Previously filed as an exhibit to Spartan Stores’
Annual Report on Form 10-K for the year ended March 31, 2007. Here incorporated by reference. This plan expired by its term on March 27, 2010.
10.18* Spartan Stores, Inc. 2001 Stock Incentive Plan. Previously filed as an exhibit to Spartan Stores’
Annual Report on Form 10-K for the year ended March 31, 2007. Here incorporated by reference. 10.19* Form of Stock Option Grant to officers, dated May 15, 2009. Previously filed as an exhibit to
Spartan Stores’ Quarterly Report on Form 10-Q for the quarter ended June 20, 2009. Here incorporated by reference.
10.20* Form of Restricted Stock Award to officers, dated May 15, 2009. Previously filed as an exhibit to
Spartan Stores’ Quarterly Report on Form 10-Q for the quarter ending June 20, 2009. Here incorporated by reference.
10.21* Form of Restricted Stock Unit Award to officers, dated May 15, 2009. Previously filed as an
exhibit to Spartan Stores’ Quarterly Report on Form 10-Q for the quarter ending June 20, 2009. Here incorporated by reference.
10.22* Form of Restricted Stock Award to outside directors, dated May 15, 2009. Previously filed as an
exhibit to Spartan Stores’ Quarterly Report on Form 10-Q for the quarter ending June 20, 2009. Here incorporated by reference.
10.23* Form of Stock Option Award to outside directors, dated May 15, 2009. Previously filed as an
exhibit to Spartan Stores’ Quarterly Report on Form 10-Q for the quarter ending June 20, 2009. Here incorporated by reference.
10.24* Form of Executive Employment Agreement between Spartan Stores, Inc. and certain executive
officers. Previously filed as an exhibit to Spartan Stores’ Current Report on Form 8-K on December 24, 2008. Here incorporated by reference.
10.25* Form of Executive Severance Agreement between Spartan Stores, Inc. and certain executive
officers. Previously filed as an exhibit to Spartan Stores’ Current Report on Form 8-K on December 24, 2008. Here incorporated by reference.
10.26* Form of Executive Employment Agreement between Spartan Stores, Inc. and Craig C. Sturken.
Previously filed as an exhibit to Spartan Stores’ Current Report on Form 8-K on December 24, 2008. Here incorporated by reference.

88
Exhibit Number
Document
10.27* Form of Executive Severance Agreement between Spartan Stores, Inc. and Craig C. Sturken.Previously filed as an exhibit to Spartan Stores’ Current Report on Form 8-K on December 24, 2008. Here incorporated by reference.
10.28 Amended and Restated Lease, dated as of January 26, 2000, between Plymouth Investors Limited
Liability Company and Spartan Stores Distribution, LLC. Previously filed as an exhibit to Spartan Stores’ Annual Report on Form 10-K for the year ended March 28, 2009. Here incorporated byreference.
12.1 Computation of Ratio of Earnings to Fixed Charges 21 Subsidiaries of Spartan Stores, Inc. 23 Consent of Independent Registered Public Accounting Firm. 24 Powers of Attorney. 31.1 Certification of Chief Executive Officer pursuant to Section 302 of the Sarbanes-Oxley Act of
2002. 31.2 Certification of Chief Financial Officer pursuant to Section 302 of the Sarbanes-Oxley Act of 2002. 32 Certification pursuant to 18 U.S.C. § 1350. This exhibit is furnished, not filed, in accordance with
SEC Release Number 33-8212. * These documents are management contracts or compensation plans or arrangements required to be filed as exhibits to this Form 10-K.

89
SIGNATURES
Pursuant to the requirements of Section 13 or 15(d) of the Securities Exchange Act of 1934, Spartan Stores, Inc.
(the Registrant) has duly caused this report to be signed on its behalf by the undersigned, thereunto duly authorized. SPARTAN STORES, INC.
(Registrant) Date: May 17, 2010 By /s/ Dennis Eidson Dennis Eidson
President and Chief Executive Officer (Principal Executive Officer)
90
Pursuant to the requirements of the Securities Exchange Act of 1934, this report has been signed below by the following persons on behalf of Spartan Stores, Inc. and in the capacities and on the dates indicated. May 17, 2010 By /s/ M. Shan Atkins* M. Shân Atkins
Director May 17, 2010 By /s/ Dennis Eidson Dennis Eidson
President, Chief Executive Officer and Director (Principal Executive Officer)
May 17, 2010 By /s/ Dr. Frank M. Gambino* Dr. Frank M. Gambino
Director May 17, 2010 By /s/ Frederick S. Morganthall, II* Frederick S. Morganthall, II
Director May 17, 2010 By /s/ Elizabeth A. Nickels* Elizabeth A. Nickels
Director May 17, 2010 By /s/ Timothy J. O’Donovan* Timothy J. O’Donovan
Director May 17, 2010 By /s/ Craig C. Sturken* Craig C. Sturken
Executive Chairman and Director May 17, 2010 By /s/ James F. Wright* James F. Wright
Director May 17, 2010 By /s/ David M. Staples David M. Staples
Executive Vice President and Chief Financial Officer (Principal Financial Officer and Accounting Officer)
May 17, 2010 *By /s/ Dennis Eidson Dennis Eidson
Attorney-in-Fact

91
EXHIBIT 31.1
CERTIFICATIONS
I, Dennis Eidson, certify that: 1. I have reviewed this annual report on Form 10-K of Spartan Stores, Inc.; 2. Based on my knowledge, this report does not contain any untrue statement of a material fact or omit to state a material fact necessary to make the statements made, in light of the circumstances under which such statements were made, not misleading with respect to the period covered by this report; 3. Based on my knowledge, the financial statements, and other financial information included in this report, fairly present in all material respects the financial condition, results of operations and cash flows of the registrant as of, and for, the periods presented in this report; 4. The registrant’s other certifying officer and I are responsible for establishing and maintaining disclosure controls and procedures (as defined in Exchange Act Rules 13a-15(e) and 15d-15(e)) and internal control over financial reporting (as defined in Exchange Act Rules 13a-15(f) and 15d-15(f)) for the registrant and have: a) Designed such disclosure controls and procedures, or caused such disclosure controls and procedures to be designed under our supervision, to ensure that material information relating to the registrant, including its consolidated subsidiaries, is made known to us by others within those entities, particularly during the period in which this report is being prepared; b) Designed such internal control over financial reporting, or caused such internal control over financial reporting to be designed under our supervision, to provide reasonable assurance regarding the reliability of financial reporting and the preparation of financial statements for external purposes in accordance with generally accepted accounting principles; c) Evaluated the effectiveness of the registrant’s disclosure controls and procedures and presented in this report our conclusions about the effectiveness of the disclosure controls and procedures, as of the end of the period covered by this report based on such evaluation; and d) Disclosed in this report any change in the registrant’s internal control over financial reporting that occurred during the registrant’s most recent fiscal quarter (the registrant’s fourth fiscal quarter in the case of an annual report) that has materially affected, or is reasonably likely to materially affect, the registrant’s internal control over financial reporting; and 5. The registrant’s other certifying officer and I have disclosed, based on our most recent evaluation of internal control over financial reporting, to the registrant’s auditors and the audit committee of the registrant’s board of directors (or persons performing the equivalent functions): a) All significant deficiencies and material weaknesses in the design or operation of internal control over financial reporting which are reasonably likely to adversely affect the registrant’s ability to record, process, summarize and report financial information; and b) Any fraud, whether or not material, that involves management or other employees who have a significant role in the registrant’s internal control over financial reporting. Dated: May 17, 2010 /s/ Dennis Eidson Dennis Eidson
President and Chief Executive Officer
-1-
EXHIBIT 31.2
CERTIFICATIONS
I, David M. Staples, certify that: 1. I have reviewed this annual report on Form 10-K of Spartan Stores, Inc.; 2. Based on my knowledge, this report does not contain any untrue statement of a material fact or omit to state a material fact necessary to make the statements made, in light of the circumstances under which such statements were made, not misleading with respect to the period covered by this report; 3. Based on my knowledge, the financial statements, and other financial information included in this report, fairly present in all material respects the financial condition, results of operations and cash flows of the registrant as of, and for, the periods presented in this report; 4. The registrant’s other certifying officer and I are responsible for establishing and maintaining disclosure controls and procedures (as defined in Exchange Act Rules 13a-15(e) and 15d-15(e)) and internal control over financial reporting (as defined in Exchange Act Rules 13a-15(f) and 15d-15(f)) for the registrant and have: a) Designed such disclosure controls and procedures, or caused such disclosure controls and procedures to be designed under our supervision, to ensure that material information relating to the registrant, including its consolidated subsidiaries, is made known to us by others within those entities, particularly during the period in which this report is being prepared; b) Designed such internal control over financial reporting, or caused such internal control over financial reporting to be designed under our supervision, to provide reasonable assurance regarding the reliability of financial reporting and the preparation of financial statements for external purposes in accordance with generally accepted accounting principles; c) Evaluated the effectiveness of the registrant’s disclosure controls and procedures and presented in this report our conclusions about the effectiveness of the disclosure controls and procedures, as of the end of the period covered by this report based on such evaluation; d) Disclosed in this report any change in the registrant’s internal control over financial reporting that occurred during the registrant’s most recent fiscal quarter (the registrant’s fourth fiscal quarter in the case of an annual report) that has materially affected, or is reasonably likely to materially affect, the registrant’s internal control over financial reporting; and 5. The registrant’s other certifying officer and I have disclosed, based on our most recent evaluation of internal control over financial reporting, to the registrant’s auditors and the audit committee of the registrant’s board of directors (or persons performing the equivalent functions): a) All significant deficiencies and material weaknesses in the design or operation of internal control over financial reporting which are reasonably likely to adversely affect the registrant’s ability to record, process, summarize and report financial information; and b) Any fraud, whether or not material, that involves management or other employees who have a significant role in the registrant’s internal control over financial reporting. Dated: May 17, 2010 /s/ David M. Staples David M. Staples
Executive Vice President and Chief Financial Officer

-2-
EXHIBIT 32
CERTIFICATION Solely for the purpose of complying with 18 U.S.C. § 1350, each of the undersigned hereby certifies in his capacity as an officer of Spartan Stores, Inc. (the “Company”) that the Annual Report of the Company on Form 10-K for the year ended March 27, 2010 fully complies with the requirements of Section 13(a) of the Securities Exchange Act of 1934 and that information contained in such report fairly presents, in all material respects, the financial condition of the Company at the end of such period and the results of operations of the Company for such period.
/s/ Dennis Eidson Dennis Eidson
President and Chief Executive Officer
/s/ David M. Staples David M. Staples
Executive Vice President and Chief Financial Officer

This page intentionally left blank.
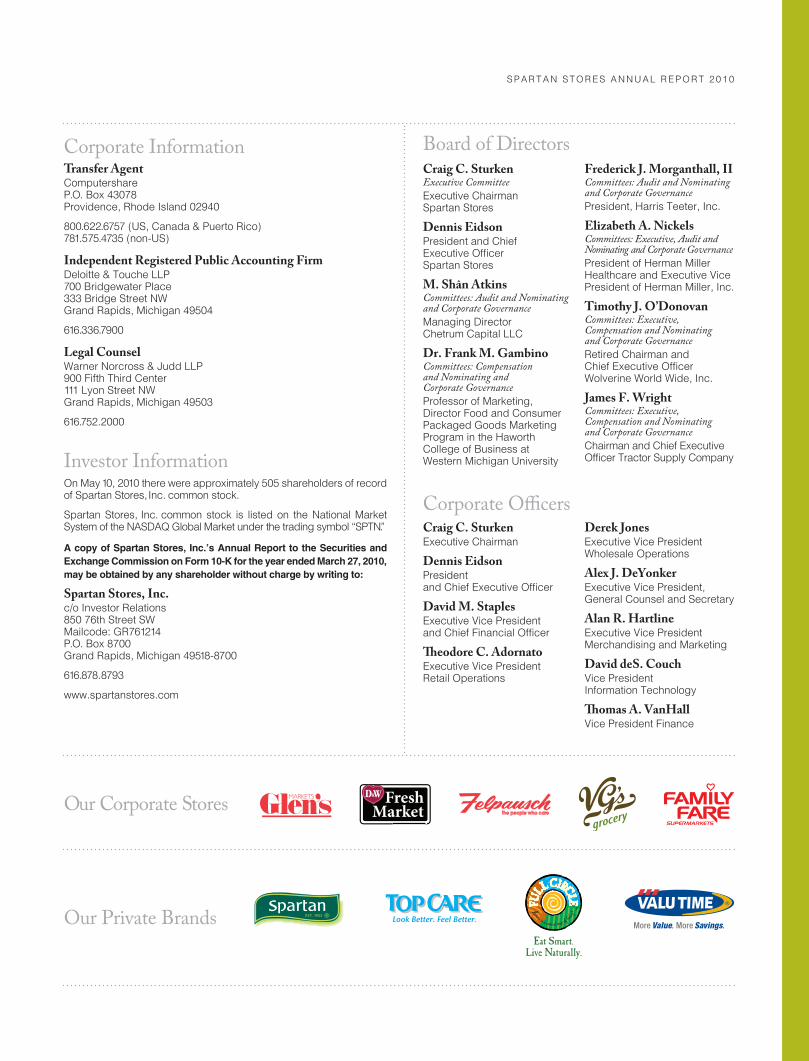
Corporate InformationTransfer AgentComputershare P.O. Box 43078 Providence, Rhode Island 02940
800.622.6757 (US, Canada & Puerto Rico) 781.575.4735 (non-US)
Independent Registered Public Accounting FirmDeloitte & Touche LLP 700 Bridgewater Place 333 Bridge Street NW Grand Rapids, Michigan 49504
616.336.7900
Legal CounselWarner Norcross & Judd LLP 900 Fifth Third Center 111 Lyon Street NW Grand Rapids, Michigan 49503
616.752.2000
Investor InformationOn May 10, 2010 there were approximately 505 shareholders of record of Spartan Stores, Inc. common stock.
Spartan Stores, Inc. common stock is listed on the National Market System of the NASDAQ Global Market under the trading symbol “SPTN.”
A copy of Spartan Stores, Inc.’s Annual Report to the Securities and Exchange Commission on Form 10-K for the year ended March 27, 2010, may be obtained by any shareholder without charge by writing to:
Spartan Stores, Inc.c/o Investor Relations 850 76th Street SW Mailcode: GR761214 P.O. Box 8700 Grand Rapids, Michigan 49518-8700
616.878.8793
www.spartanstores.com
Craig C. SturkenExecutive CommitteeExecutive Chairman Spartan Stores
Dennis EidsonPresident and Chief Executive Officer Spartan Stores
M. Shân AtkinsCommittees: Audit and Nominating and Corporate GovernanceManaging Director Chetrum Capital LLC
Dr. Frank M. GambinoCommittees: Compensation and Nominating and Corporate GovernanceProfessor of Marketing, Director Food and Consumer Packaged Goods Marketing Program in the Haworth College of Business at Western Michigan University
Frederick J. Morganthall, IICommittees: Audit and Nominating and Corporate GovernancePresident, Harris Teeter, Inc.
Elizabeth A. NickelsCommittees: Executive, Audit and Nominating and Corporate GovernancePresident of Herman Miller Healthcare and Executive Vice President of Herman Miller, Inc.
Timothy J. O’DonovanCommittees: Executive, Compensation and Nominating and Corporate GovernanceRetired Chairman and Chief Executive Officer Wolverine World Wide, Inc.
James F. WrightCommittees: Executive, Compensation and Nominating and Corporate GovernanceChairman and Chief Executive Officer Tractor Supply Company
Board of Directors
S P A R T A N S T O R E S A N N U A L R E P O R T 2 0 1 0
Craig C. SturkenExecutive Chairman
Dennis EidsonPresident and Chief Executive Officer
David M. Staples Executive Vice President and Chief Financial Officer
Theodore C. Adornato Executive Vice President Retail Operations
Derek JonesExecutive Vice President Wholesale Operations
Alex J. DeYonkerExecutive Vice President, General Counsel and Secretary
Alan R. HartlineExecutive Vice President Merchandising and Marketing
David deS. Couch Vice President Information Technology
Thomas A. VanHall Vice President Finance
Corporate Officers
Our Corporate Stores
Our Private Brands
Spartan AR 10 Final.indd 4 6/15/2010 9:15:20 AM

8 5 0 7 6 T H S T R E E T S W | P O B O X 8 7 0 0 | G R A N D R A P I D S , M I C H I G A N 4 9 5 1 8w w w . s p a r t a n s t o r e s . c o m
S P A R T A N S T O R E S A N N U A L R E P O R T 2 0 1 0
Spartan AR 10 Final.indd 1 6/15/2010 9:15:19 AM


![Download the report in English [1.48 MB]](https://img.dokumen.tips/doc/110x75/586b9e6e1a28ab2a738bfa3d/download-the-report-in-english-148-mb.jpg)
