Embed Size (px)
Citation preview

Photo:GaryKendrick,Unive
rsity
ofW
este
rnAu
stra
lia


Epibenthic scattering project: design of field operation gear and project summary Prepared by Andrew Woods, Alec Duncan and Alexander Gavrilov With support from Yao-Ting Tseng, Mal Perry, and Rob McCauley
June 2006

Epibenthic scattering project: design of field operation gear and project summary Copyright © 2006: Cooperative Research Centre for Coastal Zone, Estuary and Waterway Management Prepared by Andrew Woods, Alec Duncan and Alexander Gavrilov With support from Yao-Ting Tseng, Mal Perry, and Rob McCauley Published by the Cooperative Research Centre for Coastal Zone, Estuary and Waterway Management (Coastal CRC)
Indooroopilly Sciences Centre 80 Meiers Road Indooroopilly Qld 4068 Australia
www.coastal.crc.org.au The text of this publication may be copied and distributed for research and educational purposes with proper acknowledgment. Photos cannot be reproduced without permission of the authors. Disclaimer: The information in this report was current at the time of publication. While the report was prepared with care by the authors, the Coastal CRC and its partner organisations accept no liability for any matters arising from its contents. National Library of Australia Cataloguing-in-Publication data
Epibenthic Scattering Project: Design of field operation gear and project summary
QNRM06343
ISBN 1 921017 67 8 (print and online)

iii
Acknowledgments The team working on the ESP would like to acknowledge the following
organisations, companies and individuals who have contributed to the project:
• The Cooperative Research Centre for Coastal Zone, Estuary and
Waterway Management (the Coastal CRC)
• Fugro Survey (Cass Castalanelli, Bill Russell-Cargill – Differential
GPS system)
• Sonardata (Tim Pauly – Echoview software)
• University of Melbourne (Mark Shortis – VMS software)
• CSIRO Marine Research (Tony Koslow, Nic Mortimer – loan of TAPS)
• UWA (Euan Harvey, Dave Gull – alignment frame and other support)
• the owners of Jabiru.

iv

v
Contents Acknowledgments...................................................................................................................... iii
1. Introduction ....................................................................................................................... 1
2. Specifications for an improved research and survey system .......................................... 2
General description ................................................................................................... 2
Acoustic system ........................................................................................................ 5
Camera system ......................................................................................................... 6
Data processing ........................................................................................................ 7
Costing ...................................................................................................................... 7
System capabilities and limitations ........................................................................... 9
3. ESP summary ................................................................................................................. 10
Data collected.......................................................................................................... 10
Habitats sampled..................................................................................................... 11
Data processing and analysis method .................................................................... 14
Matlab code and routines ........................................................................................ 17
Results..................................................................................................................... 17
Developed intellectual property............................................................................... 19
4. Future work ..................................................................................................................... 20
Further processing of existing data ......................................................................... 20
Funding options....................................................................................................... 20
5. Conclusion ...................................................................................................................... 22
6. References...................................................................................................................... 23
Milestone reports..................................................................................................... 23
Conference papers.................................................................................................. 23
Theses..................................................................................................................... 24
Appendix A: Specification for BioSonics DT-X Digital Scientific Echosounder ....................... 25
Appendix B: Quotation for BioSonics DT-X system ................................................................ 27
Appendix C: Post-processing software available from BioSonics........................................... 29

vi
List of figures
Figure1. Proposed research system configuration (vessel deployment) .................................. 3
Figure 1. Proposed research system configuration (moored deployment) ............................... 4
Figure 3. Example stereoscopic image of sea grass habitat in Cockburn Sound................... 12
Figure 4. Example stereoscopic image of reef habitat in Cockburn Sound ............................ 13
Figure 5. Example stereoscopic image of bare sand habitat in Cockburn Sound .................. 13
Figure 6. Histogram of the effective pulse width measured at 200 kHz over the
seafloor areas covered by sand and seagrass......................................................... 18
Figure 7. Distribution of 5 classes against first two principal components of PCA ................. 18
List of tables
Table 1. Recommended acoustic frequencies in order of decreasing priority .......................... 5
Table 2. Acoustic system detailed costing ................................................................................ 8
Table 3. Amount and location (under the respective field data directory) of
pre-processed field deployment data ....................................................................... 11
Table 4. GPS coordinates and habitat types for all field deployment locations ...................... 12
Table 5. Main Matlab routines used in ESP data processing.................................................. 17

Epibenthic Scattering Project: Design of field operation gear and project summary
1
1. Introduction The aim of this project was to develop innovative acoustic techniques as tools for
seafloor habitat mapping. To achieve this aim it was recognised that a thorough
understanding of the acoustic backscatter process from epibenthos was required
and this project (ESP – Epibenthic Scattering Project) focused on obtaining this
understanding.
Previous Coastal CRC milestone reports for the ESP (CA2.03, CA3.05, CA4.03,
CA5.04, CA5.04 extension, CA6.03 and CA6.05—see reference listing) have
detailed the research equipment used to gather the required data, the data
processing performed and the results obtained.
From the commencement of the project, the in situ collection of spatially and
temporally coincident optical and acoustic data was considered essential, and
has been the primary requirement for the design of the current research system.
Budget considerations dictated the use of two existing acoustic systems,
essentially unmodified, which resulted in significant limitations to the fidelity of
the acoustic data.
This report details recommendations for the design of an improved field research
system and associated survey system. Brief introductions to these two systems
were given in CA6.05, whereas this report provides more detailed
recommendations.
This report also provides a review and summary of the data collected and
processed so far and options for further work with the data.

Epibenthic Scattering Project: Design of field operation gear and project summary
2
2. Specifications for an improved research and survey system
General description
The mechanical configuration of the proposed research system is shown in
Figures 1 and 2 (from CA6.05 report).
The general principle is to vertically separate the sonar transducers from the
cameras in order to obtain a realistic sonar footprint and minimise problems due
to transducer ring-down, while still placing the cameras within visual range of the
seabed. The design also allows for a significant increase in the separation
between the two stereo cameras and between the cameras and the flash, to give
improved vegetation height measurement accuracy and fewer problems with
optical backscatter.
This design uses wires to suspend a ring frame on which the stereoscopic
cameras and strobe are mounted, several metres below a second frame on
which the sonar transducers and a laser are mounted. The use of wires rather
than a rigid frame makes the system much easier to deploy from a vessel, but
increases the risk of misalignment caused by wave-induced motions or currents.
To combat this problem, a laser mounted alongside the sonar transducers would
provide a visual indication of where the centre of the acoustic beams is in the
images. This laser needs to be of sufficient power to ensure the spot is visible in
a wide range of lighting (ambient and strobe) and vegetation conditions.
The ring frame is of sufficient diameter that it is outside the main beam of the
sonar transducers and has minimal effect on the acoustic signals reaching the
seabed and returning to the sounder transducers. The transducers receive
acoustic backscatter from the ring frame and also from parts of the wire
suspension, but these returns occur much sooner than the seabed reflection
and can easily be time-gated out.
The system can be suspended from a boat, as was done with the current ESP
system, or alternatively it could be moored for longer-term monitoring
experiments as shown in Figure 2. Deploying and recovering the moored system
would be a complicated task that would be greatly assisted by the use of divers.
A boat would need to be anchored near the moored system with the
echosounder processor and data acquisition system on board the vessel.
The survey system should consist entirely of the acoustic component of the
research system. Sonar transducers are fitted directly to the hull of the vessel of

Epibenthic Scattering Project: Design of field operation gear and project summary
3
choice or mounted over the side on a rigid pole, and surveys conducted over the
desired area.
In situations where a different type of epibenthos or a different type of substrate
is sampled, it may be necessary to redeploy the research system to collect
ground-truthing data for that area and refine algorithms.
Sonar transducer mounting frame
Sonar transducers
Alignment laser
Suspension wires
Stereo cameras
Camera mounting ring
Seabed
Deployment rope Wire or rope bridle
Flash
Figure 2. Proposed research system configuration (vessel deployment)

Epibenthic Scattering Project: Design of field operation gear and project summary
4
Sonar transducer mounting frame
Sonar transducers
Alignment laser
Suspension wires
Stereo cameras
Camera mounting ring
Seabed
Subsurface float Wire or rope bridle
Anchors Chains
Flash
Figure 3. Proposed research system configuration (moored deployment)

Epibenthic Scattering Project: Design of field operation gear and project summary
5
Acoustic system
The choice of acoustic frequencies is a compromise between spatial resolution,
depth capability and cost.
For a vertically oriented sounder, depth resolution improves as the frequency is
increased, and consequently the acoustic wavelength is reduced. The
beamwidth of the sonar transducer determines the horizontal resolution and is
proportional to the ratio of the acoustic wavelength to the transducer diameter,
so horizontal resolution also improves as the frequency increases. The same
horizontal resolution can be achieved at a lower frequency, but this requires a
larger, and therefore more expensive, transducer.
The disadvantage of using a high acoustic frequency is that the absorption of
acoustic energy increases with increasing frequency, which results in a reduced
maximum range for the sonar.
Another consideration is the scattering characteristics of the target. Most
acoustic scatterers have a scattering strength that varies with frequency, so
measurements at multiple frequencies can provide useful classification
information.
These considerations, together with consideration of the options available from
the different manufacturers led to a recommendation that the sonar system be
based on the BioSonics DT-X digital scientific echosounder with the frequencies
shown in Table 1.
Table 1. Recommended acoustic frequencies in order of decreasing priority
Priority Frequency (kHz) 1 200 2? 420 3? 120 4 70 5 38
The choice between 420 kHz and 120 kHz for the second priority depends on the
depth range over which the system is likely to be deployed. 420 kHz would be
preferred for deployments where the sonar is within 50 m of the seabed (i.e. for
the research system), whereas 120 kHz would be better for a survey system
operating in water depths to several hundred metres. The preferred option for a
system with maximum flexibility would be to include both of these frequencies.
Epibenthic Scattering Project: Design of field operation gear and project summary
6
From a scientific point of view, the more acoustic frequencies deployed the
better, with two being considered the absolute minimum. The number of
frequencies actually used therefore comes down to a matter of cost. As a guide,
the overall cost for a single frequency (200kHz) DT-X system (February 2006) is
approximately US$40 000 and the incremental cost of adding frequencies is
approximately US$11 000 per frequency.
These costs are for single beam transducers, which are fine for this application.
Split beam transducers are also available (at slightly more than double the single
beam cost) and are useful when a range cell typically contains a single acoustic
target. This is often the case in fisheries acoustics, in which case the split beam
transducer allows the location of the fish in the beam to be determined so that
the measured target strength can be corrected for the transducer beam pattern.
Specifications for the DT-X system are given in Appendix A, and a detailed quote
(February 2006) is given in Appendix B.
Camera system
The existing ESP stereoscopic camera system uses a pair of Canon S50 five
mega-pixel digital still cameras mounted with a separation of 75 mm between
lenses. The cameras are fired remotely by way of the WEM (wet-end
microcontroller) and firing is synchronised to within 10 ms. In the proposed new
research system the physical separation of the two cameras would be increased,
as shown in Figures 1 and 2. This would increase the measurement accuracy in
the range axis.
One aspect that would enhance the usability of the camera system would be to
enable full data communication with the cameras via the umbilical. The cameras
are currently remotely fired; however, it is not possible to modify the settings of
the cameras while they are deployed. Remote communication with the cameras
(e.g. via USB) could allow full resolution test images to be directly downloaded
from the cameras while deployed for image quality checking purposes, and
optimisation of image capture settings (aperture, shutter period, focus and gain).
Digital still camera technology is advancing at a significant rate and it is possible
that future cameras may offer useful advantages over the currently used
cameras. Useful advancements might include: improved camera synchronisation
capability and other data interface options. At the present time there does not

Epibenthic Scattering Project: Design of field operation gear and project summary
7
appear to be anything on the market which provides useful advancements in
those areas above the existing cameras.
Data processing
BioSonics sell several software products for post-processing of data collected
using the DT-X system. These include:
1. Data playback with simple analysis functions (Visual Analyser)
2. Seabed classification (Visual Bottom Typing), and
3. Submerged aquatic vegetation detection and analysis (EcoSAV)
All three of these products are potentially useful for coastal water habitat
mapping, although items 2 and 3 have been developed for bottom types and
species found in North American waters, and their effectiveness in Australian
conditions needs to be evaluated.
In addition, it is envisaged that special-purpose algorithms developed using the
research system would be used to analyse raw survey data.
Costing
A detailed costing of the BioSonics DT-X system for various combinations of
frequencies is shown in Table 2.
The current (February 2006) hardware cost for the full research system is:
BioSonics DT-X with three transducers $88 728
Stereoscopic camera pair and housings $10 000
Laser and housing $5 000
Strobe $1 500
Frame system $3 000
Underwater cables and connectors $3 000
Umbilical (use existing) n/a
Miscellaneous $3 000
TOTAL $114 228
Epibenthic Scattering Project: Design of field operation gear and project summary
8
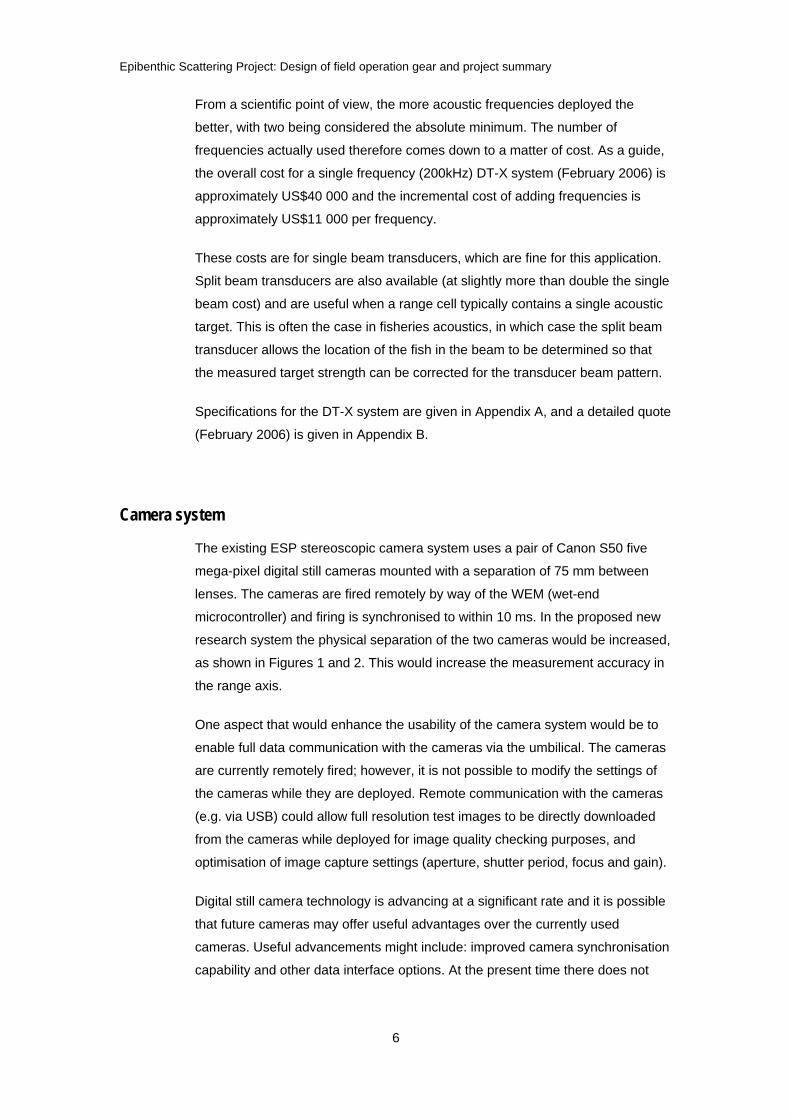
The current (February 2006) hardware cost for the full survey system is:
BioSonics DT-X with two transducers $77 189
Transducer mounting costs $5 000
Differential GPS sensor $2 500
TOTAL $84 689
Table 2. Acoustic system detailed costing
Costing for Biosonics acoustic system(120, 200 and 420 kHz)Based on 28/2/06 quote
Assumed exchange rate (May 2006) 1.35
3 Frequencies (200, 420, 120) 2 Frequencies (200, 120) 1 Frequency (200)Item US$ A$ US$ A$ US$ A$Hardware costsDT-X surface unit with acquisition software $16,200 $21,870 $16,200 $21,870 $16,200 $21,870200 kHz single beam transducer $8,544 $11,534 $8,544 $11,534 $8,544 $11,534Integrated orientation sensor for 200kHz transducer $3,600 $4,860 $3,600 $4,860 $3,600 $4,860420 kHz single beam transducer $8,544 $11,534 $0 $0120 kHz single beam transducer $9,744 $13,154 $9,744 $13,154 $03 transducer multiplexing cable $2,880 $3,888 $2,880 $3,888 $0Toughbook computer $4,700 $6,345 $4,700 $6,345 $4,700 $6,345Deck cable $1,922 $2,595 $1,922 $2,595 $1,922 $2,5953 x calibration spheres (required for absolute target strength measurements) $1,187 $1,602 $1,187 $1,602 $1,187 $1,602
Total hardware $57,321 $77,383 $48,777 $65,849 $36,153 $48,807
SoftwareVisual Analyser $3,600 $4,860 $3,600 $4,860 $3,600 $4,860VBT seabed classification $3,600 $4,860 $3,600 $4,860 $3,600 $4,860EcoSAV acquatic plant detection/analysis $3,600 $4,860 $3,600 $4,860 $3,600 $4,860Less three-pack software discount -$2,400 -$3,240 -$2,400 -$3,240 -$2,400 -$3,240
Total software $8,400 $11,340 $8,400 $11,340 $8,400 $11,340
Total hardware plus software $65,721 $88,723 $57,177 $77,189 $44,553 $60,147
Note: Does not include differential GPS receiver

Epibenthic Scattering Project: Design of field operation gear and project summary
9
System capabilities and limitations
The field system used during the ESP had some limitations which did have an
impact on the data collected during the field deployments. With regard to TAPS
(the Towed Acoustic Projector System), it has a fixed burst length and a
relatively low sampling rate that limited its resolution in the range direction to
12.5 cm at all frequencies. TAPS also had insufficient dynamic range, which led
to the seabed return saturating the receivers. Temporal synchronisation of the
data received was also limited, mainly by the fact that TAPS samples and
transmits its six acoustic frequencies sequentially. The range resolution of the
stereoscopic digital still camera system was also limited by a relatively small
camera separation.
The new proposed acoustic system has a digitising rate of 41.6 kHz—which is
equivalent to a sample every 1.8 cm, all frequencies, a minimum burst length of
100 microseconds—which means that at any one time returns are being
received from a 7.5 cm range window (same as EQ60 200 kHz), and an
analogue dynamic range of 160 dB. Unfortunately this system does not offer
simultaneous sampling. The availability of multiple acoustic frequencies is
believed to be essential in developing a sensory package which has the best
chance of resolving useful habitat coverage information. The increased
separation of the stereoscopic camera system would provide improved
photogrammetry range resolution.
The proposed new system configuration (Figures 1 and 2) would allow easier
field deployment and be less affected by sensor ring-down but would be subject
to more movement between the acoustic and optical systems, which will
introduce an extra step during data processing (using the laser spot).
Epibenthic Scattering Project: Design of field operation gear and project summary
10
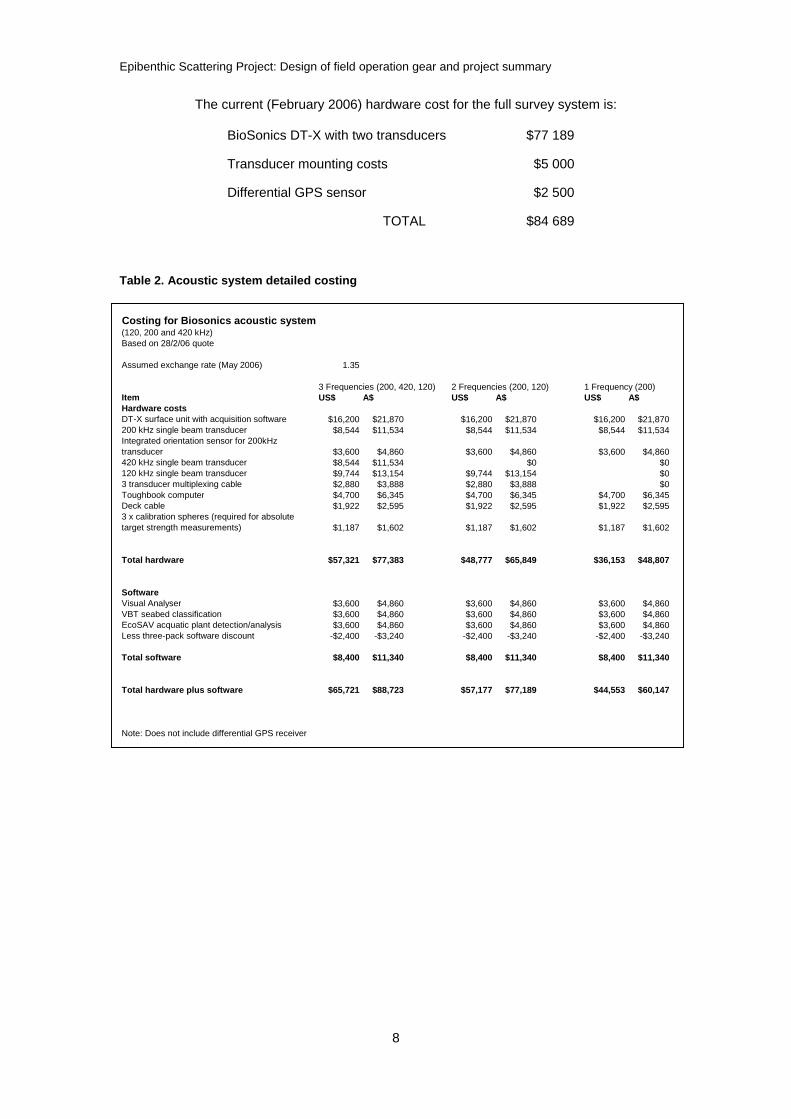
3. Epibenthic Scattering Project summary A great deal of high quality data was collected during the ESP, representing a
unique collection of acoustic measurements with spatially and temporally
synchronised stereo photographs. This chapter summarises the data collected,
data processing performed, Matlab code developed and results. Reports of the
three field deployments conducted (CA3.05, CA5.04 and CA5.04 extension) and
the toolkit report (CA6.03) are also useful references for this chapter.
Data collected
The data collected from the three field trials is located in the following directory
structure locations:
S:\CMST\Projects\350-399\369 CRC Coastal\ESP\FieldTrip 2004-08-10\
S:\CMST\Projects\350-399\369 CRC Coastal\ESP\Fieldtrip 2005-06-01\
S:\CMST\Projects\350-399\369 CRC Coastal\ESP\FieldTrip 2005-10-26\
Once the data is archived, the directory structure before ‘ESP’ may not be
retained.
As of 24 May 2006, the data in the ESP directory totals 14.0 GB in size. There
may be some duplication of data in the ESP subdirectories and therefore once
the final archive is made, the amount of data may be somewhat smaller than
this. The bulk of this data is images from the underwater stereoscopic digital still
camera.
The data collected during each of the field deployments consists of temporally
and spatially synchronised data from EQ60 single beam echosounder (two
frequencies), TAPS (five frequencies), stereoscopic cameras (two images per
stereo-pair), differential GPS, tilt sensor (three axis accelerometer), and WEM
(Wireless Ethernet Module—system status, etc). The data from all of these
sensors is in separate subdirectories (except TAPS, WEM, GPS and tilt which
are grouped). A subdirectory titled ‘WEMandTAPS’ also exists which contains
the raw data for WEM and TAPS converted to Matlab format. In the case of the
camera images, the images from the left and right cameras are stored in
separate subdirectories—‘camera1’ and ‘camera2’ respectively. Once the data
has been synchronised (which has been conducted for all three lots of field
data), the Matlab program ‘plotesp*.m’ is used to extract and display all the data
corresponding to particular time steps. This program is described in the section
on Matlab code below. The location and amount of pre-processed data is shown
in Table 3.

Epibenthic Scattering Project: Design of field operation gear and project summary
11
Table 3. Amount and location (under the respective field data directory) of pre-processed field deployment data
Deployment date
EQ60 WEM, TAPS & GPS Cameras
2004-08-10 632 MB ‘ESP\FieldTrip 2004-08-10\eq60\exported_files’
78.7 MB ‘ESP\FieldTrip 2004-08-10\WEMandTAPS’
2.28 GB ‘ESP\FieldTrip 2004-08-10\uw3dimages_reorganised’
2005-06-01 506 MB ‘ESP\Fieldtrip 2005-06-01\eq60-exported_sv_with_tvg_correction’
57.4 MB ‘ESP\Fieldtrip 2005-06-01\WEMandTAPS’
1.84 GB ‘ESP\Fieldtrip 2005-06-01\000\2005_06_01\Indexed-images’
2005-10-26 578 MB ‘ESP\FieldTrip 2005-10-26\eq60-exported_sv_with_tvg_correction’
102 MB ‘ESP\FieldTrip 2005-10-26\WEMandTAPS’
GB ‘ESP\FieldTrip 2005-10-26\Indexed-images’
In some instances the stereoscopic camera images on the master archive
(server) are modified from the original versions. If the original images are
needed, they are available from the ESP field deployment raw data archive
DVDs (one for each field deployment) of which one copy was provided to the
Coastal CRC and another copy is kept by Curtin Centre for Marine Science and
Technology (CMST).
Habitats sampled
Table 4 below (per CA6.03) provides a summary of the seabed habitats sampled
during the three field deployments.
Examples of three of the habitats sampled are shown in Figures 3–5. There is
incredible variability in the sampled habitats which cannot be completely
summarised by three photographs. Please refer to the photographs referenced
above for more information.

Epibenthic Scattering Project: Design of field operation gear and project summary
12
Table 4. GPS coordinates and habitat types for all field deployment locations
Field deployment
Site number
Time Latitude Longitude Seabed habitat description
Site1 11:30 32º 08.252’ S 115º 44.406’ E Seagrass and sand
Site 2 12:45 32º 08.251’ S 115º 44.414’ E Seagrass and sand
First: 10 August 2004
Site 3 14:15 32º 09.263’ S 115º 45.079’ E Reef and algae
Site 1 11:35 32º 07.226’ S 115º 45.032’ E Patches of seagrass and patches of rubble
Site 2 12:00 32º 07.132’ S 115º 45.220’ E Patches of seagrass and patches of rubble
Site 3 12:50 32º 06.323’ S 115º 44.215’ E Uniform seagrass coverage
Site 4 14:30 32º 07.649’ S 115º 39.830’ E Large algae on rocky seabed
Second: 1 June 2005
Site 5 16:00 32º 09.064’ S 115º 45.830’ E Muddy seabed
Third: 26 October 2005
Site 1 08:30 32º 06.323’ S 115º 44.215’ E Seagrass and sand
Figure 3. Example stereoscopic image of sea grass habitat in Cockburn Sound

Epibenthic Scattering Project: Design of field operation gear and project summary
13
Figure 4. Example stereoscopic image of reef habitat in Cockburn Sound
Figure 5. Example stereoscopic image of bare sand habitat in Cockburn Sound

Epibenthic Scattering Project: Design of field operation gear and project summary
14
Data processing and analysis method
Processing and analysis of the acoustic and video data collected in the ESP
were carried out using a library of routines written in Matlab. The Matlab routines
execute the following operations:
1. Synchronisation of video and acoustic data. The firing of the EQ60 and
TAPS sonars and the underwater stereo camera were synchronised in time by
the system controller. However, several different clocks are used to time-stamp
data from different data sources, all of the system components were not always
active, and the trigger rate of the sonar was sometimes set higher than the
trigger rate of the stereo camera. Therefore, to associate photographs of the
seafloor taken by the camera with the acoustic backscatter pulses, a set of
Matlab functions were written which retrieved timing of different system
components and searched for the most logical fit of timing data.
2. Classification of seafloor habitats. The Matlab function ‘Pre_Classification’
displays stereo pairs of the seafloor images accompanied with sonar data to
allow the seafloor type (habitat type) to be visually classified. Each image pair
of the seafloor was manually classified by a 2-digit classification number
corresponding to the seafloor type. A number of basic types of seafloor cover
were defined, which were sand, seagrass, reef rock and algae. The first digit in
the classification number corresponds to the seafloor type that dominates within
the area insonified by the sonars. The second digit characterises various
mixtures of different habitats. It is set at zero if the seafloor type is uniform within
the observed area.
Other numbers indicate the presence of other seafloor types according to a
cross-reference table associating different 2-component mixtures with a certain
number. For example, if the seafloor cover consisted of pure sand, the
classification number would be ‘10’. If patches of seagrass were observed on
sand within a minor area of the sonar footprint, the classification number would
be ‘12’.
As a result of classification, the acoustic backscatter pulses were associated with
the habitat type through the classification number for further processing and
correlation analysis. The classification scheme used for the processing of data
from each of the three field-deployments is summarised in Appendix 3 of
Epibenthic Scattering Project (ESP): Report on experimental deployments and
outcomes for toolkit (CRC Report CA6.03, part 2).

Epibenthic Scattering Project: Design of field operation gear and project summary
15
3. Calculation of backscatter characteristics. The output backscatter data
from the single-beam sonar systems is represented in the units of the volume
backscatter coefficient. This is because these acoustic systems are primarily
used to estimate the target strength of biological objects such as zooplankton,
fish schools or individual fish in the water column. The Matlab routines
‘Process_EQ60_data’ and ‘Process_TAPS_data’ convert the volume backscatter
coefficient into the surface backscatter coefficient using the power and gain
settings of the system, and the estimates of transmission loss (spreading and
absorption) and the insonified area, according to the formula:
( ) ARPRRPS rtA20
4 2exp α=
where Pt is power of the transmitted signal at the reference range R0, Pr is the
power of the received signal, R is the distance from the sonar head to the
seafloor surface, α is the absorption coefficient, and A is the insonified area of
the seafloor.
The first backscatter return from the substrate is localised in the full-length
backscatter signals represented in the units of the surface backscatter
coefficient. The front of the bottom backscatter pulse is determined at the time
when the steepness of the backscatter signal exceeds a predefined threshold.
The tail of the first backscatter return is limited to the moment when the
backscatter level decreases by 40 dB relative to the peak level. Then a number
of different backscatter characteristics are calculated from the signal pulse form
of the bottom return. Among those characteristics, the principal ones are:
1) Peak level: ( ){ }iSSP max= ,
2) Backscatter energy: ( )∑∂=i
AE iSTS 2 , and
3) Effective pulse width: ( ) ( ) ( )∑∑ ⋅−∂=i
AAi
c iSiSiiTI 2 ,
Where i is the sample number of SA, T∂ is the sampling interval, and ic is the
sample number of the mass centre of the backscatter pulse, which is defined as:
( ) ( )
⋅= ∑∑i
Ai
Ac iSiSii int
In addition to those three major characteristics, other statistical characteristics of
the backscatter pulses were calculated, such as the standard deviation,
skewness, kurtosis and some others. As a result, for each habitat type
characterised by the classification number, a set of backscatter characteristics is
.

Epibenthic Scattering Project: Design of field operation gear and project summary
16
created to examine the robustness of each backscatter characteristic and their
combination with respect to acoustic discrimination of different seafloor habitats.
4. Analysis of correlation between backscatter characteristics and habitat types. A set of Matlab programs has been developed to implement different
approaches to segmentation of acoustic backscatter characteristics in order to
distinguish different habitats acoustically observed on the seafloor. The most
straightforward method of acoustic classification using correlation between each
specific backscatter characteristic with the habitat types was first examined in
order to determine the backscatter characteristics which were most robust with
respect to distinguishing different habitat types.
More sophisticated methods of classification implemented in Matlab programs
involve multi-parameter acoustic data clustering based on different techniques,
such as K-means and genetic programming. Before applying the clustering
procedure, the sensitivity of backscatter characteristics to seafloor types and
their interdependence is examined using a principal component analysis that
allows us to establish combinations of backscatter characteristics which form
more isolated clusters in a multivariable space. After applying one of the
clustering procedures to the backscatter characteristics, the results of acoustic
seafloor segmentation are compared with the visual classification data. The
percentage of misclassification by using acoustic segmentation is calculated for
each class of habitats.

Epibenthic Scattering Project: Design of field operation gear and project summary
17
Matlab code and routines
A range of software written in Matlab was developed for the ESP. The main
routines are summarised in Table 5. It should be noted that in some instances
the code makes use of a common Matlab library developed in-house by Curtin
CMST.
Table 5. Main Matlab routines used in ESP data processing
Matlab routine name Description
‘PlotESP’ Extracts and displays all the data corresponding to a particular time step.
‘Pre_Classification’ Displays stereo pairs of the seafloor images accompanied with sonar data to allow the seafloor type (habitat type) to be visually classified.
‘Process_EQ60_data’ Converts the volume backscatter coefficient data from the EQ60 into the surface backscatter coefficient using the power and gain settings of the system, and the estimates of transmission loss (spreading and absorption) and the insonified area. Calculates various statistical characteristics of backscattered signals.
‘Process_TAPS_data’ Converts the volume backscatter coefficient data from the TAPS into the surface backscatter coefficient using the power and gain settings of the system, and the estimates of transmission loss (spreading and absorption) and the insonified area.
Photo_Distance.m Estimates height of objects (seagrass canopy, rocks, etc.) on the seafloor using a photogrammetry technique.
Results
The most significant results of processing and analysis of the ESP data have
been demonstrated in the previous milestone reports (see reference listing—
in particular Epibenthic Scattering Project (ESP): Report on experimental
deployments and outcomes for toolkit, CRC Report CA6.03, part 2). It is
important to note that the simplest method of 1-D segmentation of backscatter
data by a single characteristic that is most robust with respect to discrimination of
habitats provides acceptable results for certain habitat classes. In particular,
classification of the seafloor by the effective pulse width of acoustic backscatter
is capable of distinguishing sand and seagrass with a high level of likelihood, up
to 90% of true classification (see Figure 6).
Adding more backscatter characteristics for multivariate clustering did not
significantly improve the discrimination ability of backscatter analysis for these
types of habitats. However, if different habitats such as reef rock with or without

Epibenthic Scattering Project: Design of field operation gear and project summary
18
an algae cover appear in the areas surveyed acoustically, the single parameter
approach cannot provide reliable discrimination results. Segmentation of
backscatter characteristics in a multivariate space slightly improves the
discrimination capability of backscatter analysis, but the improvement is yet
insufficient for robust acoustic classification of the seafloor (see Figure 7).
0 0.5 1 1.5 2 2.5 x 10 -3 0
10
20
30
40
50
60
Effective pulse width, s Figure 6. Histogram of the effective pulse width measured at 200 kHz over the seafloor areas covered by sand (red) and seagrass (green). Brown columns are an overlap of red and green
data
-3 -2 -1 0 1 2 3 4 5 6-4
-3
-2
-1
0
1
2
3
4
Principal Component 2
Prin
cipa
l Com
pone
nt 1
Distribution of backscatter data in the two-PC space
AlgaeReefSandSeagrass P. AustralisSeagrass P. Sinuosa
-3 -2 -1 0 1 2 3 4 5 6-4
-3
-2
-1
0
1
2
3
4
Principal Component 2
Prin
cipa
l Com
pone
nt 1
Distribution of backscatter data in the two-PC space
AlgaeReefSandSeagrass P. AustralisSeagrass P. Sinuosa
Figure 7. Distribution of 5 classes against first two principal components of PCA

Epibenthic Scattering Project: Design of field operation gear and project summary
19
Developed intellectual property
Intellectual property developed during the ESP includes:
• Electronic and software design of the sub-sea ESP field deployment
system including the method of synchronising all system components
via the wet-end microcontroller—as outlined in Epibenthic Scattering
Project (ESP): Experimental design report (Coastal CRC Milestone
Report CA2.03).
• The top-end PC-based ESP system software ‘ESPañolito’—as
outlined in Epibenthic Scattering Project (ESP): System design report
(Coastal CRC Milestone Report CA6.05).
• Method of synchronising the two consumer digital still cameras to
an accuracy of 10 ms for the purpose of taking stereoscopic
photographs.
• Matlab code and programs developed for the purpose of processing
the ESP data – as outlined in the earlier section on Matlab codes.

Epibenthic Scattering Project: Design of field operation gear and project summary
20
4. Future work Future work falls into two categories: (i) further processing of the existing data
set; and (ii) expansion of the project, as described in section 2 of this report and
in Coastal CRC Milestone Report CA6.05.
Further processing of existing data
The PhD thesis work of Mr Y.-T. Tseng continues past the official closure of the
Coastal Zone CRC. His work will be reported in the PhD thesis listed in the
references and possibly in other publications.
Processing of ESP data to date has focussed on the development of improved
classification techniques, but there are many other possible uses for the data.
In particular, the original ESP objectives included the development of methods
to extract biologically significant parameters such as seagrass canopy height,
biomass, and transpiration rate from acoustic data. The feasibility of extracting
this information from the data set has not been fully explored to date, and this is
recommended to be the focus of further work on the existing data. Such a study
would be of suitable duration and complexity to be accomplished through a PhD
project.
Funding options
Several funding options are being actively explored to fund the continuation of
the ESP work.
A research proposal has been submitted to the Australian Institute of Marine
Science that coordinates planning of the Ningaloo Research Program to be
implemented in 2006–2010 for the Office of Science and Innovation of the
Western Australian Department of the Premier and Cabinet. The proposed
project titled ‘Application of acoustic methods to habitat mapping and biodiversity
assessment’ aims at acoustic characterisation and mapping of seafloor habitats
off the fringing reef in the Ningaloo marine park using bathymetry and
backscatter data from multi- and single-beam sonar surveys. The techniques
planned to employ are based on the methods developed within the Coastal
Water Habitat Mapping project of the Coastal CRC, including those examined

Epibenthic Scattering Project: Design of field operation gear and project summary
21
in the ESP. The project cost proposed is $364 000 of which $60 000 was
allocated for acoustic work.
The decision on the overall research plan of the Ningaloo project and final
selection of the particular projects to be implemented within the program have
not made yet, but seafloor mapping with a single-beam sonar has already been
conducted in the first complex survey in April 2006 and the first set of acoustic
backscatter data from the Ningaloo marine park has been collected. It is most
likely that the proposed acoustic project will be included, either entirely or partly,
in the complete Ningaloo research, and acoustic surveys will be continued in the
next stages of the this program.
Several other funding options may be available to CMST for purchasing
hardware, such as the BioSonics system, which may be of use across several
projects. Two examples of such projects include the monitoring of krill in the
Perth Canyon and a future WA Fisheries / Fisheries Research and Development
Corporation project studying bight-redfish, a deep-water commercial fish species
found off southern Western Australia. While these programs on their own would
not provide sufficient funds for the specific project hardware discussed here, they
would contribute to the pool of funds available for hardware purchases. The ESP
work does not require dedicated access to a sounder system hence a collective
purchase would reduce the funds needed to continue the project work.

Epibenthic Scattering Project: Design of field operation gear and project summary
22
5. Conclusion The Coastal CRC Epibenthic Scattering Project has collected a unique data
set in which the acoustic data are fully ground-truthed by high-resolution
stereoscopic image pairs. The project has revealed some important results with
respect to acoustic discrimination of seagrass from sand in areas of Cockburn
Sound, Western Australia. The feasibility of extracting biologically significant
parameters (such as seagrass canopy height and biomass) from the data set
has not been fully explored to date, and this is recommended to be the focus of
further work on the existing data.
Budget considerations in the design of the original ESP system dictated the use
of two existing acoustic systems, essentially unmodified, which resulted in
significant limitations to the fidelity of the acoustic data. The proposed new
research system would overcome many of the limitations of the original design
and allow a significantly improved dataset to be collected.
There are several options for funding the continuation of the project which are
currently being actively explored.
Epibenthic Scattering Project: Design of field operation gear and project summary
23
6. References Milestone reports
CA2.03: Woods, A.J., Duncan, A.J., Tseng, Y.-T. & Perry, M.A. (2004)
Epibenthic Scattering Project (ESP): Experimental design report. Milestone
Report CA2.03, Cooperative Research Centre for Coastal Zone, Estuary
and Waterway Management, Brisbane.
CA3.05: Woods, A.J., Duncan, A.J., Tseng, Y.-T., McCauley, R.D. &
Gavrilov A.N. (2004) Epibenthic Scattering Project (ESP): Report of first field
deployment. Milestone Report CA3.05, Cooperative Research Centre for
Coastal Zone, Estuary and Waterway Management, Brisbane.
CA4.03: Gavrilov, A.N., Woods, A.J., Duncan, A.J., Tseng, Y.-T., Perry, M.A. &
McCauley, R.D. (2005) Epibenthic Scattering Project (ESP): Data analysis
from first ESP field deployment and recommendations. Milestone Report
CA4.03, Cooperative Research Centre for Coastal Zone, Estuary and
Waterway Management, Brisbane.
CA5.04: Duncan, A.J., Woods, A.J., Tseng, Y.-T., Perry, M.A., McCauley, R.D. &
Gavrilov, A.N. (2005) Epibenthic Scattering Project (ESP): Report of second
field deployment. Milestone Report CA5.04, Cooperative Research Centre
for Coastal Zone, Estuary and Waterway Management, Brisbane.
CA5.04 extension: Woods, A.J., Duncan, A.J., Tseng, Y.-T. & Gavrilov, A.N.
(2005) Epibenthic Scattering Project (ESP): Report of third field trial.
Milestone Report CA5.04 extension, Cooperative Research Centre for
Coastal Zone, Estuary and Waterway Management, Brisbane.
CA6.03: Woods, A.J., Duncan, A.J., Tseng, Y.-T. & Gavrilov, A.N. (2005)
Epibenthic Scattering Project (ESP): Report on experimental deployments
and outcomes for toolkit. Milestone Report CA6.03, Cooperative Research
Centre for Coastal Zone, Estuary and Waterway Management, Brisbane.
CA6.05: Duncan, A.J., Woods, A.J., Tseng, Y.-T. & Gavrilov, A.N. (2005)
Epibenthic Scattering Project (ESP): System design report. Milestone Report
CA6.05, Cooperative Research Centre for Coastal Zone, Estuary and
Waterway Management, Brisbane.

Epibenthic Scattering Project: Design of field operation gear and project summary
24
Conference papers
Gavrilov, A.N., Duncan, A.J., McCauley, R.D., Parnum, I.M., Penrose, J.D.,
Siwabessy, P.J.W., Woods, A.J. & Tseng, Y-T. (2005) Characterization of the
seafloor in Australia’s coastal zone using acoustic techniques. Proceedings of
Underwater Acoustic Measurements Conference, Heraklion, Crete,
Greece, 28 June – 1 July 2005.
Tseng, Y.-T., Gavrilov, A.N. & Duncan A.J. (2005) Classification of acoustic
backscatter from marine macro-benthos. Proceedings of Boundary
Influences in High Frequency, Shallow-water Acoustics Conference,
University of Bath, UK, 5–9 September 2005.
Tseng, Y.-T., Gavrilov, A.N., Duncan, A.J., Harwerth, M. & Silva, S. (2005)
Implementation of genetic programming toward the improvement of acoustic
classification performance for different seafloor habitats. Proceedings of
IEEE Oceans ’05 conference. Washington DC, 18–23 September 2005.
Tseng, Y.-T., (2005) Settings of genetic programming toward the improvement of
acoustic classification performance for different seafloor conditions.
Proceedings of Underwater Acoustic Measurements Conference,
Heraklion, Crete, Greece, 28 June – 1 July 2005.
Theses
Tseng, Y.-T. (in development) Investigation of the acoustic backscatter
characteristics of marine macro-benthos. PhD thesis, Curtin University of
Technology.

Epibenthic Scattering Project: Design of field operation gear and project summary
25
Appendix A: Specification for BioSonics DT-X digital scientific echosounder

Epibenthic Scattering Project: Design of field operation gear and project summary
26

Epibenthic Scattering Project: Design of field operation gear and project summary
27
Appendix B: Quotation for BioSonics DT-X system

Epibenthic Scattering Project: Design of field operation gear and project summary
28

Epibenthic Scattering Project: Design of field operation gear and project summary
29
Appendix C: Post-processing software available from BioSonics
Epibenthic Scattering Project: Design of field operation gear and project summary
30

Epibenthic Scattering Project: Design of field operation gear and project summary
31